Pre-market review tracks ETF movers, bullish ES and NQ futures, mixed global index setups, and oil, yields and Middle East risks shaping sentiment.
Fundamentals: U.S. index futures moved modestly higher as softer oil prices and easing bond yields supported risk sentiment. Brent remained above $100 per barrel despite recovering Gulf exports and emergency stockpile releases. Long-dated Treasury yields stayed near multidecade highs, with the 10-year near 5.27%, while Middle East shipping and infrastructure risks continued to pressure fuel and inflation concerns.
Technicals: Tesla, Nvidia and Meta led prior-session ETF-related gains, while USO, TLT and Apple declined. ES and NQ futures retain bullish short-, intermediate- and long-term technical ratings, with prices near pivot resistance after V-shaped recoveries. YM, EMD, RTY and FDAX show mixed conditions, combining broader bullish structures with active short-term pullbacks or rebounds.
Pre-Market Trading 360° view Market Radar of: holidays, earnings, eco-news, market-news summary, news sentiment, prior session major ETFs, MAG7, Higher Time Frame Analysis Indices Futures Summary, and E-mini S&P500, Nasdaq 100, NYMEX Crude, Gold Futures Daily Chart analysis.
As of: October 6, 2026 07:16 CT
EcoNews Radar U.S. Events
| Day | Time | Impact | Event |
|---|---|---|---|
| Wed | 10:30 | Low | Crude Oil Inventories |
| Wed | 14:00 | High | FOMC Meeting Minutes |
| Thu | 08:30 | Medium | Unemployment Claims |
| Fri | 10:00 | Medium | Prelim UoM Consumer Sentiment |
| Fri | 10:00 | Medium | Prelim UoM Inflation Expectations |
EcoNews Summary
The week’s listed high-impact event is the release of FOMC Meeting Minutes on Wednesday afternoon. The minutes provide detail on Federal Reserve policy discussions, inflation assessments, economic conditions, and the reasoning behind prior rate decisions. Index futures often react to shifts in perceived policy direction and financial-condition commentary.
Event Notes:
- Wednesday 14:00 FOMC Meeting Minutes: A detailed record of the Federal Reserve’s prior policy meeting, covering participant discussions on interest rates, inflation, growth, employment, and balance-sheet policy. Traders monitor the language for changes in the policy outlook and risk assessment.
Conclusion:
The single most important event is Wednesday’s 14:00 FOMC Meeting Minutes. Market momentum and volume often slow ahead of major FOMC-related events, with increased volatility at release time.
For full details visit: Forex Factory EcoNews
Market News Summary:
Index futures were slightly higher early Tuesday as softer oil and easing yields supported sentiment, while elevated long-end rates and Middle East risks remained key cross-currents.
Primary Drivers & Risks:
- Primary Driver: Softer oil and easing yields
- Primary Risk: Elevated Treasury yields and conflict
Tone:
Cautiously constructive, with persistent rate and geopolitical pressure.
Stock Market / ETFs / Indices:
U.S. stock futures trended slightly higher, while Asian equities and the FTSE 100 advanced as energy-cost and bond-market concerns eased. Stocks remained resilient near record highs, though market breadth was narrow and implied volatility moved higher. Energy and technology were the only S&P 500 sectors outperforming the index year to date.
Geopolitical:
Middle East conflict remained a central risk as attacks targeted Saudi infrastructure and regional shipping. Iranian oil exports fell to zero under a U.S. blockade, while incidents around Hormuz and tensions in the Red Sea continued.
Oil / Energy:
Oil prices slipped or held little changed as Middle Eastern crude exports recovered toward pre-war levels and the G7 released emergency stockpiles. Brent remained above $100 per barrel, while tighter diesel and refined-fuel supplies kept fuel costs elevated. The U.S. expanded access to tax-exempt dyed diesel for broader highway use after the national diesel average exceeded $6 per gallon in September.
Gold / Metals:
Gold remained subdued near $4,100 as elevated bond yields offset reduced rate-hike expectations. Gold bounced as long-term yields eased, but the 10-year yield near 5.27% continued to pressure the metal; silver held near $59.96 amid investment demand.
Fed / Financials:
Long-dated Treasury yields remained near multidecade highs amid fiscal, inflation, and debt-sustainability concerns. Treasury auctions were in focus after a broader bond selloff, although easing gilt yields helped lift UK financial and consumer-staples shares. Corporate bond volatility rose sharply from recent lows.
Macro / Other:
Cooler core inflation and weak job growth temporarily moderated rate concerns, but yields continued to dominate cross-asset pricing. Third-quarter earnings season began amid heightened scrutiny of AI-related technology valuations and chip competition.
Conclusion:
Softer crude prices and a partial easing in bond yields supported early equity sentiment. Recovering Gulf exports and emergency inventories reduced immediate crude-supply concerns.
High long-end Treasury yields, upcoming auctions, and rising credit volatility remained constraints on equity risk appetite. Middle East shipping and infrastructure threats kept diesel, refined-fuel, and broader inflation risks elevated.
Market News Sentiment
Market News Articles: 36
- Neutral: 55.56%
- Positive: 27.78%
- Negative: 16.67%
Sentiment Summary: Among 36 market news articles, 56% were neutral, 28% positive, and 17% negative, indicating predominantly neutral coverage with a positive skew over negative items.
Conclusion: Indices futures day traders face a broadly balanced news tone, with positive articles exceeding negative coverage.
GLD,Gold Articles: 9
- Neutral: 66.67%
- Positive: 22.22%
- Negative: 11.11%
Sentiment Summary: GLD/Gold coverage is predominantly neutral (67%), with positive sentiment (22%) exceeding negative sentiment (11%).
Conclusion: Gold-related news flow is largely balanced, with a modest positive skew and limited negative coverage.
USO,Oil Articles: 13
- Neutral: 61.54%
- Negative: 23.08%
- Positive: 15.38%
Sentiment Summary: USO/oil coverage is predominantly neutral (62%), with negative sentiment (23%) exceeding positive sentiment (15%).
Conclusion: For indices futures day traders, oil-related news tone is broadly neutral, with a modest negative skew.
Market Data Snapshot
ETF Snapshot of major stock market ETFs, Mag7, and others as of: October 6, 2026 07:16
Top Movers & Losers
- TSLA 378.73 Bullish 2.20% ▲
- NVDA 238.90 Bullish 2.12% ▲
- META 741.90 Bullish 1.90% ▲
- AAPL 332.89 Bearish -0.24% ▼
- TLT 77.11 Bearish -0.48% ▼
- USO 143.99 Bearish -2.29% ▼
Major Index ETFs: SPY, QQQ, DIA, IWM, IJH
- QQQ 756.20 Bullish 0.88% ▲
- SPY 774.83 Bullish 0.67% ▲
- IWM 283.38 Bullish 0.66% ▲
- IJH 73.68 Bullish 0.40% ▲
- DIA 512.11 Bullish 0.20% ▲
Major index ETFs are Bullish across the group: QQQ is the most bullish mover at +0.88%, followed by SPY at +0.67% and IWM at +0.66%. IJH gained +0.40%, while DIA is the least positive mover at +0.20%.
Mag 7 Stocks: AAPL, MSFT, GOOG, AMZN, META, NVDA, TSLA
- TSLA 378.73 Bullish 2.20% ▲
- NVDA 238.90 Bullish 2.12% ▲
- META 741.90 Bullish 1.90% ▲
- MSFT 525.18 Bullish 1.48% ▲
- GOOG 343.83 Bullish 1.02% ▲
- AMZN 251.40 Bearish -0.05% ▼
- AAPL 332.89 Bearish -0.24% ▼
Mixed: TSLA is the most bullish mover at +2.20%, followed by NVDA at +2.12% and META at +1.90%. MSFT and GOOG are Bullish at +1.48% and +1.02%. AAPL is the most bearish mover at -0.24%, while AMZN is marginally Bearish at -0.05%.
Cross-Market ETFs: TLT, GLD, USO, IBIT
- IBIT 48.56 Bullish 1.74% ▲
- GLD 379.55 Bearish -0.16% ▼
- TLT 77.11 Bearish -0.48% ▼
- USO 143.99 Bearish -2.29% ▼
Cross-market conditions are Mixed: IBIT is the most bullish mover at +1.74%, while USO is the most bearish mover at -2.29%. TLT is Bearish at -0.48%, and GLD is marginally Bearish at -0.16%.
ETF, Mag7, and Cross-Market ETF Insights
Overall Tone
Mixed, with Bullish equity ETFs and most Mag7 names offset by Bearish bonds, gold, and oil.
Equity ETFs and Mag7:
Major Index ETFs were broadly Bullish: QQQ led at +0.88%, followed by SPY at +0.67%, IWM at +0.66%, IJH at +0.40%, and DIA at +0.20%. Mag7 leadership was Bullish and concentrated in TSLA, the most bullish mover at +2.20%, followed by NVDA at +2.12% and META at +1.90%; AAPL was Bearish at -0.24%, while AMZN was marginally Bearish at -0.05%. Equities were broadly Bullish, though Mag7 performance was selective.
Cross-Market ETFs:
Cross-market action was Mixed: IBIT was Bullish at +1.74%, while GLD was marginally Bearish at -0.16% and TLT was Bearish at -0.48%. USO was the most bearish mover at -2.29%, creating clear Bearish commodity divergence against Bullish equity ETFs and IBIT.
Futures Indices – Higher Time Frame Analysis
Summary of the current state of US Indices Futures based on higher time-frame (HTF) technical analysis as of: 2026-10-06: 07:16 CT.
US Indices Futures
- ES YSFG/MSFG/WSFG rising, above all benchmarks, UTrend pivots; resistance 7858.25/7906.25, support 7702.25/7672.75, weekly pivot-next 7573.25.
- NQ YSFG/MSFG/WSFG rising, above all benchmarks, UTrend pivots; resistance 31539.25-31585.75, reversal 30592.25, weekly support 29264.75/27500.75.
- YM MSFG/YSFG rising, above 55/100/200-week benchmarks; short-term DTrend, support 50859, reversal 53245, resistance 55316.
- EMD YSFG/MSFG rising, weekly DTrend below 5/10/20-week benchmarks; daily rebound, support 3600.3/3639.3, resistance 3725.1/3825.3/3969.6.
- RTY YSFG/MSFG rising, above 55/100/200-week benchmarks; weekly DTrend, daily mixed, support 2791.5, resistance 2931.2/3005.2/3101.8.
- FDAX YSFG/MSFG rising, above long-term benchmarks; weekly DTrend, daily UTrend rebound, support 24897/24978, resistance 25868-25990/26847.
Overall State
- Short-Term: Neutral
- Intermediate-Term: Bullish
- Long-Term: Bullish
Conclusion
ES and NQ retain aligned YSFG, MSFG, WSFG, benchmark, and pivot UTrend structure near overhead pivot resistance. YM, EMD, RTY, and FDAX remain intermediate- and long-term bullish on rising monthly/yearly grids and longer benchmarks, while weekly short-term pivot trends are corrective. Daily rebounds in EMD, RTY, and FDAX contrast with their weaker intermediate swing structures. ES and NQ lead the higher-time-frame advance; broader index correlation remains mixed during corrective retracements.
Note: Intra-day counter-trend pullbacks or retracements may occur, HTF is context for informational usage and market structure. Glossary: Session Fib Grids periods of YSFG:’Yearly’, MSFG:’Monthly’, WSFG:’Weekly’
For full details visit: AlphaWebTrader Technicals
ES Daily View
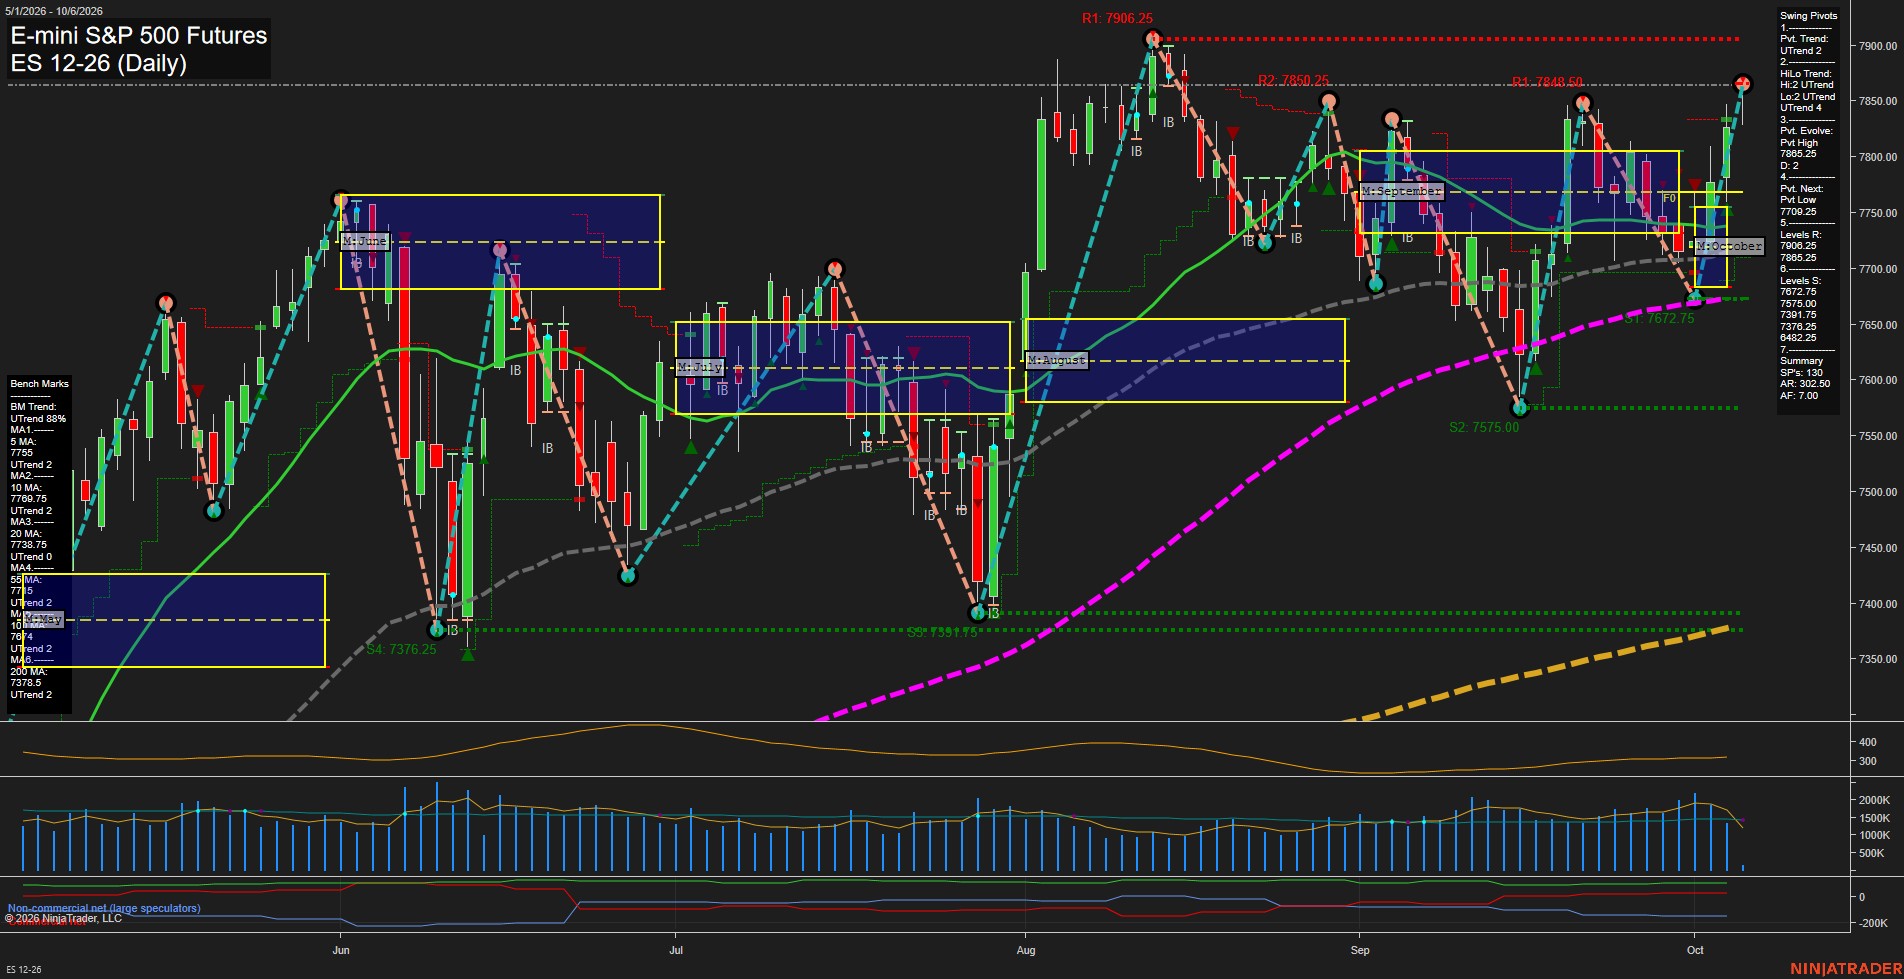
Overall Rating
- Short-Term: Bullish
- Intermediate-Term: Bullish
- Long-Term: Bullish.
Key Insights Summary
Price action has produced a sharp V-recovery from the late-September pullback and returned to the upper portion of the recent range. The short-term and intermediate pivot structures remain in UTrend alignment, while price is above all benchmark moving averages and above the weekly, monthly, and yearly F0% reference areas. The 7858.25 pivot high is the immediate swing reference, with 7906.25 representing the higher resistance level. The recovery has fast momentum and medium-sized daily bars, reflecting expansion after consolidation; 7702.25 is the defined opposite-pivot reversal level, with layered support beginning at 7672.75.
View charts on: AlphaWebTrader HTF Charts
NQ Daily View
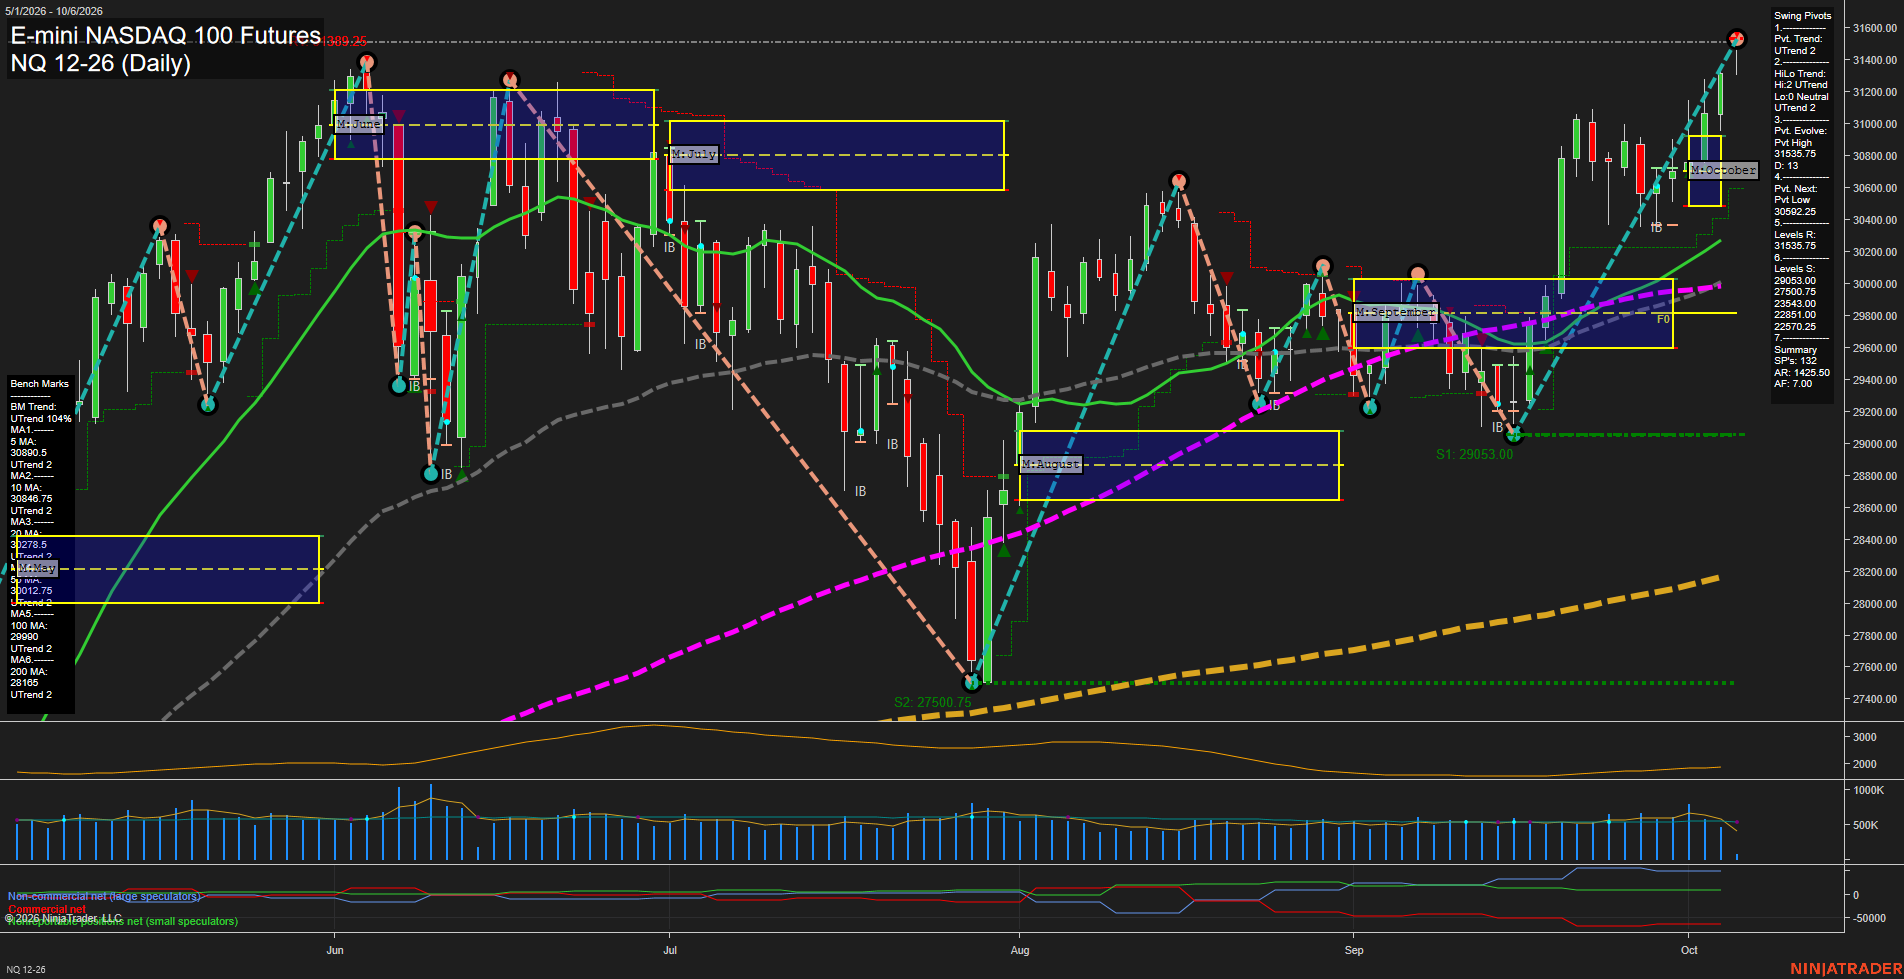
Overall Rating
- Short-Term: Bullish
- Intermediate-Term: Bullish
- Long-Term: Bullish.
Key Insights Summary
Price is extending a strong V-recovery from the August low and has reached a new pivot-high area near 31539.25. The short-term and intermediate pivot structures remain in UTrend, while price is above every benchmark moving average and above the weekly, monthly, and yearly F0% levels. The advance is fast and volatility remains elevated, reflected by large daily bars and the 1618 ATR. The immediate chart structure is a momentum breakout toward overhead pivot resistance at 31555.75, with the 30592.25 pivot-reversal level defining the nearest swing-structure threshold. The broader trend remains constructive, supported by rising 20-, 55-, 100-, and 200-day benchmarks and higher-low behavior since August.
View charts on: AlphaWebTrader HTF Charts
CL Daily View
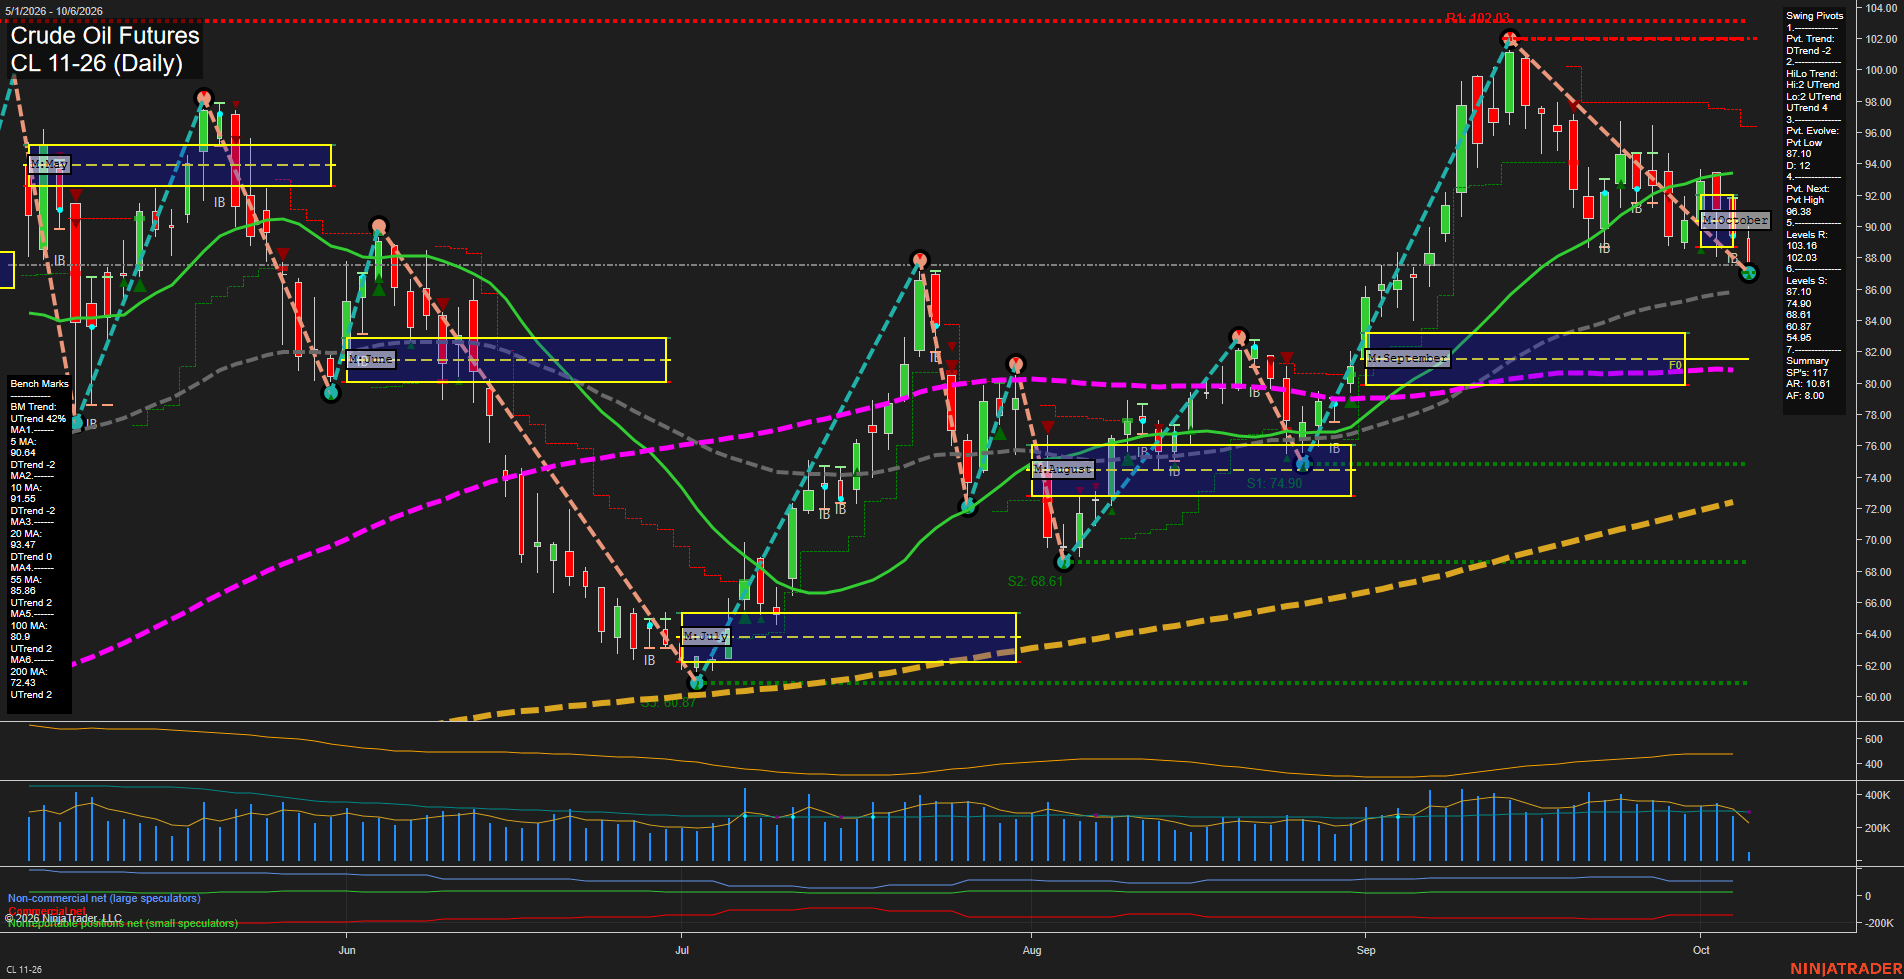
Overall Rating
- Short-Term: Bearish
- Intermediate-Term: Neutral
- Long-Term: Bullish.
Key Insights Summary
Price is in a fast short-term retracement from the 102.03 swing high, with the latest close at the active 87.10 pivot-low support. The short-term structure remains bearish because price is below the 5, 10, and 20-day benchmarks and both weekly and monthly Fib-grid readings are below their F0% areas. The intermediate structure is mixed: the pivot HiLo trend and rising 55-day average remain constructive, while the monthly grid and 20-day average reflect the current corrective leg. The broader yearly trend remains positive above the rising 100-day and 200-day averages. The 87.10 area is the immediate structural inflection point, while 96.38 is the reversal-pivot threshold and 102.03 remains the major overhead swing-high resistance.
View charts on: AlphaWebTrader HTF Charts
GC Daily View
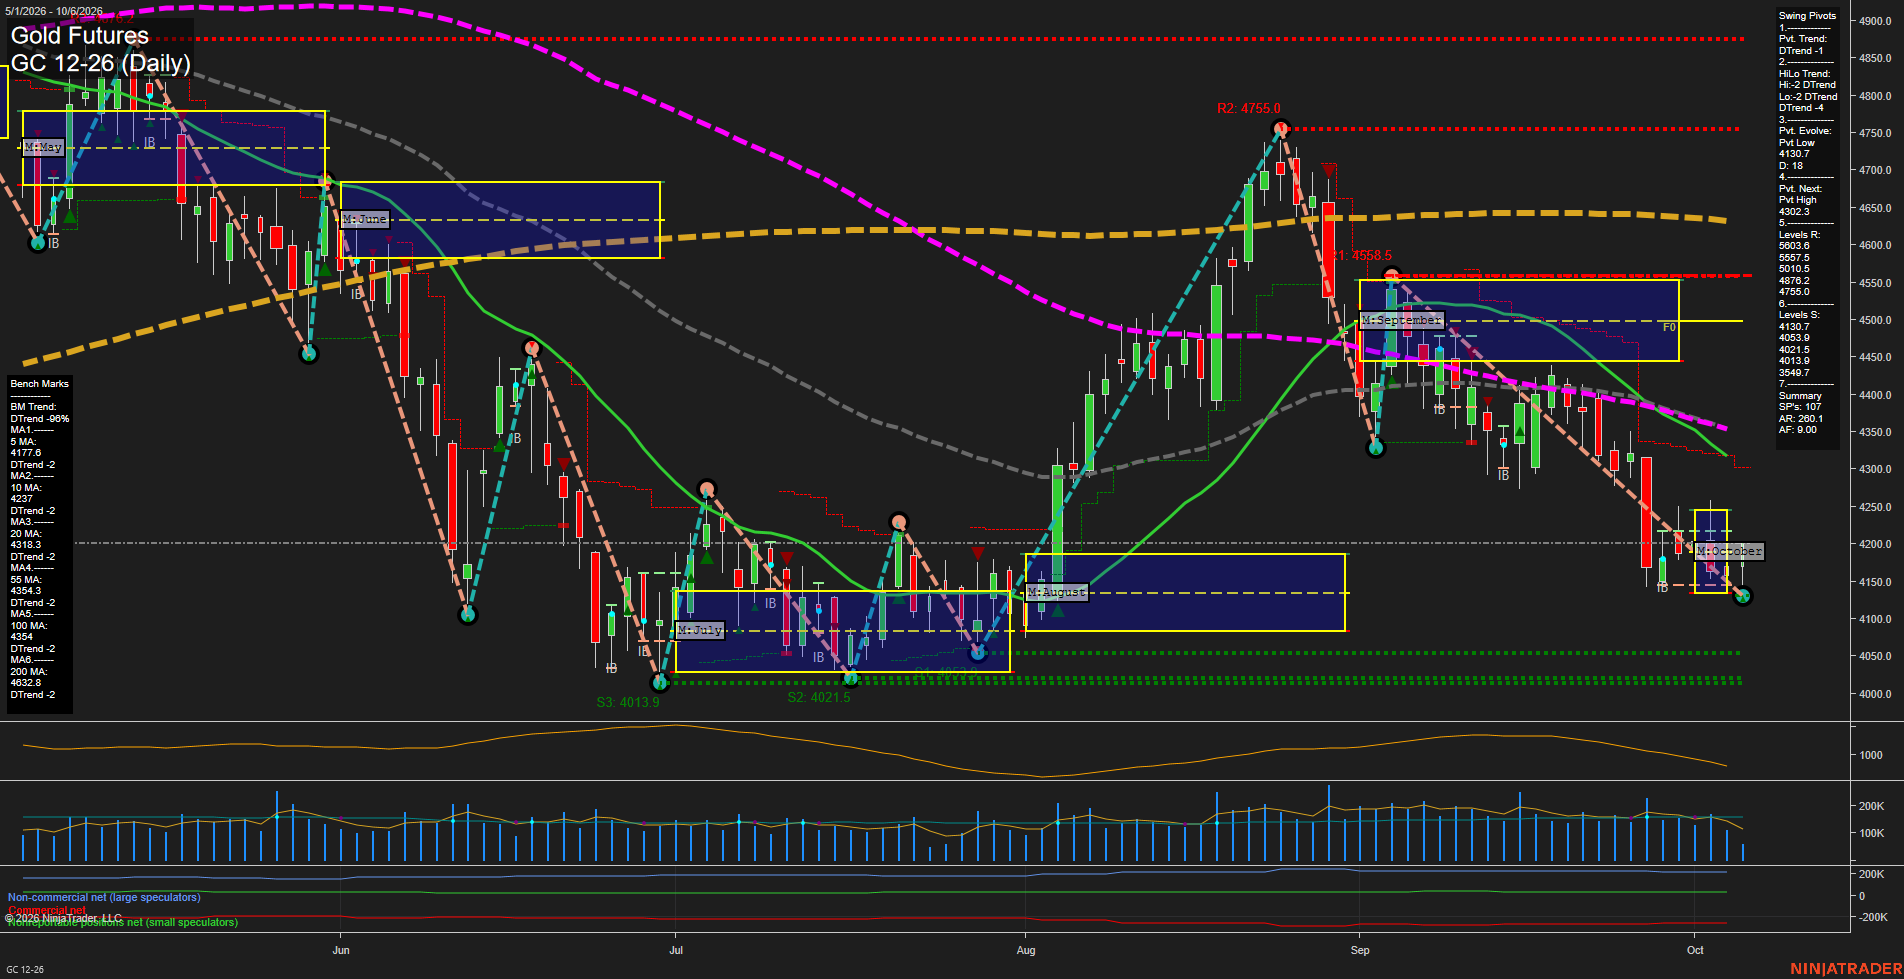
Overall Rating
- Short-Term: Bearish
- Intermediate-Term: Bearish
- Long-Term: Bearish.
Key Insights Summary
Price is consolidating near the 4130.7 swing-low pivot after a sharp September-to-October decline. The weekly grid remains positive, indicating a short-term countertrend bounce structure, but the monthly grid, both pivot trends, and all six declining benchmark averages maintain a broader bearish alignment. The 4303.7 pivot-next level and clustered moving-average zone from 4318.9 to 4354.6 define the nearby overhead technical ceiling, while 4130.7 is the immediate downside pivot reference. Elevated daily range conditions and moderate volume reflect an active, volatile retracement phase within the prevailing intermediate- and long-term downtrend.
View charts on: AlphaWebTrader HTF Charts
ZB Daily View
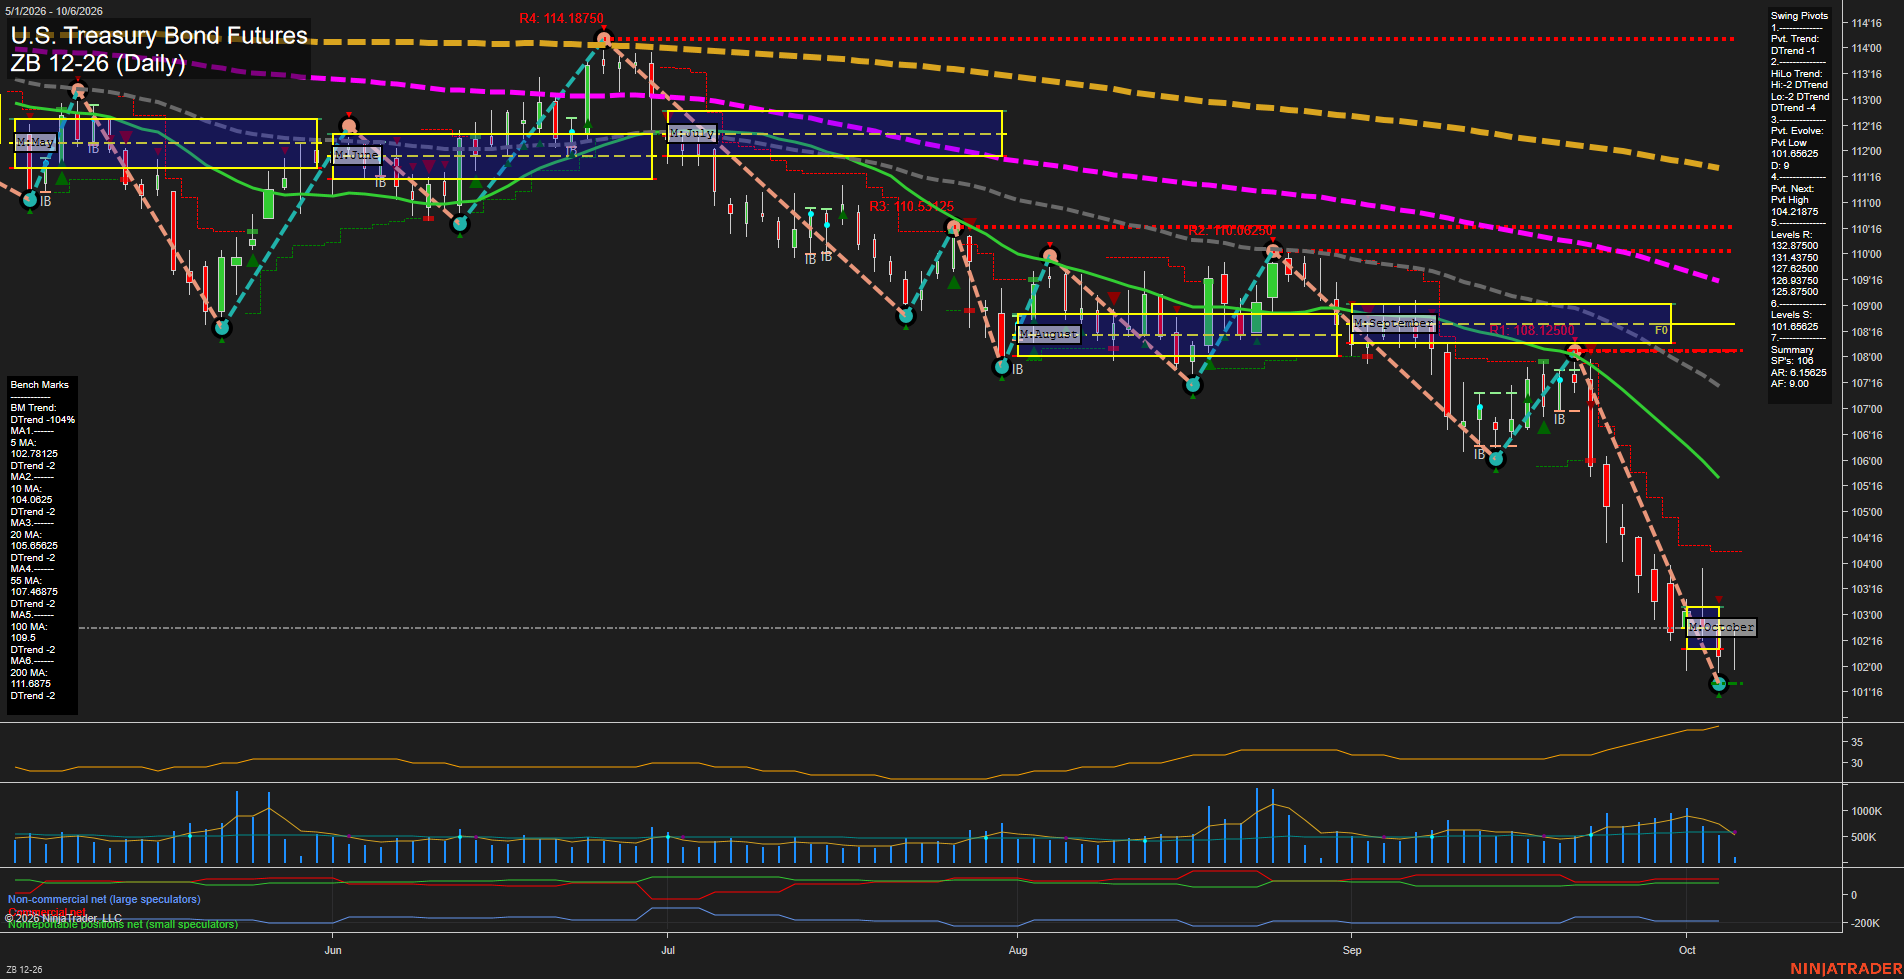
Overall Rating
- Short-Term: Bearish
- Intermediate-Term: Bearish
- Long-Term: Bearish.
Key Insights Summary
ZB remains in a broad, synchronized daily downtrend: price is below every benchmark average, below the weekly and monthly Fib-grid balance areas, and both pivot trend measures remain in DTrend. The sharp selloff has produced large bars, fast downside momentum, rising ATR, and a sequence of lower highs and lower lows. The recent low at 101.0625 defines the active downside pivot, while 104.21875 is the short-term reversal threshold for a new pivot high. The current recovery from the 101 area appears as a countertrend bounce within the prevailing decline, with overhead moving-average structure and the 104.21875 pivot level defining the nearest major technical ceiling.
View charts on: AlphaWebTrader HTF Charts