Pre-market futures are mixed as ES and NQ hold bullish structures, while YM, RTY and FDAX face corrective pressure amid oil and yield concerns.
Fundamentals: U.S. index futures were little changed as investors weighed rising oil prices, elevated Treasury yields and the release of Federal Reserve meeting minutes. Supply-disruption concerns tied to Middle East tensions and Gulf storm risks supported crude, while higher yields pressured gold and silver. Megacap technology continued to support major indexes amid valuation, concentration and regulatory concerns.
Technicals: U.S. equity futures show mixed technical conditions ahead of the NYSE open. ES and NQ retain bullish alignment across daily and weekly timeframes as they test nearby pivot resistance, while YM remains in a corrective rebound beneath key benchmark averages. RTY and FDAX show mixed-to-bearish shorter-term structures, and EMD is recovering from recent support within a broader corrective phase.
Pre-Market Trading 360° view Market Radar of: holidays, earnings, eco-news, market-news summary, news sentiment, prior session major ETFs, MAG7, Higher Time Frame Analysis Indices Futures Summary, and E-mini S&P500, Nasdaq 100, NYMEX Crude, Gold Futures Daily Chart analysis.
As of: October 7, 2026 07:16 CT
EcoNews Radar U.S. Events
| Day | Time | Impact | Event |
|---|---|---|---|
| Wed | 10:30 | Low | Crude Oil Inventories |
| Wed | 14:00 | High | FOMC Meeting Minutes |
| Thu | 08:30 | Medium | Unemployment Claims |
| Fri | 10:00 | Medium | Prelim UoM Consumer Sentiment |
| Fri | 10:00 | Medium | Prelim UoM Inflation Expectations |
EcoNews Summary
Wednesday features the week’s primary high-impact release: FOMC Meeting Minutes at 14:00. The minutes provide detail on Federal Reserve discussions regarding economic conditions, inflation, employment, and monetary-policy considerations. Also on Wednesday, Crude Oil Inventories provide an energy-market update relevant to petroleum supply, oil prices, and inflation-sensitive index futures.
Event Notes:
- Wednesday 10:30 – USD Crude Oil Inventories: A weekly estimate of changes in U.S. commercial crude-oil stockpiles. Traders monitor inventory draws and builds for indications of petroleum supply conditions and potential effects on energy prices.
- Wednesday 14:00 – USD FOMC Meeting Minutes: A record of the Federal Open Market Committee’s prior policy meeting, detailing participants’ views on inflation, labor conditions, growth, and interest-rate policy. Traders monitor the language for context on Federal Reserve policy thinking.
Conclusion:
The single most important event is Wednesday’s 14:00 FOMC Meeting Minutes. Market momentum and volume often slow ahead of major events such as FOMC, with increased volatility at release time. Wednesday’s crude-inventory data also provides petroleum-supply context; high oil prices directly affect markets through inflation and geopolitical concerns.
For full details visit: Forex Factory EcoNews
Market News Summary:
Index futures were steady as rising oil prices, elevated Treasury yields, and the pending Federal Reserve minutes shaped early market focus.
Primary Drivers & Risks:
- Primary Driver: Oil supply disruptions and Fed minutes
- Primary Risk: AI concentration and higher yields
Tone:
Neutral with inflationary and geopolitical cross-currents.
Stock Market / ETFs / Indices:
U.S. stock futures were little changed after the prior session’s advance. Equity markets remained supported by megacap technology, while concentration in Nvidia, Apple, and Microsoft reached a record share of the S&P 500. Reports also highlighted valuation concerns, AI-bubble warnings, and the possibility of EU taxes on large U.S. technology companies.
Geopolitical:
Renewed Houthi attacks in Saudi Arabia and broader U.S.-Iran tensions remained central market concerns. Attacks on tankers and Saudi targets added to regional supply-security risks.
Oil / Energy:
Oil rose as Houthi attacks, threats to Saudi infrastructure, and a storm approaching U.S. Gulf oil-producing areas raised supply-disruption concerns. Recovering Middle East crude supplies provided an offsetting factor, while WTI tested roughly $90.64 and Brent approached $103.89 in cited market commentary.
Gold / Metals:
Gold and silver traded under pressure as the dollar and long-term Treasury yields rose ahead of Fed minutes and a 10-year Treasury auction. Gold moved toward $4,103, with cited technical support near $4,100.
Fed / Financials:
Investors awaited the Fed’s September meeting minutes for detail on the path of rate policy after the September increase. Treasury yields continued higher amid a bond selloff, while India raised its policy rate 25 basis points to 5.5% as inflation and energy-price pressures increased.
Macro / Other:
Asian currencies consolidated against the dollar amid broader risk-asset appetite. The U.S. trade deficit widened as data-center investment boosted imports.
Conclusion:
Oil supply concerns and the release of Fed minutes were the primary near-term market catalysts. Elevated Treasury yields remained a key influence on index futures and precious metals.
Middle East hostilities and Gulf storm risks added to inflation-sensitive energy pressure. AI leadership continued to support major indexes, alongside concentration, valuation, and regulation-related risks.
Market News Sentiment
Market News Articles: 44
- Neutral: 63.64%
- Positive: 22.73%
- Negative: 13.64%
Sentiment Summary: Of 44 market news articles, 64% were neutral, 23% positive, and 14% negative, indicating predominantly balanced coverage with a modest positive tilt.
Conclusion: News sentiment for indices futures is largely neutral, with positive articles exceeding negative articles.
GLD,Gold Articles: 14
- Neutral: 42.86%
- Positive: 28.57%
- Negative: 28.57%
Sentiment Summary: Gold-related coverage is neutral overall, with 43% neutral, 29% positive, and 29% negative articles.
Conclusion: The balanced positive and negative distribution indicates no clear directional sentiment signal for indices futures day traders.
USO,Oil Articles: 13
- Neutral: 46.15%
- Positive: 30.77%
- Negative: 23.08%
Sentiment Summary: USO and oil coverage is neutral overall, with 46% neutral, 31% positive, and 23% negative articles across 13 reports.
Conclusion: The news tone is mixed but balanced, with neutral coverage the largest category and positive articles modestly exceeding negative articles.
Market Data Snapshot
ETF Snapshot of major stock market ETFs, Mag7, and others as of: October 7, 2026 07:16
Top Movers & Losers
- AMZN 256.29 Bullish 1.95% ▲
- MSFT 529.30 Bullish 0.78% ▲
- GLD 382.27 Bullish 0.72% ▲
- IBIT 48.49 Bearish -0.14% ▼
- META 738.88 Bearish -0.41% ▼
- IWM 281.34 Bearish -0.72% ▼
Major Index ETFs: SPY, QQQ, DIA, IWM, IJH
- SPY 779.09 Bullish 0.55% ▲
- DIA 514.56 Bullish 0.48% ▲
- QQQ 759.66 Bullish 0.46% ▲
- IJH 74.00 Bullish 0.43% ▲
- IWM 281.34 Bearish -0.72% ▼
Mixed: SPY is the most bullish mover at +0.55%, followed by DIA at +0.48%, QQQ at +0.46%, and IJH at +0.43%. IWM is the most bearish mover at -0.72%, creating a clear small-cap divergence against the broader bullish index ETF moves.
Mag 7 Stocks: AAPL, MSFT, GOOG, AMZN, META, NVDA, TSLA
- AMZN 256.29 Bullish 1.95% ▲
- MSFT 529.30 Bullish 0.78% ▲
- TSLA 380.68 Bullish 0.51% ▲
- AAPL 333.63 Bullish 0.22% ▲
- GOOG 344.59 Bullish 0.22% ▲
- NVDA 239.24 Bullish 0.14% ▲
- META 738.88 Bearish -0.41% ▼
Mixed Mag7 action: AMZN is the most bullish mover at +1.95%, followed by MSFT at +0.78% and TSLA at +0.51%. AAPL and GOOG are modestly Bullish at +0.22% each, while NVDA is marginally Bullish at +0.14%. META is the most bearish mover at -0.41%.
Cross-Market ETFs: TLT, GLD, USO, IBIT
- GLD 382.27 Bullish 0.72% ▲
- USO 144.91 Bullish 0.64% ▲
- TLT 77.28 Bullish 0.22% ▲
- IBIT 48.49 Bearish -0.14% ▼
Mixed cross-market snapshot: GLD is the most bullish mover at +0.72%, followed by USO at +0.64% and TLT at +0.22%. IBIT is the most bearish mover, marginally lower at -0.14%.
ETF, Mag7, and Cross-Market ETF Insights
Overall Tone
Overall tone is Mixed, with large-cap equity ETFs Bullish while small caps and IBIT are Bearish.
Equity ETFs and Mag7:
Major Index ETFs were Mixed: SPY +0.55%, DIA +0.48%, QQQ +0.46%, and IJH +0.43% were Bullish, while IWM -0.72% was Bearish and the most bearish mover across equities. Mag7 participation was Mixed, led by AMZN +1.95% as the most bullish mover, followed by MSFT +0.78%, TSLA +0.51%, AAPL +0.22%, GOOG +0.22%, and marginal NVDA +0.14%; META -0.41% was Bearish. Large-cap equity strength was broadly aligned, though small caps and META diverged.
Cross-Market ETFs:
Cross-market ETFs were Mixed: GLD +0.72% was the most bullish mover, with USO +0.64% and TLT +0.22% also Bullish. IBIT -0.14% was marginally Bearish and the most bearish cross-market mover, contrasting with strength in gold, oil, and Treasuries.
Futures Indices – Higher Time Frame Analysis
Summary of the current state of US Indices Futures based on higher time-frame (HTF) technical analysis as of: 2026-10-07: 07:16 CT.
US Indices Futures
- ES: YSFG/MSFG/WSFG above F0%, rising benchmarks, UTrend pivots; resistance 7897.50-7906.25, support 7742.50, then 7672.75 and 7575.00.
- NQ: YSFG/MSFG/WSFG above F0%, all benchmarks rising, higher-high structure; resistance 31389.25-31660.50, pivot-reversal support 30689.00.
- YM: YSFG/MSFG above F0%, WSFG below F0%; short-term DTrend beneath benchmarks, support 50859, resistance 51999 and 52036-52801.
- EMD: YSFG/MSFG/WSFG above F0%, weekly DTrend versus daily UTrend; support 3600.3, resistance 3737.8, then 3825.3 and 3969.6.
- RTY: YSFG above F0%, MSFG neutral, WSFG below F0%; rebound from 2791.5, resistance 2876.3-2887.0, then 2931.2.
- FDAX: MSFG marginally above F0%, WSFG below F0%; corrective DTrend, support 24897-25001, resistance 25705, then 25890-25990.
Overall State
- Short-Term: Neutral
- Intermediate-Term: Bullish
- Long-Term: Bullish
Conclusion
ES and NQ retain aligned bullish HTF grids, benchmarks, and pivot structures near prior highs. YM, RTY, and FDAX remain in short-term corrective structures, while EMD shows a daily rebound within a broader correction. Yearly and longer benchmark structure remains broadly bullish across the group; weekly grid and short-term pivot conditions are mixed outside ES and NQ.
Note: Intra-day counter-trend pullbacks or retracements may occur, HTF is context for informational usage and market structure. Glossary: Session Fib Grids periods of YSFG:’Yearly’, MSFG:’Monthly’, WSFG:’Weekly’
For full details visit: AlphaWebTrader Technicals
ES Daily View
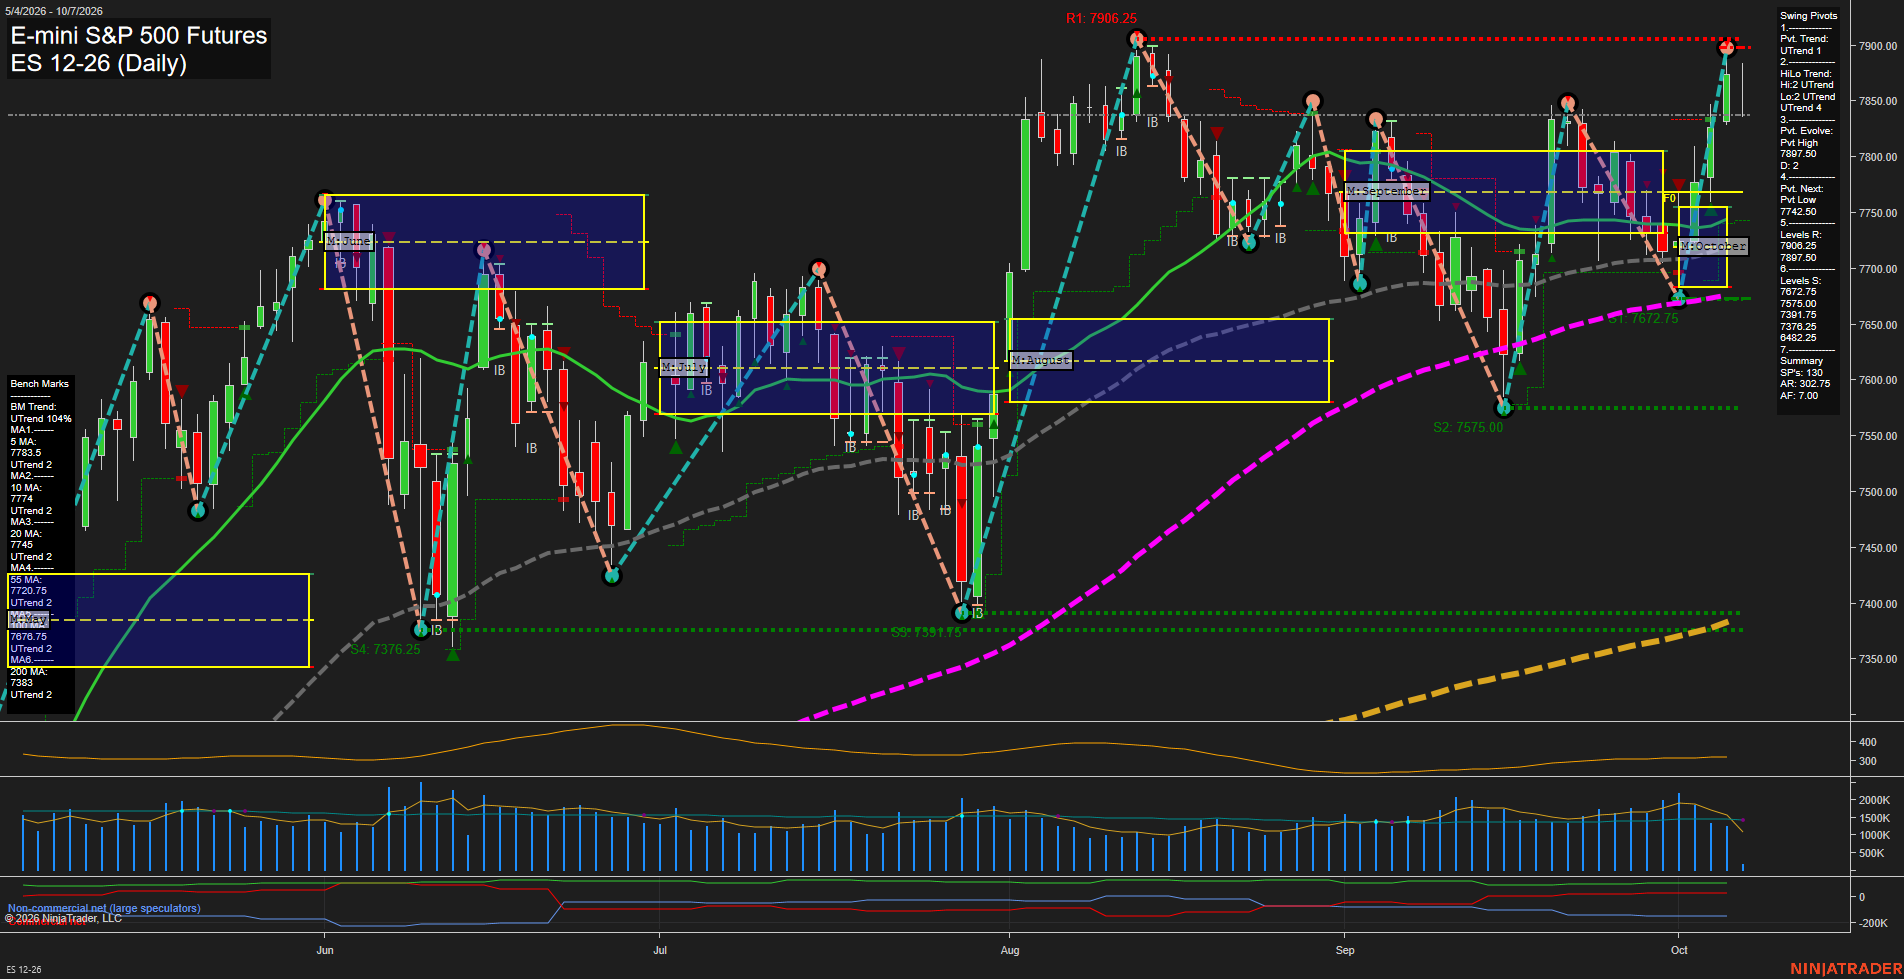
Overall Rating
- Short-Term: Bullish
- Intermediate-Term: Bullish
- Long-Term: Bullish.
Key Insights Summary
The daily structure remains broadly bullish: price is above all six rising benchmark averages, the weekly, monthly, and yearly fib-grid biases are above F0%, and both pivot trend measures remain in UTrend. The recent advance has returned price toward the 7897.50 to 7906.25 swing-resistance band after a higher-low recovery from the late-September 7575.00 area. Medium-sized bars and fast momentum show an active upside rotation, while the 319-point ATR reflects a wide daily range environment. The nearest structural downside pivot reference is 7742.50, with deeper supports at 7672.75 and 7575.00; price behavior around the 7897.50 and 7906.25 resistance cluster defines whether the rally is extending or consolidating beneath prior highs.
View charts on: AlphaWebTrader HTF Charts
NQ Daily View
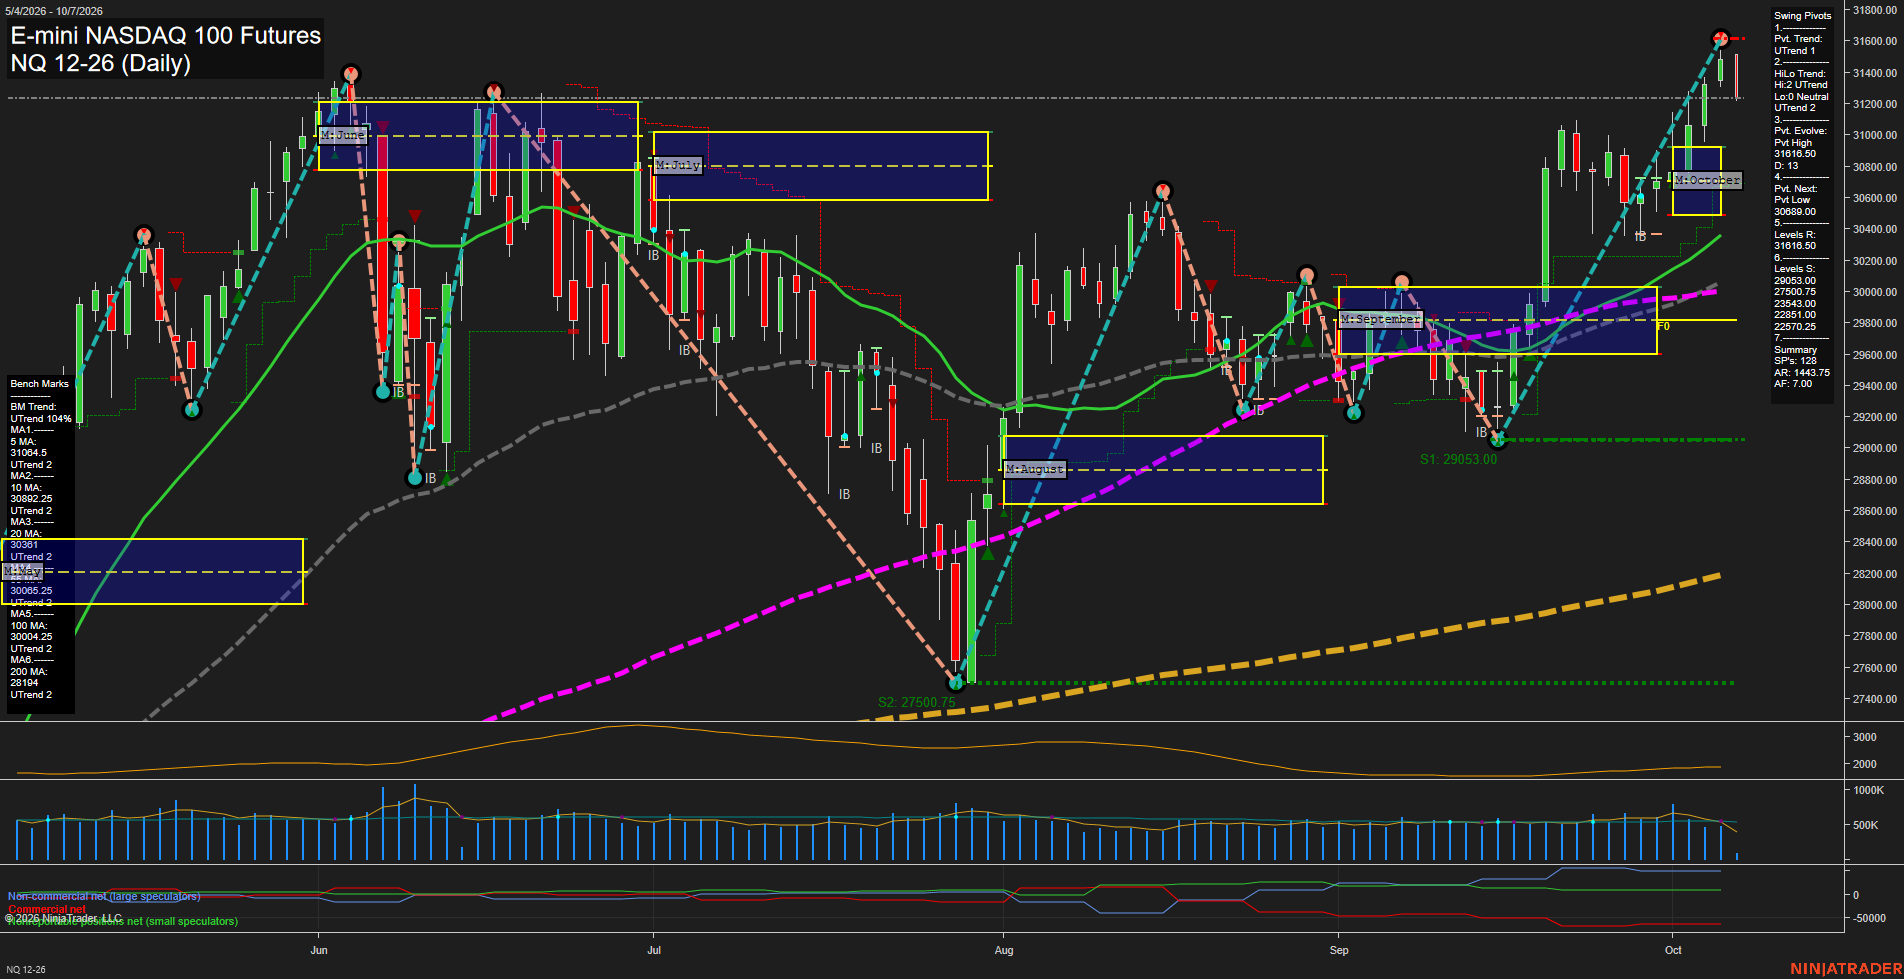
Overall Rating
- Short-Term: Bullish
- Intermediate-Term: Bullish
- Long-Term: Bullish.
Key Insights Summary
Price is in a broad bullish swing structure, holding above all daily benchmarks while weekly, monthly, and yearly Fib-grid bias remains above F0%. The advance from the September low has produced higher lows and higher highs, with the current pivot evolving as a high near 31616.50. Fast momentum and elevated ATR reflect an active expansion phase, while the 30689.00 pivot reversal level defines the nearest short-term structural transition point.
View charts on: AlphaWebTrader HTF Charts
CL Daily View
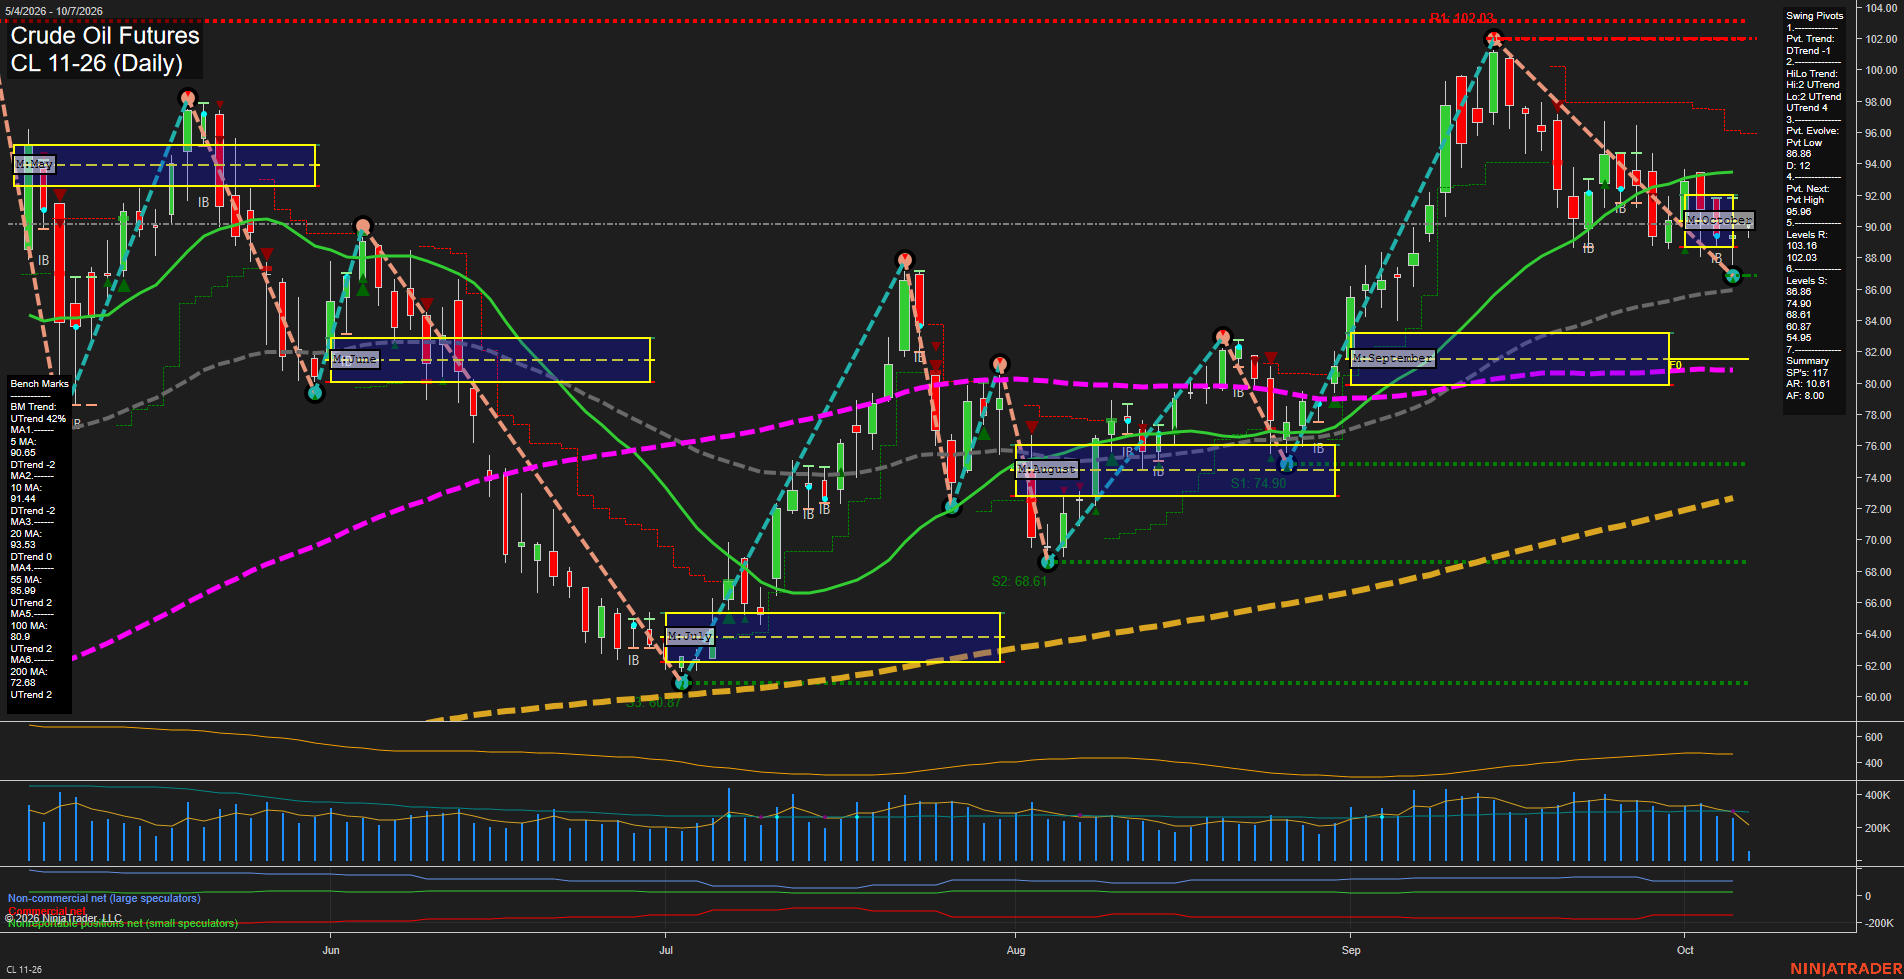
Overall Rating
- Short-Term: Bearish
- Intermediate-Term: Bullish
- Long-Term: Bullish.
Key Insights Summary
Price is consolidating near 90.56 after a sharp September rally to the 102.03 swing-high resistance zone and a subsequent pullback to the 86.86 pivot low. Short-term structure remains corrective: price is below the 5-, 10-, and 20-day benchmarks, the weekly grid is below F0%, and the active pivot trend is down. The intermediate structure remains constructive because the higher-low pivot sequence, monthly grid position above F0%, and rising 55-day benchmark remain intact. The chart is positioned between 86.86 support and 94.18 resistance, with 95.96 identified as the next pivot-high reversal level. Long-term trend conditions remain positive above the rising 100- and 200-day averages.
View charts on: AlphaWebTrader HTF Charts
GC Daily View
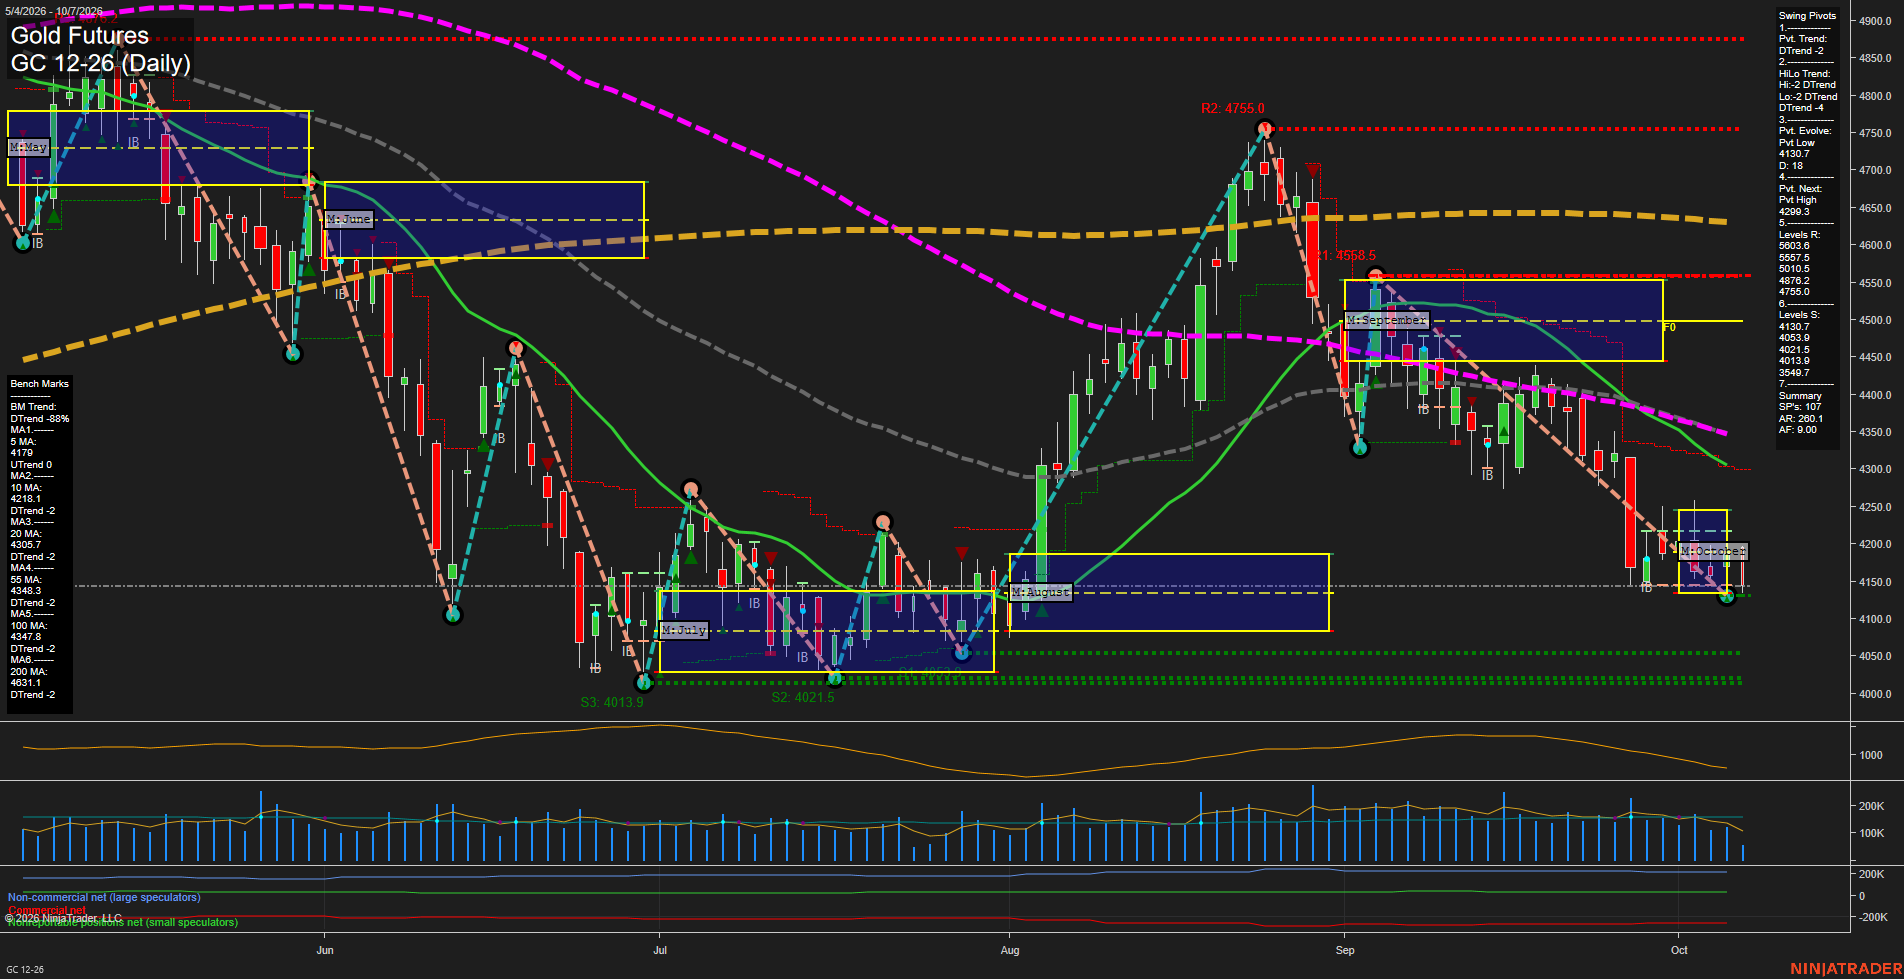
Overall Rating
- Short-Term: Bearish
- Intermediate-Term: Bearish
- Long-Term: Bearish.
Key Insights Summary
Price is consolidating near the 4130.7 pivot-low support after a sharp September decline, with small daily bars reflecting slower downside momentum rather than a confirmed reversal. The short-term 5-day average is rising, but price remains beneath the 10-, 20-, 55-, 100-, and 200-day benchmarks while both pivot structures and weekly, monthly, and yearly Fib-grid measures remain down. The dominant swing structure is lower highs and lower lows; 4299.3 is the next pivot-reversal reference, while 4130.7 and the clustered 4053.9-4013.9 supports define the nearby downside structure.
View charts on: AlphaWebTrader HTF Charts
ZB Daily View
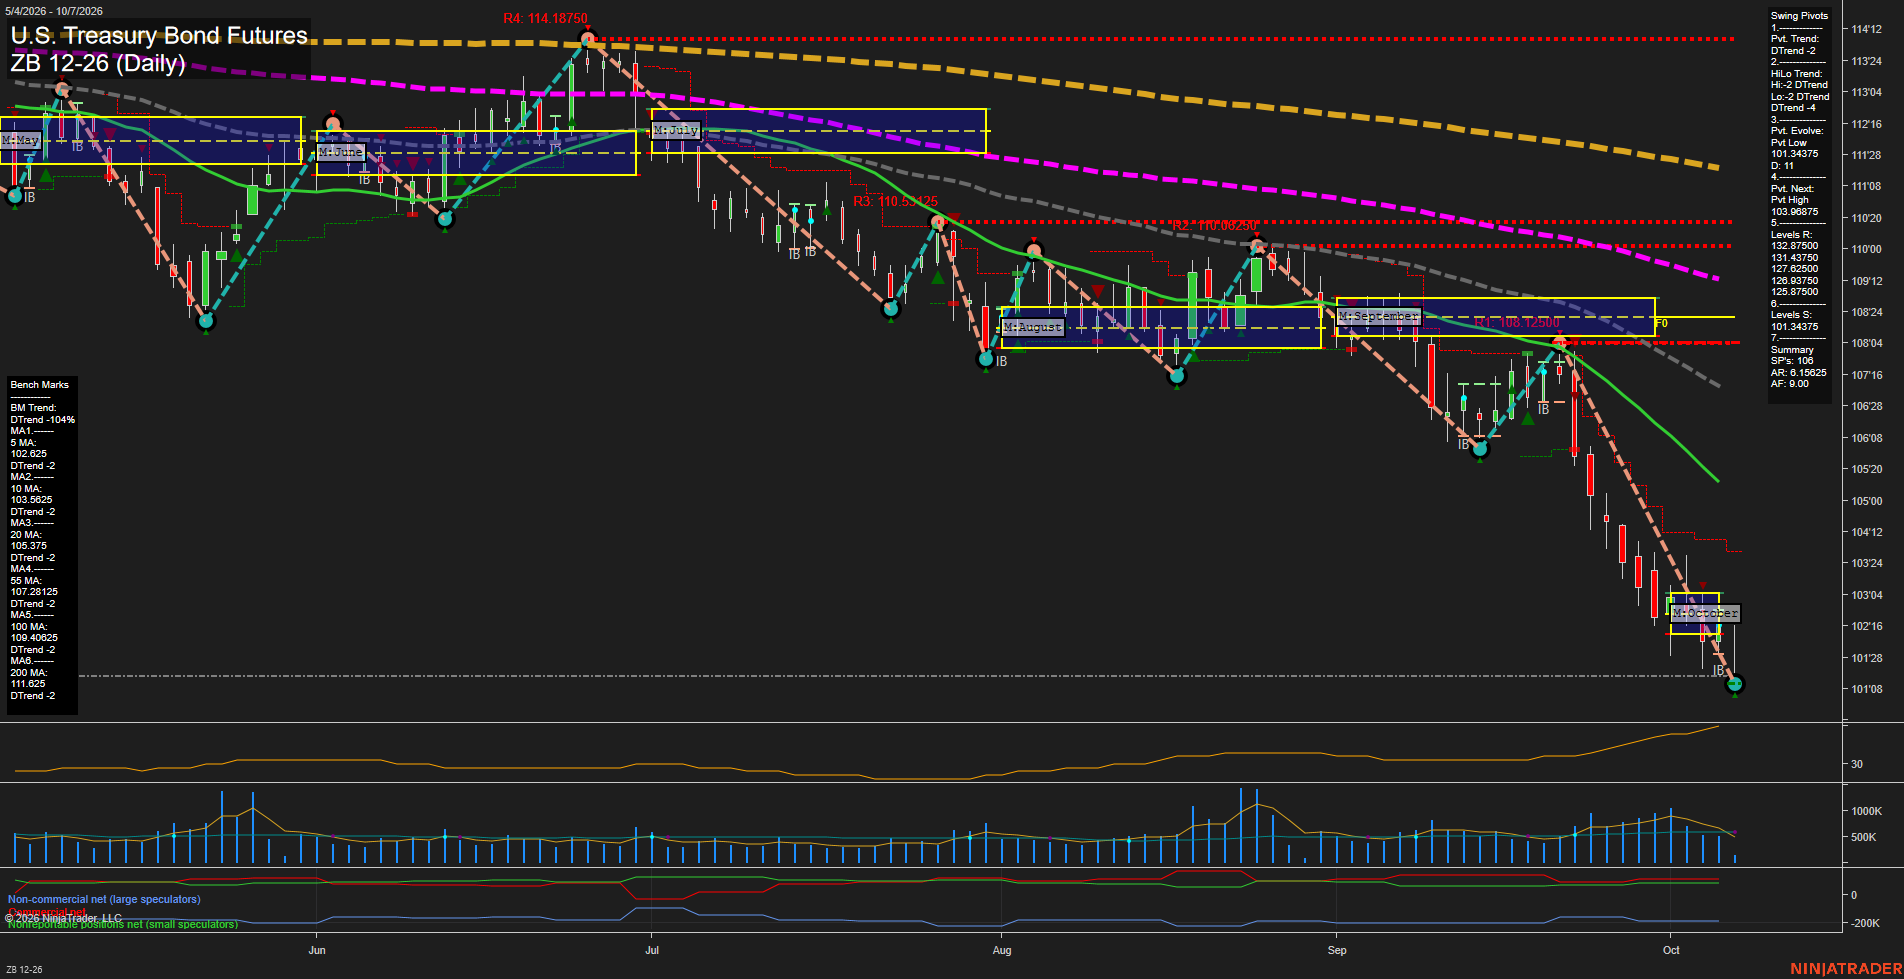
Overall Rating
- Short-Term: Bearish
- Intermediate-Term: Bearish
- Long-Term: Bearish.
Key Insights Summary
ZB is in a broad, synchronized bearish structure, with price below the weekly, monthly, and yearly Fib-grid centers and below every benchmark moving average. The decline is accelerating through large daily bars, while the pivot structure continues to show lower highs and lower lows. Price is pressing beneath the prior 101.34375 swing-low area, leaving 103.96875 as the nearest meaningful pivot-reversal reference. Elevated ATR and active volume characterize an expansionary selloff rather than a balanced consolidation, while the downward slope of the 20-, 55-, 100-, and 200-day averages confirms persistent intermediate- and long-term downside pressure.
View charts on: AlphaWebTrader HTF Charts