U.S. futures ease before the NYSE open as oil and yields rise, while ES and NQ hold bullish trends and YM, RTY, EMD and FDAX remain weak near support.
Fundamentals: U.S. index futures moved lower before the NYSE open as crude oil and Treasury yields remained elevated. Iran-related attacks on shipping and reduced Strait of Hormuz traffic supported energy prices, while Fed tightening concerns, a firm dollar and tariff-linked price pressures weighed on sentiment. AI-sector weakness and narrow index leadership added to equity-market cross-currents.
Technicals: Pre-market conditions reflect mixed index futures structures following a prior session led by gains in AMZN, AAPL and GOOG, while META, IBIT and IJH declined. ES and NQ retain bullish daily and weekly trends beneath nearby resistance, whereas YM, EMD, RTY and FDAX remain in short-term bearish swings. Key pivot levels, moving averages and support zones frame the current technical backdrop.
Pre-Market Trading 360° view Market Radar of: holidays, earnings, eco-news, market-news summary, news sentiment, prior session major ETFs, MAG7, Higher Time Frame Analysis Indices Futures Summary, and E-mini S&P500, Nasdaq 100, NYMEX Crude, Gold Futures Daily Chart analysis.
As of: October 8, 2026 07:16 CT
EcoNews Radar U.S. Events
| Day | Time | Impact | Event |
|---|---|---|---|
| Thu | 08:30 | Medium | Unemployment Claims |
| Fri | 10:00 | Medium | Prelim UoM Consumer Sentiment |
| Fri | 10:00 | Medium | Prelim UoM Inflation Expectations |
EcoNews Summary
No qualifying high-impact EcoNews events are listed. The listed medium-impact USD events do not relate directly to oil, crude inventories, energy prices, or petroleum supply and are excluded.
Event Notes:
Conclusion:
No qualifying event is listed for the week; therefore, no single most important qualifying day or event is identified.
For full details visit: Forex Factory EcoNews
Market News Summary:
Index futures point lower as oil and Treasury yields rise amid escalating Iran-related supply disruptions and pressure on AI-linked equities.
Primary Drivers & Risks:
- Primary Driver: Oil surge and elevated Treasury yields
- Primary Risk: Iran conflict disrupts energy shipping
Tone:
Risk-off, inflation-sensitive, and geopolitically tense.
Stock Market / ETFs / Indices:
U.S. stock futures trended lower, with higher oil prices, elevated yields, and an AI-sector pullback weighing on sentiment. Reports highlighted narrow S&P 500 leadership, high AI capital spending, and weakness in memory stocks following Samsung’s preliminary results.
Geopolitical:
Reports said the White House discussed renewed large-scale military operations in Iran. Tanker attacks and reduced vessel traffic through the Strait of Hormuz intensified concerns around a key global energy transit route.
Oil / Energy:
Crude rose as Middle East hostilities, attacks on shipping, and lower Hormuz transits heightened supply concerns. WTI tested $90.62, Brent pressed $103.89, and a Gulf Coast storm added U.S. production-disruption concerns; natural gas also advanced.
Gold / Metals:
Gold tested $4,100 support and silver fell below $59.96 as Fed tightening concerns, high Treasury yields, and a firm dollar pressured precious metals.
Fed / Financials:
Treasury yields remained near multi-decade highs as Fed minutes kept additional tightening in focus. The Fed’s September rate increase was unanimous, with most officials supporting another increase before year-end. An investment bank also agreed to an $800,000 fine over suspicious-activity controls tied to penny-stock underwriting.
Macro / Other:
A New York Fed report attributed a 2.9-percentage-point increase in prices across a sampled group of goods to tariffs imposed in 2025 and early 2026. Higher gasoline and diesel costs remained a consumer-inflation concern.
Conclusion:
Rising crude prices and elevated Treasury yields are the central pressures on equity-index sentiment. Iran-related security concerns and disrupted Hormuz shipping underpin the energy move.
Fed tightening risk, a strong dollar, and tariff-linked price pressures add to inflation concerns. AI-sector fragility and concentrated index leadership remain additional equity-market cross-currents.
Market News Sentiment
Market News Articles: 41
- Negative: 43.90%
- Neutral: 36.59%
- Positive: 19.51%
Sentiment Summary: Market news sentiment is negative overall, with 44% negative, 37% neutral, and 20% positive coverage across 41 articles.
Conclusion: Indices futures day traders are facing a news backdrop with more negative than positive reporting, while neutral coverage remains substantial.
GLD,Gold Articles: 8
- Negative: 75.00%
- Neutral: 12.50%
- Positive: 12.50%
Sentiment Summary: GLD and gold coverage is predominantly negative, with 75% negative, 13% neutral, and 13% positive articles across 8 items.
Conclusion: The gold-news tone is negative, indicating risk-sensitive commodity sentiment is skewed toward unfavorable coverage for indices futures day traders.
USO,Oil Articles: 18
- Positive: 38.89%
- Negative: 33.33%
- Neutral: 27.78%
Sentiment Summary: USO and oil coverage is mixed, with 39% positive, 33% negative, and 28% neutral articles across 18 items.
Conclusion: Oil-related news sentiment is slightly positive overall, but the narrow positive-negative gap indicates balanced directional tone for indices futures traders.
Market Data Snapshot
ETF Snapshot of major stock market ETFs, Mag7, and others as of: October 8, 2026 07:16
Top Movers & Losers
- AMZN 259.92 Bullish 1.42% ▲
- AAPL 336.67 Bullish 0.91% ▲
- GOOG 347.37 Bullish 0.81% ▲
- IJH 72.76 Bearish -1.68% ▼
- META 721.31 Bearish -2.38% ▼
- IBIT 47.21 Bearish -2.64% ▼
Major Index ETFs: SPY, QQQ, DIA, IWM, IJH
- SPY 777.22 Bearish -0.24% ▼
- QQQ 757.73 Bearish -0.25% ▼
- DIA 511.02 Bearish -0.69% ▼
- IWM 277.70 Bearish -1.29% ▼
- IJH 72.76 Bearish -1.68% ▼
Major index ETFs were Bearish across the snapshot. IJH led losses at -1.68%, followed by IWM at -1.29% and DIA at -0.69%. QQQ was the least negative mover at -0.25%, with SPY close behind at -0.24%.
Mag 7 Stocks: AAPL, MSFT, GOOG, AMZN, META, NVDA, TSLA
- AMZN 259.92 Bullish 1.42% ▲
- AAPL 336.67 Bullish 0.91% ▲
- GOOG 347.37 Bullish 0.81% ▲
- MSFT 529.76 Bullish 0.09% ▲
- NVDA 237.47 Bearish -0.74% ▼
- TSLA 377.81 Bearish -0.75% ▼
- META 721.31 Bearish -2.38% ▼
Mixed: AMZN is the most bullish mover at +1.42%, followed by AAPL at +0.91% and GOOG at +0.81%. MSFT is marginally Bullish at +0.09%. META is the most bearish mover at -2.38%, with TSLA at -0.75% and NVDA at -0.74%.
Cross-Market ETFs: TLT, GLD, USO, IBIT
- TLT 77.14 Bearish -0.17% ▼
- USO 143.91 Bearish -0.69% ▼
- GLD 375.88 Bearish -1.67% ▼
- IBIT 47.21 Bearish -2.64% ▼
Other ETFs are uniformly Bearish: IBIT is the most bearish mover at -2.64%, followed by GLD at -1.67% and USO at -0.69%. TLT is the least negative mover, marginally lower at -0.17%.
ETF, Mag7, and Cross-Market ETF Insights
Overall Tone
Mixed conditions lean Bearish: broad equity ETFs, bonds, commodities, gold, and Bitcoin exposure are lower, while selective Mag7 strength is led by AMZN at +1.42%.
Equity ETFs and Mag7:
Major Index ETFs are broadly Bearish, with SPY at -0.24%, QQQ at -0.25%, DIA at -0.69%, IWM at -1.29%, and IJH at -1.68%; SPY is the least negative mover while IJH is the most bearish. Mag7 action is selective: AMZN is the most bullish mover at +1.42%, followed by AAPL at +0.91% and GOOG at +0.81%, while MSFT is marginally positive at +0.09%. NVDA at -0.74%, TSLA at -0.75%, and META at -2.38% lag, with META the most bearish Mag7 mover.
Cross-Market ETFs:
Cross-market ETFs are broadly Bearish alongside equities, with TLT at -0.17%, USO at -0.69%, GLD at -1.67%, and IBIT at -2.64%. TLT is the least negative mover, while IBIT is the most bearish mover across the full snapshot, indicating weakness across bond, commodity, gold, and Bitcoin exposure.
Futures Indices – Higher Time Frame Analysis
Summary of the current state of US Indices Futures based on higher time-frame (HTF) technical analysis as of: 2026-10-08: 07:16 CT.
US Indices Futures
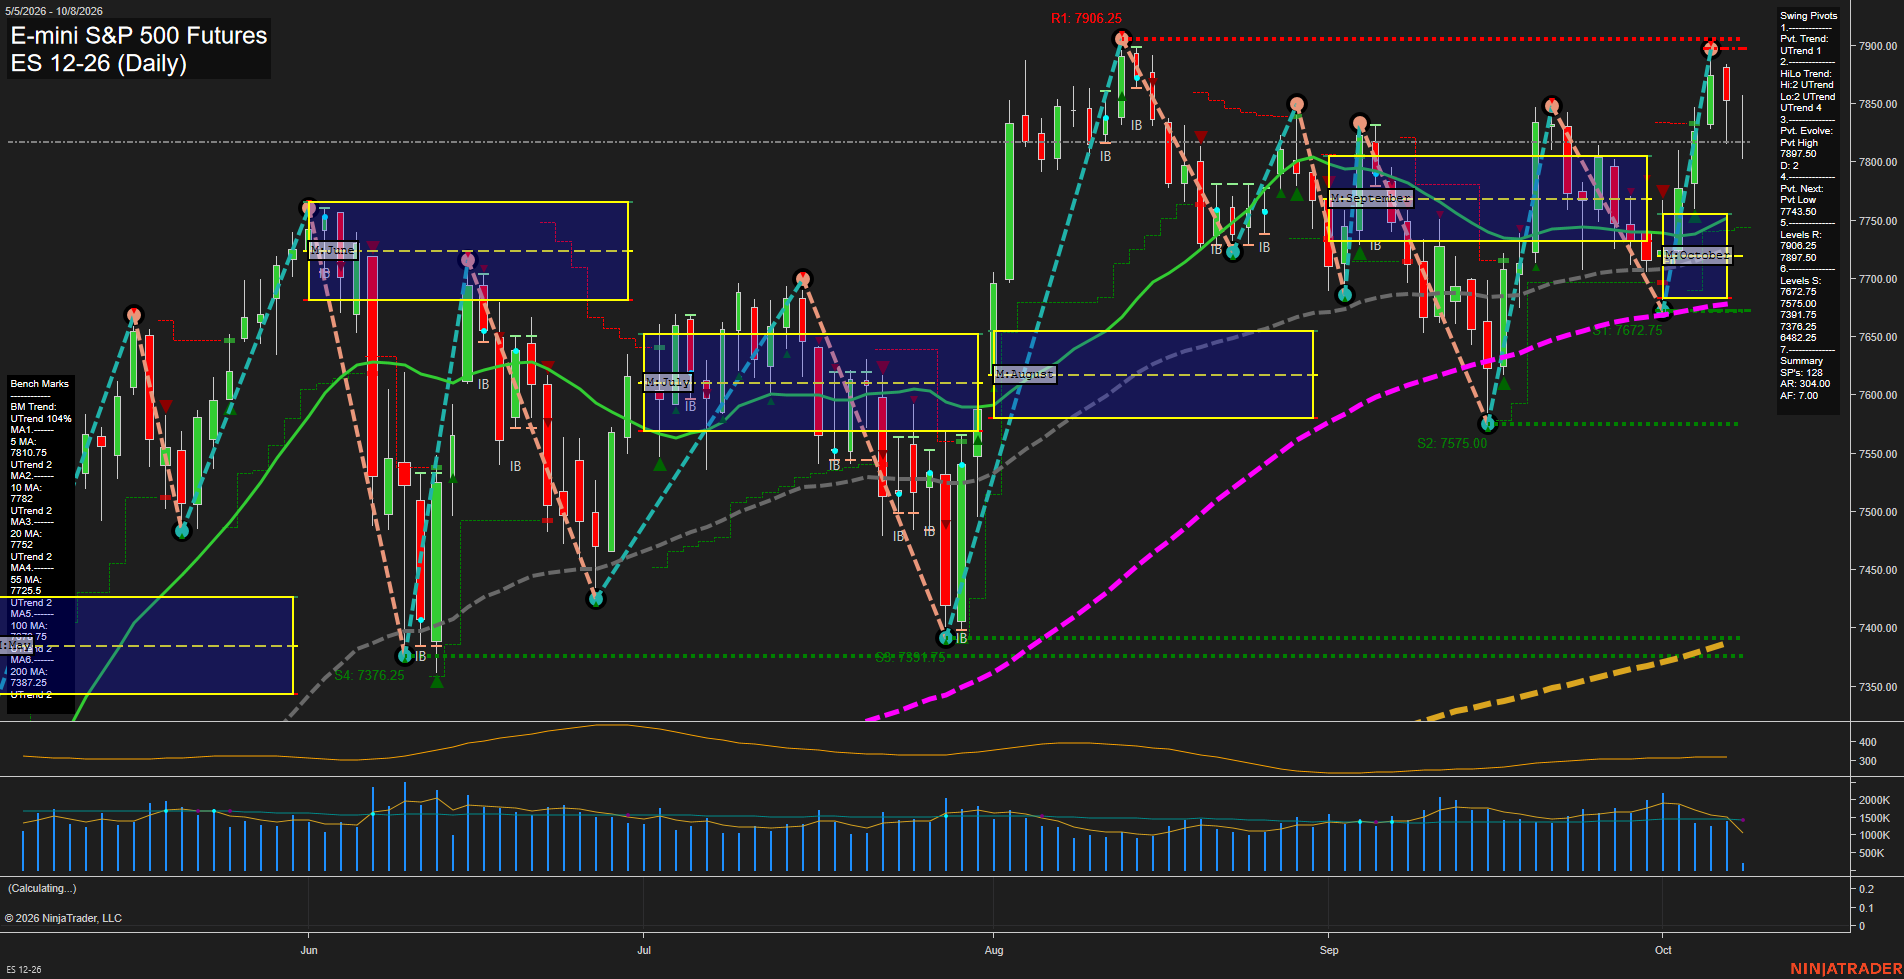
- ES YSFG/MSFG/WSFG above F0%, benchmarks rising, UTrend pivots; 7906.25 resistance, 7752.25 pivot support; consolidation beneath highs.
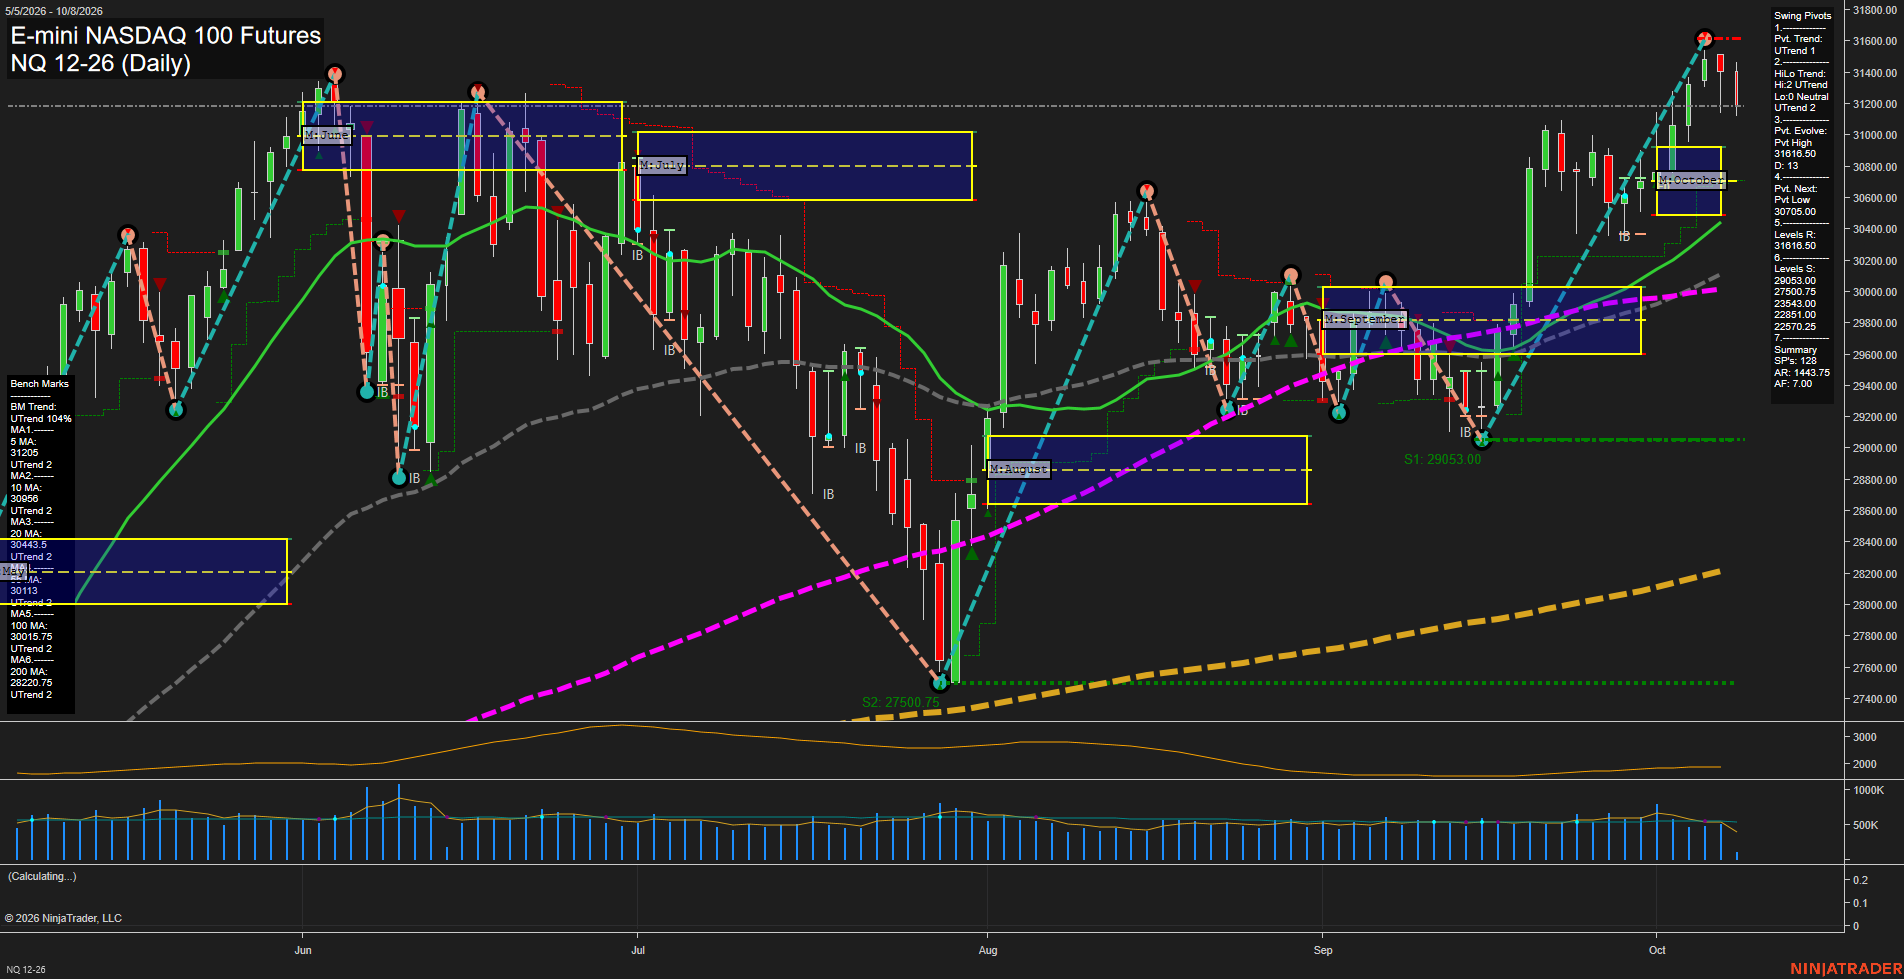
- NQ YSFG/MSFG/WSFG above F0%, rising benchmarks and UTrend pivots; 31610.50-31616.50 resistance, 30283.75-29989.45 support cluster.
- YM YSFG above F0%, MSFG/WSFG below center; short DTrend, 50859 support, 52005 reversal threshold; 100/200-period benchmarks rising.
- EMD YSFG/MSFG above F0%, WSFG below F0%; short DTrend, 3600.3 support, 3797.3 reversal threshold; weekly 55/100/200 benchmarks rising.
- RTY YSFG above F0%, MSFG/WSFG below F0%; DTrend, 2778.6/2770.7 support, 2943.2 pivot threshold; weekly long benchmarks rising.
- FDAX YSFG/MSFG/WSFG below F0%, benchmarks declining, DTrend; 24897-24925 support, 25593 reversal threshold, 26847 major resistance.
Overall State
- Short-Term: Bearish
- Intermediate-Term: Bearish
- Long-Term: Bullish
Conclusion
ES and NQ remain the relative HTF leaders, holding above YSFG, MSFG, WSFG, rising benchmarks, and UTrend pivots near swing-high resistance. YM, EMD, RTY, and FDAX show aligned short-term downside structures below weekly and monthly grid centers, testing defined pivot supports. Long-term conditions remain mixed: ES/NQ retain broad uptrends; YM, EMD, and RTY retain rising weekly long-horizon benchmarks; FDAX remains below all Fib-grid centers.
Note: Intra-day counter-trend pullbacks or retracements may occur, HTF is context for informational usage and market structure. Glossary: Session Fib Grids periods of YSFG:’Yearly’, MSFG:’Monthly’, WSFG:’Weekly’
For full details visit: AlphaWebTrader Technicals
ES Daily View
Overall Rating
- Short-Term: Bullish
- Intermediate-Term: Bullish
- Long-Term: Bullish.
Key Insights Summary
The daily structure remains broadly constructive: both pivot trend measures are upward, price remains above the weekly, monthly
View charts on: AlphaWebTrader HTF Charts
NQ Daily View
Overall Rating
- Short-Term: Bullish
- Intermediate-Term: Bullish
- Long-Term: Bullish.
Key Insights Summary
The daily structure remains broadly constructive: the late-September low produced a strong V-shaped recovery, higher lows, and a new pivot high at 31616.50. Price is above every benchmark average and all benchmark trends are rising, while the weekly, monthly, and yearly Fib-grid biases remain above F0%. The latest medium red bar reflects a pullback from the 31616.50 high and moderating near-term momentum rather than a confirmed intermediate trend reversal. The 30705 pivot-next level and clustered 20-, 55-, and 100-day averages near 30017.5-30443.5 define the principal technical retracement area, while 31616.50 remains the visible upside swing resistance.
View charts on: AlphaWebTrader HTF Charts
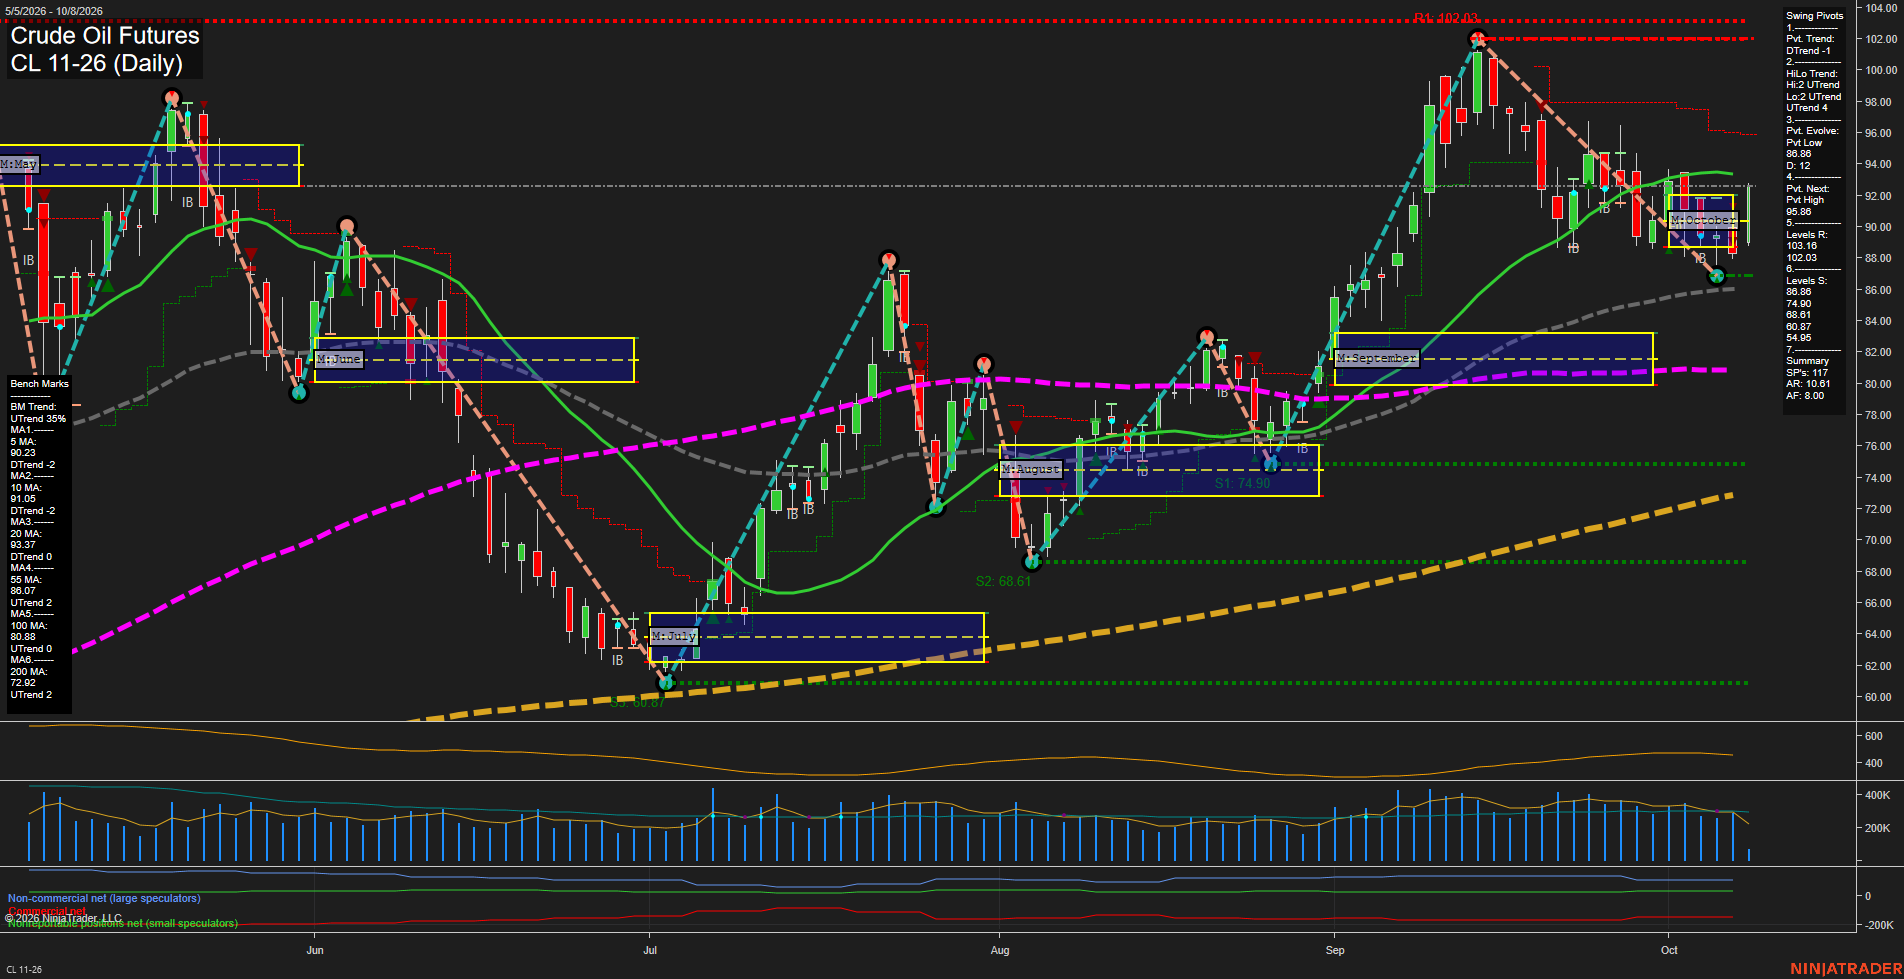
CL Daily View
Overall Rating
- Short-Term: Neutral
- Intermediate-Term: Bullish
- Long-Term: Bullish.
Key Insights Summary
Crude remains in a broader advancing structure, holding above the rising 55-, 100-, and 200-day benchmarks and above the October monthly and 2026 yearly Fib-grid reference areas. The short-term picture is consolidative after the September surge and subsequent retracement from the 102.03 pivot high. Price has formed a lower-high sequence from that peak and the active pivot trend remains down, while the rebound from 86.86 support has restored price above the 5-day average. The 91.05 to 93.37 benchmark area defines a near-term congestion zone, with 95.86 representing the next upside pivot threshold and 86.86 remaining the principal swing support. Volume remains moderate relative to recent activity, while ATR reflects an elevated daily range environment consistent with crude's volatile post-rally consolidation.
View charts on: AlphaWebTrader HTF Charts
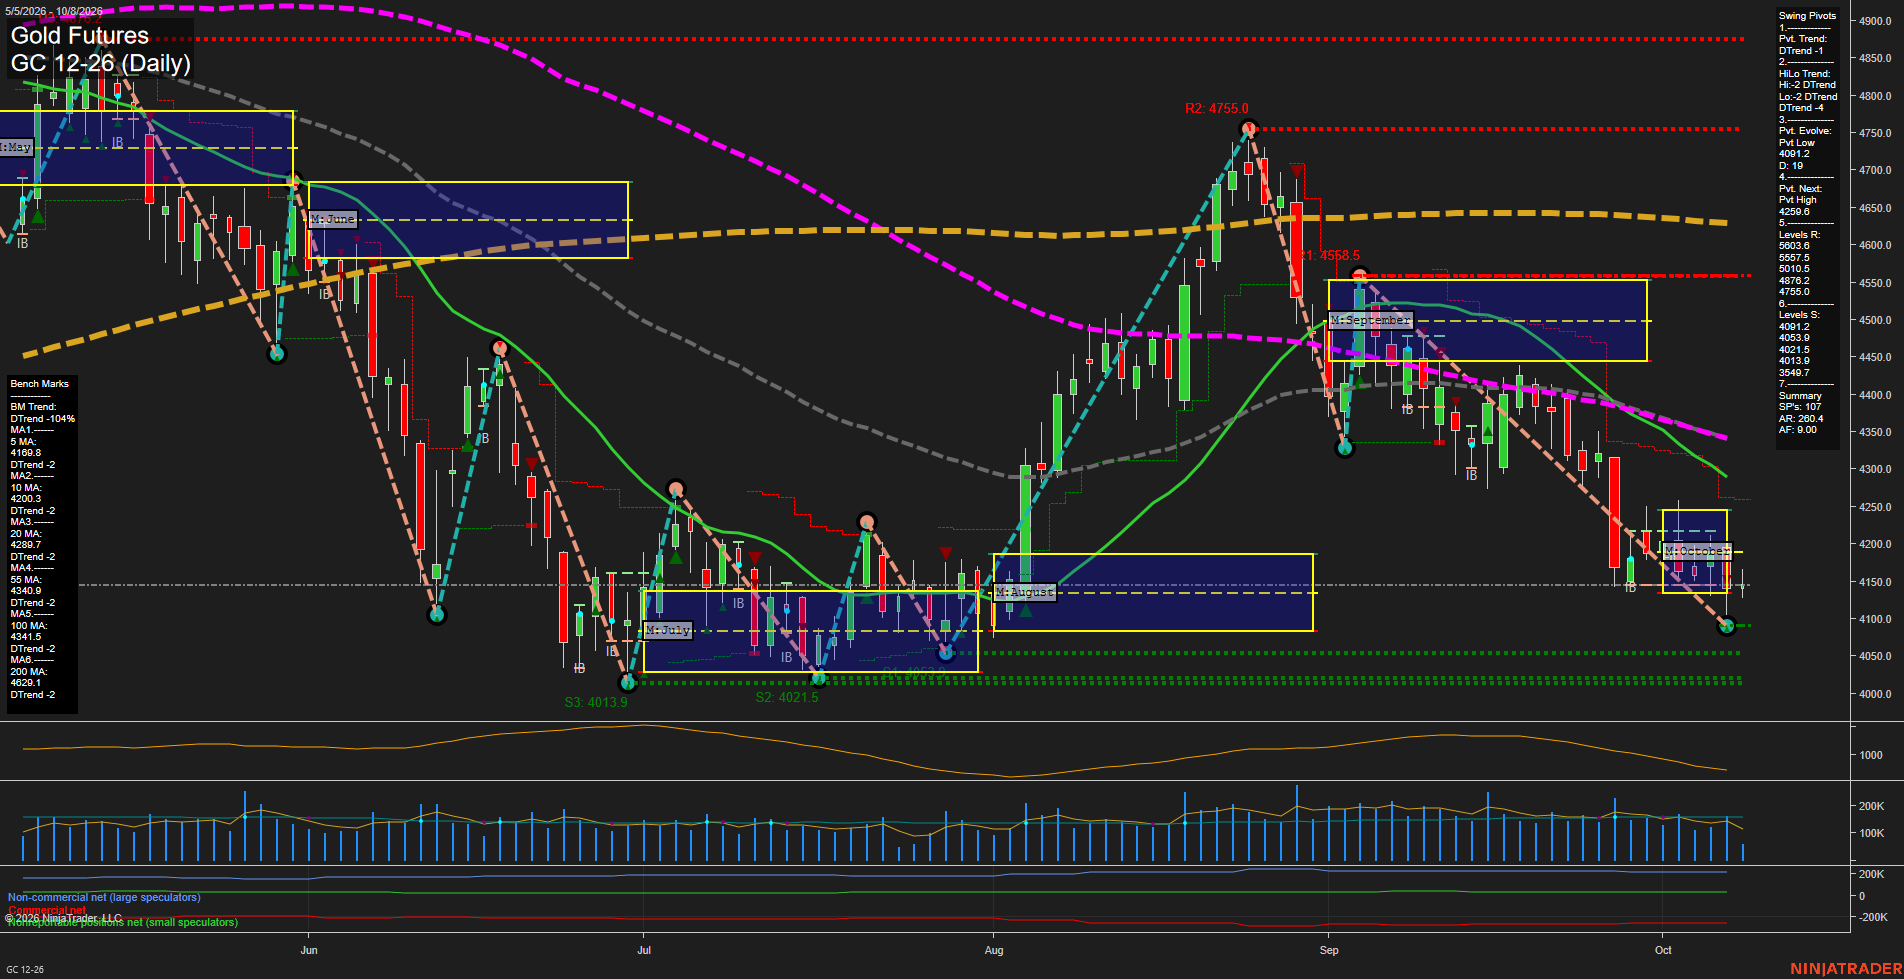
GC Daily View
Overall Rating
- Short-Term: Bearish
- Intermediate-Term: Bearish
- Long-Term: Bearish.
Key Insights Summary
Price is in a fast, high-volatility downswing, holding beneath every daily benchmark and below both the weekly and monthly Fib-grid equilibrium areas. The pivot structure remains bearish across short and intermediate horizons, with lower highs extending from the 4755.0 pivot and price pressing the 4091.2 pivot-low area. The October decline has expanded range and downside momentum, while the 4169.8 to 4259.8 area defines the nearest overhead mean-reversion and pivot-reversal zone. Sustained positioning below the 20-, 55-, 100-, and 200-day averages confirms broad trend alignment to the downside.
View charts on: AlphaWebTrader HTF Charts
ZB Daily View
Overall Rating
- Short-Term: Bearish
- Intermediate-Term: Bearish
- Long-Term: Bearish.
Key Insights Summary
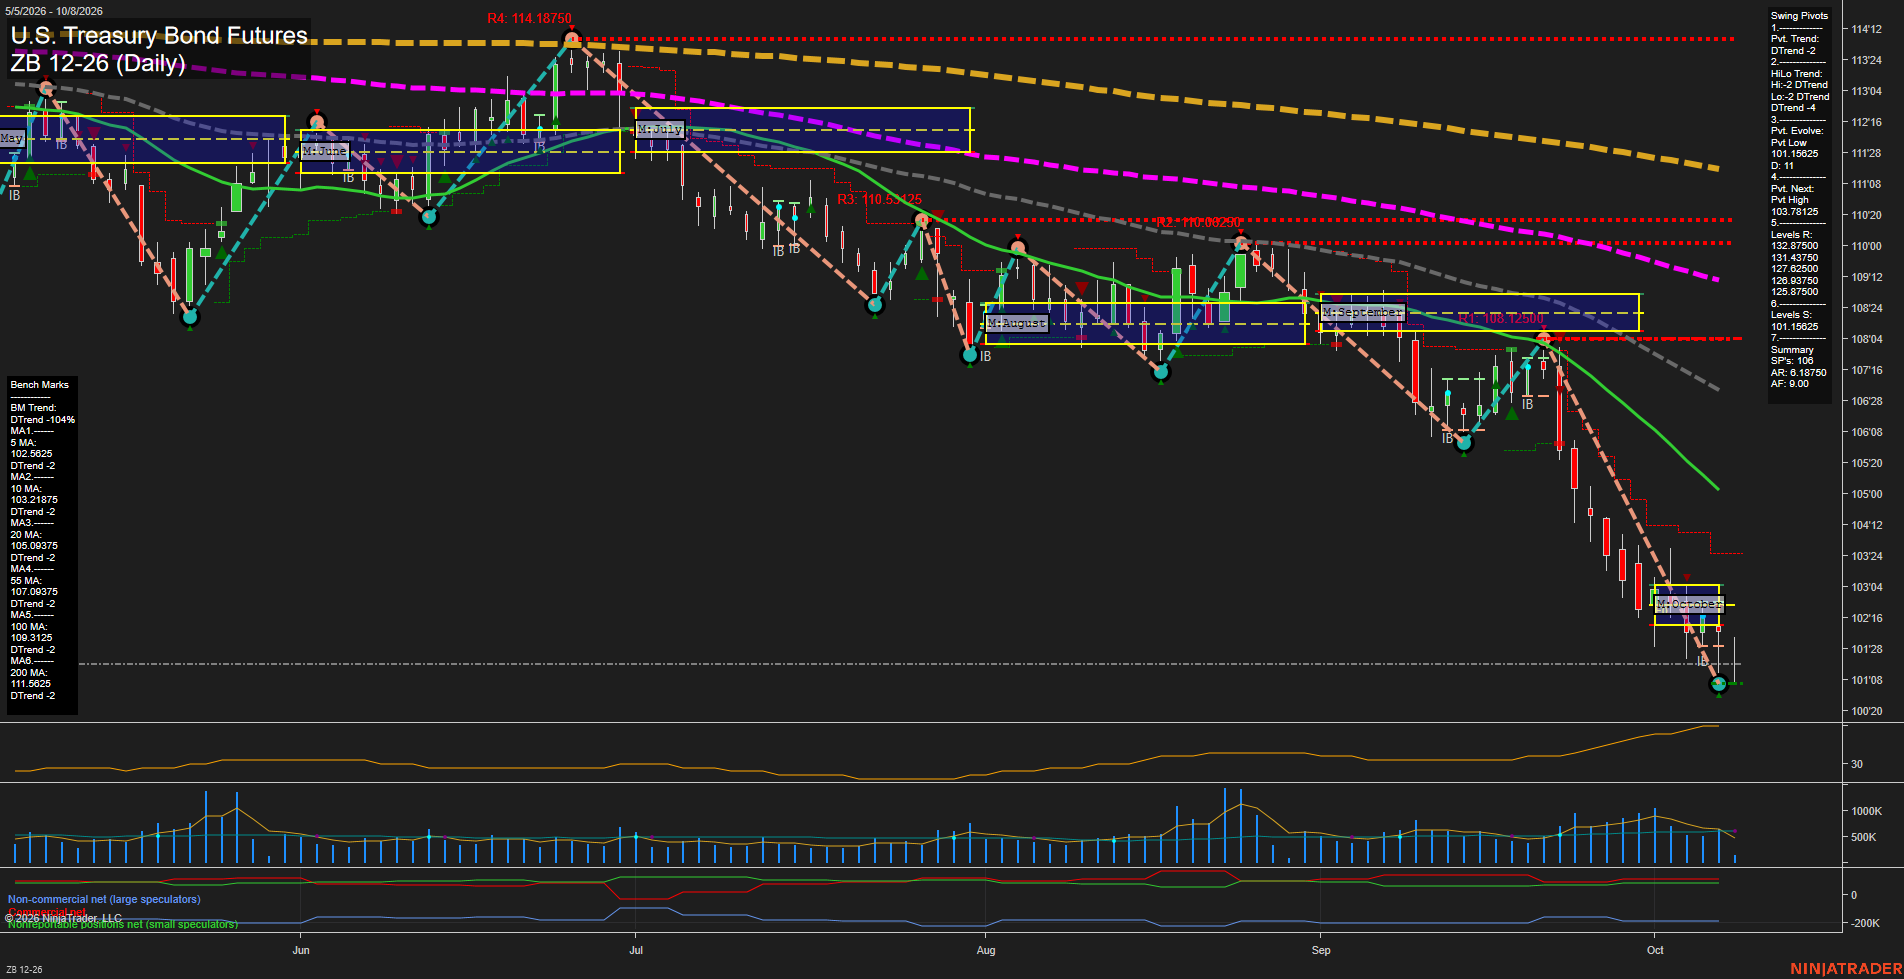
ZB remains in a broad, synchronized decline: price is below every daily benchmark and below the weekly, monthly, and yearly Fib-grid centers. The pivot structure remains DTrend on both the short- and intermediate-term measures, with the latest downswing extending to the 101.15625 pivot-low area. The decline has featured large directional bars, fast downside momentum, rising ATR, and elevated recent volume, reflecting an accelerated selloff rather than a balanced consolidation. The 103.78125 pivot-next level defines the nearest structural upside reversal threshold, while the 5-day and 10-day averages remain overhead and declining. Long-term moving-average separation confirms persistent bearish trend alignment.
View charts on: AlphaWebTrader HTF Charts