Pre-market ETF movers and futures trends show ES and NQ firm, while oil, Treasury yields, AI concerns and consumer data shape broader market sentiment.
Fundamentals: Equity sentiment steadied as lower oil prices supported European shares and helped technology stocks recover, while Japanese markets lagged. Gold and silver rose with a softer dollar and lower yields. Focus remained on volatile Treasury yields, elevated U.S. valuations, AI-sector concerns, energy shipping disruptions and U.S. consumer sentiment and inflation-expectations data.
Technicals: Pre-market conditions show mixed ETF performance, with USO, AAPL and TLT higher in the prior session while IBIT, AMZN and NVDA declined. Futures technical readings remain broadly constructive for ES and NQ despite consolidation near recent highs. YM, EMD, RTY and FDAX retain shorter-term bearish or corrective structures, though several maintain longer-term bullish frameworks.
Pre-Market Trading 360° view Market Radar of: holidays, earnings, eco-news, market-news summary, news sentiment, prior session major ETFs, MAG7, Higher Time Frame Analysis Indices Futures Summary, and E-mini S&P500, Nasdaq 100, NYMEX Crude, Gold Futures Daily Chart analysis.
As of: October 9, 2026 07:16 CT
Earnings Radar
Monitoring for earnings releases by the Magnificent 7, AI-tech-related firms, and major financial institutions.
- BAC Release: 2026-10-14 T:BMO
- MS Release: 2026-10-14 T:BMO
- C Release: 2026-10-13 T:BMO
- GS Release: 2026-10-13 T:BMO
- JPM Release: 2026-10-13 T:BMO
- WFC Release: 2026-10-13 T:BMO
Conclusion: JPM, GS, C, and WFC report before market open on Oct. 13, followed by BAC and MS before market open on Oct. 14. This concentrated U.S. bank earnings window places financial-sector results, trading activity, credit trends, and net-interest-income commentary at the center of broad index futures sensitivity.
For full details visit: Yahoo Earnings Calendar
EcoNews Radar U.S. Events
| Day | Time | Impact | Event |
|---|---|---|---|
| Fri | 10:00 | Medium | Prelim UoM Consumer Sentiment |
| Fri | 10:00 | Medium | Prelim UoM Inflation Expectations |
EcoNews Summary
No qualifying high-impact EcoNews events are listed. The listed medium-impact consumer sentiment and inflation-expectations releases are excluded because they do not relate to oil, crude inventories, energy prices, or petroleum supply.
Event Notes:
- No qualifying events listed.
Conclusion:
No qualifying EcoNews event is listed for the week; therefore, no single most important day or event applies.
For full details visit: Forex Factory EcoNews
Market News Summary:
Equity sentiment steadied as oil eased, while elevated yields, AI-sector sensitivity, and stretched valuations remained key cross-currents.
Primary Drivers & Risks:
- Primary Driver: Oil-price relief supports equities
- Primary Risk: Rising yields and AI fragility
Tone:
Mixed, with a modest risk-on recovery tempered by macro and valuation concerns.
Stock Market / ETFs / Indices:
European stocks recovered as oil prices declined, while Japanese equities fell 1.1% amid weakness in chip and metals shares. Technology shares rebounded with lower oil prices, but AI-related stocks remained sensitive following questions around OpenAI revenue and broader concerns over AI investment. The S&P 500 bull market approached its fourth anniversary, while the September Crestmont P/E stood at a historical extreme.
Geopolitical:
President Trump said the U.S. would not attack Iran before the November midterm elections, easing immediate Middle East supply concerns. Risks to shipping persisted as Iran-related conflict continued to affect maritime crude flows.
Oil / Energy:
Oil fell after comments on Iran talks eased near-term supply fears, supporting European equity sentiment. Prices remained elevated amid Gulf supply outages, while record tanker freight rates threatened Asian demand for U.S. crude and shifted refinery sourcing toward other regions.
Gold / Metals:
Gold and silver rebounded as the dollar weakened and yields softened. Gold also drew support from reported ETF inflows and expectations of continued Chinese central-bank demand.
Fed / Financials:
Rapid Treasury-yield moves were characterized as a financial-market shock risk. September payrolls missed expectations, and markets viewed the report as reducing the odds of additional rate hikes, though commentary also highlighted persistent upward pressure on rates. French government bonds faced renewed selling pressure versus German Bunds, and the Financial Stability Board cited gaps in emergency liquidity arrangements for failing banks.
Macro / Other:
Asian currencies consolidated ahead of U.S. data. U.S. fiscal concerns remained prominent as the 2026 federal deficit approached $2 trillion, while China’s tax crackdown and softer U.S. spending added pressure to luxury demand.
Conclusion:
Lower oil prices supported European equities and helped revive technology shares. Gold strengthened alongside a softer dollar and lower yields.
Elevated bond yields, extreme U.S. equity valuation measures, and AI-trade vulnerability remained restraints on sentiment. Energy supply, freight disruptions, European sovereign spreads, and fiscal concerns added cross-market risk.
Market News Sentiment
Market News Articles: 34
- Neutral: 52.94%
- Negative: 32.35%
- Positive: 14.71%
Sentiment Summary: Market news sentiment is predominantly neutral (53%), with negative coverage (32%) exceeding positive coverage (15%).
Conclusion: Indices futures traders face a neutral overall news tone with a notable negative skew relative to positive headlines.
GLD,Gold Articles: 13
- Positive: 76.92%
- Negative: 15.38%
- Neutral: 7.69%
Sentiment Summary: Gold-related coverage is predominantly positive (77%), with 15% negative and 8% neutral sentiment across 13 articles.
Conclusion: The strong positive tone in gold coverage indicates a defensive-market sentiment signal that indices futures day traders may monitor alongside broader risk indicators.
USO,Oil Articles: 13
- Negative: 53.85%
- Neutral: 23.08%
- Positive: 23.08%
Sentiment Summary: USO/Oil coverage is predominantly negative at 54%, with neutral and positive articles each at 23%.
Conclusion: Oil-related news tone is net negative, which may be relevant context for indices futures traders monitoring energy-sector sentiment.
Market Data Snapshot
ETF Snapshot of major stock market ETFs, Mag7, and others as of: October 9, 2026 07:16
Top Movers & Losers
- USO 147.58 Bullish 2.55% ▲
- AAPL 340.42 Bullish 1.11% ▲
- TLT 77.87 Bullish 0.94% ▲
- IBIT 46.26 Bearish -2.01% ▼
- AMZN 254.06 Bearish -2.25% ▼
- NVDA 230.48 Bearish -2.94% ▼
Major Index ETFs: SPY, QQQ, DIA, IWM, IJH
- IJH 73.03 Bullish 0.37% ▲
- DIA 511.65 Bullish 0.12% ▲
- IWM 277.57 Bearish -0.05% ▼
- SPY 773.93 Bearish -0.42% ▼
- QQQ 747.58 Bearish -1.34% ▼
Major index ETFs are Mixed: IJH is the most bullish mover at +0.37%, followed by DIA at +0.12%. QQQ is the most bearish mover at -1.34%, while SPY is Bearish at -0.42%. IWM is marginally Bearish and near-flat at -0.05%.
Mag 7 Stocks: AAPL, MSFT, GOOG, AMZN, META, NVDA, TSLA
- AAPL 340.42 Bullish 1.11% ▲
- META 720.89 Bearish -0.06% ▼
- GOOG 344.86 Bearish -0.72% ▼
- TSLA 375.00 Bearish -0.74% ▼
- MSFT 522.61 Bearish -1.35% ▼
- AMZN 254.06 Bearish -2.25% ▼
- NVDA 230.48 Bearish -2.94% ▼
Mag7 breadth is Bearish, with AAPL the most bullish mover at +1.11%. META is marginally Bearish at -0.06%, while GOOG -0.72%, TSLA -0.74%, MSFT -1.35%, and AMZN -2.25% show broader Bearish pressure. NVDA is the most bearish mover at -2.94%.
Cross-Market ETFs: TLT, GLD, USO, IBIT
- USO 147.58 Bullish 2.55% ▲
- TLT 77.87 Bullish 0.94% ▲
- GLD 378.62 Bullish 0.73% ▲
- IBIT 46.26 Bearish -2.01% ▼
Cross-market conditions are Mixed: USO is the most bullish mover at +2.55%, while IBIT is the most bearish mover at -2.01%. TLT and GLD are also Bullish, up +0.94% and +0.73%, respectively.
ETF, Mag7, and Cross-Market ETF Insights
Overall Tone
Mixed conditions: broad large-cap technology weakness contrasts with Bullish energy, Treasury, and gold moves.
Equity ETFs and Mag7:
Major Index ETFs were Mixed, with IJH +0.37% and DIA +0.12% offset by SPY -0.42%, QQQ -1.34%, and marginal IWM -0.05%. Mag7 action was selective and Bearish overall: AAPL led gains at +1.11%, while NVDA was the most bearish mover at -2.94%; AMZN -2.25%, MSFT -1.35%, TSLA -0.74%, GOOG -0.72%, and marginal META -0.06% also declined. Leadership was concentrated in AAPL and mid-caps rather than broadly aligned across equities.
Cross-Market ETFs:
Cross-market ETFs were Mixed, led by USO as the most bullish mover at +2.55%, with TLT +0.94% and GLD +0.73% also Bullish. IBIT was the most bearish mover at -2.01%, diverging from strength in energy, Treasuries, and gold.
Futures Indices – Higher Time Frame Analysis
Summary of the current state of US Indices Futures based on higher time-frame (HTF) technical analysis as of: 2026-10-09: 07:16 CT.
US Indices Futures
- ES YSFG/MSFG/WSFG up, rising benchmarks beneath price, UTrend pivots, 7906.25 resistance, 7745.00/7672.75 support.
- NQ YSFG/MSFG/WSFG up, benchmarks rising beneath price, UTrend pivots, 31689.25 resistance, 30898.50/29330.50 support.
- YM grids above F0%, short-term DTrend below fast benchmarks, 53253/52842 resistance, 50859/50568 support.
- EMD MSFG/YSFG up, WSFG below F0%, bearish pivots and fast benchmarks, 3797.3/3896.8 resistance, 3600.3 support.
- RTY YSFG up, MSFG/WSFG below F0%, DTrend beneath benchmarks, 2943.2/3003.3 resistance, 2778.6/2768.4 support.
- FDAX MSFG/YSFG above F0%, WSFG below F0%, bearish pivots and fast benchmarks, 25585/25990 resistance, 24925/24897 support.
Overall State
- Short-Term: Bearish
- Intermediate-Term: Neutral
- Long-Term: Bullish
Conclusion
ES and NQ retain synchronized YSFG, MSFG, and WSFG advances, rising benchmark alignment, and UTrend pivot structures near swing-high resistance. YM, EMD, RTY, and FDAX remain in short-term corrective structures, with declining fast benchmarks, DTrend pivots, and weekly-grid weakness. Their monthly and yearly grids, longer benchmark alignment, and higher-order structures generally retain broader upward context. Index direction is split between ES/NQ strength and corrective pressure across YM, EMD, RTY, and FDAX; recent signals reflect two-way activity near defined pivot and support/resistance levels.
Note: Intra-day counter-trend pullbacks or retracements may occur, HTF is context for informational usage and market structure. Glossary: Session Fib Grids periods of YSFG:’Yearly’, MSFG:’Monthly’, WSFG:’Weekly’
For full details visit: AlphaWebTrader Technicals
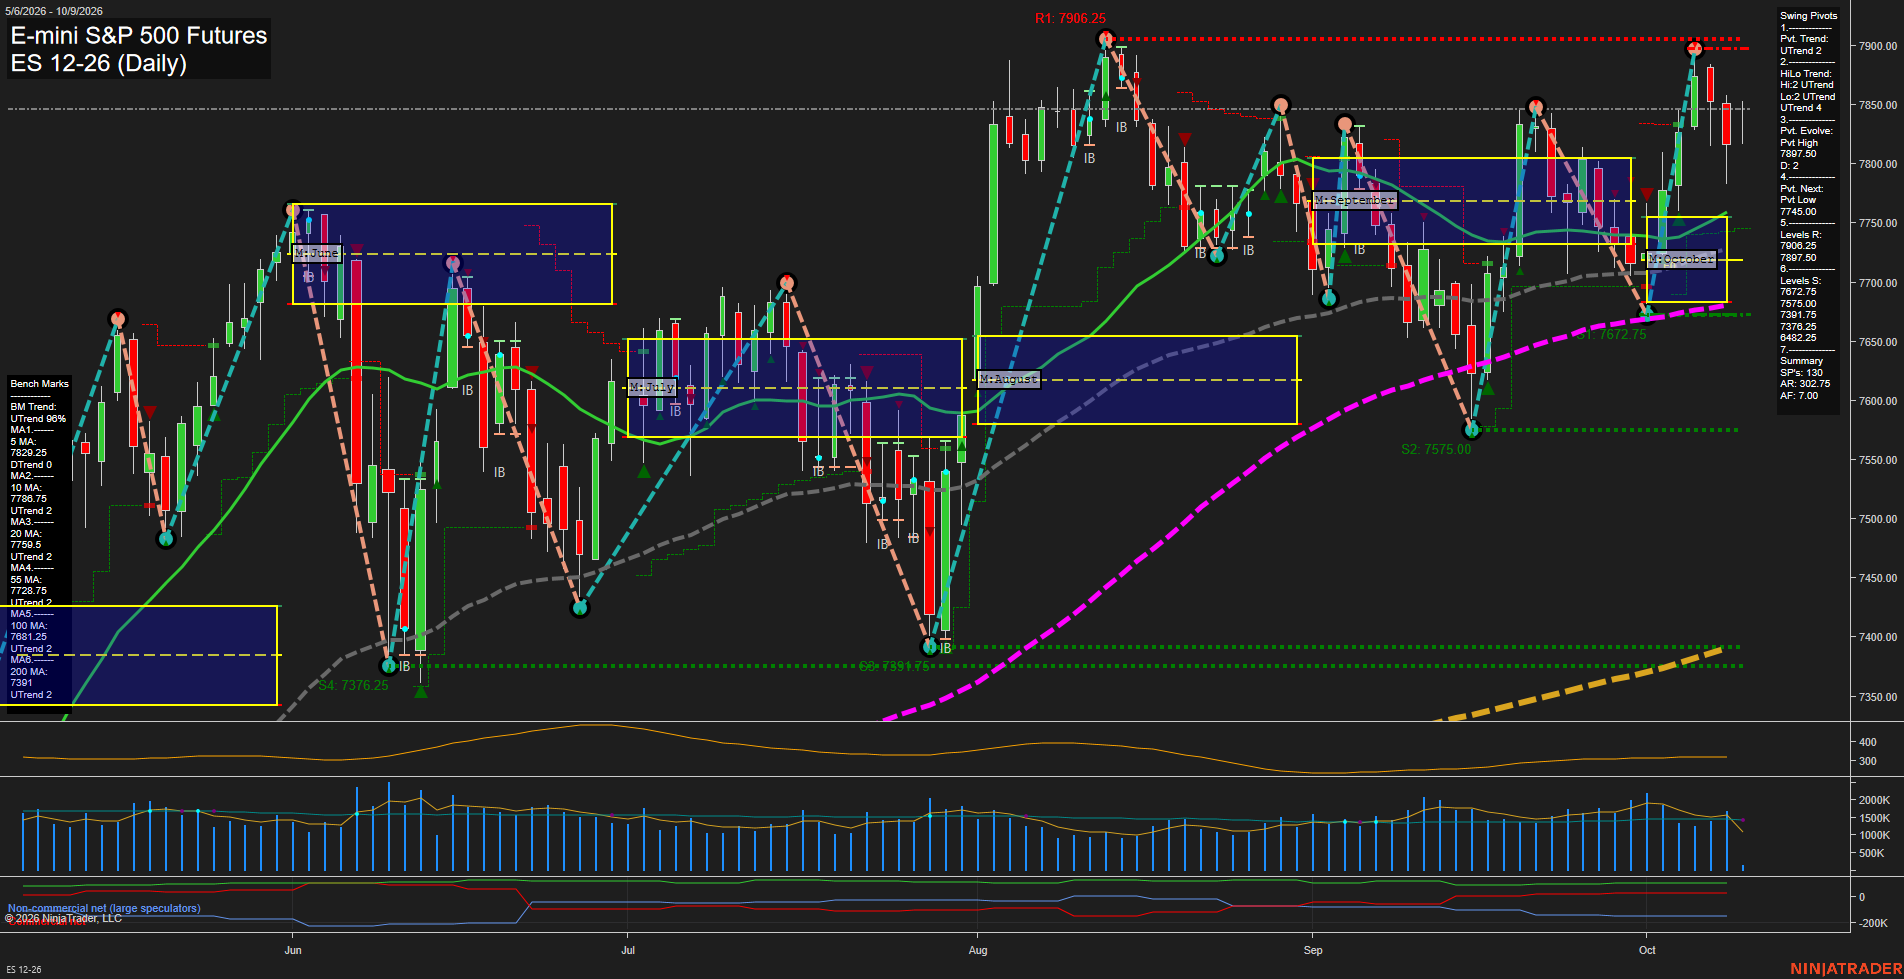
ES Daily View
Overall Rating
- Short-Term: Neutral
- Intermediate-Term: Bullish
- Long-Term: Bullish.
Key Insights Summary
ES remains structurally upward across the weekly, monthly, and yearly fib grids, with all six benchmark averages rising and stacked beneath price. The latest swing sequence established a 7897.00 pivot high and a nearby 7906.25 resistance zone, followed by a medium-sized pullback that places short-term momentum in consolidation rather than a clean continuation phase. Price remains above the 10-, 20-, and 55-day benchmarks, preserving the intermediate higher-low structure, while 7745.00 is the active opposite-pivot level and 7672.75 is the larger support reference. Elevated ATR near 319 reflects a wide daily swing environment, and the recent short-term signal contrasts with the broader bullish benchmark and fib-grid alignment.
View charts on: AlphaWebTrader HTF Charts
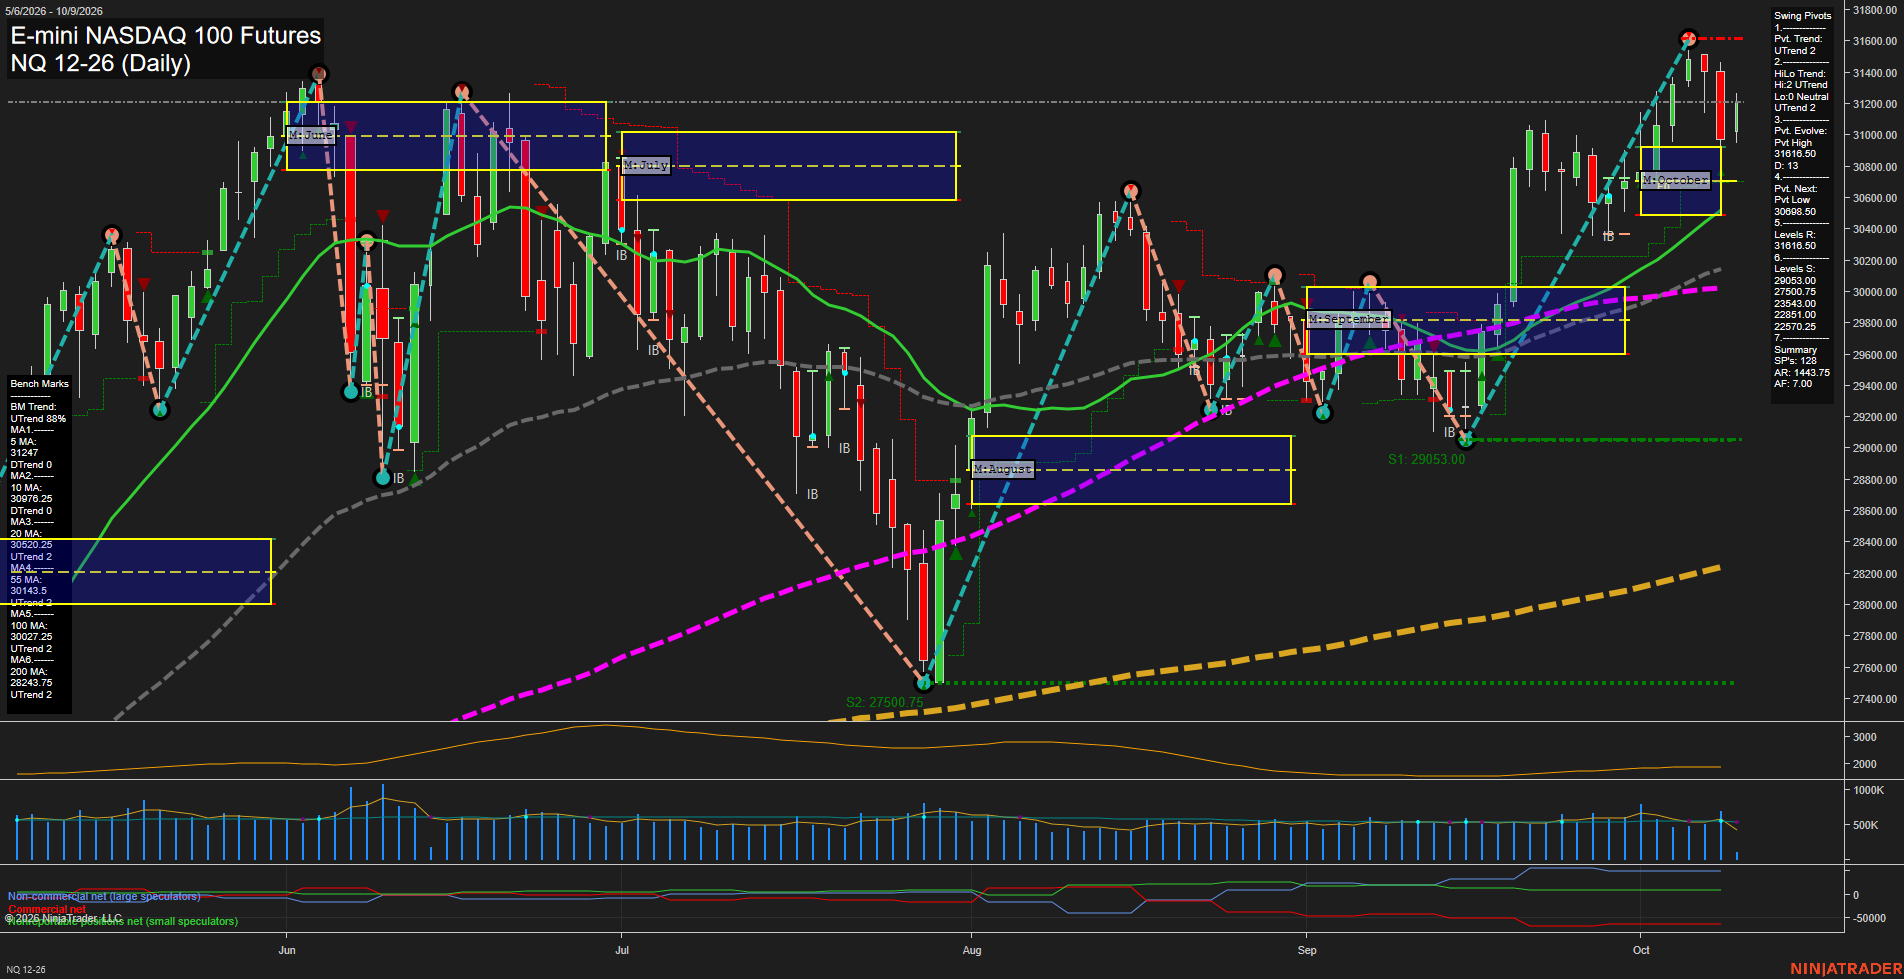
NQ Daily View
Overall Rating
- Short-Term: Bullish
- Intermediate-Term: Bullish
- Long-Term: Bullish.
Key Insights Summary
NQ remains in a broad multi-timeframe advance, with price above the weekly, monthly, and yearly F0% references and above the rising 20-, 55-, 100-, and 200-day benchmarks. The short-term structure is constructive but mixed: price is slightly below the rising 5-day average while remaining above the 10-day average, following a pullback from the 31616.50 pivot-high resistance. The current swing sequence retains higher lows and an UTrend pivot structure, while 30898.50 defines the next pivot-low reversal reference. Recent medium-range bars and elevated ATR reflect active two-way price discovery beneath the prior high rather than a completed trend failure.
View charts on: AlphaWebTrader HTF Charts
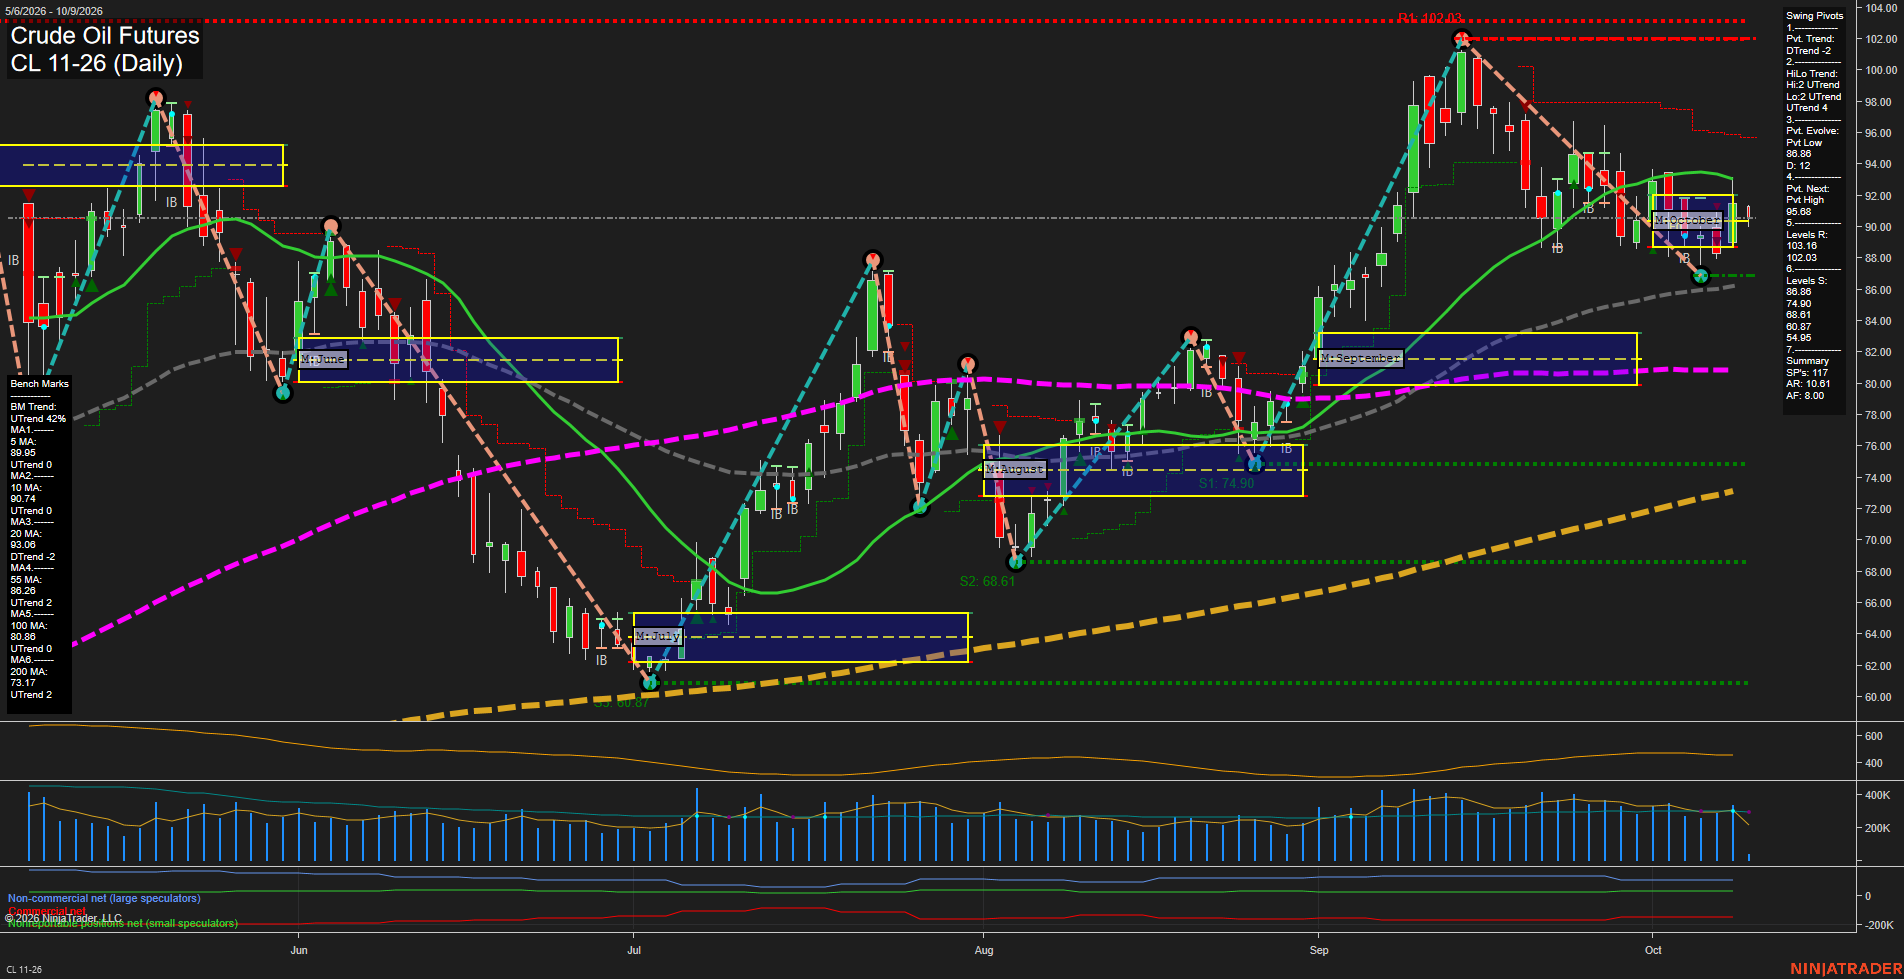
CL Daily View
Overall Rating
- Short-Term: Bearish
- Intermediate-Term: Bullish
- Long-Term: Bullish.
Key Insights Summary
Price is consolidating near 90 following a sharp September advance and a retracement from the 102.03 pivot high. The short-term pivot structure remains in a DTrend and price is below the weekly F0% area, while small daily bars reflect slowed downside momentum and range-bound trade above the 86.86 pivot-low support. Intermediate and long-term structure remains constructive: price holds above the rising 55-, 100-, and 200-day benchmarks, the monthly grid remains positive, and the HiLo pivot trend is still upward. Near-term action is defined by the 86.86 support and 95.68 pivot-reversal level, with major overhead swing resistance at 102.03 and 103.16.
View charts on: AlphaWebTrader HTF Charts
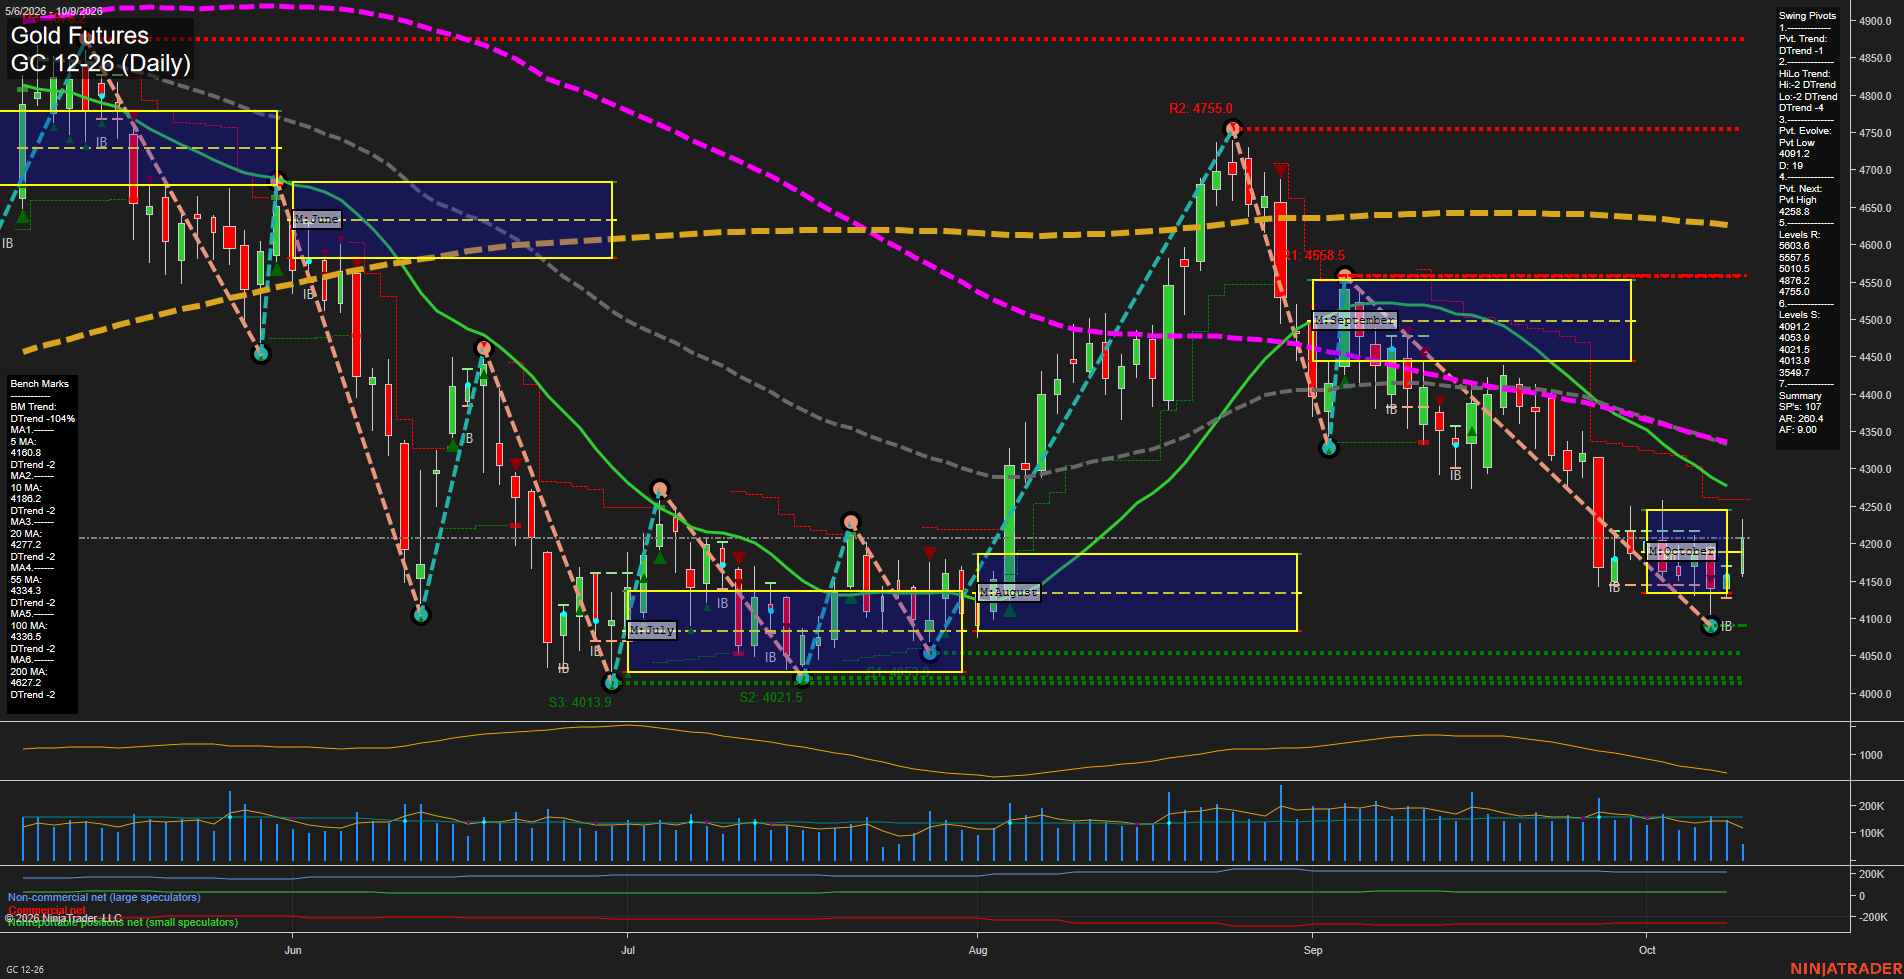
GC Daily View
Overall Rating
- Short-Term: Bearish
- Intermediate-Term: Bearish
- Long-Term: Bearish.
Key Insights Summary
Price is holding just above the October monthly F0% area and the weekly grid remains positive, but the broader swing structure remains bearish. The current 4091.2 pivot low produced a sharp rebound toward 4200, yet price remains below the declining 10-, 20-, 55-, 100-, and 200-day benchmarks. The 4258.8 pivot-next level defines the nearby reversal threshold, while 4091.2 and the clustered 4053.9 to 4013.9 supports mark the lower swing range. Elevated ATR reflects a volatile, choppy countertrend bounce within a larger decline from the August 4755.0 swing high.
View charts on: AlphaWebTrader HTF Charts
ZB Daily View
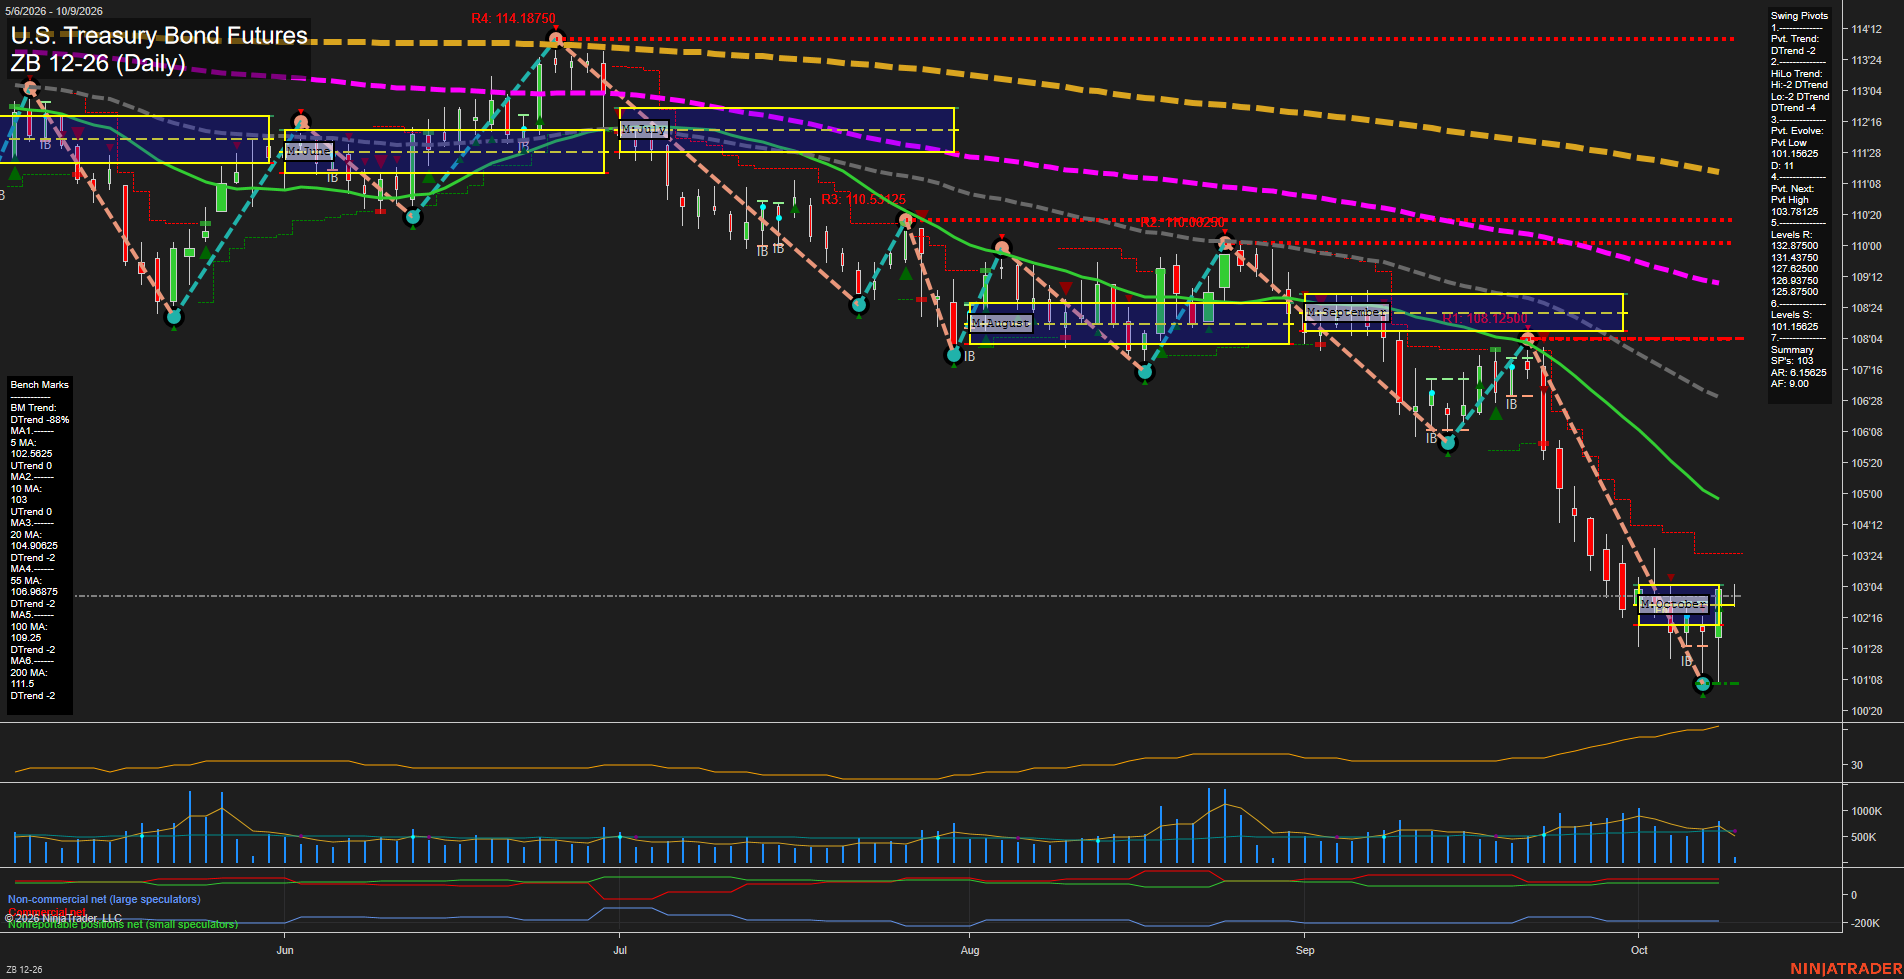
Overall Rating
- Short-Term: Neutral
- Intermediate-Term: Bearish
- Long-Term: Bearish.
Key Insights Summary
ZB remains in a broad daily-chart decline, confirmed by DTrend readings in both pivot structures and price trading beneath the 20-, 55-, 100-, and 200-day benchmarks. The sharp September-to-October selloff reached a new pivot low at 101.15625, followed by a small-bar stabilization and rebound toward 103'00. This creates a short-term recovery phase above the weekly and monthly F0% areas, while the larger trend remains lower. The next pivot reversal threshold is 103.78125; until that level is exceeded, the rebound reads as a counter-trend base within a bearish intermediate and long-term structure. Expanding ATR and recently elevated volume reflect an active volatility regime following the decline.
View charts on: AlphaWebTrader HTF Charts