US index futures hold near flat after a record S&P 500 week, with CPI, bank earnings, Treasury yields, credit stress and oil risks in focus.
Fundamentals: Index futures were modestly higher following a record-setting S&P 500 week, with September CPI, PPI data and third-quarter bank earnings drawing attention. Elevated Treasury yields, signs of credit-market stress and inflation concerns remain key constraints, while AI investment supports equity expectations. Oil eased, but Middle East tensions and Hormuz-related supply risks remain active.
Technicals: US index futures enter the NYSE pre-market with ES holding a broadly bullish multi-timeframe structure near resistance and NQ maintaining longer-term strength despite daily consolidation. YM has recovered on the daily chart but remains mixed weekly, while EMD, RTY and FDAX show varying degrees of corrective pressure. Prior-session ETF movers included gains in AMZN, MSFT and TSLA, while AAPL and NVDA declined.
Pre-Market Trading 360° view Market Radar of: holidays, earnings, eco-news, market-news summary, news sentiment, prior session major ETFs, MAG7, Higher Time Frame Analysis Indices Futures Summary, and E-mini S&P500, Nasdaq 100, NYMEX Crude, Gold Futures Daily Chart analysis.
As of: October 12, 2026 07:16 CT
Earnings Radar
Monitoring for earnings releases by the Magnificent 7, AI-tech-related firms, and major financial institutions.
- BAC Release: 2026-10-14 T:BMO
- MS Release: 2026-10-14 T:BMO
- C Release: 2026-10-13 T:BMO
- GS Release: 2026-10-13 T:BMO
- JPM Release: 2026-10-13 T:BMO
- WFC Release: 2026-10-13 T:BMO
Conclusion: Major U.S. bank earnings begin before market open on Oct. 13 with C, GS, JPM and WFC, followed by BAC and MS on Oct. 14. The concentrated financial-sector reporting window places bank results, net interest income, credit trends, capital-markets activity and guidance at the center of broad index-futures price discovery and sector rotation.
For full details visit: Yahoo Earnings Calendar
EcoNews Radar U.S. Events
| Day | Time | Impact | Event |
|---|---|---|---|
| Wed | 08:30 | High | Core CPI m/m |
| Wed | 08:30 | High | Core CPI y/y |
| Wed | 08:30 | High | CPI m/m |
| Wed | 08:30 | High | CPI y/y |
| Thu | 08:30 | High | Core PPI m/m |
| Thu | 08:30 | High | Core Retail Sales m/m |
| Thu | 08:30 | High | PPI m/m |
| Thu | 08:30 | High | Retail Sales m/m |
| Thu | 08:30 | Medium | Philly Fed Manufacturing Index |
| Thu | 08:30 | Medium | Unemployment Claims |
| Thu | 12:00 | Low | Crude Oil Inventories |
| Thu | 23:30 | High | Fed Chairman Warsh Speaks |
EcoNews Summary
Wednesday and Thursday feature clustered high-impact U.S. releases centered on consumer inflation, producer inflation, consumer spending, and Federal Reserve communication. The 08:30 release windows concentrate several major data points, creating a dense economic-news calendar for index futures markets. Momentum and volume often slow ahead of Wednesday’s major inflation release, with increased volatility at release time.
Event Notes:
- Wednesday 08:30 Consumer Inflation, Core and Headline m/m and y/y: Measures monthly and annual changes in consumer prices, both excluding and including food and energy. Traders monitor these releases for inflation conditions and their relevance to interest-rate expectations.
- Thursday 08:30 Core Producer Inflation m/m: Measures monthly price changes received by producers, excluding food and energy. It is monitored as an indicator of underlying pipeline inflation.
- Thursday 08:30 Producer Inflation m/m: Measures monthly changes in prices received by domestic producers. Traders monitor it for producer-level inflation pressure.
- Thursday 08:30 Core Retail Sales m/m: Measures monthly changes in retail spending excluding selected volatile categories. It is monitored as a gauge of underlying consumer demand.
- Thursday 08:30 Retail Sales m/m: Measures monthly change in retail purchases. Traders monitor it for consumer-spending activity, a major component of economic demand.
- Thursday 23:30 Fed Chairman Warsh Speaks: Public remarks from the Federal Reserve Chairman. Traders monitor comments for information on monetary-policy views, inflation, economic conditions, and interest rates.
Conclusion:
The single most important event is Wednesday at 08:30, the U.S. consumer inflation release covering core and headline monthly and annual readings. Its broad relevance to inflation and monetary-policy conditions places it at the center of the week’s scheduled EcoNews calendar.
For full details visit: Forex Factory EcoNews
Market News Summary:
Index futures are near flat after a record-setting S&P 500 week, with CPI, bond yields, and third-quarter bank earnings in focus.
Primary Drivers & Risks:
- Primary Driver: CPI and earnings calendar
- Primary Risk: High yields and credit stress
Tone:
Cautiously constructive, with elevated macro sensitivity.
Stock Market / ETFs / Indices:
S&P 500 and Nasdaq 100 futures were modestly higher while Dow futures also edged up, reflecting positioning ahead of a heavy data and earnings week. The S&P 500 ended near its record high, supported by large-cap AI spending and stronger earnings-growth expectations. Commentary also cited choppy daily technical conditions, valuation pressure from higher rates, and concern that equity investors have become complacent.
Oil / Energy:
Oil declined as Russia-Ukraine energy ceasefire comments and prospects for additional Russian diesel eased fuel-shortage concerns. Supply risks remain centered on Hormuz disruptions, regional military activity, tight shipping conditions, and Brent’s elevated level; Gulf production recovery also featured in crude-market coverage.
Gold / Metals:
Gold rose alongside the oil pullback, while physically backed gold ETFs recorded $31 billion of third-quarter inflows. Chinese buying has been supported by central-bank diversification and weak domestic property and equity markets. Higher U.S. yields, a firm dollar, CPI data, and Fed-tightening concerns remain constraints for bullion and silver.
Fed / Financials:
Cleveland Fed President Beth Hammack cited business pricing power and economic resilience as signs that rates have not yet sufficiently restrained inflation. Treasury-market attention centers on elevated yields, including five-year yields near 5%, while reports highlight stress in credit markets, 7.5% mortgage rates, and commercial mortgage-backed securities delinquencies above 8%. AI-related borrowing by hyperscalers, data centers, and chip companies is increasing corporate-credit concentration.
Macro / Other:
September CPI and PPI releases are key near-term inflation events. Rising Middle East tensions have supported safe-haven demand for the U.S. dollar and remain tied to energy-market risk.
Conclusion:
Near-record equity levels, the start of bank earnings, and inflation data define the immediate index-futures backdrop. AI investment remains a central support for the broader bull market.
Elevated bond yields, credit-market deterioration, and inflation persistence remain major cross-currents. Lower oil prices reduce one immediate pressure point, while Middle East and Hormuz risks keep energy uncertainty active.
Market News Sentiment
Market News Articles: 20
- Neutral: 70.00%
- Positive: 20.00%
- Negative: 10.00%
Sentiment Summary: Market news sentiment is predominantly neutral at 70%, with 20% positive and 10% negative coverage.
Conclusion: The news backdrop for index futures is broadly neutral, with positive coverage exceeding negative coverage.
GLD,Gold Articles: 5
- Positive: 60.00%
- Negative: 40.00%
Sentiment Summary: Gold-related coverage is moderately positive, with 60% positive and 40% negative articles across five items.
Conclusion: The tone is mixed but tilted positive, indicating limited risk-off support for indices futures sentiment.
USO,Oil Articles: 4
- Neutral: 50.00%
- Negative: 25.00%
- Positive: 25.00%
Sentiment Summary: USO and oil coverage is neutral overall, with 50% neutral, 25% negative, and 25% positive articles.
Conclusion: The balanced positive and negative distribution indicates no clear directional sentiment bias from the available oil-related coverage.
Market Data Snapshot
ETF Snapshot of major stock market ETFs, Mag7, and others as of: October 12, 2026 07:16
Top Movers & Losers
- AMZN 262.43 Bullish 3.29% ▲
- MSFT 535.07 Bullish 2.38% ▲
- TSLA 382.70 Bullish 2.05% ▲
- META 718.67 Bearish -0.31% ▼
- NVDA 229.28 Bearish -0.52% ▼
- AAPL 336.64 Bearish -1.11% ▼
Major Index ETFs: SPY, QQQ, DIA, IWM, IJH
- DIA 516.11 Bullish 0.87% ▲
- SPY 778.57 Bullish 0.60% ▲
- IJH 73.43 Bullish 0.55% ▲
- QQQ 751.27 Bullish 0.49% ▲
- IWM 278.94 Bullish 0.49% ▲
Major Index ETFs are Bullish across the group: DIA is the most bullish mover at +0.87%, followed by SPY at +0.60% and IJH at +0.55%. QQQ and IWM are the least positive movers, each at +0.49%.
Mag 7 Stocks: AAPL, MSFT, GOOG, AMZN, META, NVDA, TSLA
- AMZN 262.43 Bullish 3.29% ▲
- MSFT 535.07 Bullish 2.38% ▲
- TSLA 382.70 Bullish 2.05% ▲
- GOOG 347.86 Bullish 0.87% ▲
- META 718.67 Bearish -0.31% ▼
- NVDA 229.28 Bearish -0.52% ▼
- AAPL 336.64 Bearish -1.11% ▼
Mag7 is Mixed: AMZN is the most bullish mover at +3.29%, followed by MSFT at +2.38% and TSLA at +2.05%. GOOG adds a smaller Bullish move of +0.87%. AAPL is the most bearish mover at -1.11%, with NVDA at -0.52% and META modestly Bearish at -0.31%.
Cross-Market ETFs: TLT, GLD, USO, IBIT
- GLD 384.58 Bullish 1.57% ▲
- IBIT 46.55 Bullish 0.63% ▲
- USO 148.20 Bullish 0.42% ▲
- TLT 77.98 Bullish 0.14% ▲
Other ETFs are Bullish across the snapshot: GLD is the most bullish mover at +1.57%, followed by IBIT at +0.63% and USO at +0.42%. TLT is the least positive mover, marginally Bullish at +0.14%.
ETF, Mag7, and Cross-Market ETF Insights
Overall Tone
Bullish overall tone, led by strong AMZN participation while Mag7 performance remains Mixed.
Equity ETFs and Mag7:
Major Index ETFs were broadly Bullish: DIA led at +0.87%, followed by SPY at +0.60% and IJH at +0.55%, while QQQ and IWM were the least positive at +0.49%. Mag7 leadership was selective, with AMZN the most bullish mover at +3.29%, ahead of MSFT at +2.38% and TSLA at +2.05%. META fell -0.31%, NVDA declined -0.52%, and AAPL was the most bearish mover at -1.11%.
Cross-Market ETFs:
Cross-market ETFs were broadly Bullish alongside equities, with GLD the most bullish mover at +1.57%, exceeding IBIT at +0.63% and USO at +0.42%. TLT was marginally positive at +0.14% and the least positive mover, while strength in GLD showed notable divergence from the more moderate gains in index ETFs.
Futures Indices – Higher Time Frame Analysis
Summary of the current state of US Indices Futures based on higher time-frame (HTF) technical analysis as of: 2026-10-12: 07:16 CT.
US Indices Futures
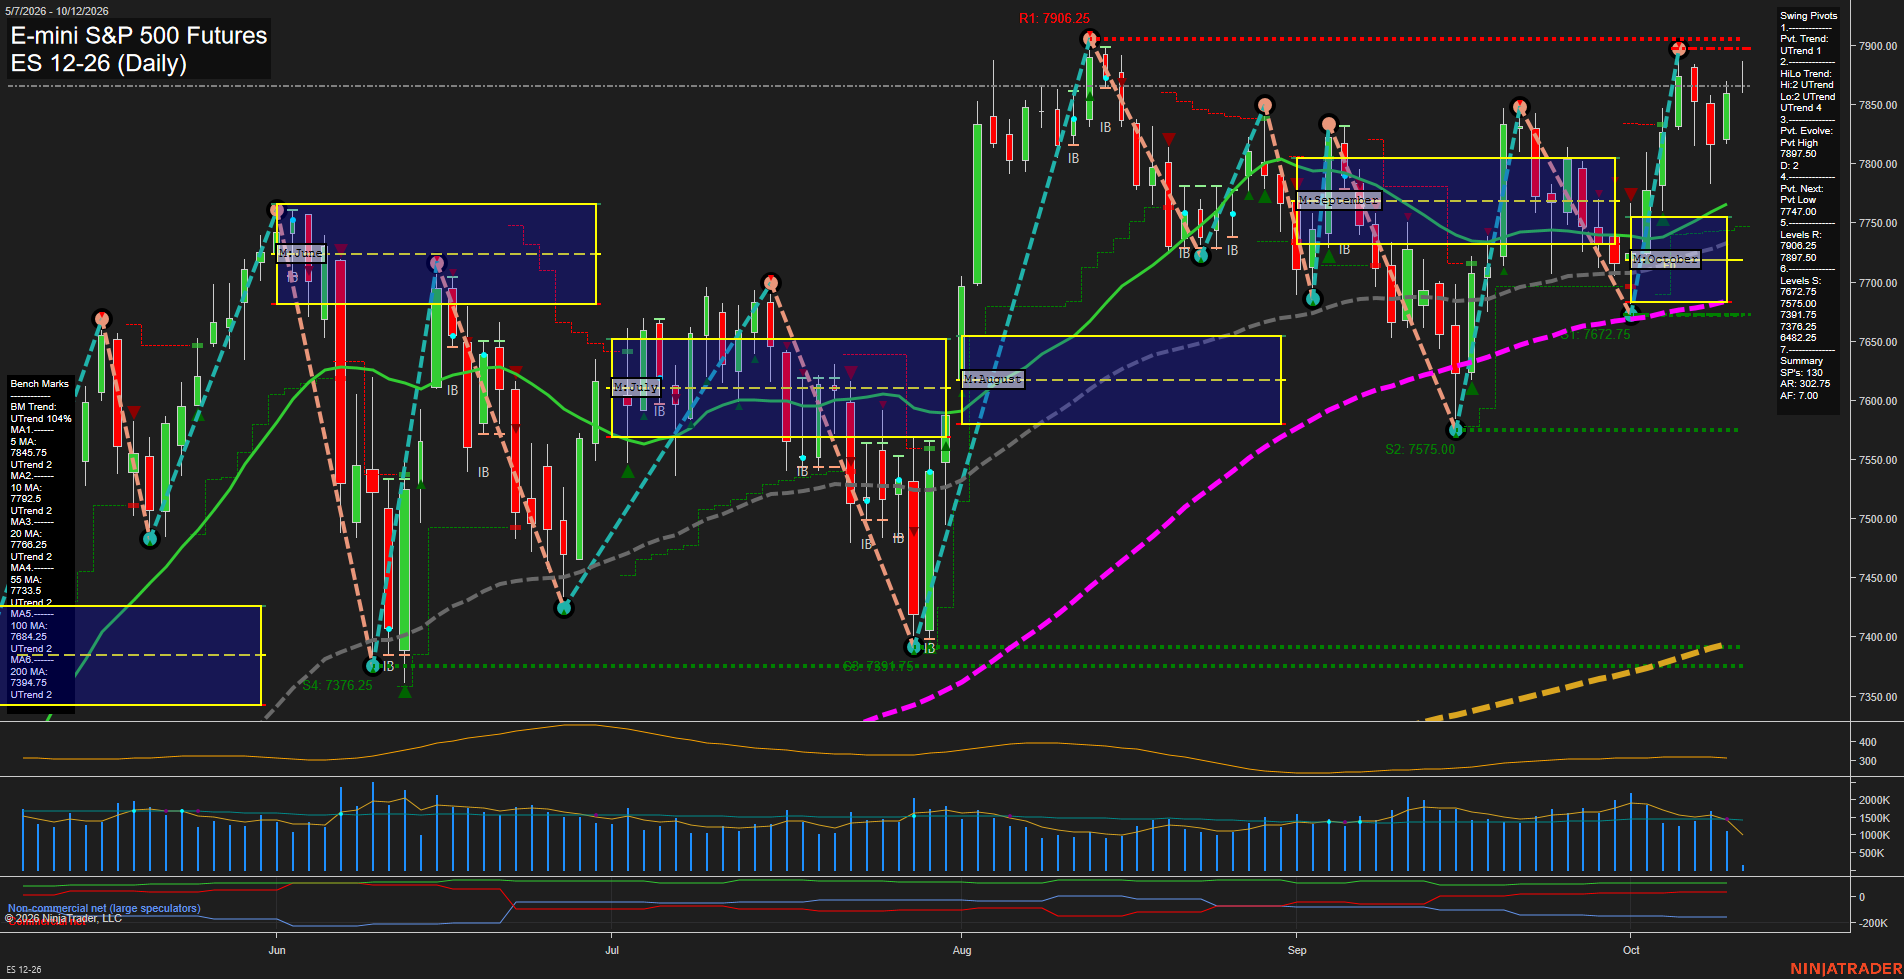
- ES Bullish YSFG/MSFG, WSFG below F0%; above benchmarks, 7906.25 resistance, 7747.00/7672.75 supports, 7588.75 pivot threshold.
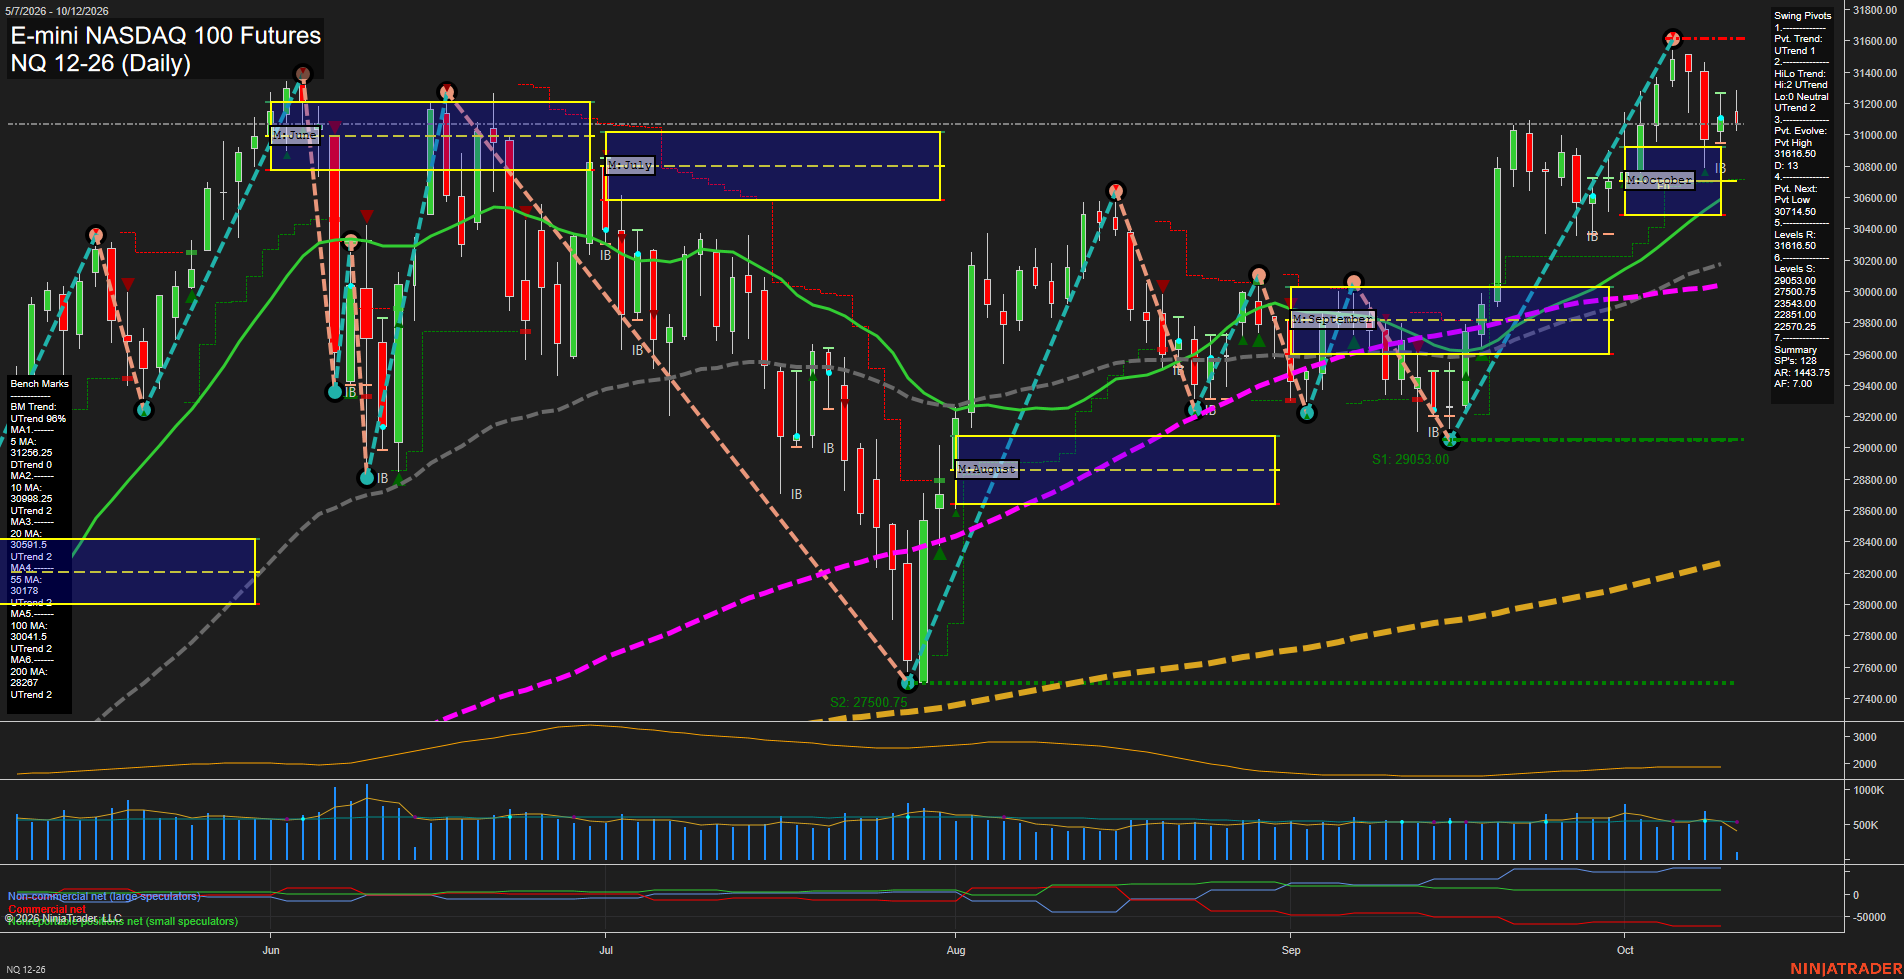
- NQ Bullish YSFG/MSFG, WSFG below F0%; benchmarks rising, 31616.50/31650.50 resistance, 30174.50 pivot threshold, 29475.00 support.
- YM Bullish YSFG/MSFG; weekly pullback below short benchmarks, daily recovery above them, 52131 resistance, 50859 support, 53191 reversal threshold.
- EMD Bearish short-term below WSFG F0% and benchmarks; MSFG/YSFG upward, 3600.3 support, 3696.8 resistance, 3792.3 reversal threshold.
- RTY Bearish WSFG/MSFG and daily benchmarks; YSFG above F0%, 2778.6/2768.4 support, 2859.8 pivot reversal, 2939.8 weekly threshold.
- FDAX Neutral weekly, bearish daily; YSFG/MSFG upward, short benchmarks declining, 24925/24897 support, 25577 resistance, 26237/26847 upside references.
Overall State
- Short-Term: Bearish
- Intermediate-Term: Neutral
- Long-Term: Bullish
Conclusion
ES and NQ retain the strongest HTF alignment, holding above major benchmarks with upward YSFG and MSFG structures, although both WSFG readings remain below F0%. YM has recovered on the daily timeframe while its weekly structure remains corrective. EMD, RTY, and FDAX remain in short-term pullbacks; RTY carries the broadest daily weakness. Across the group, yearly and monthly grids generally remain upward, while weekly and daily pivot structures show mixed short-term directional correlation.
Note: Intra-day counter-trend pullbacks or retracements may occur, HTF is context for informational usage and market structure. Glossary: Session Fib Grids periods of YSFG:’Yearly’, MSFG:’Monthly’, WSFG:’Weekly’
For full details visit: AlphaWebTrader Technicals
ES Daily View
Overall Rating
- Short-Term: Bullish
- Intermediate-Term: Bullish
- Long-Term: Bullish.
Key Insights Summary
Price has rebounded sharply from the early-October 7575.00 swing-low area and is trading above every daily benchmark, confirming broad multi-timeframe upside alignment. The short-term pivot structure remains in an uptrend, although the weekly fib-grid reading remains below its F0% reference and down, reflecting a countertrend weekly retracement within the stronger monthly and yearly advances. Price is pressing the 7897.50 to 7906.25 pivot-resistance band after a fast recovery, while 7747.00 is the active opposite-pivot level and 7672.75 is the first larger swing support. Medium-sized daily bars and elevated ATR indicate an energetic, high-range environment rather than a quiet consolidation.
View charts on: AlphaWebTrader HTF Charts
NQ Daily View
Overall Rating
- Short-Term: Neutral
- Intermediate-Term: Bullish
- Long-Term: Bullish.
Key Insights Summary
NQ remains in a broad bullish swing structure, trading above the rising 10-, 20-, 55-, 100-, and 200-day benchmarks, with both pivot trend measures holding UTrend. The recent rally produced a pivot high at 31616.50, followed by a medium-range pullback and consolidation near 31146.50; this leaves the short-term picture mixed as price sits below the 5-day average and below the weekly F0% bias. Intermediate and long-term structure remains constructive above the October MSFG and major moving-average support, while 31616.50 is the immediate overhead swing-resistance reference and 30174.50 is the key short-term pivot reversal level.
View charts on: AlphaWebTrader HTF Charts
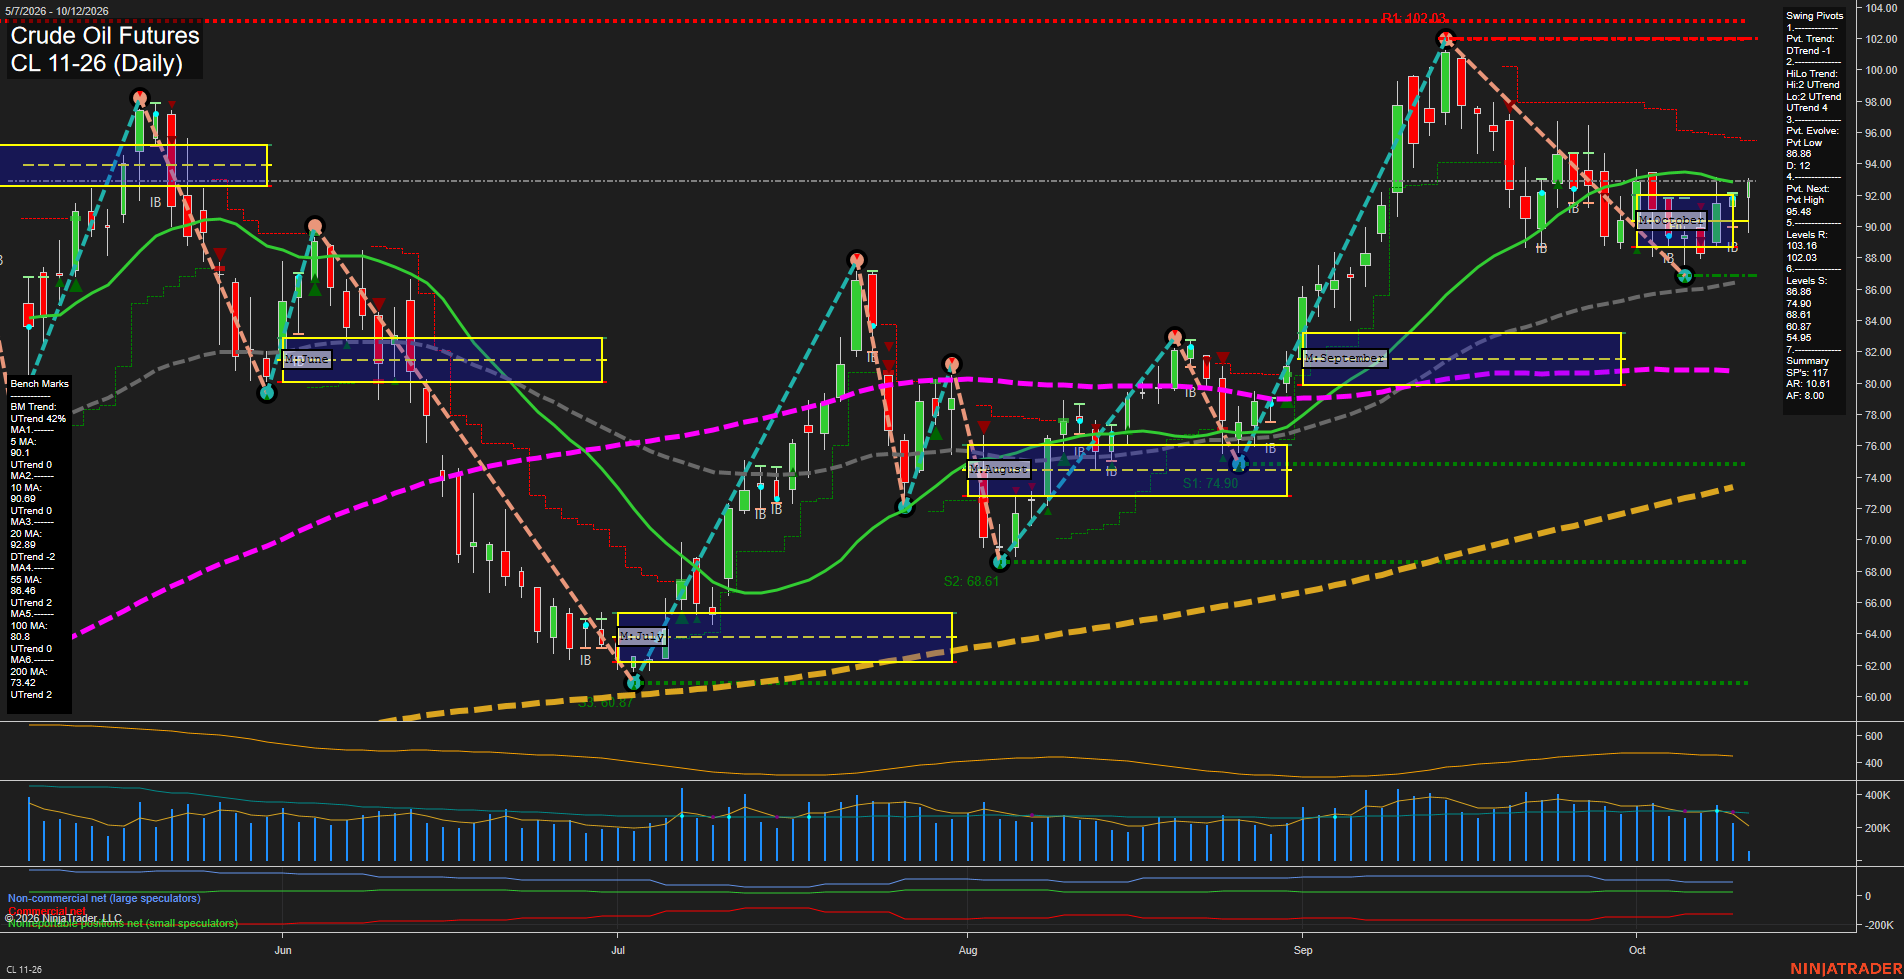
CL Daily View
Overall Rating
- Short-Term: Bullish
- Intermediate-Term: Bullish
- Long-Term: Bullish.
Key Insights Summary
Price is rebounding from the 86.86 pivot low and has recovered above the rising 5-day, 10-day, and 55-day benchmarks while holding above the weekly and monthly F0%/NTZ areas. The short-term pivot remains in DTrend until a new pivot high develops above 95.48, making the current advance a recovery within a recent pullback structure. Intermediate and long-term structure remains constructive, supported by an UTrend HiLo pattern and rising 55-day, 100-day, and 200-day averages. The 92.89 declining 20-day average is the immediate consolidation area, with 95.48 the nearby swing reference and 102.03 the major overhead resistance.
View charts on: AlphaWebTrader HTF Charts
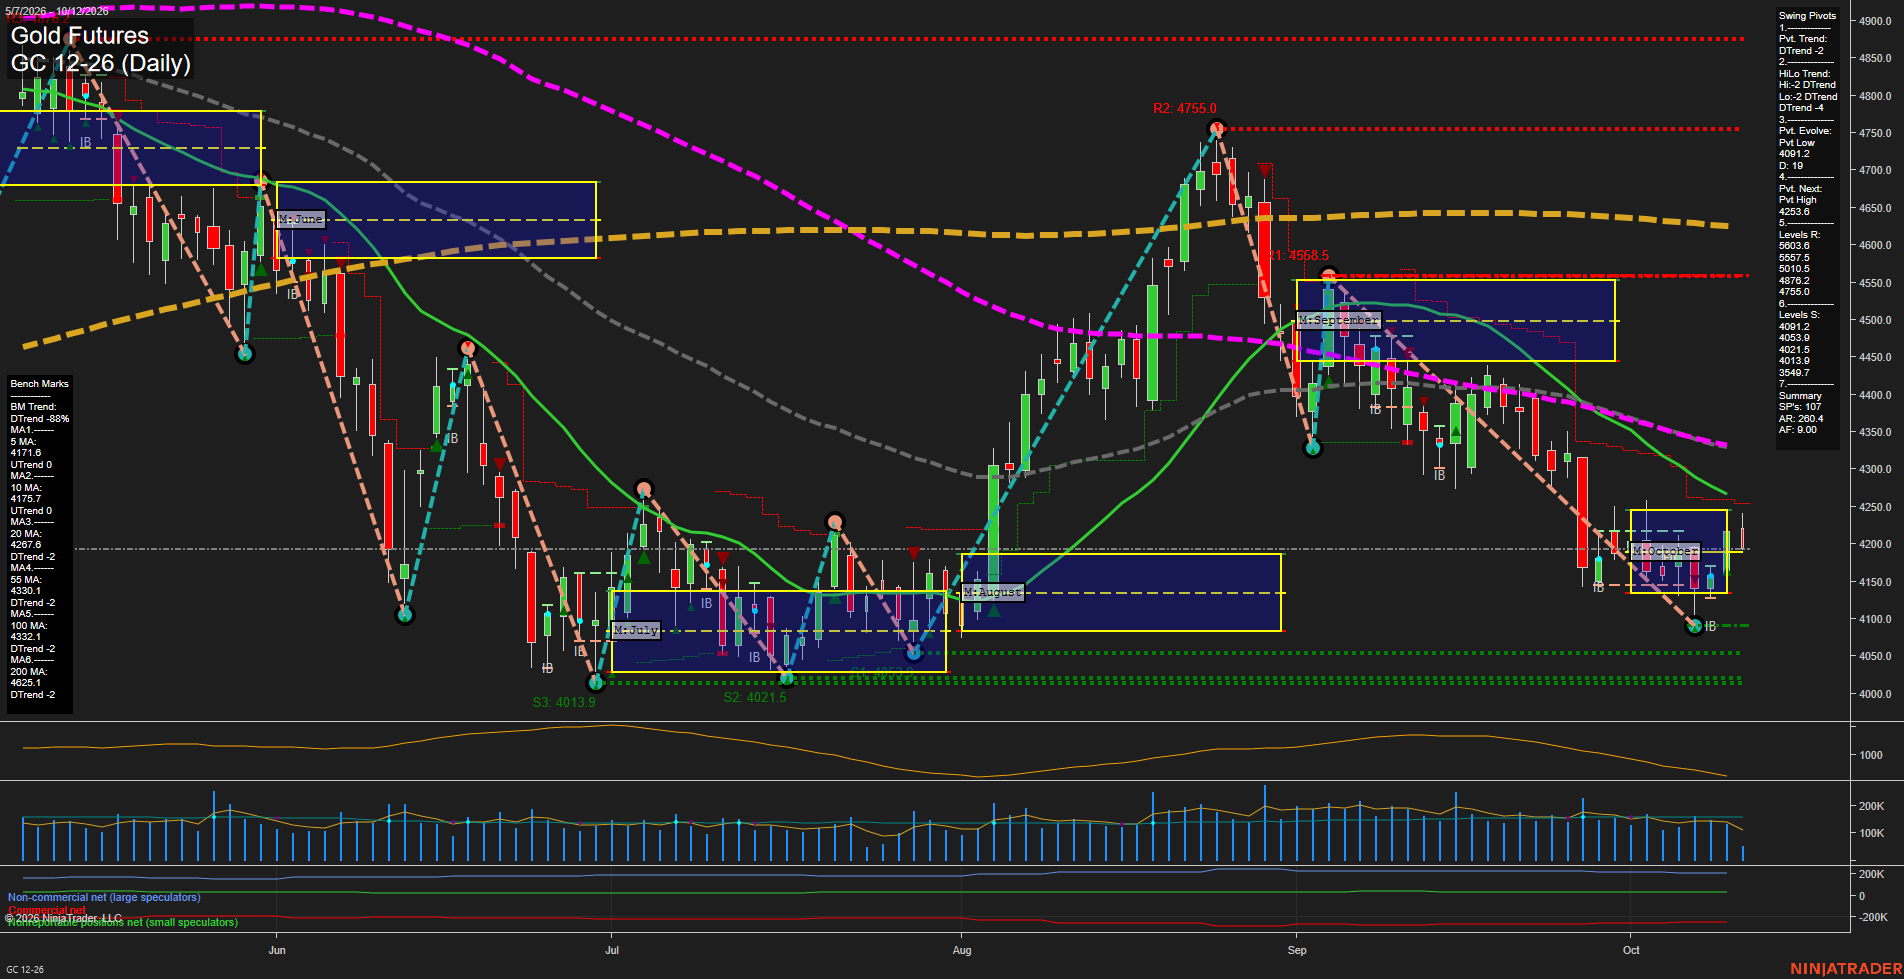
GC Daily View
Overall Rating
- Short-Term: Bearish
- Intermediate-Term: Bearish
- Long-Term: Bearish.
Key Insights Summary
GC is staging a medium-bar rebound from the 4091.2 pivot-low area, placing price marginally above the rising 5-day and 10-day benchmarks. The broader swing structure remains bearish: both pivot trends are down, price remains below the October MSFG balance area and the 20-, 55-, 100-, and 200-day benchmarks, and the larger sequence continues to reflect lower highs following the September peak. The 4239.3 next-pivot level and 4267.6 20-day average define the nearby overhead retracement zone, while 4091.2 through 4013.9 remain the principal downside support cluster. Volatility remains elevated, consistent with choppy countertrend rebounds within a larger daily downtrend.
View charts on: AlphaWebTrader HTF Charts
ZB Daily View
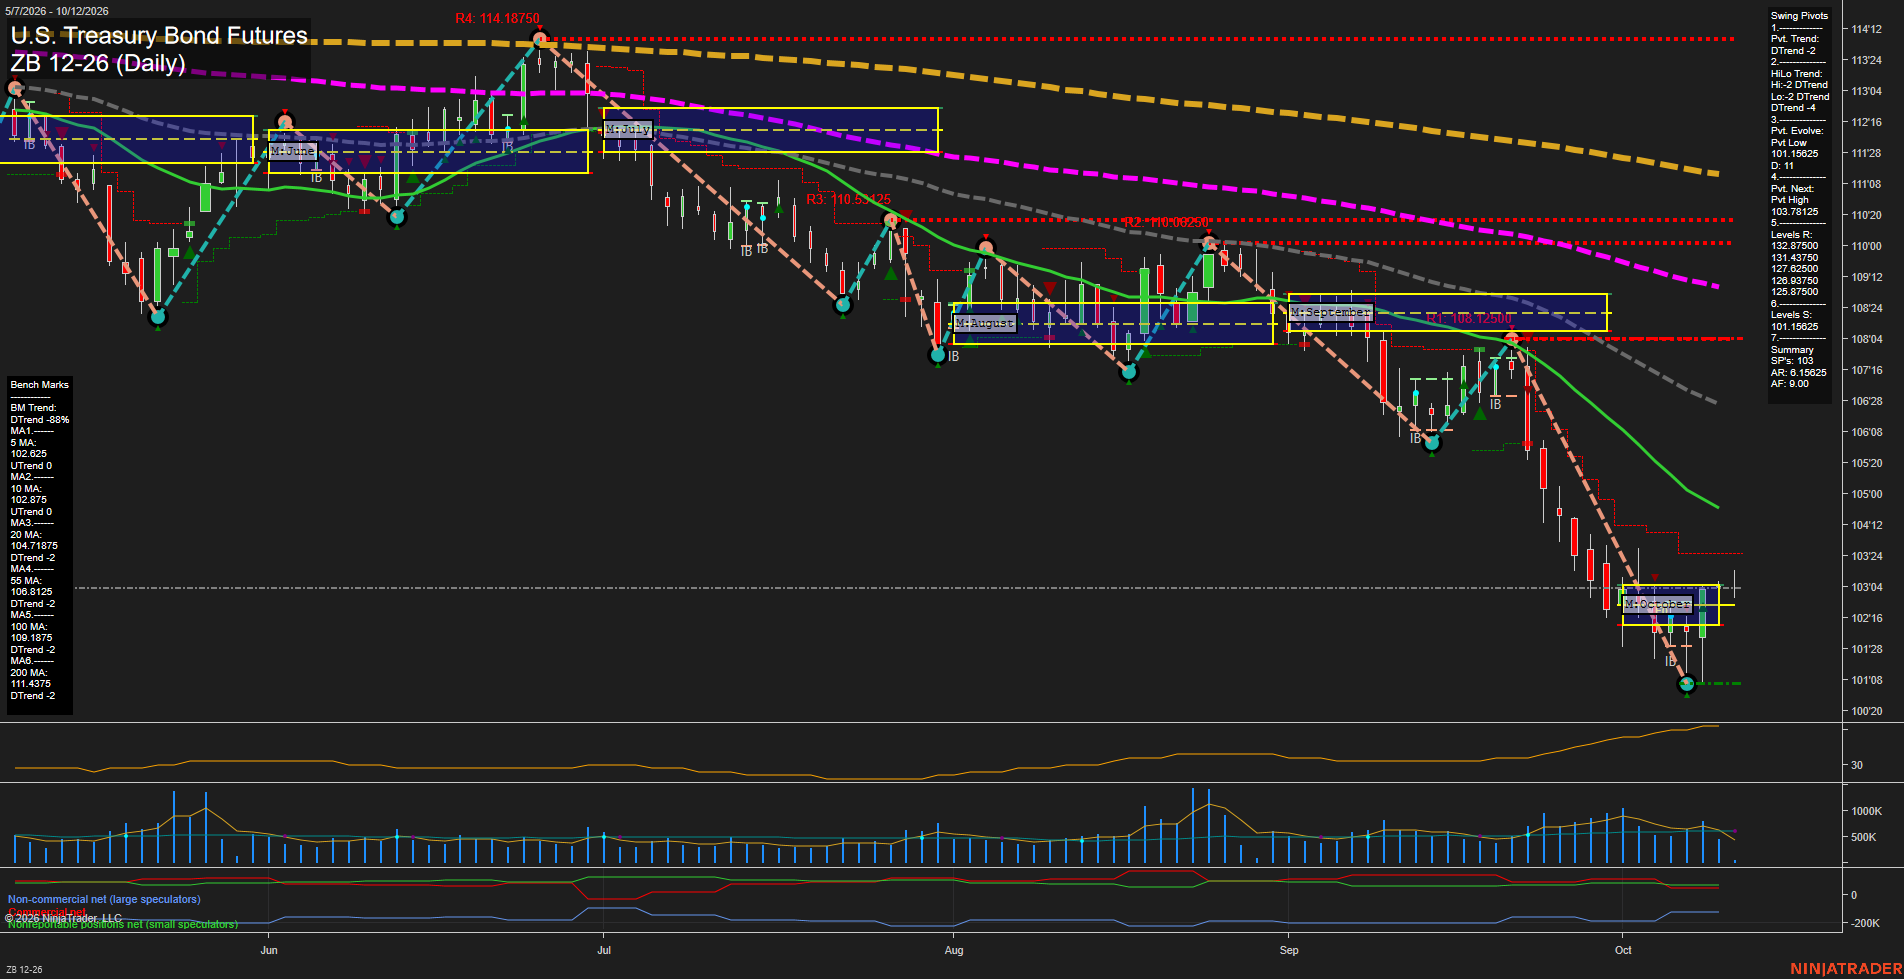
Overall Rating
- Short-Term: Bearish
- Intermediate-Term: Bearish
- Long-Term: Bearish.
Key Insights Summary
The daily structure remains broadly bearish, defined by lower swing highs, a fresh pivot low at 101.15625, and price trading beneath the declining 20, 55, 100, and 200-day benchmarks. The recent rebound from the October low has lifted price above the rising 5 and 10-day averages, but momentum is slow and the recovery remains beneath the 103.78125 pivot-high reversal threshold. Weekly Fib positioning remains below F0% while the yearly grid is deeply negative, reinforcing the dominant decline. The October monthly grid is marginally constructive above F0%, characterizing the current action as a short-term rebound within a larger intermediate- and long-term downtrend.
View charts on: AlphaWebTrader HTF Charts