Sunday futures review: S&P 500 and Nasdaq hold bullish structures near resistance as Dow, small caps and global contracts show mixed signals.
Fundamentals: U.S. index futures begin the week after major benchmarks advanced and the S&P 500 reached a record high. Earnings expectations and AI investment remain key supports, while persistent inflation, high borrowing costs and deteriorating credit conditions add caution. Record gold ETF inflows and growing AI-related debt issuance highlight bond-market sensitivity.
Technicals: U.S. index futures show a mixed technical backdrop heading into Sunday. ES and NQ retain broadly bullish higher-timeframe structures near resistance, while YM is mixed and RTY remains under pressure. EMD and FDAX are in short-term corrective phases despite stronger longer-term trends. Prior-session leaders included Amazon, Microsoft and Tesla, while Apple and Nvidia declined.
Market Week Ahead – Trading 360° view Market Radar for: holidays, earnings, eco-news, market-news summary, news sentiment, and major ETFs, MAG7, Higher Time Frame Analysis Indices Futures Summary, and ETF SPY S&P500, QQQ Tech, USO Oil, GLD Gold Weekly Chart analysis
As of: October 11, 2026 06:15 CT
Earnings Radar
Monitoring for earnings releases by the Magnificent 7, AI-tech-related firms, and major financial institutions.
- BAC Release: 2026-10-14 T:BMO
- MS Release: 2026-10-14 T:BMO
- C Release: 2026-10-13 T:BMO
- GS Release: 2026-10-13 T:BMO
- JPM Release: 2026-10-13 T:BMO
- WFC Release: 2026-10-13 T:BMO
Conclusion: Major U.S. bank earnings begin 13 October before market open with C, GS, JPM, and WFC, followed by BAC and MS on 14 October. The concentrated financial-sector schedule places bank results, guidance, capital-markets activity, credit trends, and rate-sensitive commentary in focus for broad index futures sentiment.
For full details visit: Yahoo Earnings Calendar
EcoNews Radar U.S. Events
| Day | Time | Impact | Event |
|---|---|---|---|
| Wed | 08:30 | High | Core CPI m/m |
| Wed | 08:30 | High | Core CPI y/y |
| Wed | 08:30 | High | CPI m/m |
| Wed | 08:30 | High | CPI y/y |
| Thu | 08:30 | High | Core PPI m/m |
| Thu | 08:30 | High | Core Retail Sales m/m |
| Thu | 08:30 | High | PPI m/m |
| Thu | 08:30 | High | Retail Sales m/m |
| Thu | 08:30 | Medium | Philly Fed Manufacturing Index |
| Thu | 08:30 | Medium | Unemployment Claims |
| Thu | 12:00 | Low | Crude Oil Inventories |
| Thu | 23:30 | High | Fed Chairman Warsh Speaks |
EcoNews Summary
Wednesday and Thursday feature concentrated high-impact U.S. releases. Wednesday’s 08:30 inflation data focus on price pressures and their implications for interest-rate expectations. Thursday’s 08:30 cluster combines producer-price, consumer-spending, and core retail-sales data, followed by high-impact remarks from Fed Chairman Warsh at 23:30.
Event Notes:
- Wednesday 08:30 – Core Inflation m/m and y/y; Inflation m/m and y/y: Measures monthly and annual changes in consumer prices, including both underlying and overall price trends. Traders monitor these releases for inflation momentum and interest-rate policy implications.
- Thursday 08:30 – Core PPI m/m and PPI m/m: Measures monthly changes in producer prices, with core data excluding selected volatile components. These reports track price pressures earlier in the supply chain and inflation trends.
- Thursday 08:30 – Core Retail Sales m/m and Retail Sales m/m: Measures monthly changes in consumer spending, with core sales providing a narrower view of underlying consumption. Traders monitor spending data as an indicator of household demand and economic activity.
- Thursday 23:30 – Fed Chairman Warsh Speaks: Public remarks from the Federal Reserve Chairman. Traders monitor comments for information on policy priorities, inflation concerns, and the economic outlook.
Conclusion:
The single most important event is Wednesday at 08:30, when the U.S. inflation data are released. Market momentum and volume often slow ahead of this major inflation release, with increased volatility at release time. Thursday’s 08:30 data cluster and the Chairman’s late-session remarks extend the week’s policy and growth focus.
For full details visit: Forex Factory EcoNews
Market News Summary:
Equity futures begin the week after major indexes rose, with earnings optimism and AI spending offset by renewed concerns over rates, credit conditions, and oil.
Primary Drivers & Risks:
- Primary Driver: Earnings optimism and AI investment
- Primary Risk: Persistent inflation and credit stress
Tone:
Constructive for equities, with increasing rate and credit-market caution.
Stock Market / ETFs / Indices:
All three major U.S. indexes ended the prior week higher, and the S&P 500 reached a record high. Third-quarter earnings expectations, especially for technology, remain a central support for the equity market, while recent daily price action has been choppy despite a bullish longer-term trend. Commentary also cited elevated investor complacency.
Gold / Metals:
Global physically backed gold ETFs received a record $31 billion of third-quarter inflows. The scale of demand was framed as a warning signal connected to bond-market concerns.
Fed / Financials:
Cleveland Fed President Beth Hammack cited corporate pricing power and economic resilience as evidence that interest rates have not sufficiently restrained inflation. Separate commentary highlighted rising interest rates, worsening credit conditions, 30-year mortgage rates near 7.5%, and CMBS delinquencies above 8% as risks to real estate, the economy, and equities.
Macro / Other:
AI-related borrowing by hyperscalers, data centers, and chip companies has become a major corporate-credit force. Investors continue to absorb the debt, but financing complexity, borrower concentration, and competition with government borrowing are increasing pressure on credit markets.
Conclusion:
Record equity levels, stronger earnings expectations, and sustained AI spending remain the main market supports. Bank reports and third-quarter earnings are key near-term corporate focal points.
Inflation persistence, high interest rates, weakening credit conditions, and oil-price concerns remain significant cross-currents. Record gold ETF inflows and expanding AI debt issuance underscore bond-market sensitivity.
Market News Sentiment
Market News Articles: 7
- Neutral: 57.14%
- Positive: 28.57%
- Negative: 14.29%
Sentiment Summary: Market news sentiment is predominantly neutral at 57%, with 29% positive and 14% negative coverage across 7 articles.
Conclusion: The news flow presents a largely balanced tone for indices futures, with positive coverage exceeding negative coverage.
GLD,Gold Articles: 1
- Negative: 100.00%
Sentiment Summary: Gold-related coverage was 100% negative across 1 article.
Conclusion: The snapshot indicates uniformly negative sentiment toward GLD and gold, based on limited article volume.
No stock-related news items found.
Sentiment Summary: No stock-related news items were identified, providing no measurable equity market sentiment signal for indices futures day traders.
Conclusion: The available news flow is neutral due to the absence of relevant stock market items.
SPY Weekly View
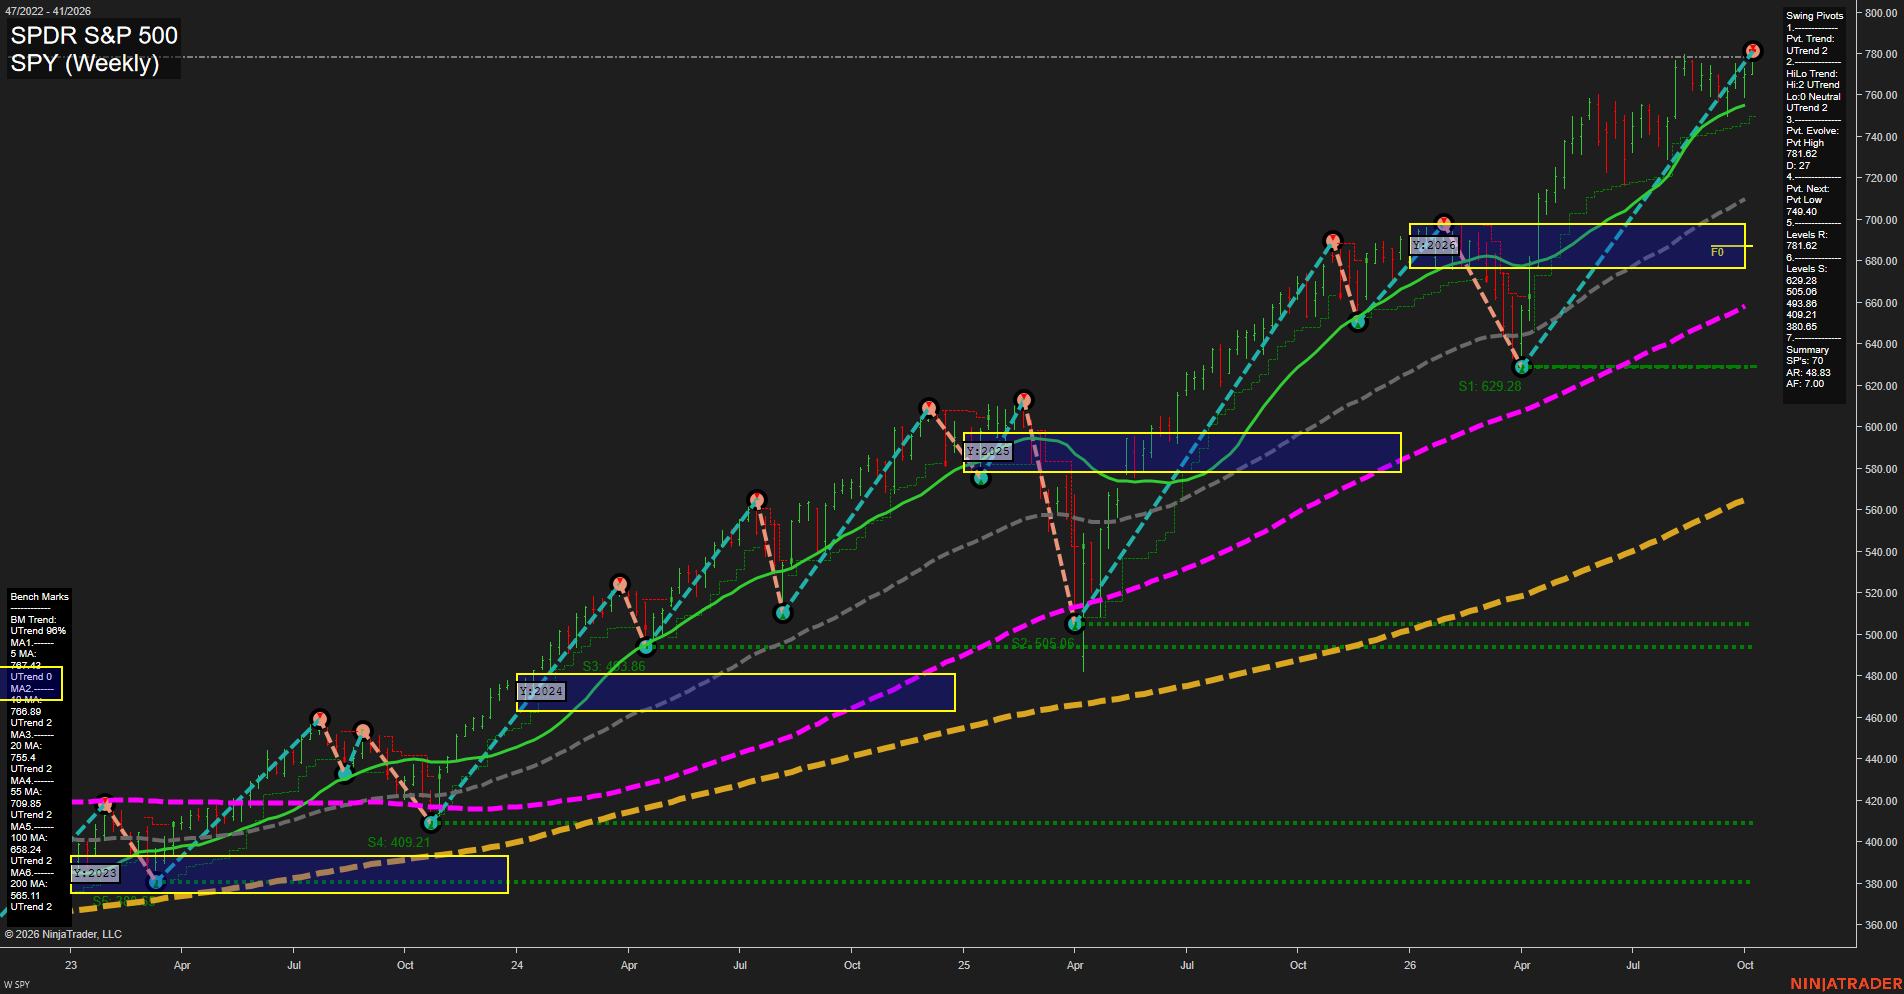
Overall Rating
- Short-Term: Bullish
- Intermediate-Term: Bullish
- Long-Term: Bullish.
Key Insights Summary
SPY’s weekly structure remains broadly bullish from a futures swing-trader perspective: price is near the 781.62 pivot high, the short-term and intermediate pivot trends are rising, and all six benchmark averages are advancing beneath price. The latest weekly bars are comparatively small after a sharp advance, reflecting consolidation near highs rather than a confirmed reversal. The 749.40 next-pivot level defines the nearby structural reference below the current high, while the rising 20-week benchmark near 755.45 and 55-week benchmark near 709.85 show substantial trend support. Price is extended above the 2026 yearly NTZ/F0% area, indicating persistent upside acceptance and strong long-term momentum, though the narrow range near the high also characterizes a potentially choppy price-discovery phase.
View charts on: AlphaWebTrader HTF Charts
QQQ Weekly View
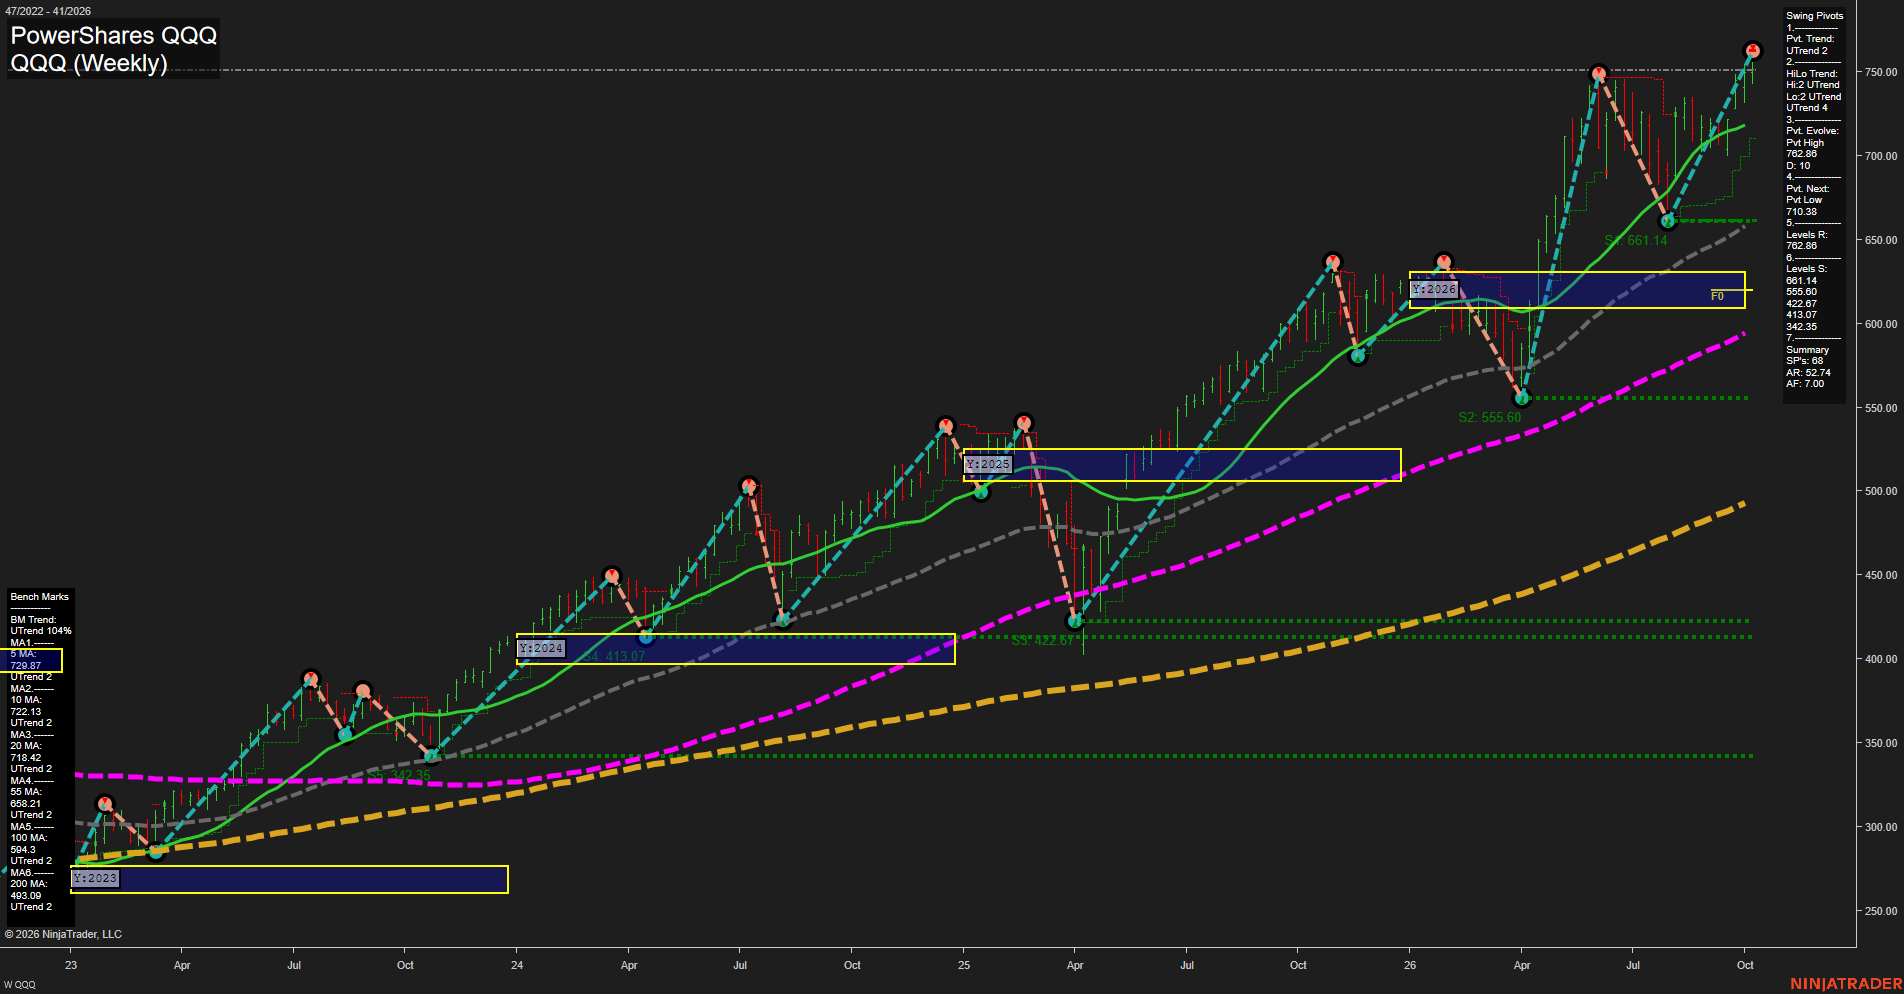
Overall Rating
- Short-Term: Bullish
- Intermediate-Term: Bullish
- Long-Term: Bullish.
Key Insights Summary
QQQ remains in a mature but intact weekly uptrend, with price near the evolving 762.88 pivot-high resistance and materially above every benchmark average. For a futures swing-trader market read, the structure is bullish across timeframes: higher highs and higher lows remain in force, the short-term averages are rising above the intermediate and long-term averages, and the 661.14 pivot support defines the most important weekly structural floor beneath the current advance. The rally is extended above the 2026 yearly NTZ/F0% region, indicating sustained upside acceptance rather than a consolidation within the yearly value area. Momentum is fast and recent weekly bars show elevated range and volatility near new highs, making this a trend-continuation phase with potential for two-way price discovery around the 762.88 pivot rather than a low-volatility base.
View charts on: AlphaWebTrader HTF Charts
USO Weekly View
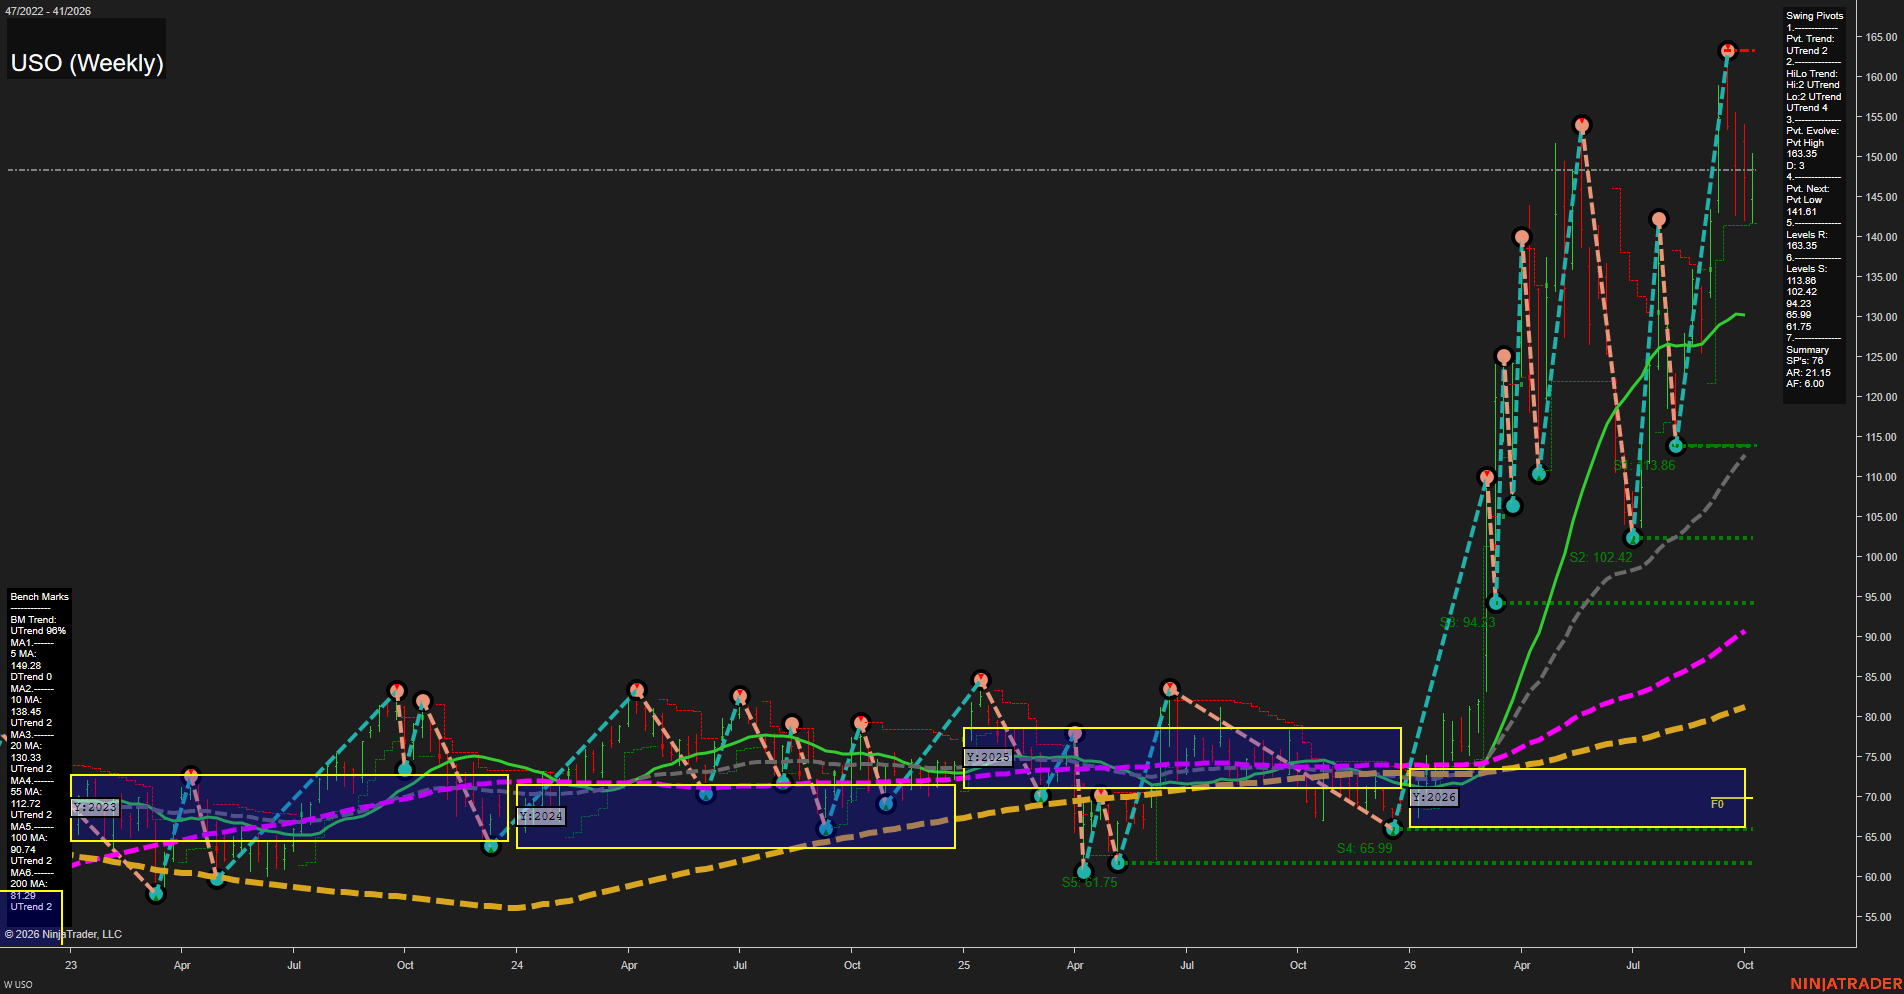
Overall Rating
- Short-Term: Bullish
- Intermediate-Term: Bullish
- Long-Term: Bullish.
Key Insights Summary
USO remains in a powerful, high-volatility upside expansion from the 2026 base near the yearly F0/NTZ area. Price is substantially above all rising intermediate- and long-term benchmarks, while the pivot structure retains higher highs and higher lows. The 163.35 pivot high is the principal overhead reference, while 142.42 is the nearest structural support beneath the current 149.28 area. The 5-period benchmark has turned down despite the broader alignment remaining positive, indicating a fast, extended swing phase with active two-way weekly ranges rather than a smooth trend.
View charts on: AlphaWebTrader HTF Charts
GLD Weekly View
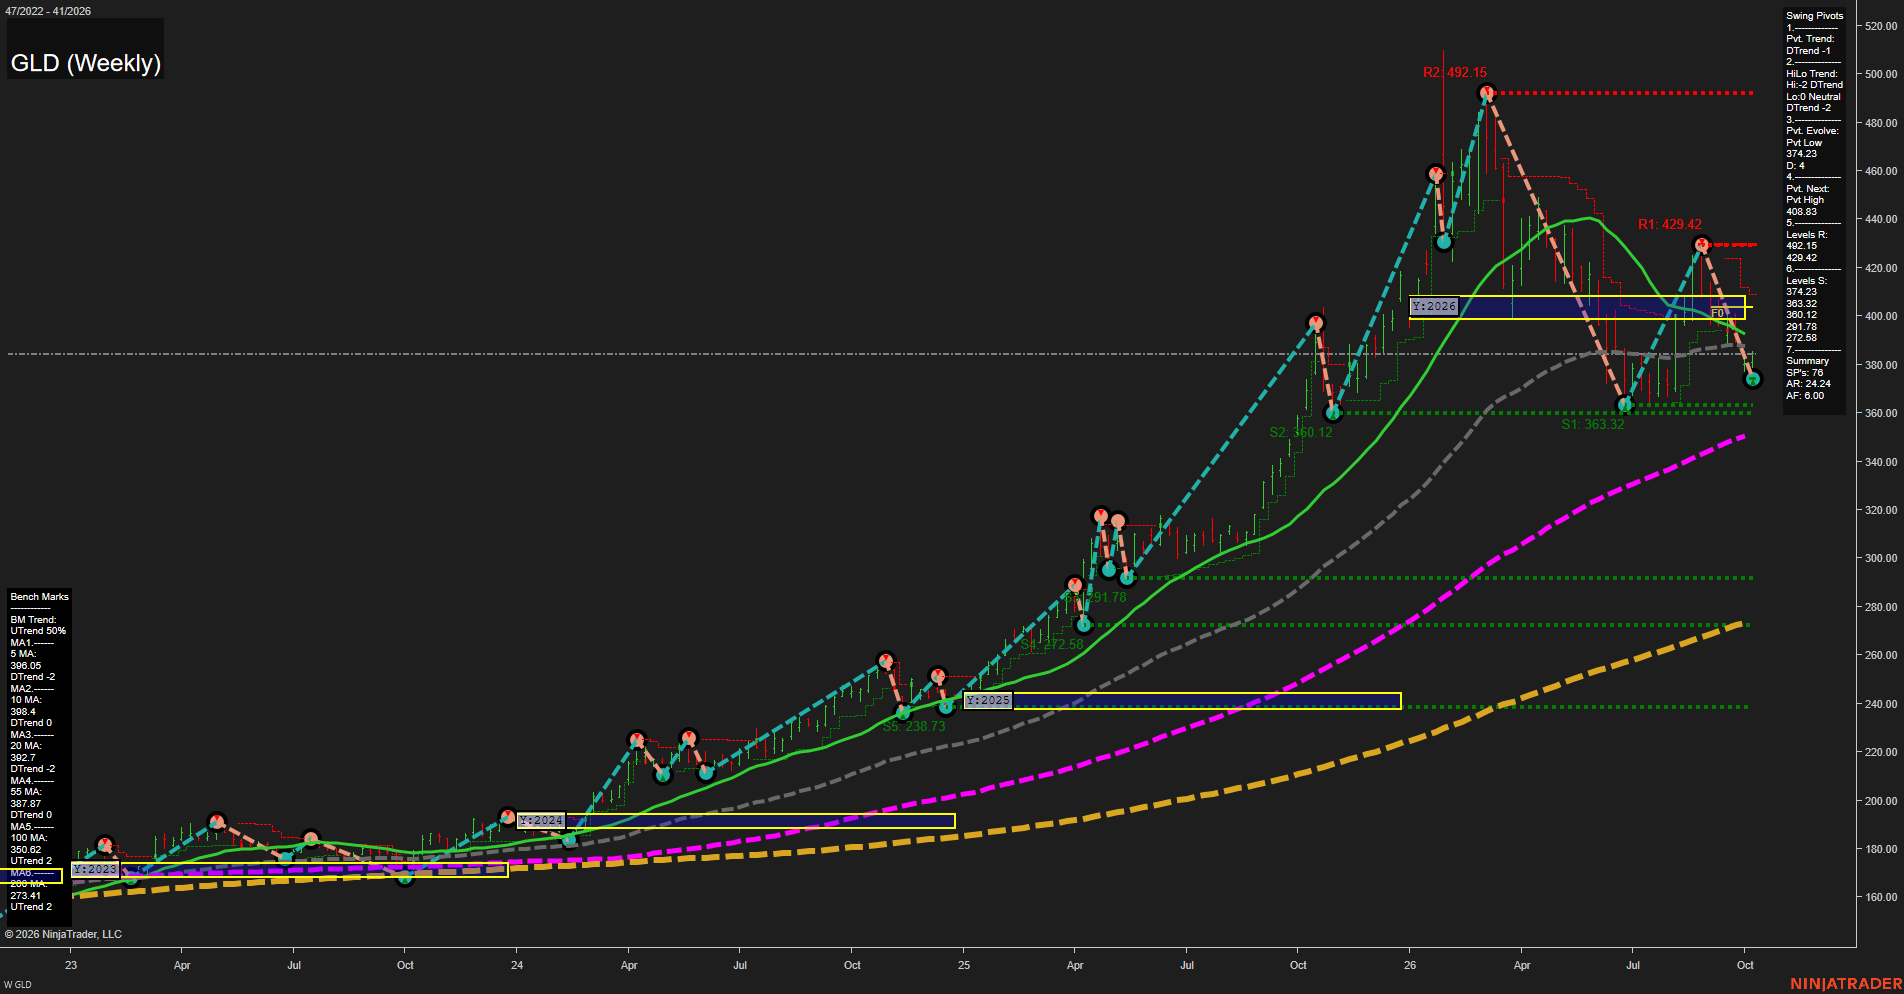
Overall Rating
- Short-Term: Bearish
- Intermediate-Term: Bearish
- Long-Term: Bullish.
Key Insights Summary
GLD’s weekly structure reflects a sharp counter-trend decline within a still-positive long-term gold cycle. From a futures swing-trader perspective, the near-term tape is bearish: price is below the 5-, 10-, 20-, and 55-week benchmarks, while both the active pivot and HiLo trend remain in DTrend. The 429.42 pivot high marks the principal overhead recovery reference, while 374.23 is the immediate pivot-low test and 363.32 is the next lower support shelf. The decline from the 429 area has been fast and volatile, producing lower highs and a test of the prior 374 support zone. Despite the short- and intermediate-term retracement, the 100- and 200-week averages remain rising and well below price, preserving the broader bullish secular structure.
View charts on: AlphaWebTrader HTF Charts
ZB Weekly View
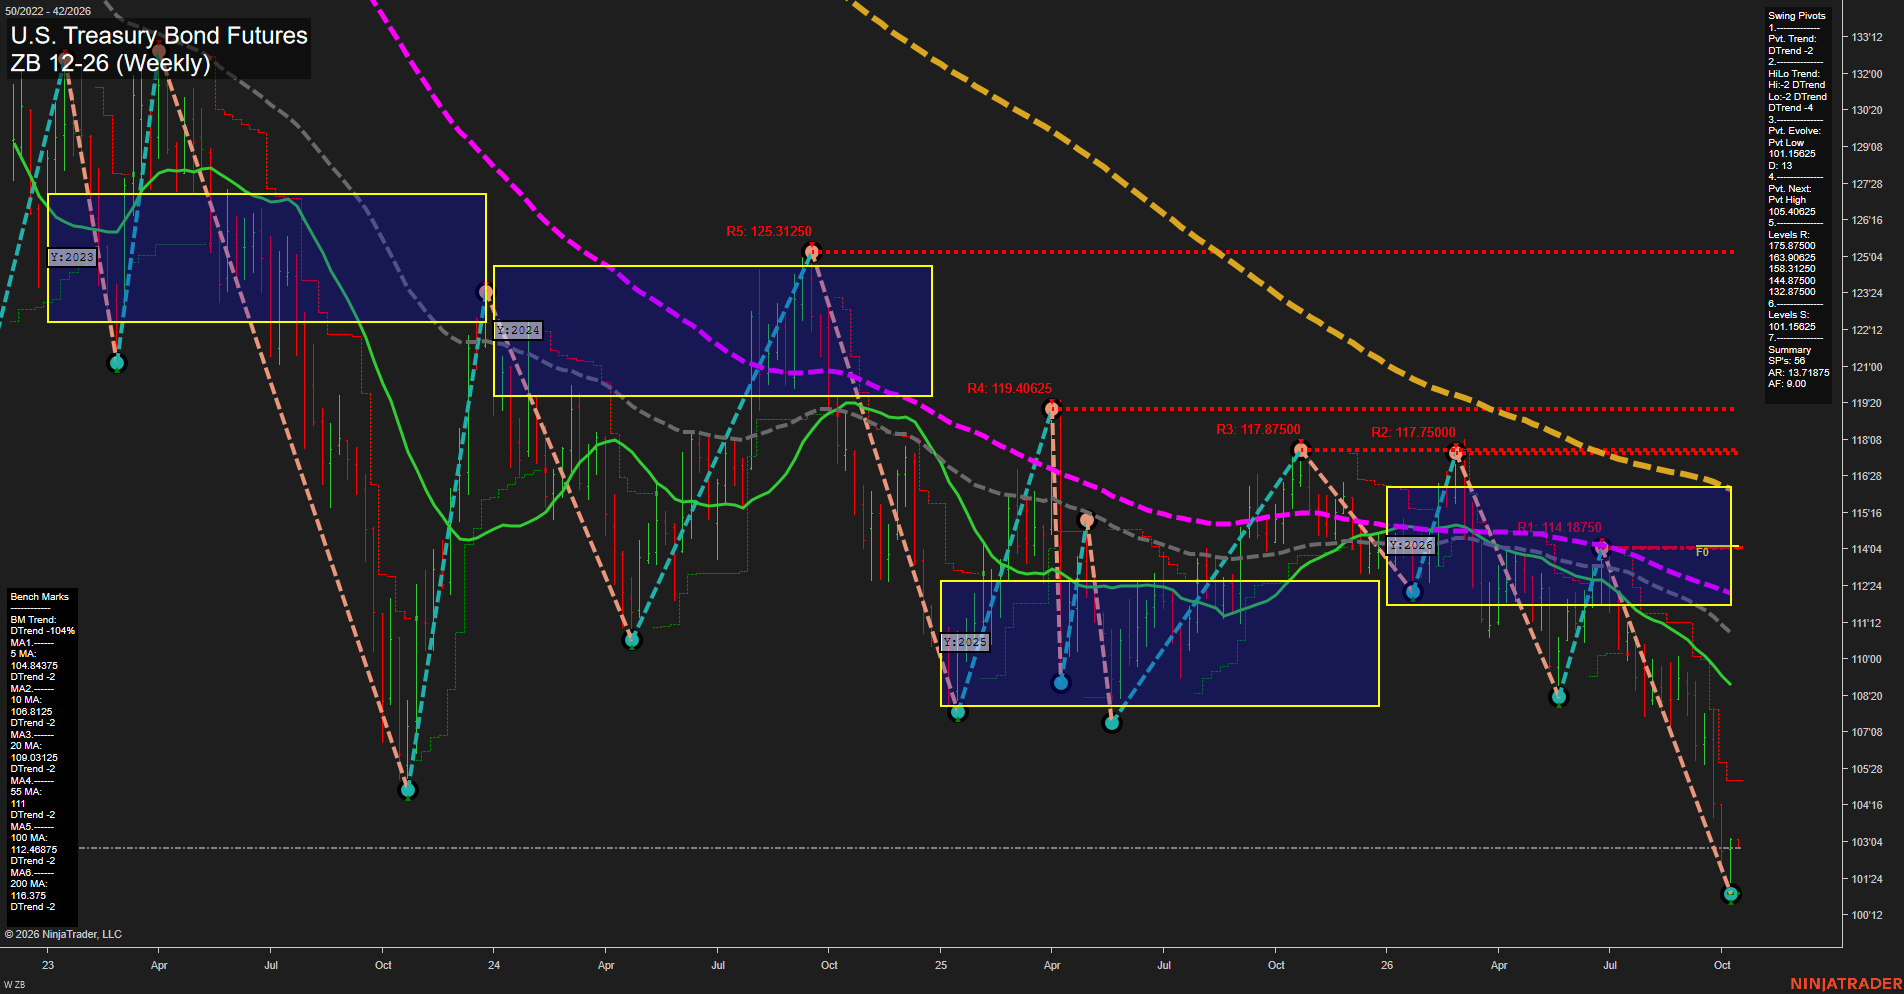
Overall Rating
- Short-Term: Bearish
- Intermediate-Term: Bearish
- Long-Term: Bearish.
Key Insights Summary
ZB remains in a broad weekly decline, with fast downside momentum producing large-range bars and a fresh pivot low near 101'04. The short-term pivot structure and intermediate HiLo structure are both DTrend, while price remains beneath every monitored weekly benchmark. The 103'04 area reflects a modest rebound from the latest low, but 105'13 is the next pivot-reversal threshold and the nearby 5-week average at 104'11 remains overhead. The larger technical structure retains lower highs and lower lows, with the yearly fib position below its F0% level confirming the long-term bearish backdrop.
View charts on: AlphaWebTrader HTF Charts