U.S. stocks closed mixed as Dow gains met weak breadth, while oil, yields, CPI expectations and earnings positioning shaped market risk conditions.
Fundamentals: U.S. equities ended mixed, with the Dow higher and the S&P 500 slightly lower as investors weighed earnings positioning, inflation data and energy-related risks. Oil prices, Treasury yields and a stronger dollar remained key cross-asset drivers, while narrow market breadth and small-cap weakness highlighted uneven participation. CPI and major corporate reports remain central near-term focuses.
Technicals: Markets closed with mixed leadership, as gains in META, USO and AAPL contrasted with losses in AMZN, TSLA and NVDA. S&P 500 and Nasdaq futures retained bullish multi-timeframe structures near resistance, while Dow and EMD showed corrective weekly conditions. Russell 2000 remained under broad selling pressure, and DAX futures rebounded within a weaker daily trend.
After Market Close daily snapshot: market news summary and sentiment, major ETFs, Magnificent 7 analysis, Indices Futures Higher Time Frame Analysis, and E-mini S&P500, Nasdaq 100, NYMEX Crude, Gold Futures Daily Chart analysis.
As of: October 12, 2026 05:00 CT
Market News Summary:
U.S. equities finished mixed as oil, yields, inflation data, and earnings-season positioning shaped a narrow market backdrop.
Primary Drivers & Risks:
- Primary Driver: Earnings and CPI focus
- Primary Risk: Oil-driven inflation and higher yields
Tone:
Mixed and cautious, with contained volatility but concentrated equity leadership.
Stock Market / ETFs / Indices:
The Dow gained 198 points while the S&P 500 slipped 0.05% in a mixed close ahead of major earnings reports. Five Dow components, including large financial firms, report this week. The S&P 500’s gains remain narrow, with four in ten constituent stocks down for the year; the Russell 2000 sits near a 10% decline from its August peak and near its 200-day moving average. Technology and AI remain key leadership themes, while options activity in single stocks has returned near 2021-era levels.
Geopolitical:
Continued fighting in the Middle East and Ukraine is supporting oil prices and adding cross-asset risk. Strait of Hormuz and U.S.-Iran tensions have sustained safe-haven considerations, though higher yields and the stronger dollar have limited gold’s response.
Oil / Energy:
Oil rose as conflicts disrupted the energy backdrop, while energy stocks advanced. High diesel prices reflect refining-capacity losses, elevated crack spreads, and product shortages rather than crude scarcity. A U.S.-Russia diesel arrangement covers less than two weeks of U.S. demand and faces legal, logistical, and geopolitical constraints; shipping and insurance costs for energy cargoes have also surged.
Gold / Metals:
Gold, silver, and platinum weakened under pressure from a firmer dollar, elevated Treasury yields, and renewed oil strength. Gold-backed ETF demand has remained resilient despite these headwinds, but the metal faces pressure from persistent inflation and rate-hike pricing.
Fed / Financials:
Inflation remains central ahead of Wednesday’s CPI report. Prediction-market pricing places headline CPI at 3.6% year over year versus 3.4% in August, while traders assign less than one-in-three odds to a new 2026 inflation high. Cleveland Fed President Beth Hammack cited concern over an inflationary mindset and said higher rates remain possible; December rate-hike risk is reflected in metals and rate markets.
Macro / Other:
Rates and oil eased enough earlier in the session to lower implied volatility, with the VIX down to 14.8. Persistent inflation, higher bond yields, stronger dollar conditions, and elevated energy costs remain important macro cross-currents.
Conclusion:
Earnings, CPI, Treasury yields, and oil prices are the principal near-term market inputs. Equity index performance remains mixed, with Dow strength contrasting with flat S&P 500 action and small-cap weakness.
Geopolitical conflict and energy-logistics costs sustain inflation pressure. Narrow market breadth, active single-stock options trading, and renewed Fed-tightening concerns remain key risk factors.
Market News Sentiment
Market News Articles: 38
- Neutral: 65.79%
- Positive: 21.05%
- Negative: 13.16%
Sentiment Summary: Market news sentiment is predominantly neutral (66%), with positive articles (21%) exceeding negative articles (13%).
Conclusion: The news flow presents a largely balanced tone for indices futures, with limited directional bias in the article distribution.
GLD,Gold Articles: 9
- Positive: 44.44%
- Negative: 44.44%
- Neutral: 11.11%
Sentiment Summary: Gold-related coverage is evenly split, with 44% positive, 44% negative, and 11% neutral across 9 articles.
Conclusion: The gold news tone is balanced, providing no clear directional sentiment signal for indices futures day traders.
USO,Oil Articles: 12
- Neutral: 33.33%
- Negative: 33.33%
- Positive: 33.33%
Sentiment Summary: USO and oil coverage is evenly split, with 33% positive, 33% neutral, and 33% negative articles.
Conclusion: The balanced oil sentiment indicates no clear directional tone from this coverage for indices futures day traders.
Market Data Snapshot
ETF Snapshot of major stock market ETFs, Mag7, and others as of: October 12, 2026 05:00
Top Movers & Losers
- META 742.96 Bullish 3.38% ▲
- USO 151.03 Bullish 1.91% ▲
- AAPL 340.97 Bullish 1.29% ▲
- AMZN 259.53 Bearish -1.11% ▼
- TSLA 378.03 Bearish -1.22% ▼
- NVDA 226.32 Bearish -1.29% ▼
Major Index ETFs: SPY, QQQ, DIA, IWM, IJH
- DIA 517.91 Bullish 0.35% ▲
- SPY 778.10 Bearish -0.06% ▼
- IJH 73.16 Bearish -0.37% ▼
- IWM 277.90 Bearish -0.37% ▼
- QQQ 746.04 Bearish -0.70% ▼
Mixed index ETF snapshot: DIA is the most bullish mover at +0.35%, while SPY is marginally Bearish at -0.06%. QQQ is the most bearish mover at -0.70%; IJH and IWM are both Bearish at -0.37%.
Mag 7 Stocks: AAPL, MSFT, GOOG, AMZN, META, NVDA, TSLA
- META 742.96 Bullish 3.38% ▲
- AAPL 340.97 Bullish 1.29% ▲
- MSFT 541.15 Bullish 1.14% ▲
- GOOG 348.97 Bullish 0.32% ▲
- AMZN 259.53 Bearish -1.11% ▼
- TSLA 378.03 Bearish -1.22% ▼
- NVDA 226.32 Bearish -1.29% ▼
Mag7 action is Mixed: META is the most bullish mover at +3.38%, followed by AAPL at +1.29% and MSFT at +1.14%. GOOG is modestly Bullish at +0.32%. NVDA is the most bearish mover at -1.29%, alongside TSLA at -1.22% and AMZN at -1.11%.
Cross-Market ETFs: TLT, GLD, USO, IBIT
- USO 151.03 Bullish 1.91% ▲
- IBIT 46.86 Bullish 0.67% ▲
- TLT 78.05 Bullish 0.09% ▲
- GLD 382.15 Bearish -0.63% ▼
Other ETFs are Mixed: USO is the most bullish mover at +1.91%, followed by IBIT at +0.67%; TLT is marginally Bullish at +0.09%. GLD is the most bearish mover at -0.63%.
ETF, Mag7, and Cross-Market ETF Insights
Overall Tone
Mixed tone: leadership in select mega-cap technology and oil contrasts with Bearish Nasdaq, small-cap, mid-cap, and gold moves.
Equity ETFs and Mag7:
Major Index ETFs were Mixed, with DIA +0.35% higher, SPY marginally Bearish at -0.06%, and QQQ Bearish at -0.70%; IWM and IJH each declined -0.37%. Mag7 action was selective: META was the most bullish mover at +3.38%, while AAPL +1.29%, MSFT +1.14%, and GOOG +0.32% gained. NVDA was the most bearish mover at -1.29%, with TSLA -1.22% and AMZN -1.11% also Bearish.
Cross-Market ETFs:
Cross-market ETFs were Mixed, led by USO as the most bullish mover at +1.91%, while IBIT gained +0.67%. TLT was marginally Bullish at +0.09%, while GLD was the most bearish mover at -0.63%. Oil strength and IBIT gains diverged from Bearish QQQ and gold weakness.
Futures Indices – Higher Time Frame Analysis
Summary of the current state of US Indices Futures based on higher time-frame (HTF) technical analysis as of: 2026-10-12: 17:00 CT.
US Indices Futures
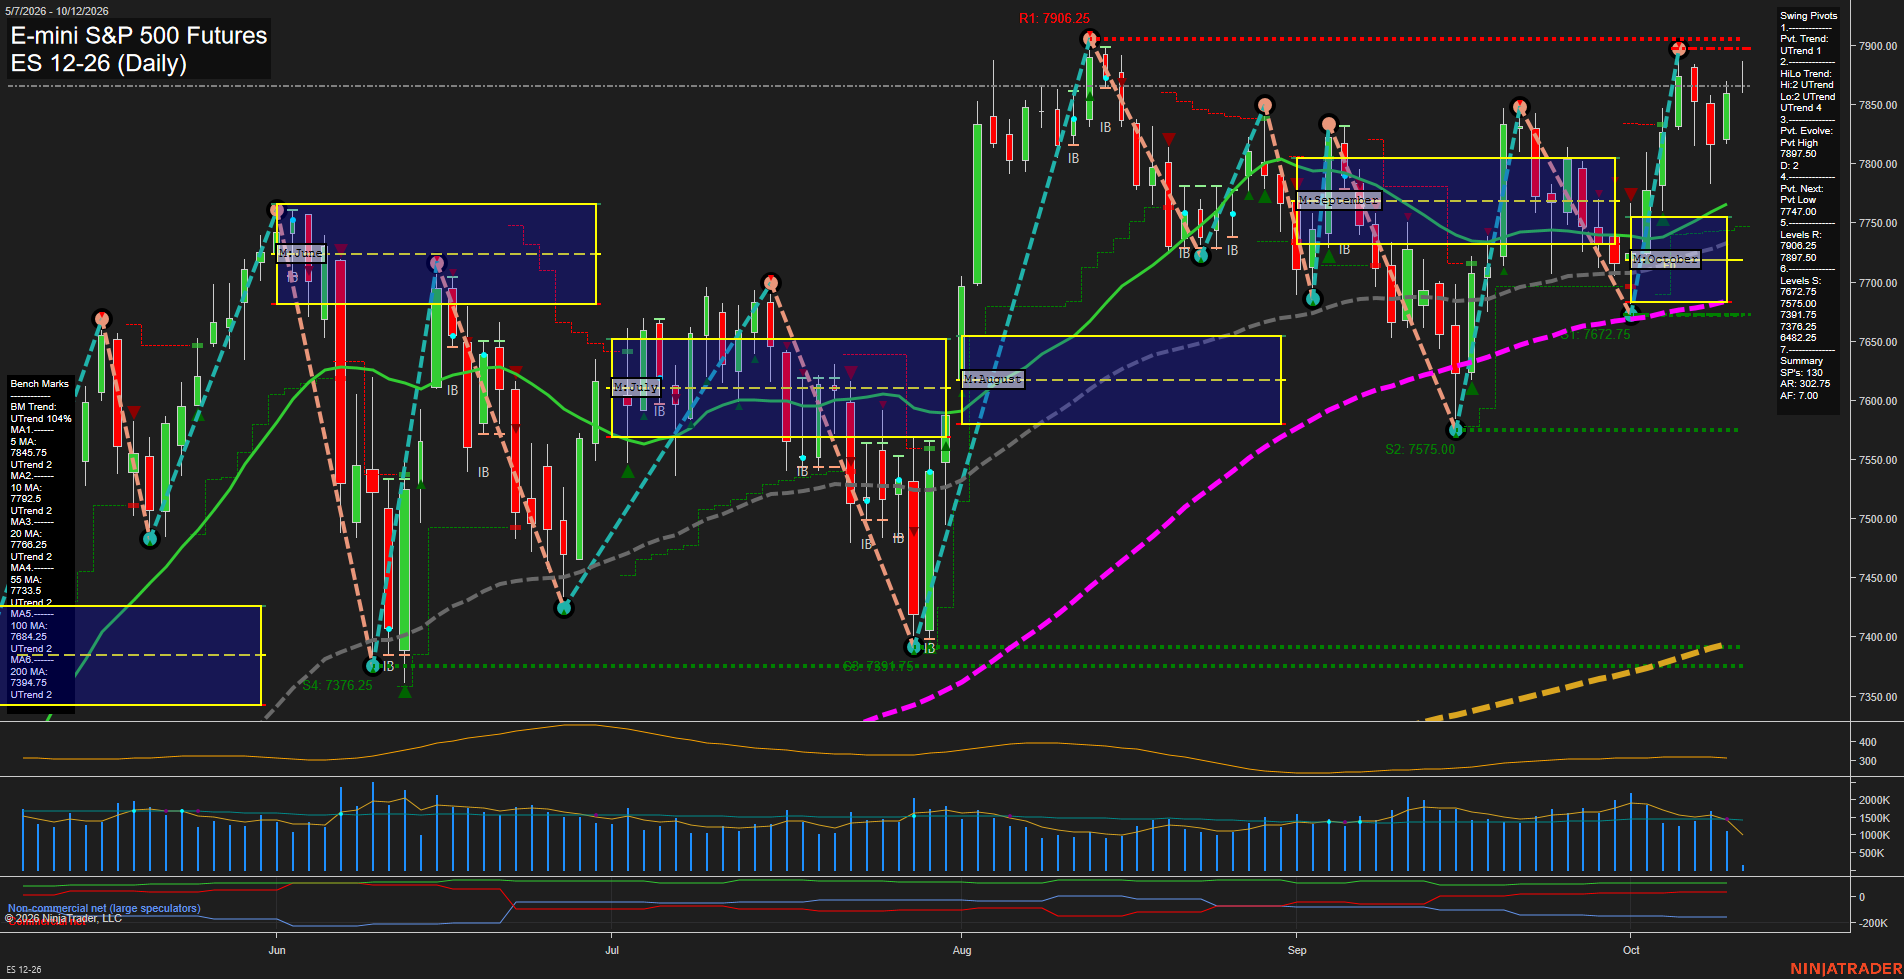
- ES YSFG/MSFG upward, WSFG below F0%, benchmarks rising, UTrend pivots; resistance 7897.50-7906.25, support 7747.00/7672.75.
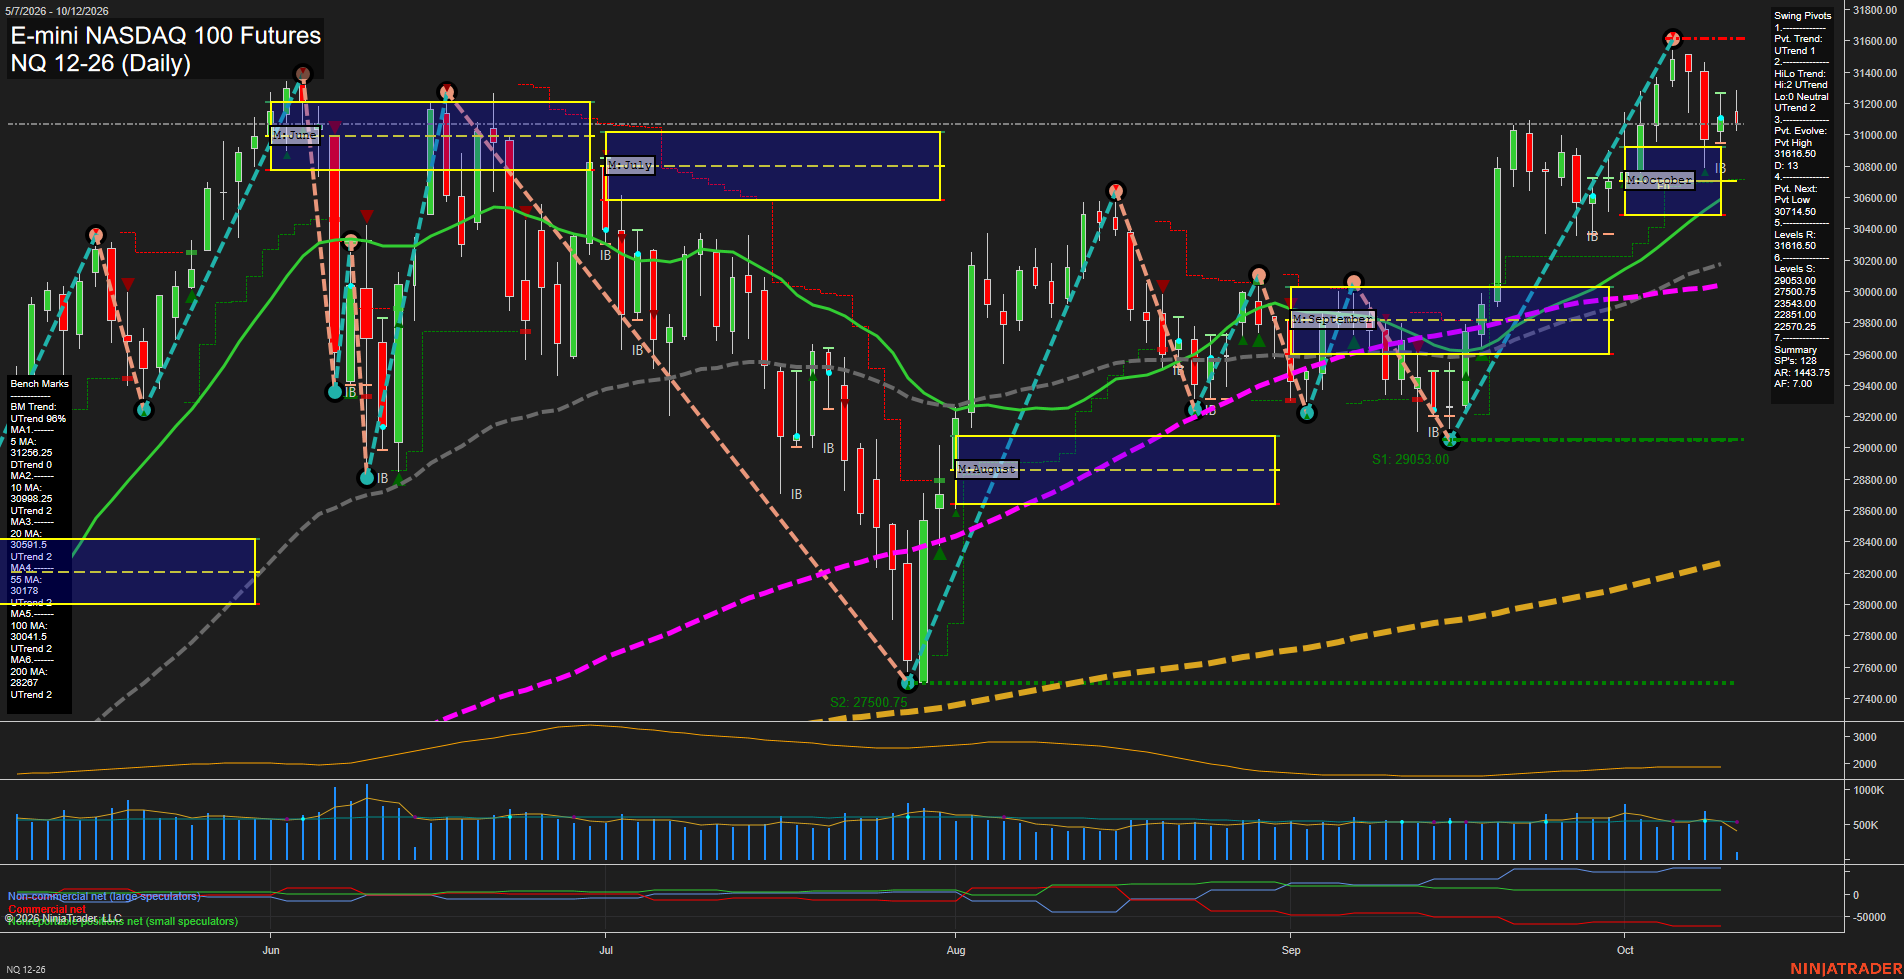
- NQ YSFG/MSFG upward, WSFG below F0%, benchmarks rising, UTrend pivots; resistance 31616.50-31650.50, support 30174.50/29475.00.
- YM YSFG/MSFG upward, WSFG pullback; weekly benchmarks mixed, daily reclaimed short averages; resistance 52131/53191, support 50859.
- EMD YSFG/MSFG upward, WSFG below F0%, weekly higher-low structure intact; daily pivots down; resistance 3696.80/3737.80, support 3600.30.
- RTY YSFG upward, MSFG/WSFG below F0%, benchmarks bearish daily; DTrend pivots; resistance 2859.80/2939.80, support 2778.60-2768.40.
- FDAX YSFG/MSFG upward, WSFG consolidation, short pivots down; benchmarks mixed; resistance 25577/26237, support 24925-24897.
Overall State
- Short-Term: Bearish
- Intermediate-Term: Neutral
- Long-Term: Bullish
Conclusion
ES retains broad upward alignment, while NQ remains structurally upward despite mixed daily action. YM and EMD are recovering within broader pullbacks. RTY and FDAX retain bearish short-to-intermediate structures. Yearly and monthly grid alignment remains upward across most contracts, while weekly grid weakness and pivot resistance define the current retracement environment.
Note: Intra-day counter-trend pullbacks or retracements may occur, HTF is context for informational usage and market structure. Glossary: Session Fib Grids periods of YSFG:’Yearly’, MSFG:’Monthly’, WSFG:’Weekly’
For full details visit: AlphaWebTrader Technicals
ES Daily View
Overall Rating
- Short-Term: Bullish
- Intermediate-Term: Bullish
- Long-Term: Bullish.
Key Insights Summary
Price has rebounded sharply from the early-October 7575.00 swing-low area and is trading above every daily benchmark, confirming broad multi-timeframe upside alignment. The short-term pivot structure remains in an uptrend, although the weekly fib-grid reading remains below its F0% reference and down, reflecting a countertrend weekly retracement within the stronger monthly and yearly advances. Price is pressing the 7897.50 to 7906.25 pivot-resistance band after a fast recovery, while 7747.00 is the active opposite-pivot level and 7672.75 is the first larger swing support. Medium-sized daily bars and elevated ATR indicate an energetic, high-range environment rather than a quiet consolidation.
View charts on: AlphaWebTrader HTF Charts
NQ Daily View
Overall Rating
- Short-Term: Neutral
- Intermediate-Term: Bullish
- Long-Term: Bullish.
Key Insights Summary
NQ remains in a broad bullish swing structure, trading above the rising 10-, 20-, 55-, 100-, and 200-day benchmarks, with both pivot trend measures holding UTrend. The recent rally produced a pivot high at 31616.50, followed by a medium-range pullback and consolidation near 31146.50; this leaves the short-term picture mixed as price sits below the 5-day average and below the weekly F0% bias. Intermediate and long-term structure remains constructive above the October MSFG and major moving-average support, while 31616.50 is the immediate overhead swing-resistance reference and 30174.50 is the key short-term pivot reversal level.
View charts on: AlphaWebTrader HTF Charts
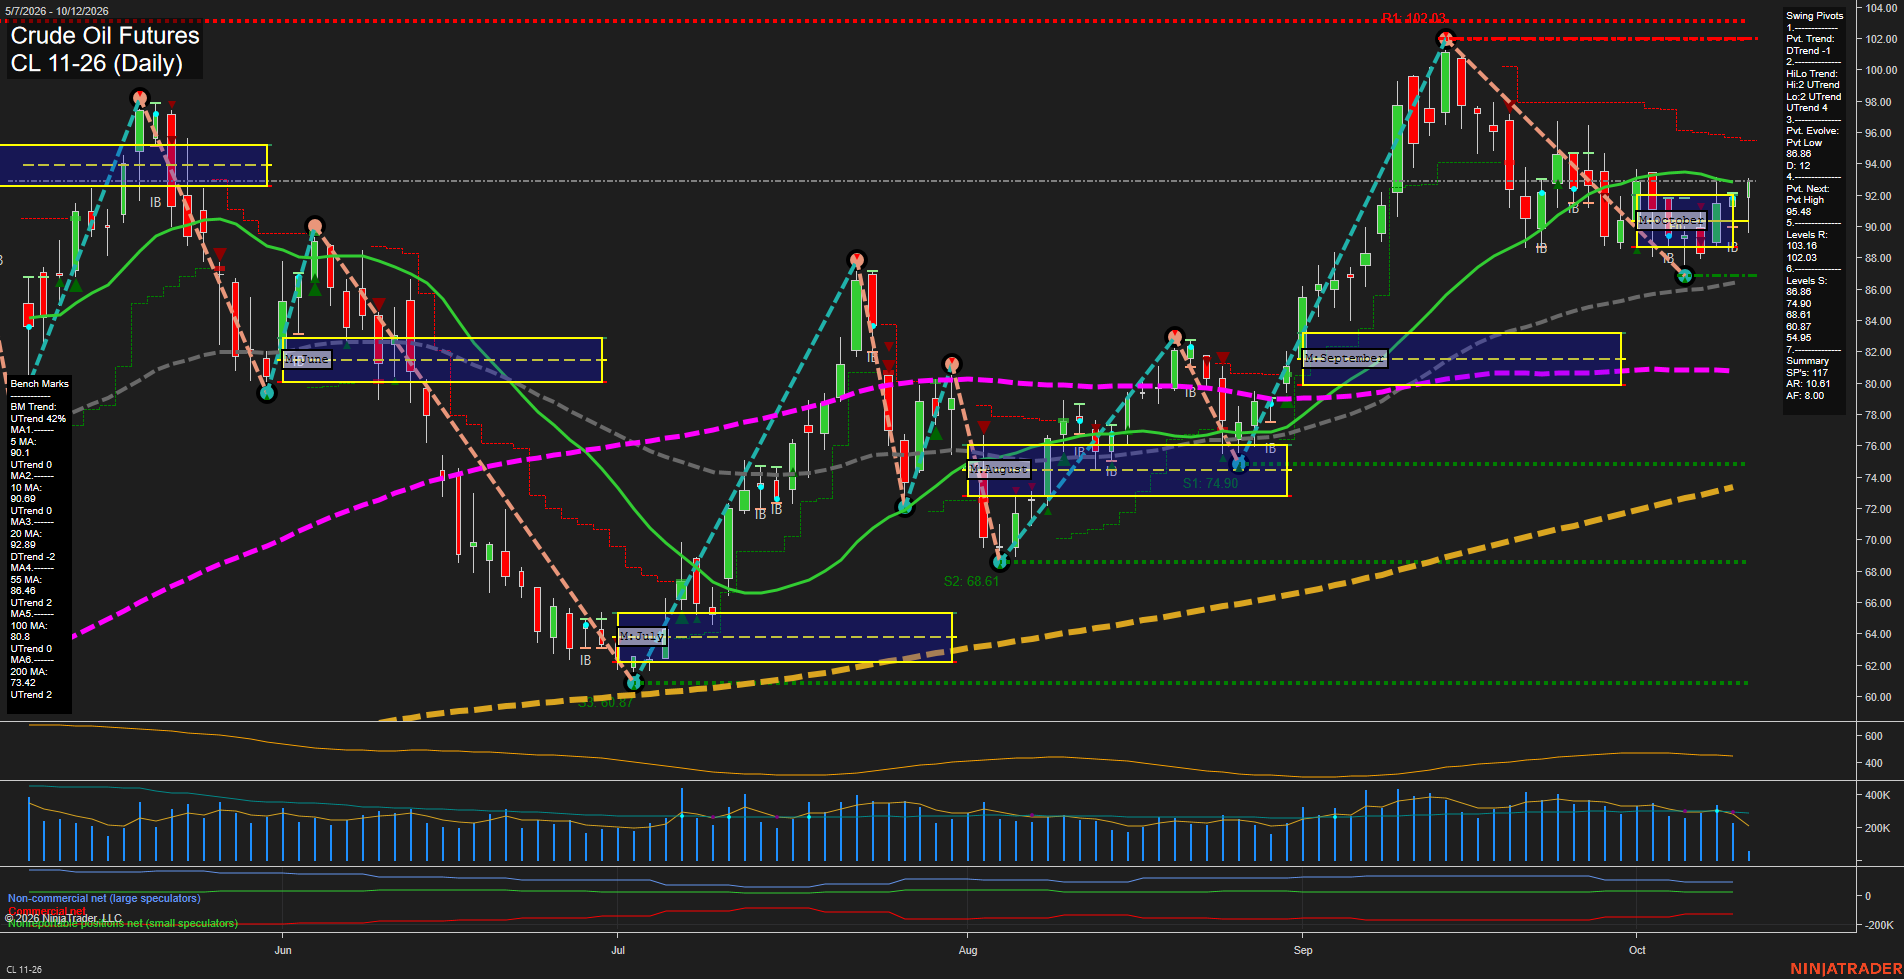
CL Daily View
Overall Rating
- Short-Term: Bullish
- Intermediate-Term: Bullish
- Long-Term: Bullish.
Key Insights Summary
Price is rebounding from the 86.86 pivot low and has recovered above the rising 5-day, 10-day, and 55-day benchmarks while holding above the weekly and monthly F0%/NTZ areas. The short-term pivot remains in DTrend until a new pivot high develops above 95.48, making the current advance a recovery within a recent pullback structure. Intermediate and long-term structure remains constructive, supported by an UTrend HiLo pattern and rising 55-day, 100-day, and 200-day averages. The 92.89 declining 20-day average is the immediate consolidation area, with 95.48 the nearby swing reference and 102.03 the major overhead resistance.
View charts on: AlphaWebTrader HTF Charts
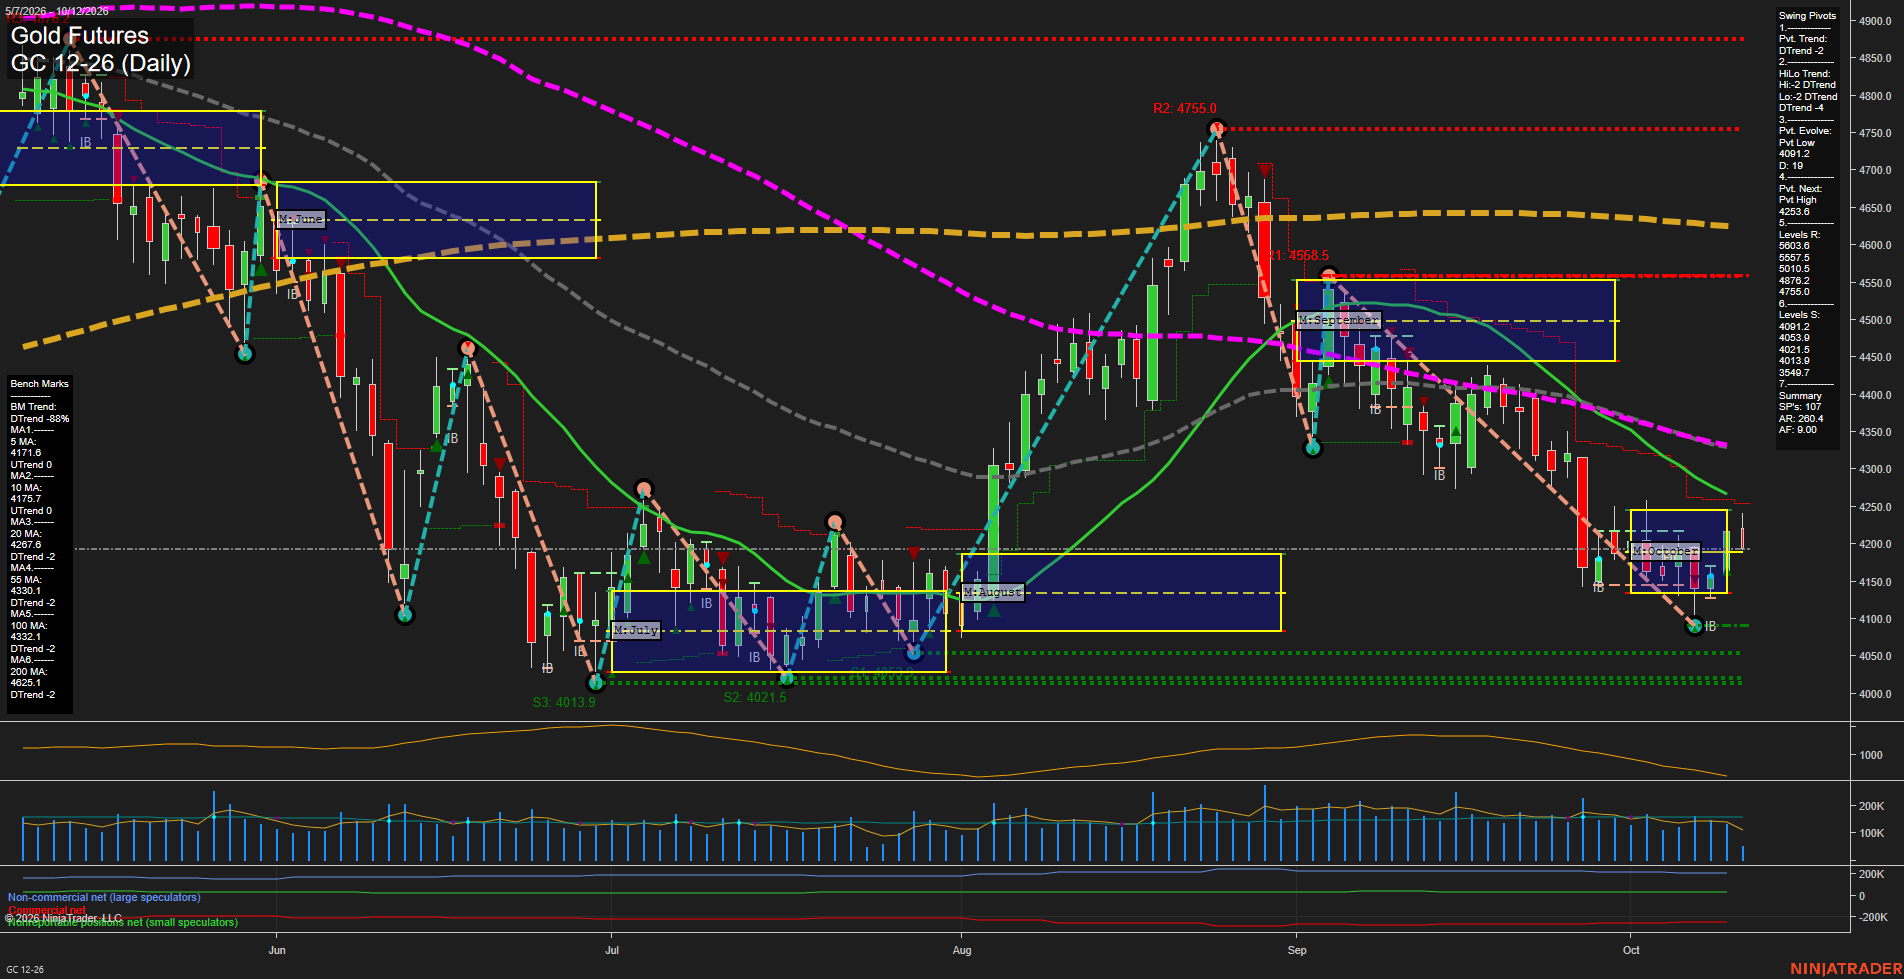
GC Daily View
Overall Rating
- Short-Term: Bearish
- Intermediate-Term: Bearish
- Long-Term: Bearish.
Key Insights Summary
GC is staging a medium-bar rebound from the 4091.2 pivot-low area, placing price marginally above the rising 5-day and 10-day benchmarks. The broader swing structure remains bearish: both pivot trends are down, price remains below the October MSFG balance area and the 20-, 55-, 100-, and 200-day benchmarks, and the larger sequence continues to reflect lower highs following the September peak. The 4239.3 next-pivot level and 4267.6 20-day average define the nearby overhead retracement zone, while 4091.2 through 4013.9 remain the principal downside support cluster. Volatility remains elevated, consistent with choppy countertrend rebounds within a larger daily downtrend.
View charts on: AlphaWebTrader HTF Charts
ZB Daily View
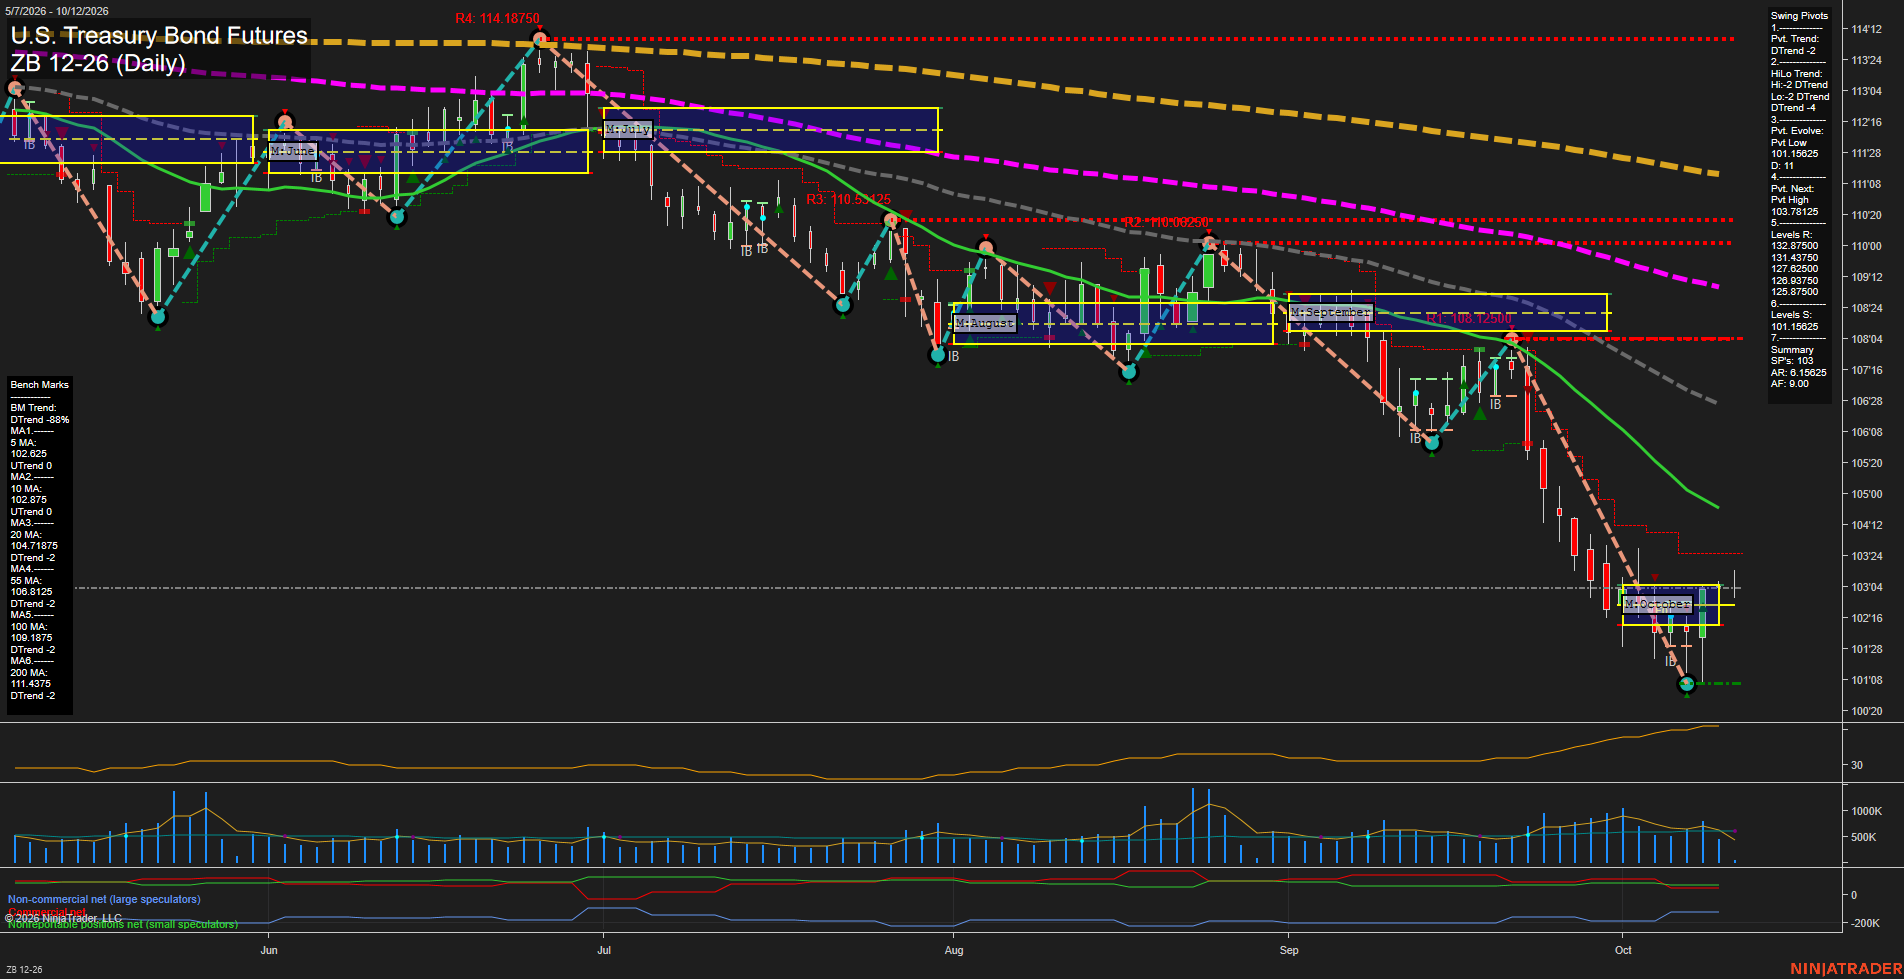
Overall Rating
- Short-Term: Bearish
- Intermediate-Term: Bearish
- Long-Term: Bearish.
Key Insights Summary
The daily structure remains broadly bearish, defined by lower swing highs, a fresh pivot low at 101.15625, and price trading beneath the declining 20, 55, 100, and 200-day benchmarks. The recent rebound from the October low has lifted price above the rising 5 and 10-day averages, but momentum is slow and the recovery remains beneath the 103.78125 pivot-high reversal threshold. Weekly Fib positioning remains below F0% while the yearly grid is deeply negative, reinforcing the dominant decline. The October monthly grid is marginally constructive above F0%, characterizing the current action as a short-term rebound within a larger intermediate- and long-term downtrend.
View charts on: AlphaWebTrader HTF Charts