U.S. stocks eased as AI weakness, rate-hike concerns and CPI focus weighed on risk appetite, while Middle East supply risks supported energy uncertainty.
Fundamentals: U.S. equities closed modestly lower as technology and semiconductor shares faced renewed AI-related pressure ahead of the U.S. inflation report. Fed officials kept further rate increases in focus, lifting yields and weighing on gold and silver. Oil paused after recent gains, although Houthi attacks involving Saudi Arabia sustained concerns over Middle East supply security.
Technicals: Markets closed with mixed ETF performance as META, USO and NVDA advanced while AMZN, IWM and TSLA declined. Futures analysis showed constructive longer-term structures in several contracts, but short-term weakness or corrective pullbacks in ES, NQ, EMD, RTY and FDAX. YM maintained the strongest near-term recovery profile, while small-cap conditions remained broadly bearish.
After Market Close daily snapshot: market news summary and sentiment, major ETFs, Magnificent 7 analysis, Indices Futures Higher Time Frame Analysis, and E-mini S&P500, Nasdaq 100, NYMEX Crude, Gold Futures Daily Chart analysis.
As of: October 13, 2026 05:00 CT
Market News Summary:
U.S. equities softened as AI-sector weakness, firm rate-hike concerns, and a pending inflation report offset mixed bank and energy developments.
Primary Drivers & Risks:
- Primary Driver: Fed tightening and CPI focus
- Primary Risk: AI concentration and technology selling
Tone:
Cautious to risk-off, with energy supply concerns providing an offset.
Stock Market / ETFs / Indices:
U.S. stocks ticked lower after bank earnings failed to ease inflation and rate concerns. AI and chip shares faced pressure from doubts over OpenAI revenue growth, Chinese competition, heavy AI spending, and broader fatigue with the theme. S&P 500 concentration in large technology names remained a highlighted vulnerability, while some commentary cited supportive AI earnings forecasts and valuations.
Geopolitical:
Attacks involving the Houthis and Saudi Arabia kept attention on Middle East supply security. Traders monitored whether regional violence would threaten shipments from Saudi Arabia, a major oil exporter.
Oil / Energy:
Oil eased after a three-day advance as traders took profits, though supply risks in the Middle East remained active. WTI regained ground amid reports of continued Houthi attacks against Saudi Arabia, while an EPA proposal to fully reallocate refinery biofuel exemptions added a U.S. policy issue for the sector.
Gold / Metals:
Gold and silver weakened as front-end Treasury yields and December Fed hike risk remained firm ahead of U.S. inflation data. Gold tested the $4,150 area, with quoted technical levels at $4,066 support and $4,226 resistance. Kazakhstan plans to sell part of its gold reserves after gold reached 78% of its reserve holdings, citing attractive dollar assets at elevated Treasury yields.
Fed / Financials:
Fed officials Collins and Williams kept another 2026 rate increase on the table, with Williams also leaving open further increases in 2027. Bank earnings drew a muted market response, while Bank of America faced approximately $1.21 billion in penalties tied to anti-money-laundering and sanctions compliance failures.
Macro / Other:
Markets focused on Wednesday’s U.S. inflation report, with inflation and policy-tightening concerns weighing on risk appetite. Crypto also saw an overnight leveraged washout, with roughly $800 million in positions liquidated and long positions representing most of the total.
Conclusion:
Rate-hike messaging and the upcoming U.S. inflation report were central index-futures catalysts. AI and semiconductor weakness added pressure to technology-heavy equity exposure.
Middle East disruptions supported energy-related uncertainty even as oil paused after recent gains. Higher yields weighed on precious metals, while the Bank of America penalty added a financial-sector-specific negative development.
Market News Sentiment
Market News Articles: 43
- Negative: 46.51%
- Neutral: 39.53%
- Positive: 13.95%
Sentiment Summary: Market news sentiment is predominantly negative, with 47% negative, 40% neutral, and 14% positive coverage across 43 articles.
Conclusion: The news flow presents a negative-to-neutral tone for indices futures day traders, with negative articles outnumbering positive coverage.
GLD,Gold Articles: 13
- Negative: 46.15%
- Neutral: 30.77%
- Positive: 23.08%
Sentiment Summary: Gold-related coverage was predominantly negative at 46%, with 31% neutral and 23% positive across 13 articles.
Conclusion: The news tone for GLD and gold was net negative, indicating more unfavorable than favorable coverage.
USO,Oil Articles: 11
- Negative: 45.45%
- Positive: 36.36%
- Neutral: 18.18%
Sentiment Summary: USO and oil coverage is mixed with a negative tilt, with 45% negative, 36% positive, and 18% neutral articles.
Conclusion: The oil news tone is modestly risk-negative, which may be relevant to energy-sensitive index futures sentiment.
Market Data Snapshot
ETF Snapshot of major stock market ETFs, Mag7, and others as of: October 13, 2026 05:00
Top Movers & Losers
- META 762.50 Bullish 2.63% ▲
- USO 153.09 Bullish 1.36% ▲
- NVDA 228.52 Bullish 0.97% ▲
- AMZN 258.58 Bearish -0.37% ▼
- IWM 276.70 Bearish -0.43% ▼
- TSLA 375.23 Bearish -0.74% ▼
Major Index ETFs: SPY, QQQ, DIA, IWM, IJH
- IJH 73.26 Bullish 0.14% ▲
- SPY 778.01 Bearish -0.01% ▼
- DIA 516.21 Bearish -0.33% ▼
- QQQ 743.57 Bearish -0.33% ▼
- IWM 276.70 Bearish -0.43% ▼
Mixed index ETF context: IJH is the most bullish mover at +0.14%, while IWM is the most bearish mover at -0.43%. SPY is near-flat at -0.01%; DIA and QQQ are both Bearish at -0.33%.
Mag 7 Stocks: AAPL, MSFT, GOOG, AMZN, META, NVDA, TSLA
- META 762.50 Bullish 2.63% ▲
- NVDA 228.52 Bullish 0.97% ▲
- MSFT 543.45 Bullish 0.42% ▲
- GOOG 349.52 Bullish 0.16% ▲
- AAPL 341.27 Bullish 0.09% ▲
- AMZN 258.58 Bearish -0.37% ▼
- TSLA 375.23 Bearish -0.74% ▼
Mixed: META is the most bullish mover at +2.63%, followed by NVDA at +0.97%. MSFT gained +0.42%, while GOOG at +0.16% and AAPL at +0.09% were marginal. TSLA is the most bearish mover at -0.74%, with AMZN lower by -0.37%.
Cross-Market ETFs: TLT, GLD, USO, IBIT
- USO 153.09 Bullish 1.36% ▲
- IBIT 47.13 Bullish 0.58% ▲
- TLT 78.37 Bullish 0.41% ▲
- GLD 381.67 Bearish -0.13% ▼
Other ETFs were Mixed: USO was the most bullish mover at +1.36%, followed by IBIT at +0.58% and TLT at +0.41%. GLD was the most bearish mover, marginally lower at -0.13%.
ETF, Mag7, and Cross-Market ETF Insights
Overall Tone
Mixed, with selective strength in META and NVDA offset by Bearish small-cap, Nasdaq, and TSLA performance.
Equity ETFs and Mag7:
Major Index ETFs were Mixed: SPY was marginally Bearish at -0.01%, while IJH gained +0.14%; DIA and QQQ each declined -0.33% and IWM fell -0.43%. Mag7 action was selective, led by META at +2.63%, the most bullish mover, followed by NVDA +0.97%, MSFT +0.42%, GOOG +0.16%, and AAPL +0.09%; AMZN lost -0.37% and TSLA, the most bearish mover, declined -0.74%.
Cross-Market ETFs:
Cross-market ETFs were Mixed, with USO advancing +1.36% as the most bullish mover and IBIT gaining +0.58%. TLT added +0.41%, while GLD was marginally Bearish at -0.13%, making it the most bearish cross-market mover.
Futures Indices – Higher Time Frame Analysis
Summary of the current state of US Indices Futures based on higher time-frame (HTF) technical analysis as of: 2026-10-13: 17:00 CT.
US Indices Futures
- ES: YSFG/MSFG above F0%, WSFG short below F0%; benchmarks rising, 7906.25 resistance, 7749.50 support, 7587.75 reversal pivot.
- NQ: YSFG constructive, MSFG/WSFG below F0%; benchmarks broadly rising, 31616.50 resistance, 30804.75 pivot support, 29459.50 reversal level.
- YM: YSFG/MSFG/WSFG above F0%; short-term recovery above 5/10/20-day benchmarks, 52583-52844 resistance, 51421 and 50859 support.
- EMD: YSFG/MSFG above F0%, WSFG below F0%; declining short benchmarks, 3737.8 resistance, 3624.2-3600.3 support, 3332.6 lower reference.
- RTY: YSFG above F0%, MSFG/WSFG below F0%; benchmarks and pivots bearish, 2859-2887.2 resistance, 2778.6-2768.4 support.
- FDAX: YSFG/MSFG/WSFG above F0%; short-term rebound, intermediate benchmarks declining, 25589-25990 resistance, 24925-24897 support, 26847 major high.
Overall State
- Short-Term: Bearish
- Intermediate-Term: Bullish
- Long-Term: Bullish
Conclusion
US index futures show mixed short-term conditions within predominantly constructive higher-time-frame structure. ES, NQ, EMD, and RTY retain bearish or corrective WSFG and near-term pivot alignment, while YM and FDAX show short-term recovery structures. YSFG remains constructive across all listed contracts, with rising long-term benchmarks broadly intact. ES and NQ remain near recent swing-high resistance; EMD and RTY remain nearer active downside pivot support. YM and FDAX rebounds are approaching overhead benchmark and pivot-resistance zones.
Note: Intra-day counter-trend pullbacks or retracements may occur, HTF is context for informational usage and market structure. Glossary: Session Fib Grids periods of YSFG:’Yearly’, MSFG:’Monthly’, WSFG:’Weekly’
For full details visit: AlphaWebTrader Technicals
ES Daily View
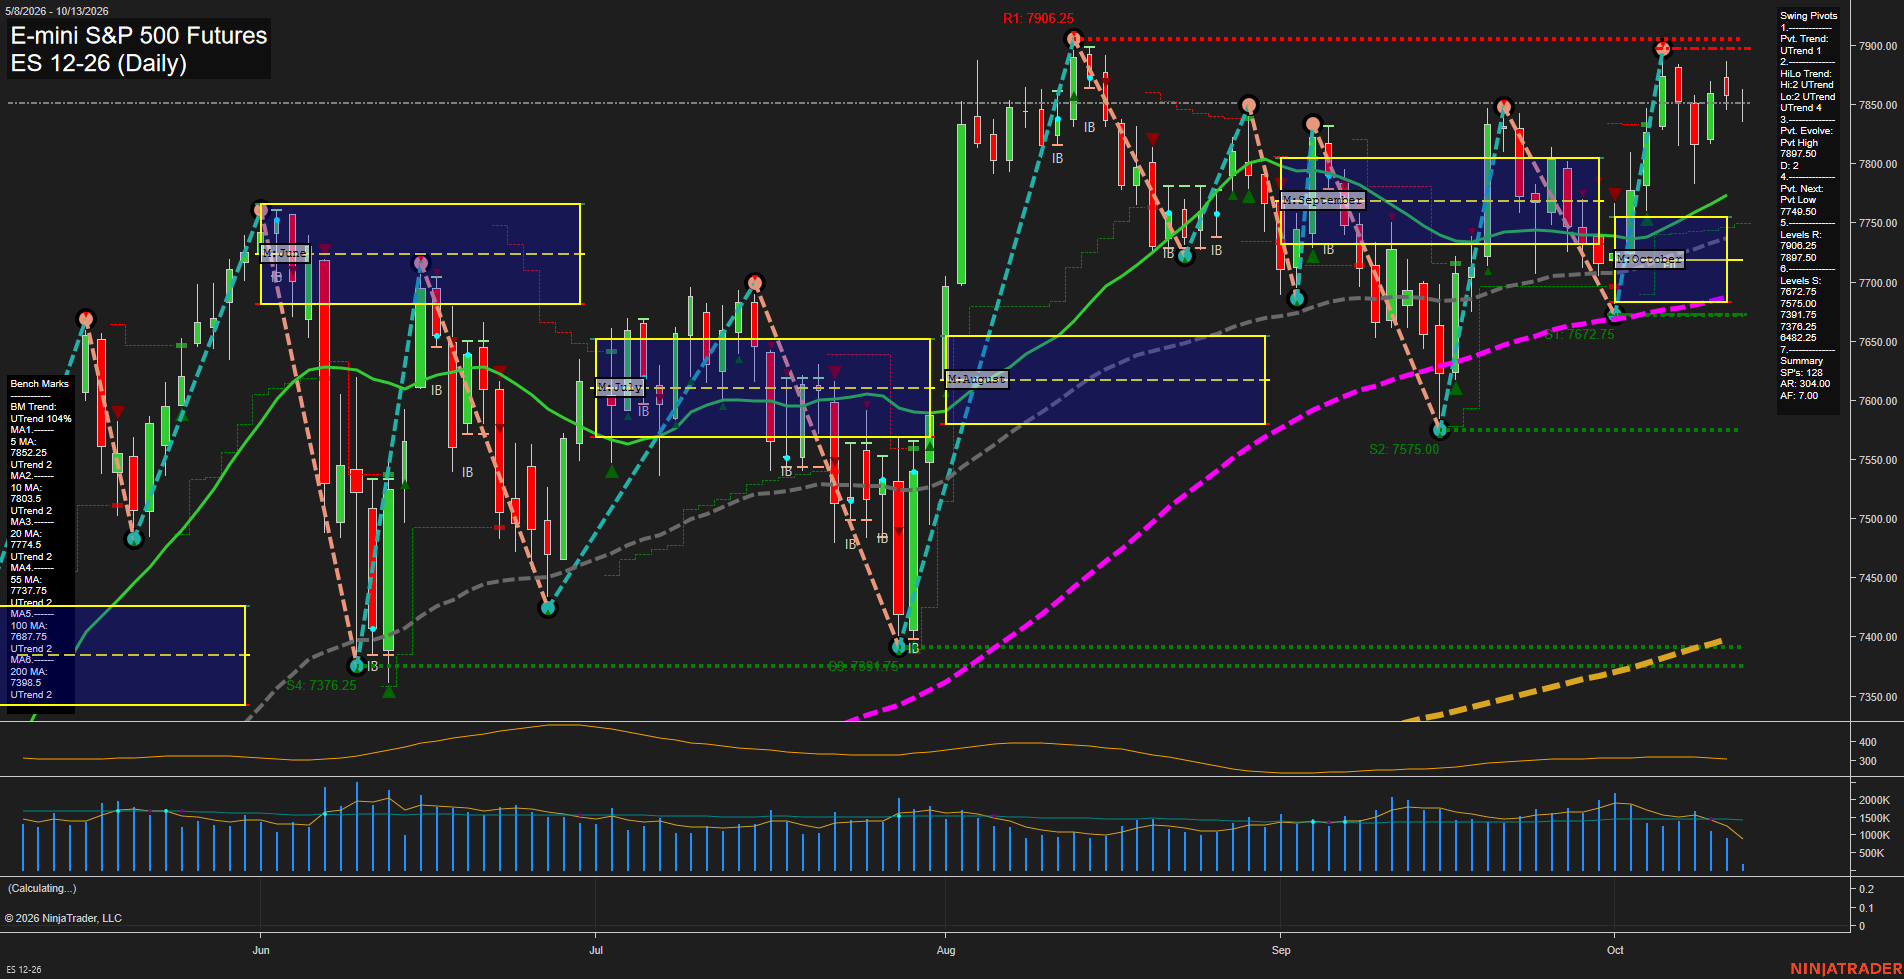
Overall Rating
- Short-Term: Neutral
- Intermediate-Term: Bullish
- Long-Term: Bullish.
Key Insights Summary
Daily structure remains constructive, with both pivot trends rising and price holding above the rising 10-, 20-, 55-, 100-, and 200-day benchmarks. The near-term condition is mixed: price is slightly below the 5-day average, below the weekly F0%/NTZ area, and beneath clustered 7897.50-7906.25 pivot resistance following rejection from the recent high. This reflects a short-term consolidation/pullback within an intermediate and long-term uptrend. The 7749.50 pivot-next level and the rising 20-/55-day averages define the active lower structural area, while the October MSFG and yearly grid remain positively aligned above their F0% zones.
View charts on: AlphaWebTrader HTF Charts
NQ Daily View
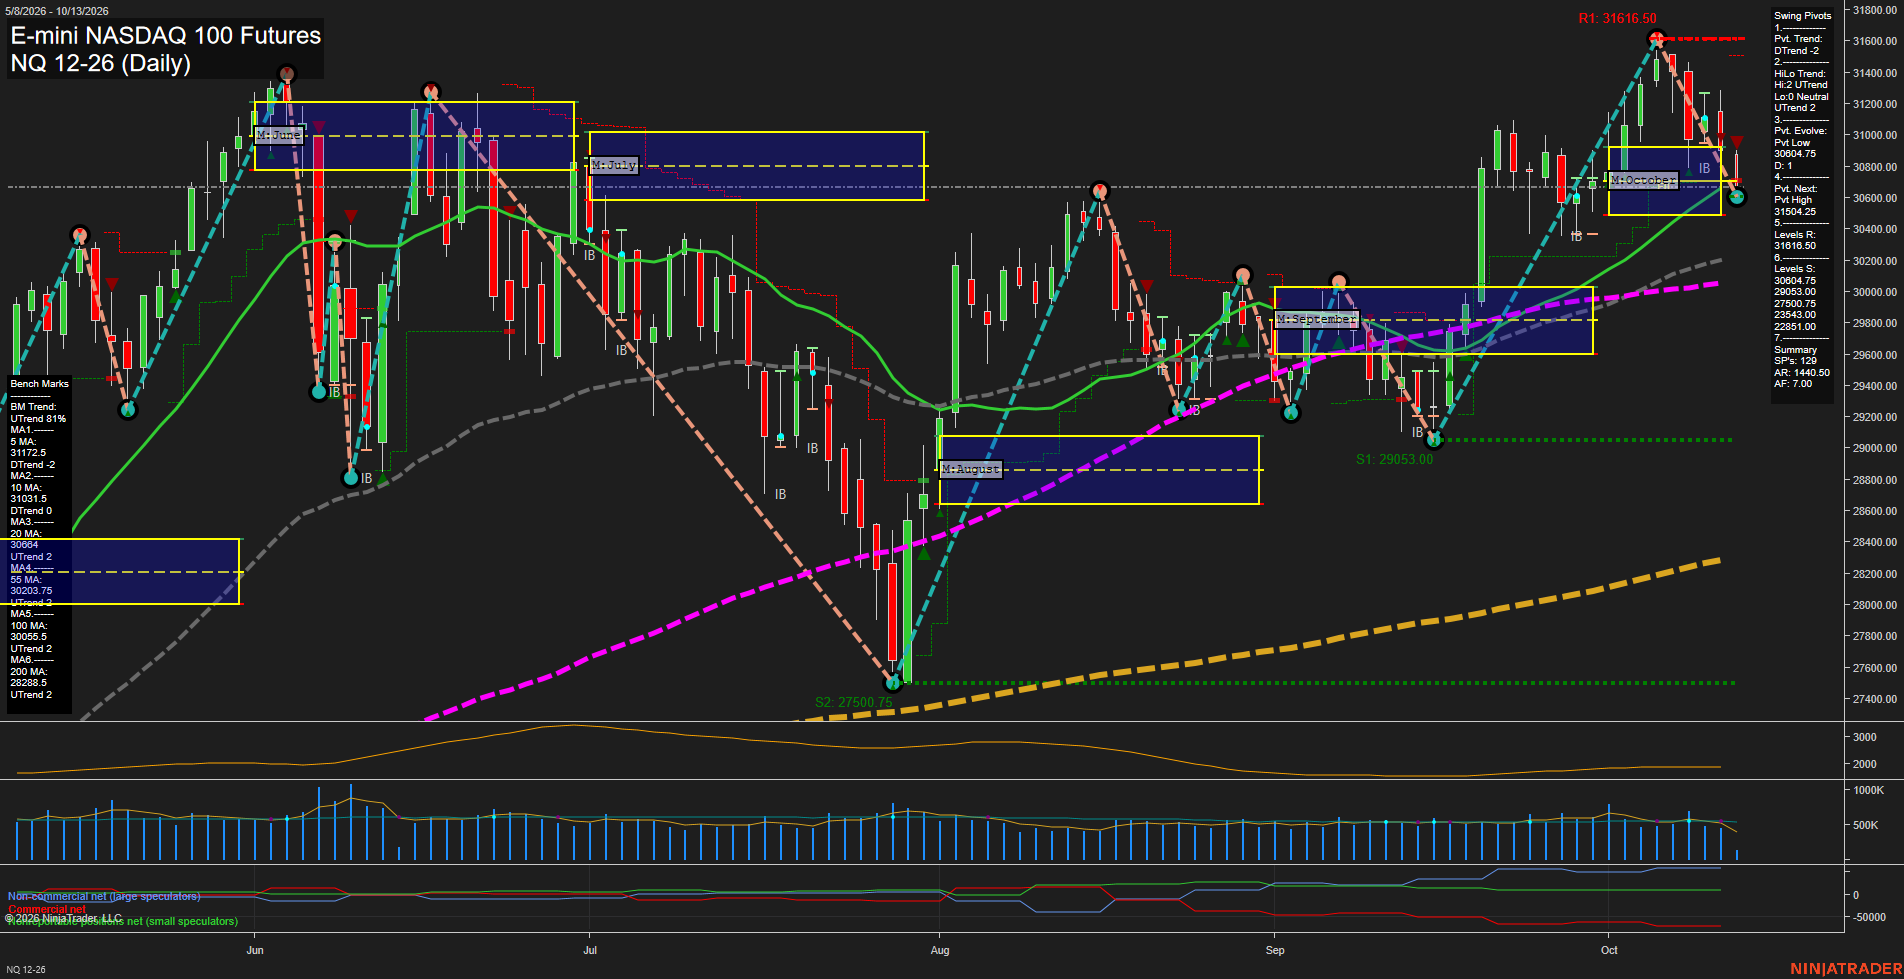
Overall Rating
- Short-Term: Bearish
- Intermediate-Term: Bullish
- Long-Term: Bullish.
Key Insights Summary
Price is in a short-term corrective downswing after rejecting the 31616.50 pivot high, with lower short-term benchmarks and negative weekly and monthly fib-grid positioning defining the immediate tone. The decline has reached the rising 20-day average area and the 30804.75 pivot-low reference, producing a bounce but not yet reversing the short-term DTrend. Intermediate and long-term structure remains constructive because price holds above the rising 20-, 55-, 100-, and 200-day averages, while the yearly grid remains strongly positive. The chart reflects a pullback within the broader advance, with 31504.25 to 31616.50 marking the principal overhead pivot-resistance zone and 29053.00 representing the next major structural support below the current swing area.
View charts on: AlphaWebTrader HTF Charts
CL Daily View
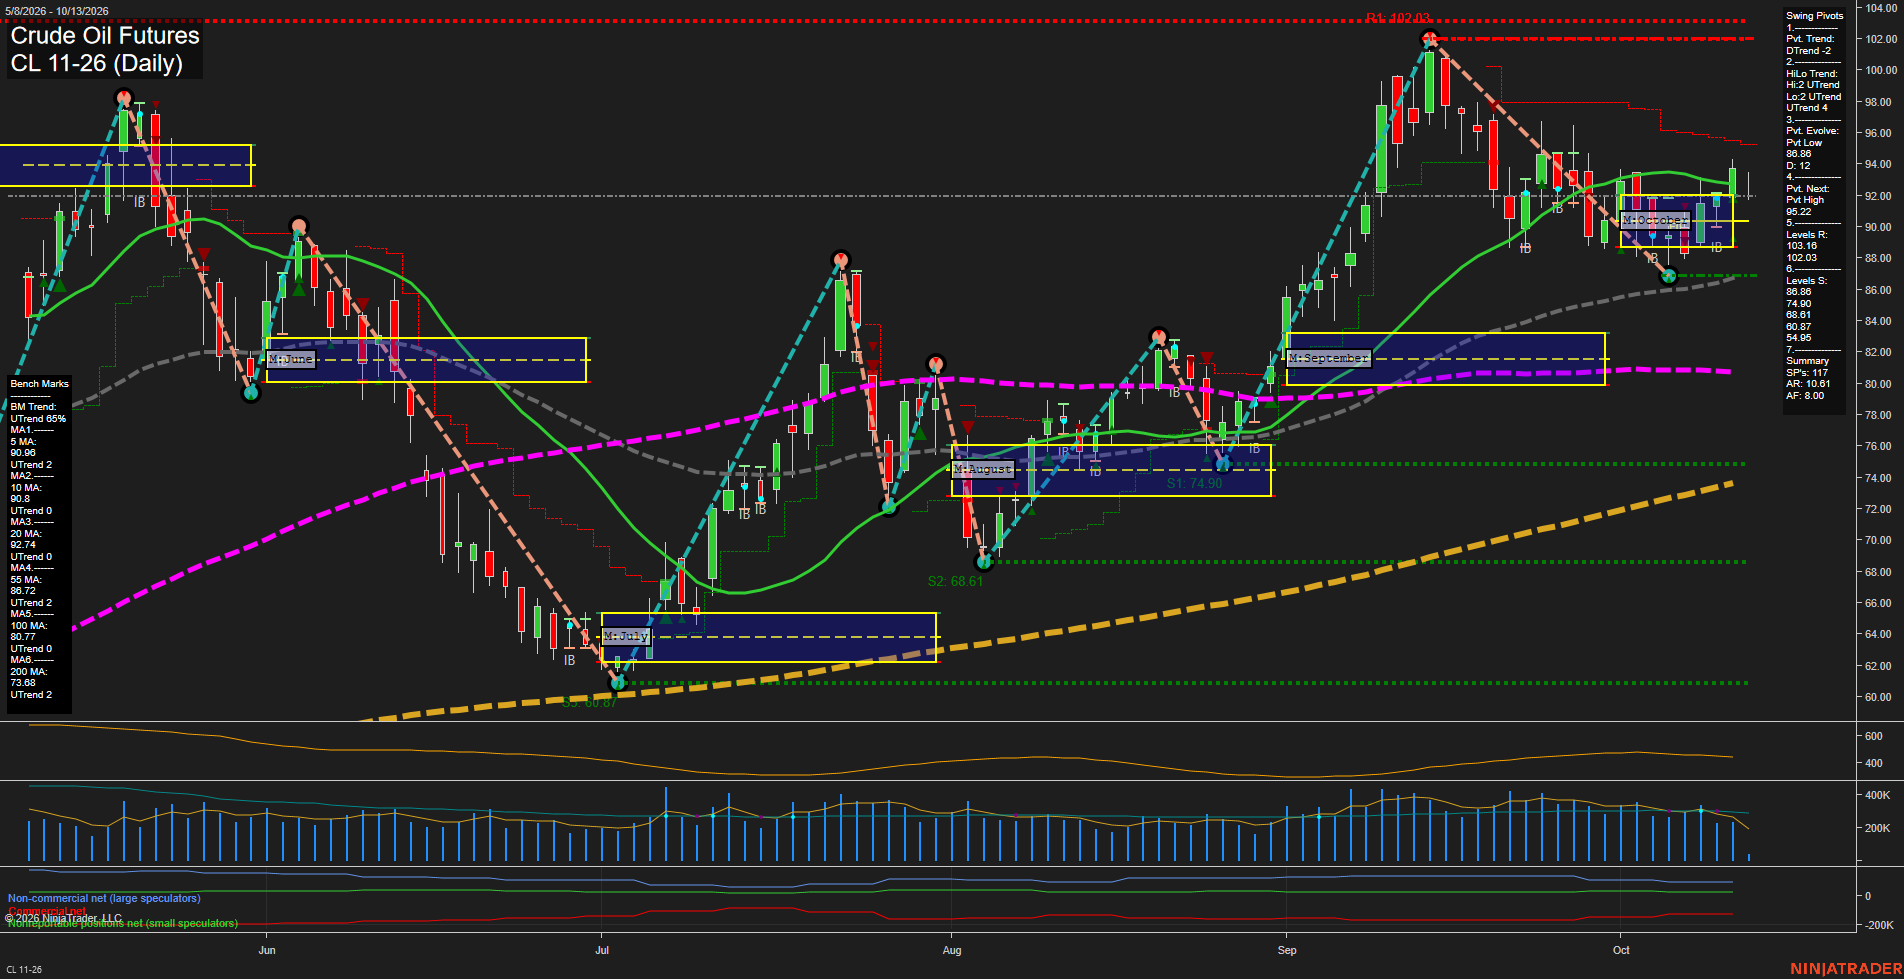
Overall Rating
- Short-Term: Bullish
- Intermediate-Term: Bullish
- Long-Term: Bullish.
Key Insights Summary
Price has stabilized above the October monthly F0% area and is consolidating near the 20-day benchmark after the sharp September advance and subsequent pullback. The short-term pivot remains in DTrend from the 102.03 swing high, while the intermediate HiLo structure remains UTrend following the 86.86 higher low. Rising 5-, 10-, 20-, 55-, 100-, and 200-day benchmarks align with the positive weekly, monthly, and yearly fib-grid trends. The current structure is a recovery within a broader uptrend, with 95.22 defining the next upside pivot threshold, 102.03 the major overhead swing resistance, and 86.86 the principal nearby structural support.
View charts on: AlphaWebTrader HTF Charts
GC Daily View
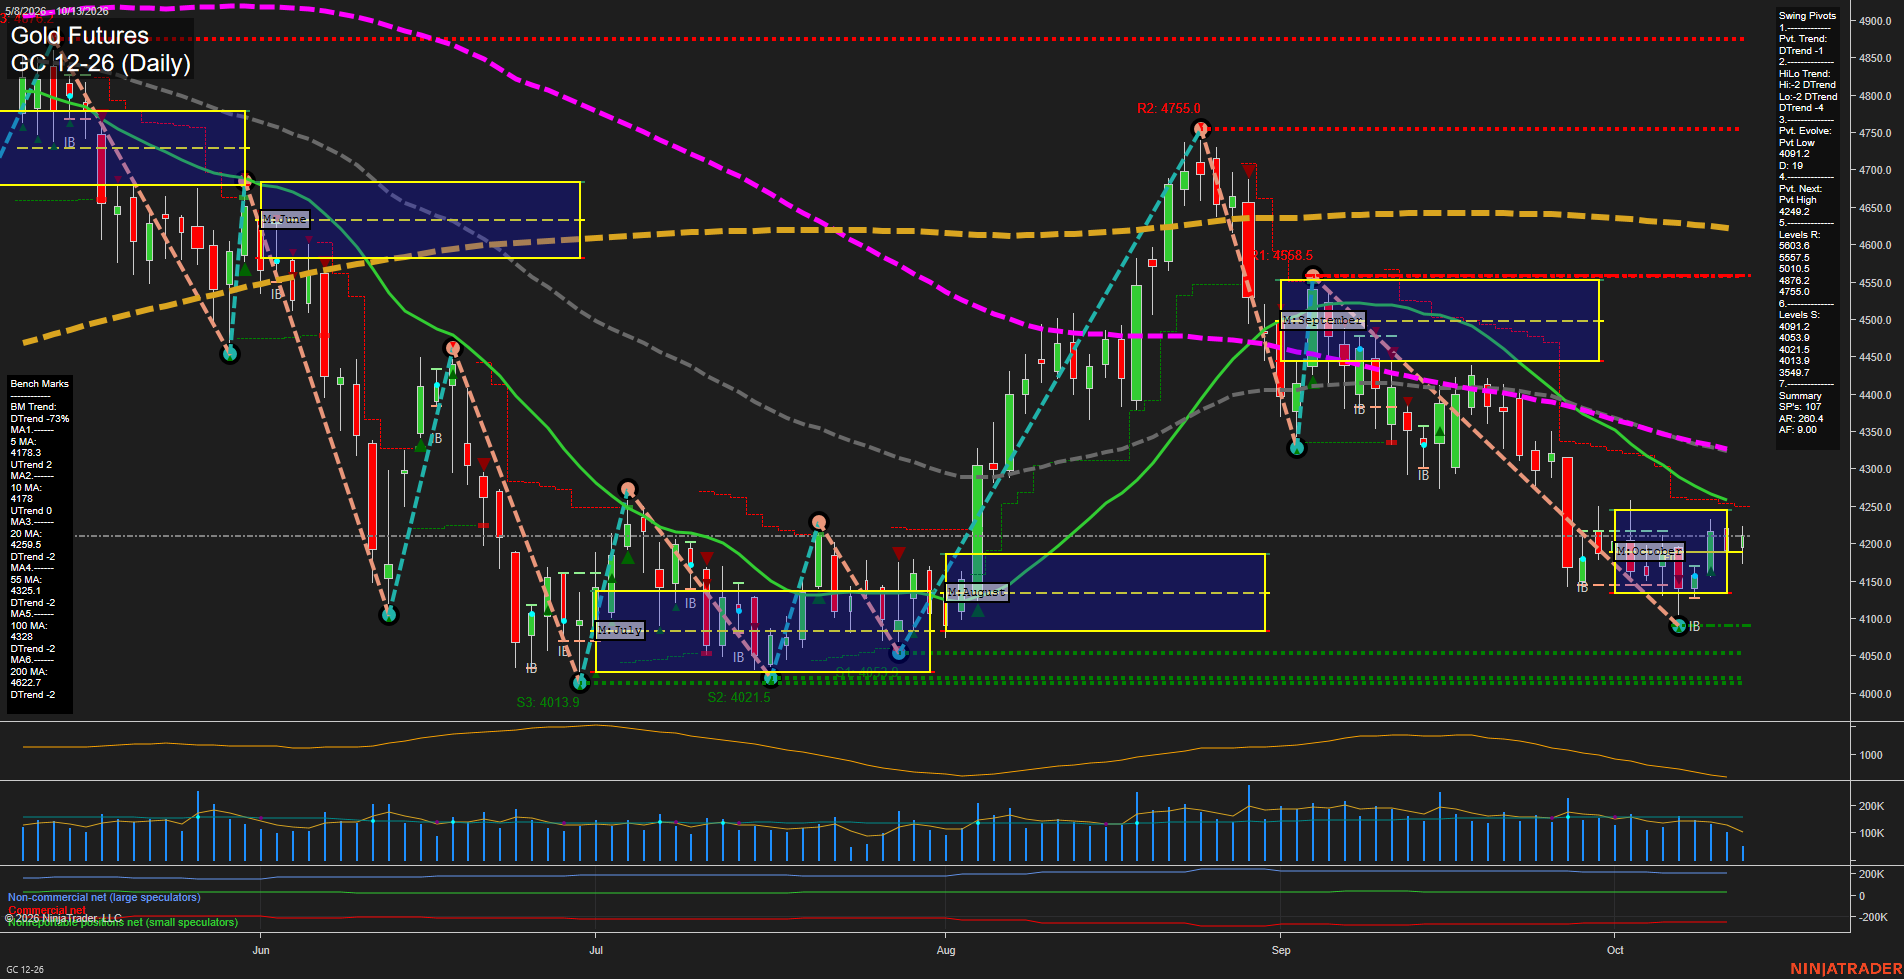
Overall Rating
- Short-Term: Bearish
- Intermediate-Term: Bearish
- Long-Term: Bearish.
Key Insights Summary
Price is consolidating above the 4091.2 pivot low after a sharp September-to-October selloff, but the swing-pivot structure remains in DTrend and price remains beneath the declining 20, 55, 100, and 200-day benchmarks. The short-term 5 and 10-day averages have turned higher, reflecting a modest rebound from the October low, while the weekly grid remains below its F0% reference. The 4249.2 pivot-next level and declining 20-day average near 4259.5 define the nearby rebound ceiling; 4091.2, 4053.9, and the 4021.5-4013.9 support cluster frame the lower consolidation boundary. ATR remains elevated, indicating that daily swings are still broad despite the recent smaller candles and slowing momentum.
View charts on: AlphaWebTrader HTF Charts
ZB Daily View
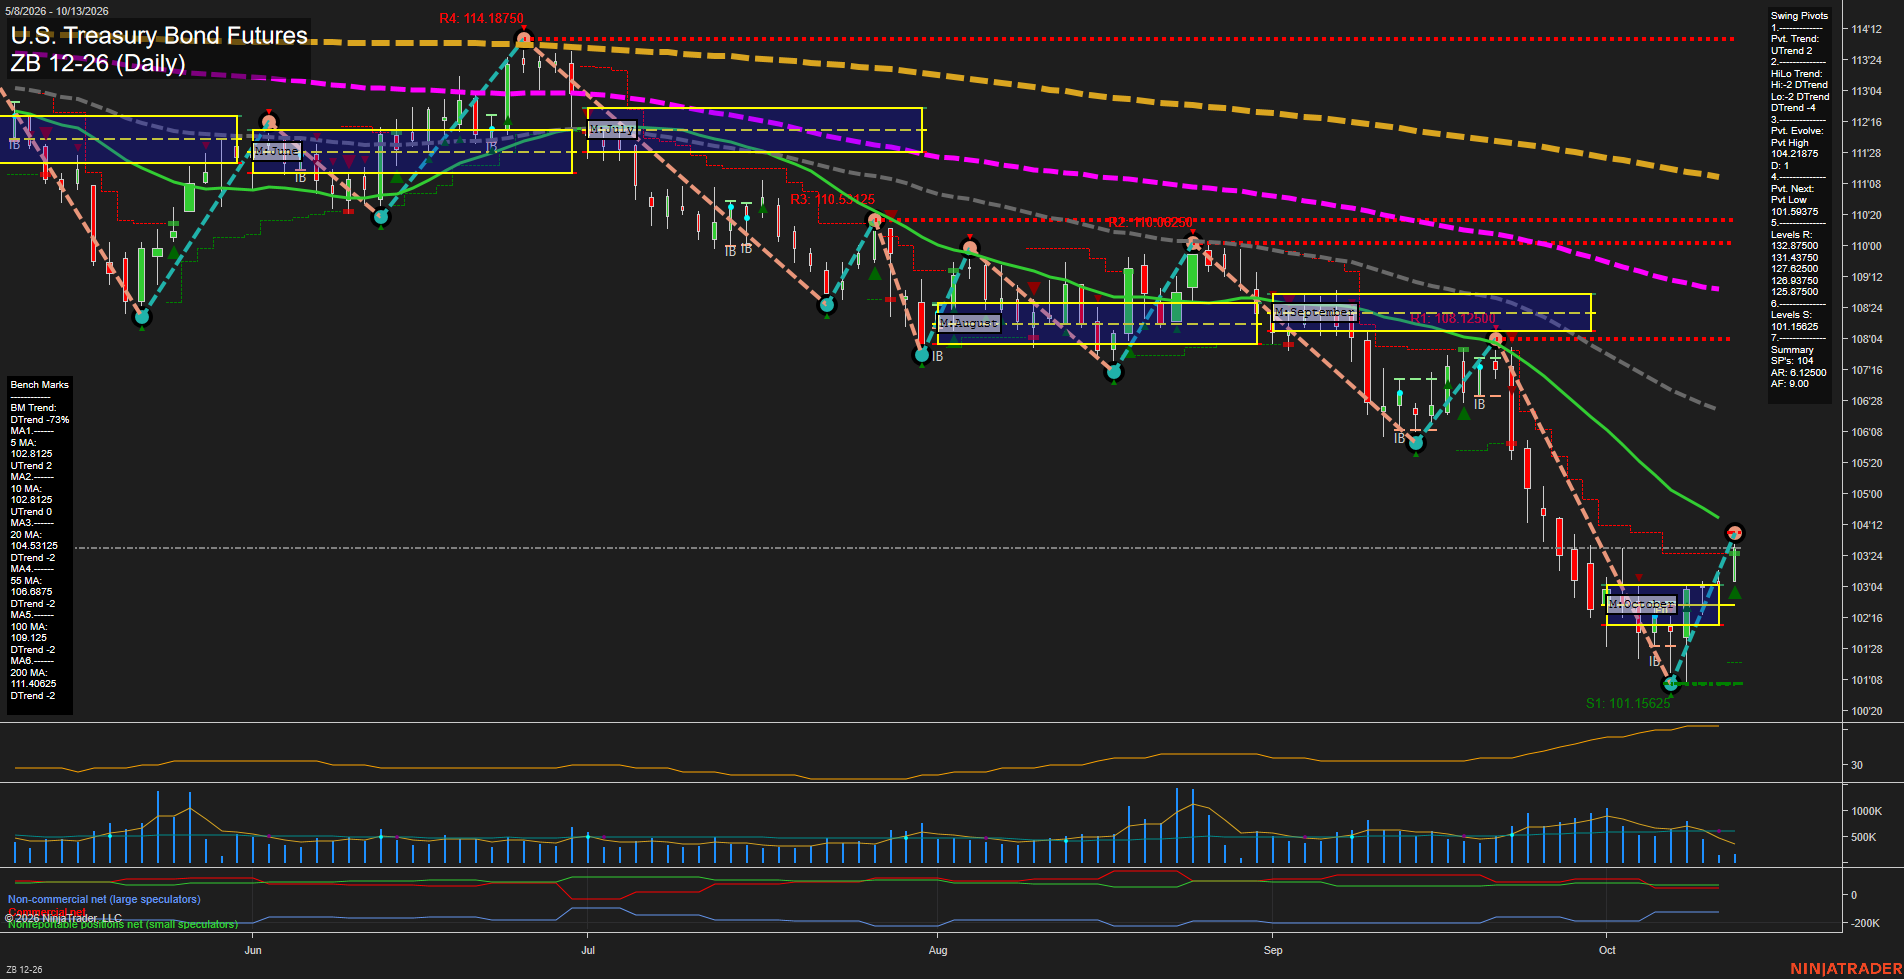
Overall Rating
- Short-Term: Bullish
- Intermediate-Term: Bearish
- Long-Term: Bearish.
Key Insights Summary
The market is in a sharp short-term rebound from the 101.15625 swing low, with price above the weekly F0% level, rising short-term benchmarks, and a current UTrend pivot sequence. The recovery remains a counter-trend rally within a broader intermediate- and long-term decline: price remains beneath the falling 20-, 55-, 100-, and 200-day averages, while the HiLo pivot trend and yearly grid remain down. The 104.1250 pivot-high area is the immediate structural ceiling, and the recent large-range advance reflects fast upside momentum after the October washout.
View charts on: AlphaWebTrader HTF Charts