U.S. stocks declined after hot September CPI lifted Treasury yields and Fed-hike concerns, pressuring tech, banks, small caps, gold and silver.
Fundamentals: U.S. markets closed lower as September inflation data strengthened concerns that the Federal Reserve may need to keep policy restrictive for longer. Higher Treasury yields and a stronger dollar weighed on technology, chip, bank and small-cap shares, while gold and silver fell as real yields rose. Energy costs, diesel supply risks and AI valuation concerns added to the broader risk-off tone.
Technicals: The NYSE session featured gains in TLT, Apple and USO, while Tesla, Nvidia and Meta declined. Futures analysis showed broadly constructive intermediate and long-term trends in ES, with short-term weakness in NQ and RTY. YM and FDAX displayed rebound strength, while EMD remained constrained by bearish daily structure and nearby resistance.
After Market Close daily snapshot: market news summary and sentiment, major ETFs, Magnificent 7 analysis, Indices Futures Higher Time Frame Analysis, and E-mini S&P500, Nasdaq 100, NYMEX Crude, Gold Futures Daily Chart analysis.
As of: October 14, 2026 05:00 CT
Market News Summary:
Hot September CPI lifted Treasury yields and rate-hike concerns, driving a broad equity sell-off and pressure across rate-sensitive assets.
Primary Drivers & Risks:
- Primary Driver: Hot CPI lifts Treasury yields
- Primary Risk: Renewed Fed tightening repricing
Tone:
Risk-off, with inflation and rates dominating market action.
Stock Market / ETFs / Indices:
U.S. stocks fell as hotter inflation revived concerns over another Federal Reserve rate increase. Banks, chip stocks, and AI-linked shares were cited as areas of weakness, while small caps were reported down 10% from their record high within two months. The S&P 500 faced pressure from rising long-term yields, with market breadth also cited as a constraint.
Oil / Energy:
Higher gasoline and diesel costs were identified as contributors to elevated inflation. WTI tested weekly highs as traders focused on the Saudi Arabia situation after Houthi attacks, while tight global diesel supply remained a concern despite temporary removal of sanctions on Russian diesel.
Gold / Metals:
Gold fell below $4,100 and silver dropped 6% as hot CPI lifted real yields, strengthened the dollar, and increased Fed-tightening expectations. Gold approached technical support near $4,066, although separate reports cited ETF inflows, central-bank buying, and bullish longer-term institutional views.
Fed / Financials:
September headline CPI reached 3.7% year over year, up from 3.4%, while core CPI registered 2.6%, its fastest pace since June. Treasury yields and the dollar rose as markets repriced rate expectations. San Francisco Fed President Mary Daly said further hikes were needed to restrain inflation, while signaling no urgency for action at the October 27-28 meeting.
Macro / Other:
Persistent inflation was described as increasingly embedded in consumer behavior, complicating monetary-policy effectiveness. Rising bond yields continued to weigh on bonds and traditional 60/40 portfolios, while concerns over AI-company revenue, debt financing, and valuations added to broader risk aversion.
Conclusion:
Hot CPI, rising Treasury yields, and renewed Fed-hike concerns were the central forces behind the equity decline. Technology, chips, banks, and small caps faced notable pressure.
Energy-price risks added to the inflation backdrop, while gold and silver weakened alongside higher real yields and a stronger dollar. AI valuation and financing concerns intensified the broader risk-off move.
Market News Sentiment
Market News Articles: 49
- Neutral: 42.86%
- Negative: 36.73%
- Positive: 20.41%
Sentiment Summary: Among 49 market news articles, 43% were neutral, 37% negative, and 20% positive, indicating neutral-to-cautious news tone for indices futures.
Conclusion: Neutral coverage led, while negative articles outnumbered positive articles by 17 percentage points.
GLD,Gold Articles: 16
- Negative: 56.25%
- Positive: 31.25%
- Neutral: 12.50%
Sentiment Summary: Gold-related coverage was predominantly negative at 56%, with 31% positive and 13% neutral across 16 articles.
Conclusion: The gold news tone was net negative, indicating more unfavorable than favorable coverage in the snapshot.
USO,Oil Articles: 10
- Positive: 40.00%
- Neutral: 30.00%
- Negative: 30.00%
Sentiment Summary: USO/Oil coverage is mixed, with 40% positive, 30% neutral, and 30% negative articles.
Conclusion: Oil-related news tone is slightly positive overall but remains balanced across sentiment categories for indices futures day traders.
Market Data Snapshot
ETF Snapshot of major stock market ETFs, Mag7, and others as of: October 14, 2026 05:00
Top Movers & Losers
- TLT 78.89 Bullish 0.66% ▲
- AAPL 342.96 Bullish 0.50% ▲
- USO 153.56 Bullish 0.31% ▲
- TSLA 367.16 Bearish -2.15% ▼
- NVDA 221.30 Bearish -3.16% ▼
- META 737.54 Bearish -3.27% ▼
Major Index ETFs: SPY, QQQ, DIA, IWM, IJH
- DIA 515.63 Bearish -0.11% ▼
- SPY 769.60 Bearish -1.08% ▼
- IJH 72.27 Bearish -1.35% ▼
- IWM 271.37 Bearish -1.93% ▼
- QQQ 728.95 Bearish -1.97% ▼
Major index ETFs were Bearish across the group. QQQ was the most bearish mover at -1.97%, followed by IWM at -1.93%; SPY declined -1.08% and IJH fell -1.35%. DIA was the least negative mover, marginally lower at -0.11%.
Mag 7 Stocks: AAPL, MSFT, GOOG, AMZN, META, NVDA, TSLA
- AAPL 342.96 Bullish 0.50% ▲
- GOOG 343.65 Bearish -1.68% ▼
- AMZN 254.08 Bearish -1.74% ▼
- MSFT 533.69 Bearish -1.80% ▼
- TSLA 367.16 Bearish -2.15% ▼
- NVDA 221.30 Bearish -3.16% ▼
- META 737.54 Bearish -3.27% ▼
Mixed Mag7 action: AAPL was the most bullish mover at +0.50%, while META was the most bearish mover at -3.27%. Broad Bearish pressure also included NVDA -3.16%, TSLA -2.15%, MSFT -1.80%, AMZN -1.74%, and GOOG -1.68%.
Cross-Market ETFs: TLT, GLD, USO, IBIT
- TLT 78.89 Bullish 0.66% ▲
- USO 153.56 Bullish 0.31% ▲
- GLD 375.99 Bearish -1.49% ▼
- IBIT 46.24 Bearish -1.89% ▼
Mixed cross-market snapshot: TLT is the most bullish mover at +0.66%, followed by USO at +0.31%. GLD is bearish at -1.49%, while IBIT is the most bearish mover at -1.89%.
ETF, Mag7, and Cross-Market ETF Insights
Overall Tone
Bearish and risk-off overall, led by broad equity ETF and Mag7 declines while bonds and oil remained Bullish.
Equity ETFs and Mag7:
Major equity ETFs were Bearish, with QQQ at -1.97%, IWM at -1.93%, IJH at -1.35%, and SPY at -1.08%; DIA was marginally Bearish at -0.11%. Mag7 performance was selective only at the top, with AAPL the most bullish mover at +0.50%, while META was the most bearish mover at -3.27%, followed by NVDA at -3.16% and TSLA at -2.15%.
Cross-Market ETFs:
Cross-market action was Mixed: TLT was the most bullish mover at +0.66% and USO was Bullish at +0.31%, contrasting with Bearish equity ETFs. GLD declined -1.49%, while IBIT was the most bearish cross-market mover at -1.89%.
Futures Indices – Higher Time Frame Analysis
Summary of the current state of US Indices Futures based on higher time-frame (HTF) technical analysis as of: 2026-10-14: 17:00 CT.
US Indices Futures
- ES YSFG/MSFG upward, WSFG below F0%, benchmarks rising; 7906 resistance, 7588 pivot support, 7691-7749 benchmark cluster.
- NQ YSFG upward, MSFG/WSFG below centers; benchmarks broadly rising, 31616 resistance, 30512 pivot support, 29459 reversal level.
- YM YSFG/MSFG upward, WSFG corrective; short benchmarks declining weekly, 53211 pivot threshold, 55316 resistance, 50859 support.
- EMD YSFG/MSFG above F0%, WSFG down; short benchmarks declining, 3794-3970 resistance, 3600 pivot support, 3333 deeper support.
- RTY YSFG upward, MSFG/WSFG below F0%; benchmarks mixed-to-down, 2941 reversal pivot, 2779 support, 3102 resistance.
- FDAX grids broadly upward; short pivot recovery contrasts weekly DTrend, 25589 resistance, 24925 pivot support, intermediate benchmarks mixed.
Overall State
- Short-Term: Bearish
- Intermediate-Term: Neutral
- Long-Term: Bullish
Conclusion
ES retains an upward intermediate and long-term structure while consolidating below pivot resistance. NQ, EMD, and RTY show short-term downward correlations beneath weekly or monthly grid references; RTY has the broadest benchmark and pivot weakness. YM and FDAX display daily recovery structures, though YM remains beneath intermediate benchmarks and FDAX retains mixed intermediate alignment. Yearly grids and longer benchmarks remain upward across most contracts, preserving broad long-term support structures.
Note: Intra-day counter-trend pullbacks or retracements may occur, HTF is context for informational usage and market structure. Glossary: Session Fib Grids periods of YSFG:’Yearly’, MSFG:’Monthly’, WSFG:’Weekly’
For full details visit: AlphaWebTrader Technicals
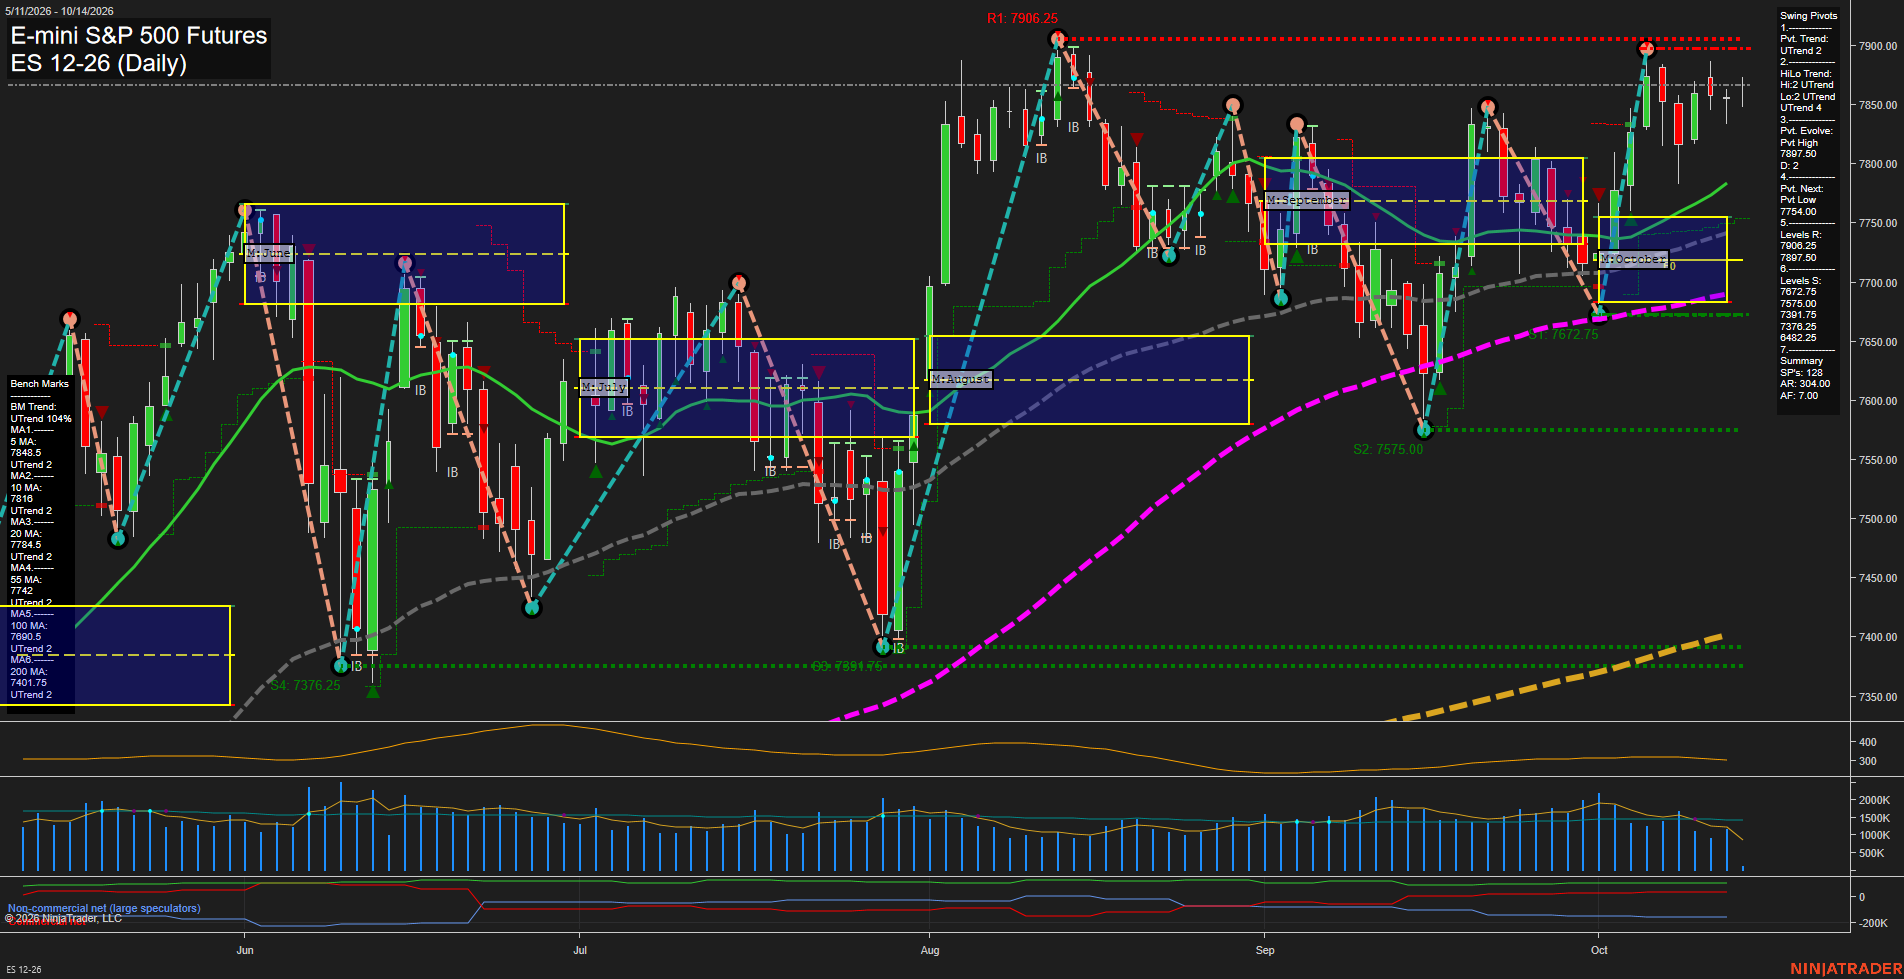
ES Daily View
Overall Rating
- Short-Term: Neutral
- Intermediate-Term: Bullish
- Long-Term: Bullish.
Key Insights Summary
Price is consolidating beneath the 7897.50-7902.25 pivot-resistance band after a sharp October recovery. Short-term structure remains mixed because price is below the weekly Fib-grid center zone and momentum has slowed, while the pivot trend remains upward and price holds above all daily benchmark averages. Intermediate and long-term conditions remain constructive, supported by rising 20-, 55-, 100-, and 200-day averages, an upward monthly and yearly Fib-grid position, and a sequence of higher-level support zones. The 7754 pivot-reversal area and 7672.75 support are the principal downside structure levels beneath the current consolidation.
View charts on: AlphaWebTrader HTF Charts
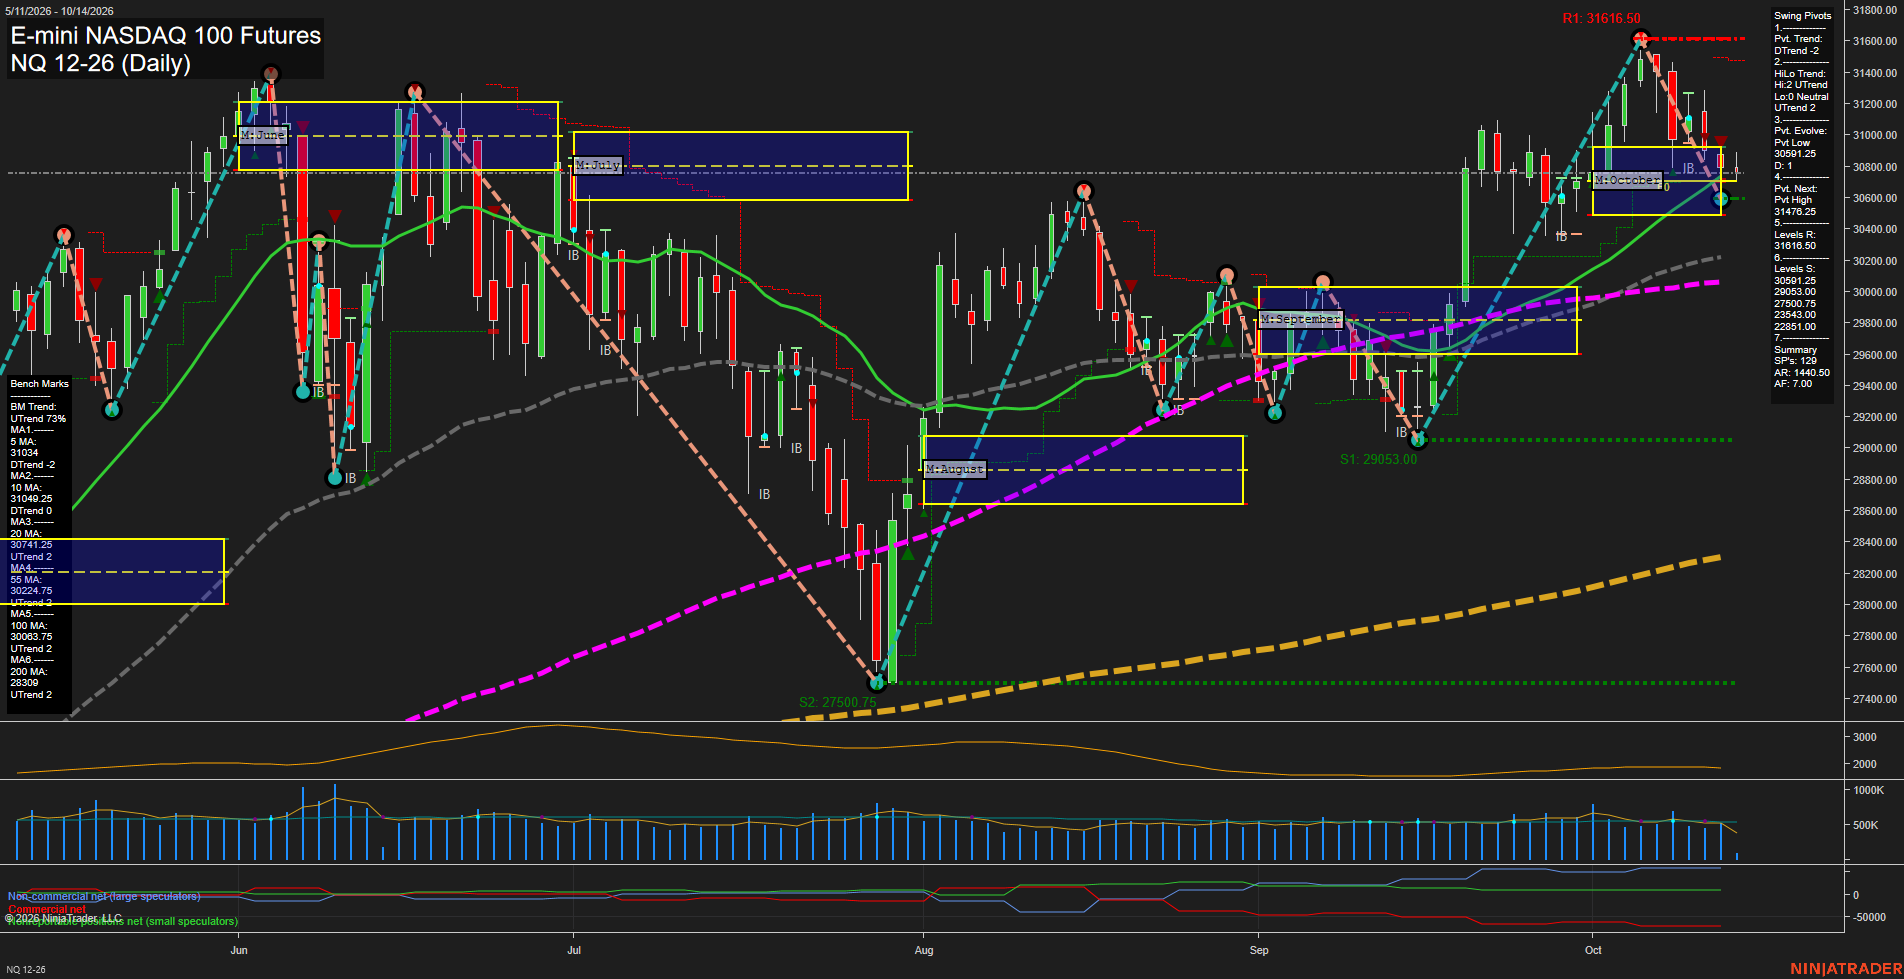
NQ Daily View
Overall Rating
- Short-Term: Bearish
- Intermediate-Term: Neutral
- Long-Term: Bullish.
Key Insights Summary
Price remains below the weekly and monthly Fibonacci center zones and beneath the declining 5-day and 10-day benchmarks, reflecting a short-term pullback from the 31616.50 pivot high. The developing 30512 pivot low and nearby 30591.25 support define the immediate downside structure, while 31476.25 is the reversal threshold for a new short-term pivot high. Intermediate structure remains constructive because price is holding near the rising 20-day average and above the rising 55-day, 100-day, and 200-day benchmarks. The recent decline is a counter-trend retracement within the broader 2026 uptrend, with elevated ATR indicating a wide daily swing environment.
View charts on: AlphaWebTrader HTF Charts
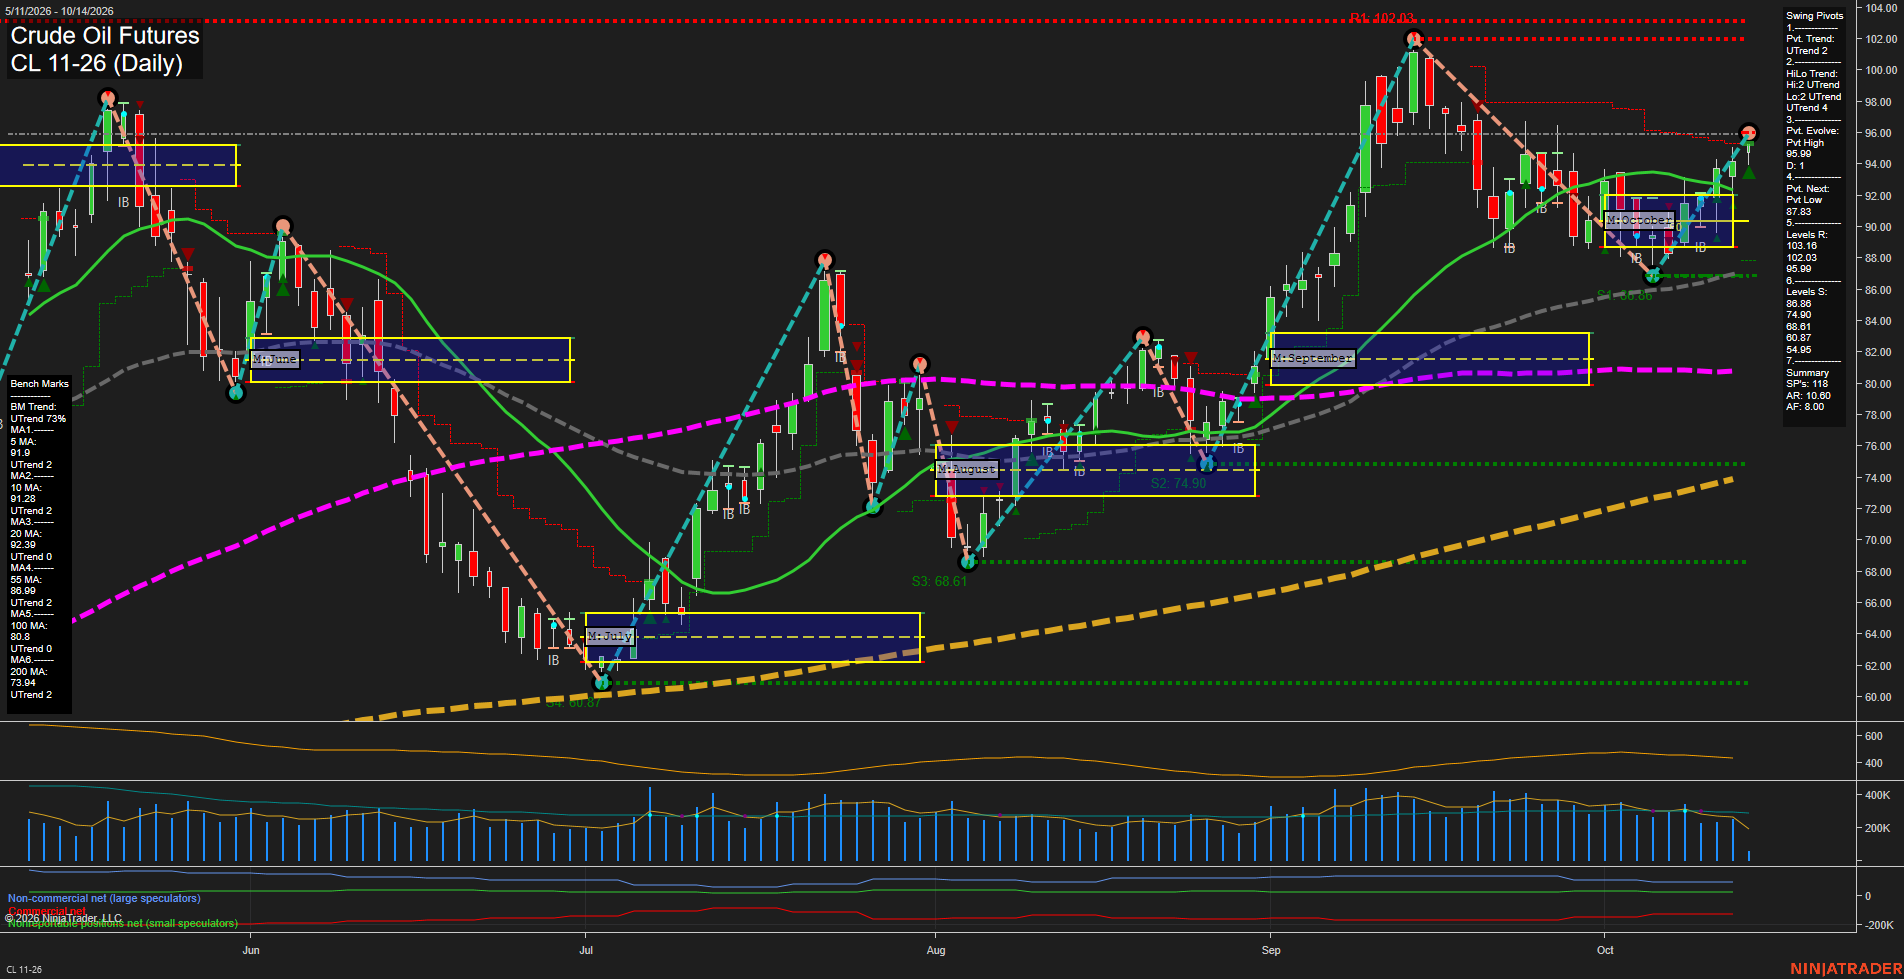
CL Daily View
Overall Rating
- Short-Term: Bullish
- Intermediate-Term: Bullish
- Long-Term: Bullish.
Key Insights Summary
Price is in a broad bullish swing structure, with the latest recovery extending from the 87.83 pivot low to a new evolving pivot high at 95.99. Price is above all six rising daily benchmarks and above both weekly and monthly F0%/NTZ reference areas. The near-term structure shows higher lows and renewed upside momentum after the early-October pullback, while 95.99 is the immediate pivot resistance and 102.03 is the larger overhead swing-resistance level. The 86.86 to 87.83 area remains the defining lower swing reference beneath the current advance.
View charts on: AlphaWebTrader HTF Charts
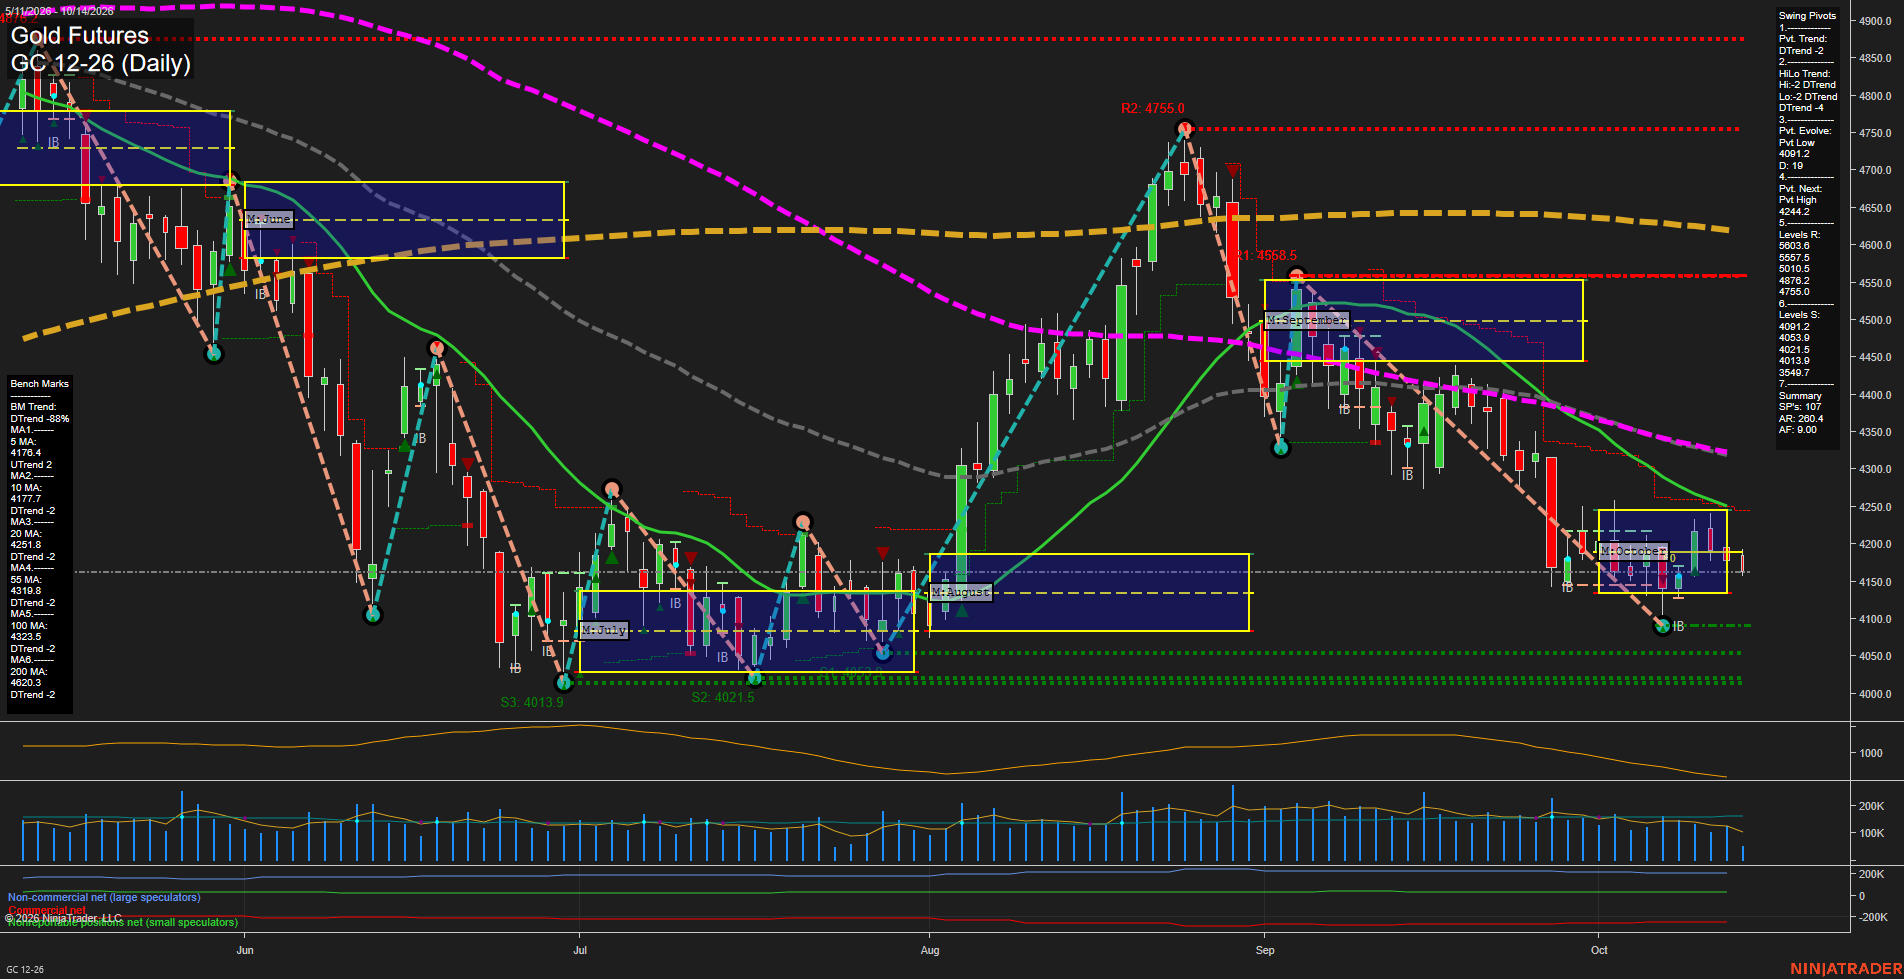
GC Daily View
Overall Rating
- Short-Term: Bearish
- Intermediate-Term: Bearish
- Long-Term: Bearish.
Key Insights Summary
Gold remains in a broad daily-chart decline following the rejection from the 4755 pivot high. Price is below the weekly, monthly, and yearly Fib-grid reference zones and below every intermediate- and long-term benchmark, while both pivot trend measures remain in DTrend. Recent candles show a narrow, choppy consolidation around the October grid near 4150-4200 after the sharp late-September selloff. The 4091.2 pivot low is the nearest structural support, while 4244.2 is the next pivot-reversal threshold and the 4251.8 20-day average closely reinforces that overhead area. The short-term 5-day average has turned higher near price, indicating a modest countertrend stabilization, but the 10-day and all broader averages remain declining. Volume has moderated from the September expansion, consistent with consolidation rather than a confirmed upside trend transition.
View charts on: AlphaWebTrader HTF Charts
ZB Daily View
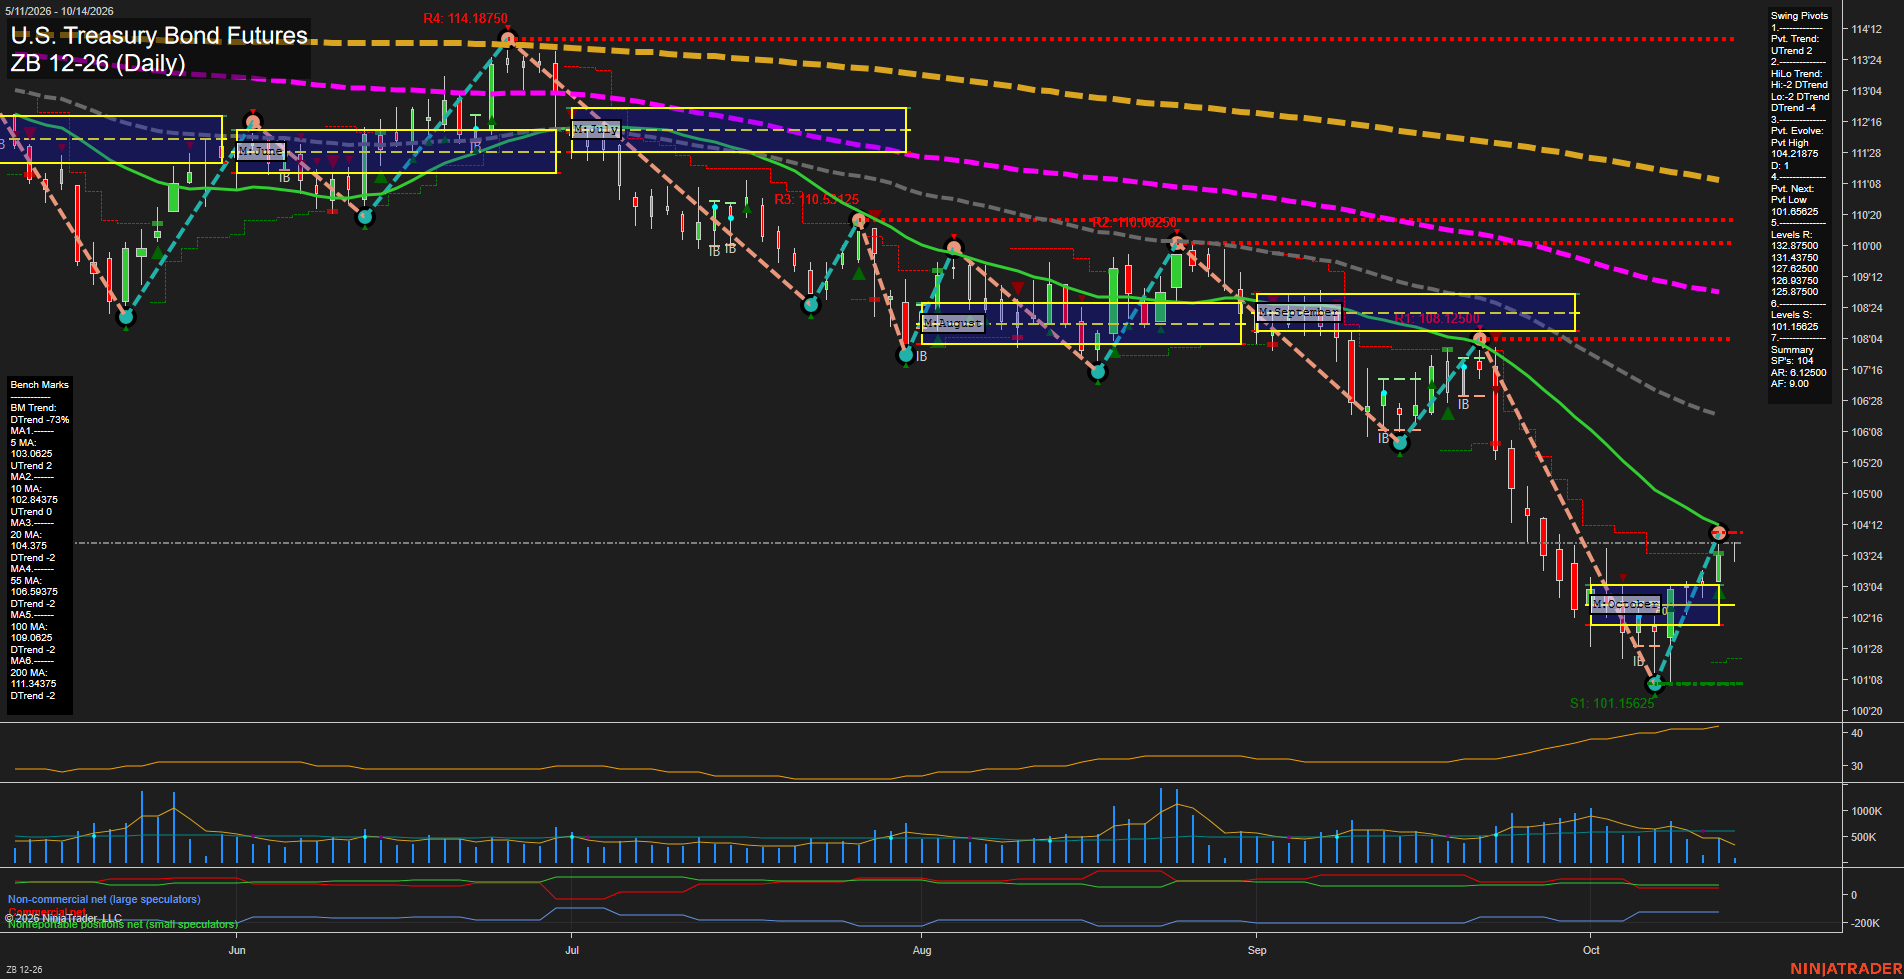
Overall Rating
- Short-Term: Bullish
- Intermediate-Term: Bearish
- Long-Term: Bearish.
Key Insights Summary
Price is staging a sharp short-term V recovery from the early-October 101.15625 swing-low area, supported by an UTrend pivot structure, rising weekly and monthly fib-grid alignment, and closes above the 5-day and 10-day benchmarks. The rebound has reached the 104.37500 pivot-high and 20-day moving-average area, where the latest small bars indicate consolidation after fast upside momentum. The broader structure remains a countertrend rally within an intermediate and long-term decline: the HiLo trend is down and price remains below the falling 20-, 55-, 100
View charts on: AlphaWebTrader HTF Charts