U.S. stocks rose as Treasury yields eased, while hot producer inflation, Hormuz shipping risks, volatile tech shares and oil swings shaped trading.
Fundamentals: U.S. equities ended higher as declining Treasury yields helped offset stronger-than-expected producer-price inflation and pressure on rate-sensitive technology stocks. Energy shares found support amid Iranian attacks on shipping in the Strait of Hormuz, while crude reacted to supply concerns and a sizable U.S. inventory draw. Gold recovered as yields and the dollar fell.
Technicals: USO, GLD and TLT led listed ETF gains, while AAPL, TSLA and NVDA declined. Equity-index futures technical readings were broadly bearish in the short term: ES, NQ, EMD and RTY faced pressure, YM was mixed, and FDAX rebounded daily. Most longer-term structures remained constructive, although RTY and EMD showed weaker daily conditions.
After Market Close daily snapshot: market news summary and sentiment, major ETFs, Magnificent 7 analysis, Indices Futures Higher Time Frame Analysis, and E-mini S&P500, Nasdaq 100, NYMEX Crude, Gold Futures Daily Chart analysis.
As of: October 15, 2026 05:00 CT
Market News Summary:
Hot inflation data, shifting Treasury yields, volatile technology shares, and Middle East energy disruptions shaped cross-asset trading.
Primary Drivers & Risks:
- Primary Driver: Inflation, yields, and energy prices
- Primary Risk: Hormuz disruptions and rate pressure
Tone:
Mixed and volatile, with inflation concerns offset by lower yields.
Stock Market / ETFs / Indices:
U.S. stocks gained as Treasury yields retreated despite a hot wholesale-inflation reading and technology-sector volatility. Tech’s elevated S&P 500 weighting and pressure on rate-sensitive AI companies remained key equity cross-currents, while energy-sector equities benefited from supply-disruption concerns.
Geopolitical:
Iranian attacks on shipping in the Strait of Hormuz intensified concerns around oil exports and fuel costs. Earlier easing of Middle East supply-disruption fears weighed on crude, underscoring rapidly changing conflict headlines.
Oil / Energy:
Crude markets faced conflicting inputs: EIA data showed U.S. commercial crude inventories fell 8.6 million barrels, while reduced Middle East supply concerns initially pushed oil lower. Rising fuel costs drove wholesale inflation, and Strait of Hormuz disruptions supported energy-sector strength.
Gold / Metals:
Gold sold off sharply after the inflation report before recovering above $4,100 as Treasury yields and the dollar declined and safe-haven demand returned. Silver also advanced, while Chinese central-bank buying, ETF inflows, and holiday demand supported the broader gold backdrop.
Fed / Financials:
Producer-price inflation exceeded expectations, led by fuel costs, reinforcing the reported inflation uptrend. A strategist saw no Fed rate increase at the next meeting, while a Fed official warned that deteriorating inflation expectations could require a response; rising margin-loan balances added leverage concerns.
Macro / Other:
Persistent affordability pressures reflected tariffs, energy costs, and AI-related demand despite cooling from pandemic-era inflation highs. The coming calendar features flash U.S. manufacturing and services PMI data alongside an intensifying earnings season.
Conclusion:
Inflation readings, Treasury-yield movements, and oil-market developments were the main index-futures drivers. Equity gains occurred alongside technology volatility and a rotation-sensitive market backdrop.
Middle East shipping risks and falling crude inventories supported energy concerns, while reduced immediate supply fears tempered oil at times. Higher borrowing costs pressured parts of the AI trade, while lower yields supported stocks and precious metals later in the session.
Market News Sentiment
Market News Articles: 48
- Neutral: 37.50%
- Negative: 37.50%
- Positive: 25.00%
Sentiment Summary: Market news tone is balanced between neutral and negative coverage at 38% each, while positive coverage accounts for 25%.
Conclusion: Indices futures news flow reflects cautious sentiment, with negative articles outweighing positive articles.
GLD,Gold Articles: 12
- Positive: 50.00%
- Negative: 33.33%
- Neutral: 16.67%
Sentiment Summary: GLD/Gold coverage is moderately positive, with 50% positive, 33% negative, and 17% neutral articles across 12 items.
Conclusion: Gold-related sentiment is positive overall but includes a meaningful share of negative coverage, indicating mixed market messaging relevant to index futures risk tone.
USO,Oil Articles: 16
- Negative: 56.25%
- Positive: 31.25%
- Neutral: 12.50%
Sentiment Summary: USO and oil coverage is predominantly negative, with 56% negative, 31% positive, and 13% neutral articles across 16 articles.
Conclusion: The oil news tone is negative overall, which may be relevant context for indices futures traders monitoring energy-sector sentiment.
Market Data Snapshot
ETF Snapshot of major stock market ETFs, Mag7, and others as of: October 15, 2026 05:00
Top Movers & Losers
- USO 157.31 Bullish 2.44% ▲
- GLD 382.71 Bullish 1.79% ▲
- TLT 79.97 Bullish 1.37% ▲
- AAPL 342.00 Bearish -0.28% ▼
- TSLA 362.44 Bearish -1.29% ▼
- NVDA 217.23 Bearish -1.84% ▼
Major Index ETFs: SPY, QQQ, DIA, IWM, IJH
- IWM 275.08 Bullish 1.37% ▲
- DIA 521.18 Bullish 1.08% ▲
- IJH 73.03 Bullish 1.05% ▲
- SPY 771.79 Bullish 0.28% ▲
- QQQ 728.00 Bearish -0.13% ▼
Mixed major-index ETF action: IWM was the most bullish mover at +1.37%, followed by DIA at +1.08% and IJH at +1.05%. SPY remained bullish at +0.28%, while QQQ was the most bearish mover, marginally lower at -0.13%.
Mag 7 Stocks: AAPL, MSFT, GOOG, AMZN, META, NVDA, TSLA
- MSFT 539.44 Bullish 1.08% ▲
- GOOG 344.91 Bullish 0.37% ▲
- AMZN 254.76 Bullish 0.27% ▲
- META 736.72 Bearish -0.11% ▼
- AAPL 342.00 Bearish -0.28% ▼
- TSLA 362.44 Bearish -1.29% ▼
- NVDA 217.23 Bearish -1.84% ▼
Mixed: MSFT leads the Bullish movers at +1.08%, followed by GOOG at +0.37% and AMZN at +0.27%. NVDA is the most bearish mover at -1.84%, with TSLA also Bearish at -1.29%. META is marginally Bearish at -0.11%, while AAPL is Bearish at -0.28%.
Cross-Market ETFs: TLT, GLD, USO, IBIT
- USO 157.31 Bullish 2.44% ▲
- GLD 382.71 Bullish 1.79% ▲
- TLT 79.97 Bullish 1.37% ▲
- IBIT 46.59 Bullish 0.76% ▲
Other ETFs were Bullish across the group: USO led as the most bullish mover at +2.44%, followed by GLD at +1.79% and TLT at +1.37%; IBIT was the least positive mover at +0.76%.
ETF, Mag7, and Cross-Market ETF Insights
Overall Tone
Mixed, with broad strength in cross-market ETFs and smaller equity ETFs offset by Bearish pressure in several Mag7 names.
Equity ETFs and Mag7:
Major Index ETFs were Mixed: IWM led at +1.37%, followed by DIA at +1.08% and IJH at +1.05%, while SPY was marginally Bullish at +0.28% and QQQ was marginally Bearish at -0.13%. Mag7 performance was selective, led by MSFT at +1.08%, while NVDA was the most Bearish mover at -1.84%, with TSLA also Bearish at -1.29%; AAPL and META were near-flat Bearish.
Cross-Market ETFs:
Cross-Market ETFs were broadly Bullish, led by USO at +2.44%, the most bullish mover in the group, followed by GLD at +1.79% and TLT at +1.37%. IBIT was also Bullish at +0.76% and was the least positive mover, while commodity, gold, and Treasury strength diverged from the Mixed equity backdrop.
Futures Indices – Higher Time Frame Analysis
Summary of the current state of US Indices Futures based on higher time-frame (HTF) technical analysis as of: 2026-10-15: 17:00 CT.
US Indices Futures
- ES: YSFG up; MSFG/WSFG below centers; benchmarks mixed; pivots 7729.50/7906.25; support 7672.75, resistance 7875.00-7906.25.
- NQ: YSFG up; MSFG/WSFG down; benchmarks below 5-100 day; pivots 29748.50/31616.50; support 29053.00, resistance 30686.50.
- YM: YSFG/MSFG up, WSFG down; benchmarks mixed; pivots 50859/53219; support 50568, resistance 52612-55316.
- EMD: YSFG up; MSFG neutral, WSFG down; benchmarks below daily averages; pivots 3600.3/3696.1; support 3600.3, resistance 3737.8.
- RTY: YSFG up; MSFG/WSFG down; benchmarks below daily averages; pivots 2734.9/2816.9; support 2734.9, resistance 2797.8-3101.8.
- FDAX: YSFG/MSFG up, WSFG down; benchmarks mixed; pivots 24925/25589; support 24897-24925, resistance 25589-25990.
Overall State
- Short-Term: Bearish
- Intermediate-Term: Bearish
- Long-Term: Bullish
Conclusion
US index futures show broad short-term retracement conditions, led by bearish WSFG/MSFG alignment and declining short-term benchmarks in ES, NQ, EMD, and RTY. YM is consolidating, while FDAX has a daily rebound within a corrective intermediate structure. YSFG and longer benchmarks retain bullish alignment in most contracts; EMD and RTY daily structures lag. Current pivot supports are central references, with prior swing highs and benchmark clusters defining overhead resistance.
Note: Intra-day counter-trend pullbacks or retracements may occur, HTF is context for informational usage and market structure. Glossary: Session Fib Grids periods of YSFG:’Yearly’, MSFG:’Monthly’, WSFG:’Weekly’
For full details visit: AlphaWebTrader Technicals
ES Daily View
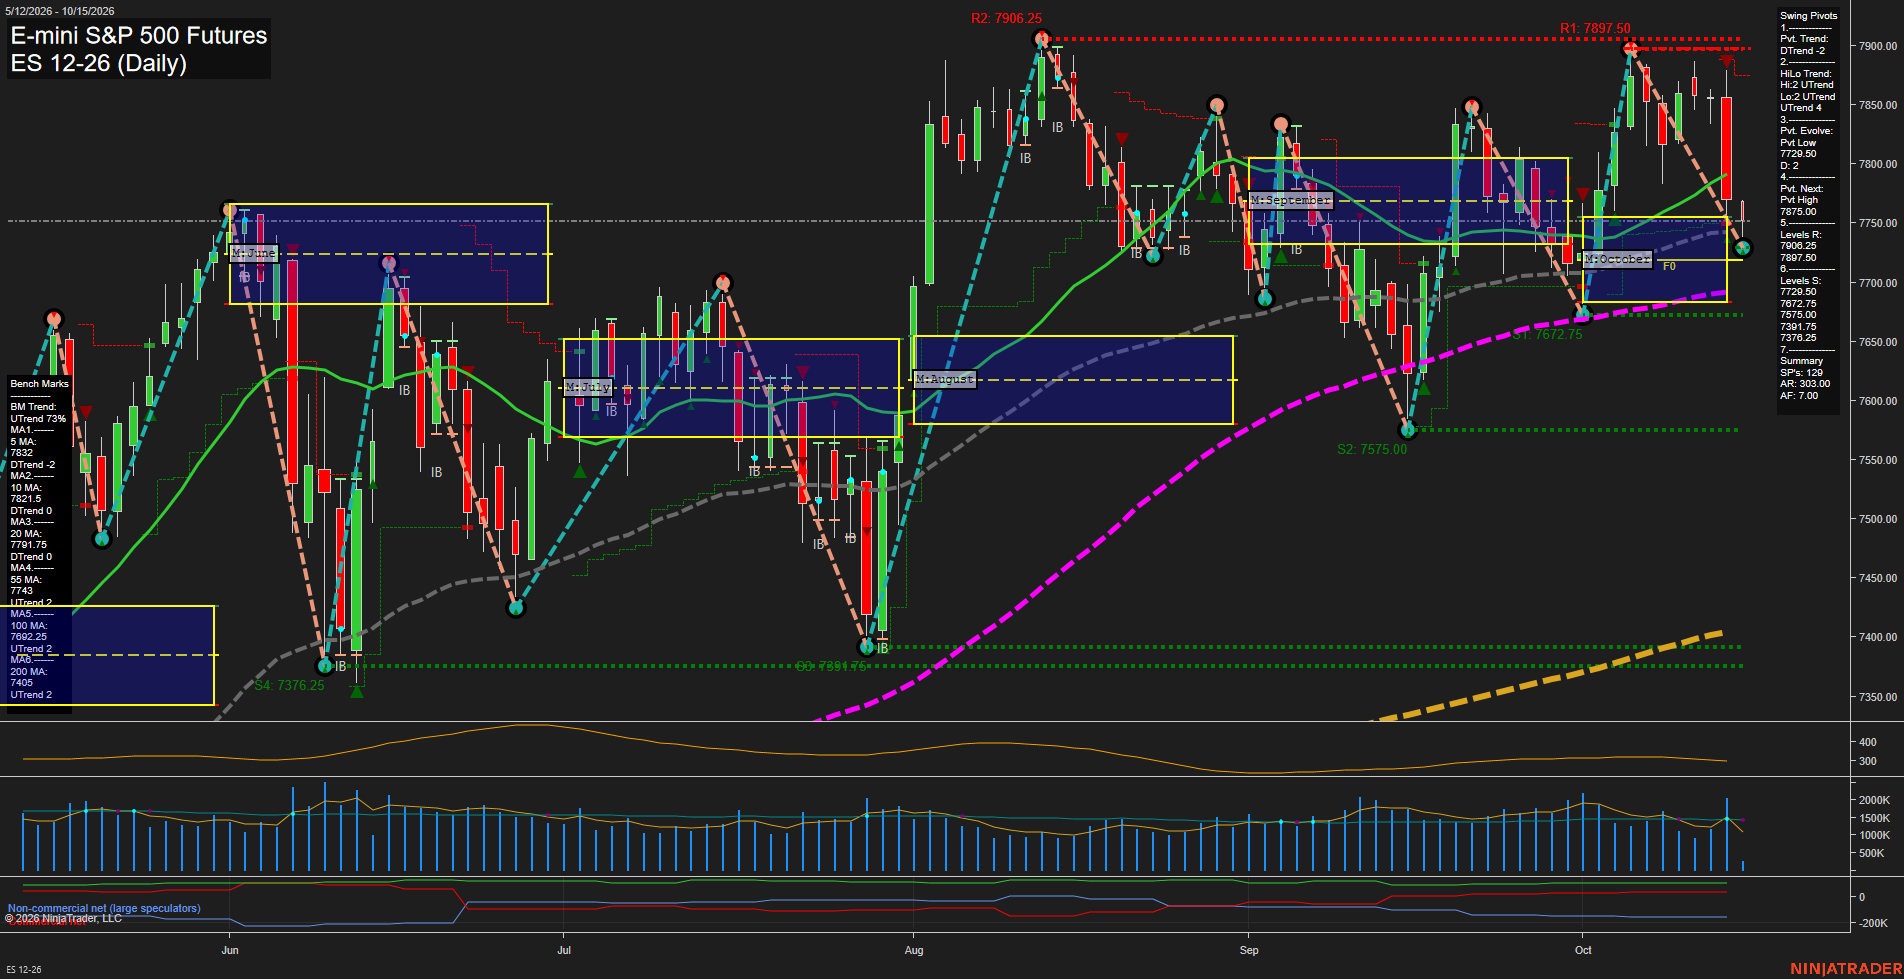
Overall Rating
- Short-Term: Bearish
- Intermediate-Term: Neutral
- Long-Term: Bullish.
Key Insights Summary
The daily structure shows a sharp short-term selloff from the early-October high near 7897.50, with a large bearish bar pressing price into the 7729.50 pivot-low support zone. Price is below the weekly and monthly Fib-grid centers and below the declining 5-, 10-, and 20-day benchmarks, confirming fast downside momentum and a short-term DTrend. Intermediate conditions are mixed: the HiLo trend remains up and the 55-day average is rising, but the monthly grid is down and price has slipped beneath the 55-day benchmark. The longer-term structure remains constructive above rising 100- and 200-day averages and the positive yearly grid. Resistance is concentrated at 7875.00, 7897.50, and 7906.25, while a break beneath 7729.50 exposes the lower support sequence at 7672.75 and 7575.00.
View charts on: AlphaWebTrader HTF Charts
NQ Daily View
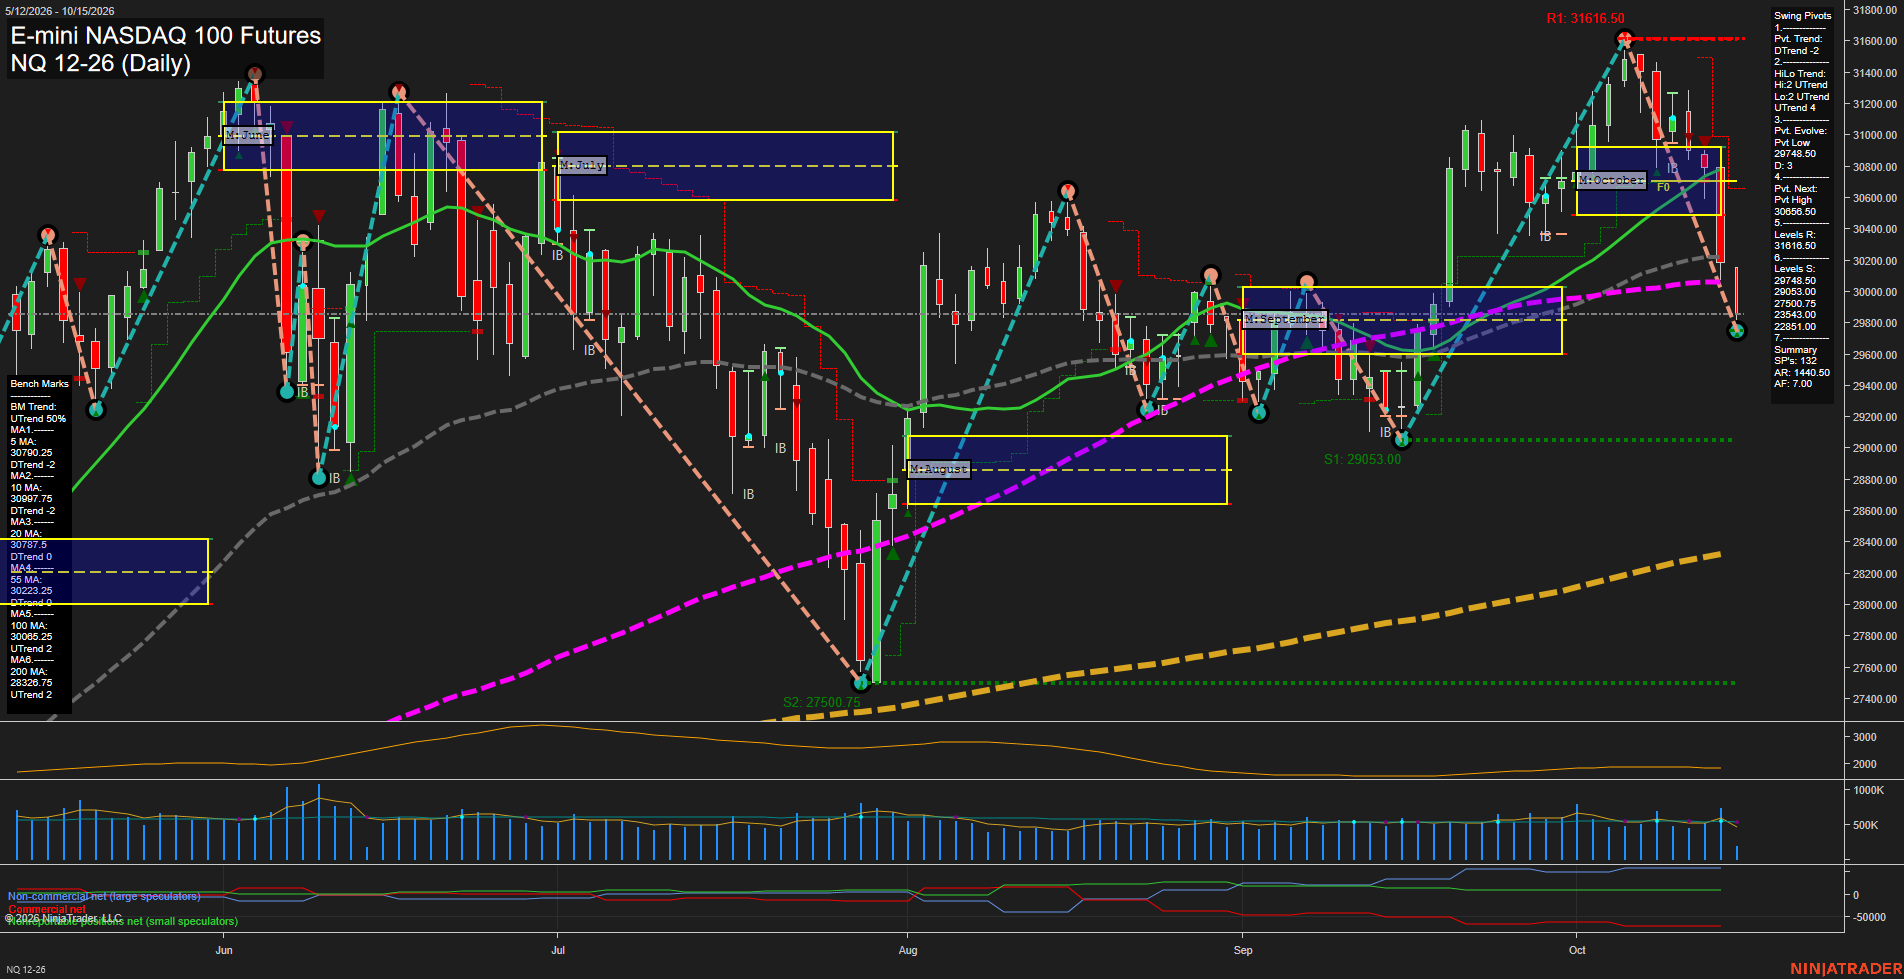
Overall Rating
- Short-Term: Bearish
- Intermediate-Term: Bearish
- Long-Term: Bullish.
Key Insights Summary
The daily structure shows a fast downside reversal from the 31616.50 swing-high resistance area, with price now below the weekly and monthly Fib-grid centers and beneath the 5-, 10-, 20-, 55-, and 100-day benchmarks. The active short-term pivot trend is down, while the broader HiLo pivot trend remains up, defining the current move as a sharp countertrend retracement within a still-positive yearly structure. Price is testing the 29748.50 pivot-low area near the 100-day average; 29053.00 is the next major swing-support reference. The 30686.50 pivot-next level and the clustered 20-, 55-, and 100-day averages form an important overhead rebound and rejection zone. Elevated ATR and fast momentum reflect a volatile liquidation phase rather than a quiet consolidation.
View charts on: AlphaWebTrader HTF Charts
CL Daily View
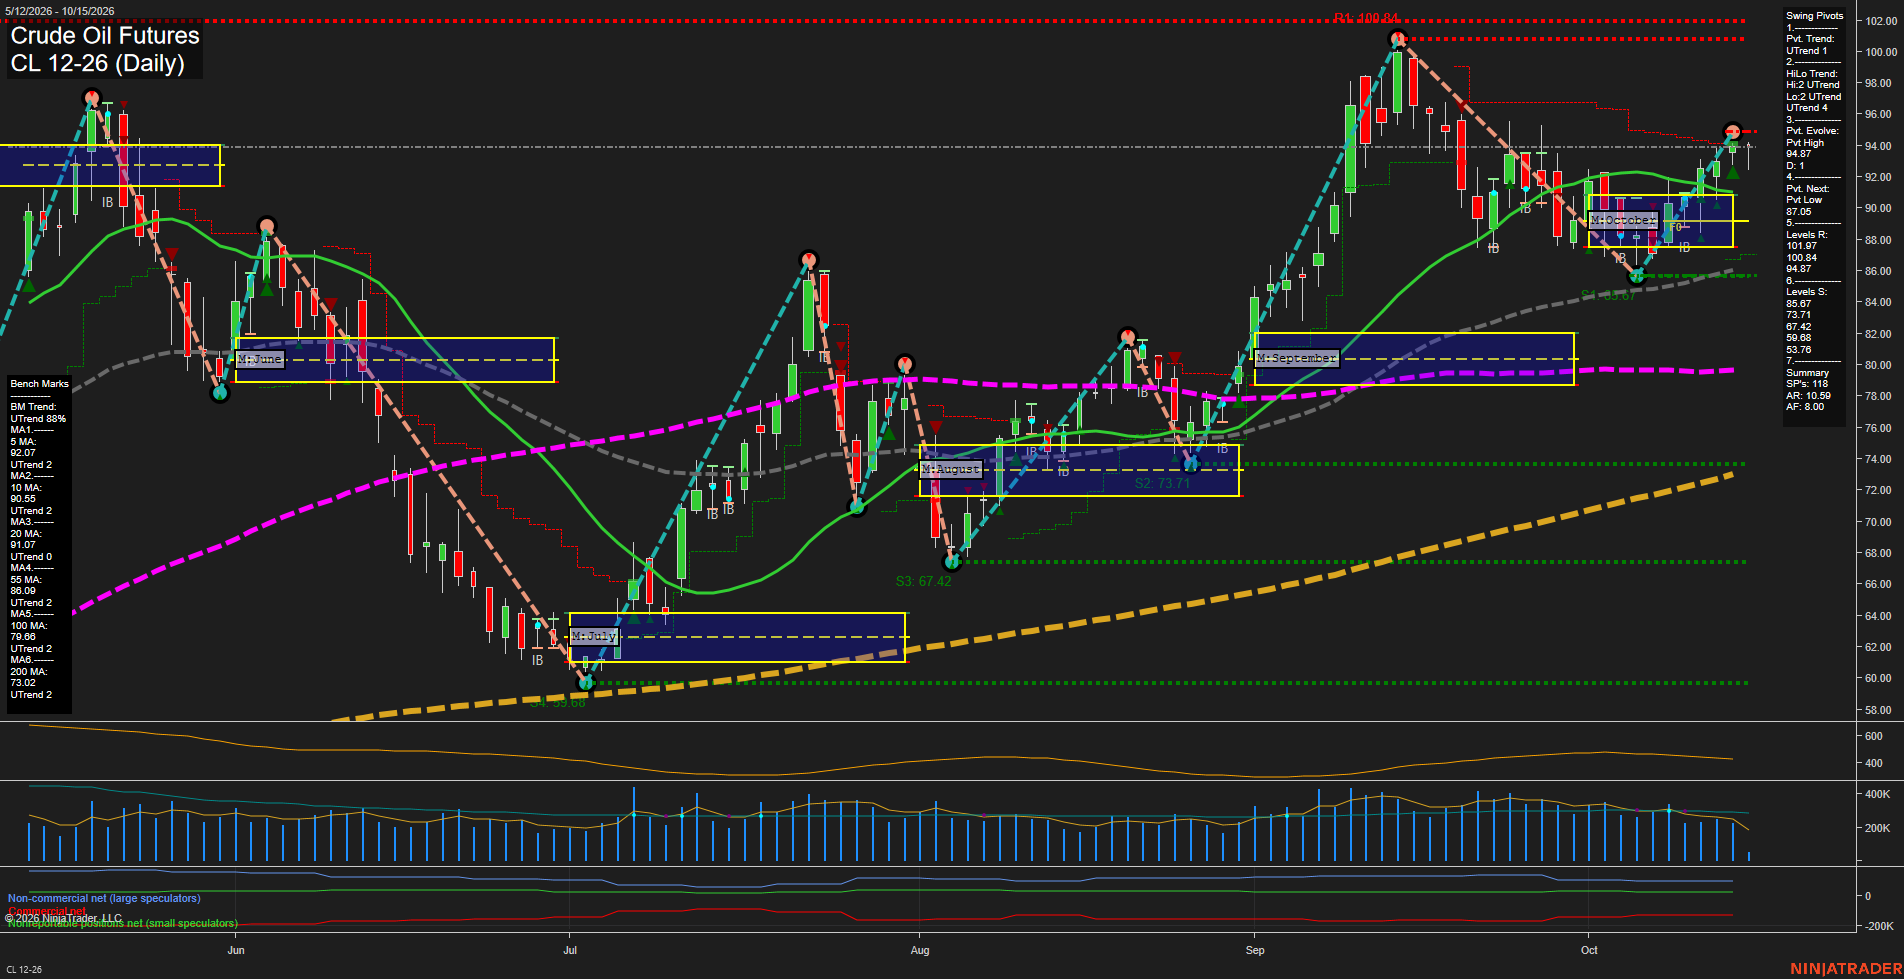
Overall Rating
- Short-Term: Bullish
- Intermediate-Term: Bullish
- Long-Term: Bullish.
Key Insights Summary
Price has resumed its advance from the early-October 85.67 pivot low and is trading above every daily benchmark, with the 5, 10, 20, 55, 100, and 200-day averages all aligned in uptrends. The short-term pivot structure is in an UTrend and the intermediate HiLo structure remains constructive, while price is above both the weekly and monthly F0%/NTZ areas. The recovery has accelerated into the 94.87 evolving pivot-high area, making the nearby 94.87 level immediate price reference resistance before the larger 100.84 and 101.97 swing-high zones. The recent sequence reflects higher lows following the late-September pullback, while 87.05 remains the next pivot-reversal reference and 85.67 is the major nearby swing support. Volume activity has moderated after the September rally surge, indicating a more measured continuation phase rather than the earlier high-volume breakout impulse.
View charts on: AlphaWebTrader HTF Charts
GC Daily View
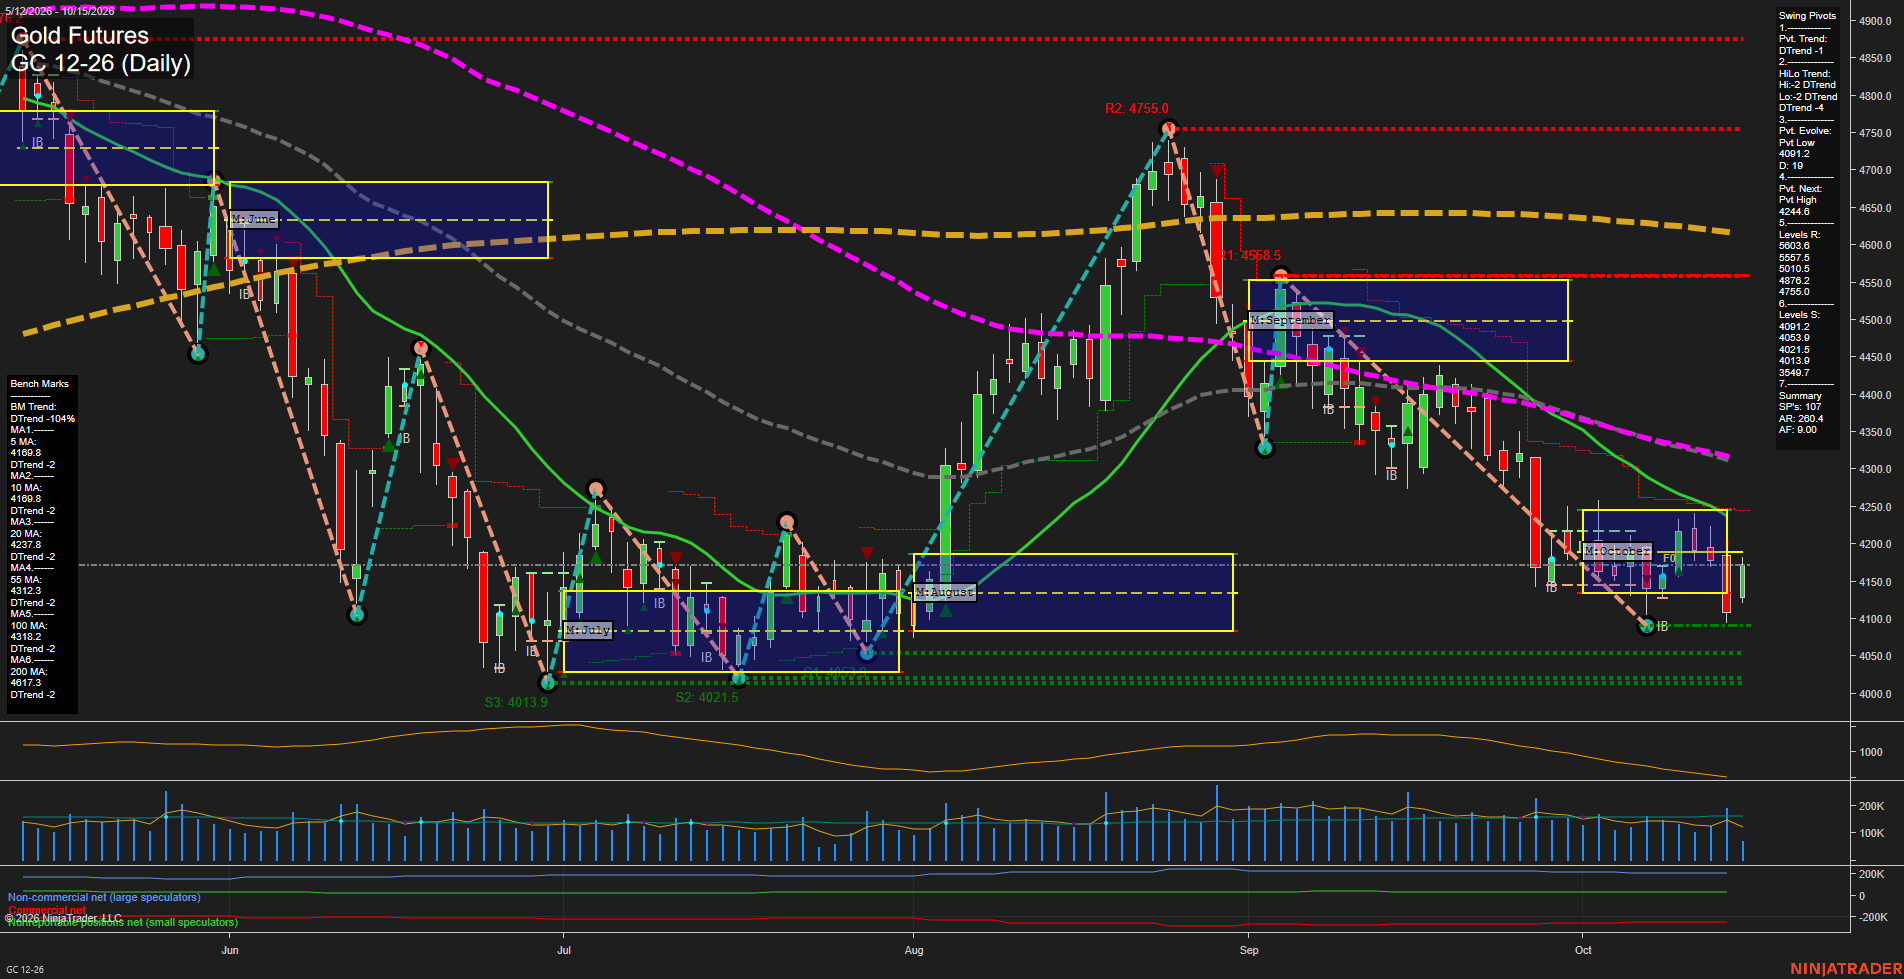
Overall Rating
- Short-Term: Bearish
- Intermediate-Term: Bearish
- Long-Term: Bearish.
Key Insights Summary
Gold remains in a broad daily-chart decline, with price below the monthly and yearly Fib-grid bias levels and all benchmark averages retaining down trends. The rebound from the 4091.2 pivot low is a short-term countertrend bounce, but it remains beneath the 20, 55, 100, and 200-day averages. Pivot structure remains bearish, defined by lower highs and a DTrend in both short- and intermediate-term measures; 4246.8 is the next pivot-reversal reference while 4091.2, 4053.9, and 4021.5 define the nearby support cluster. Volatility remains elevated, consistent with medium-sized daily bars and choppy retracement conditions following the sharp September decline.
View charts on: AlphaWebTrader HTF Charts
ZB Daily View
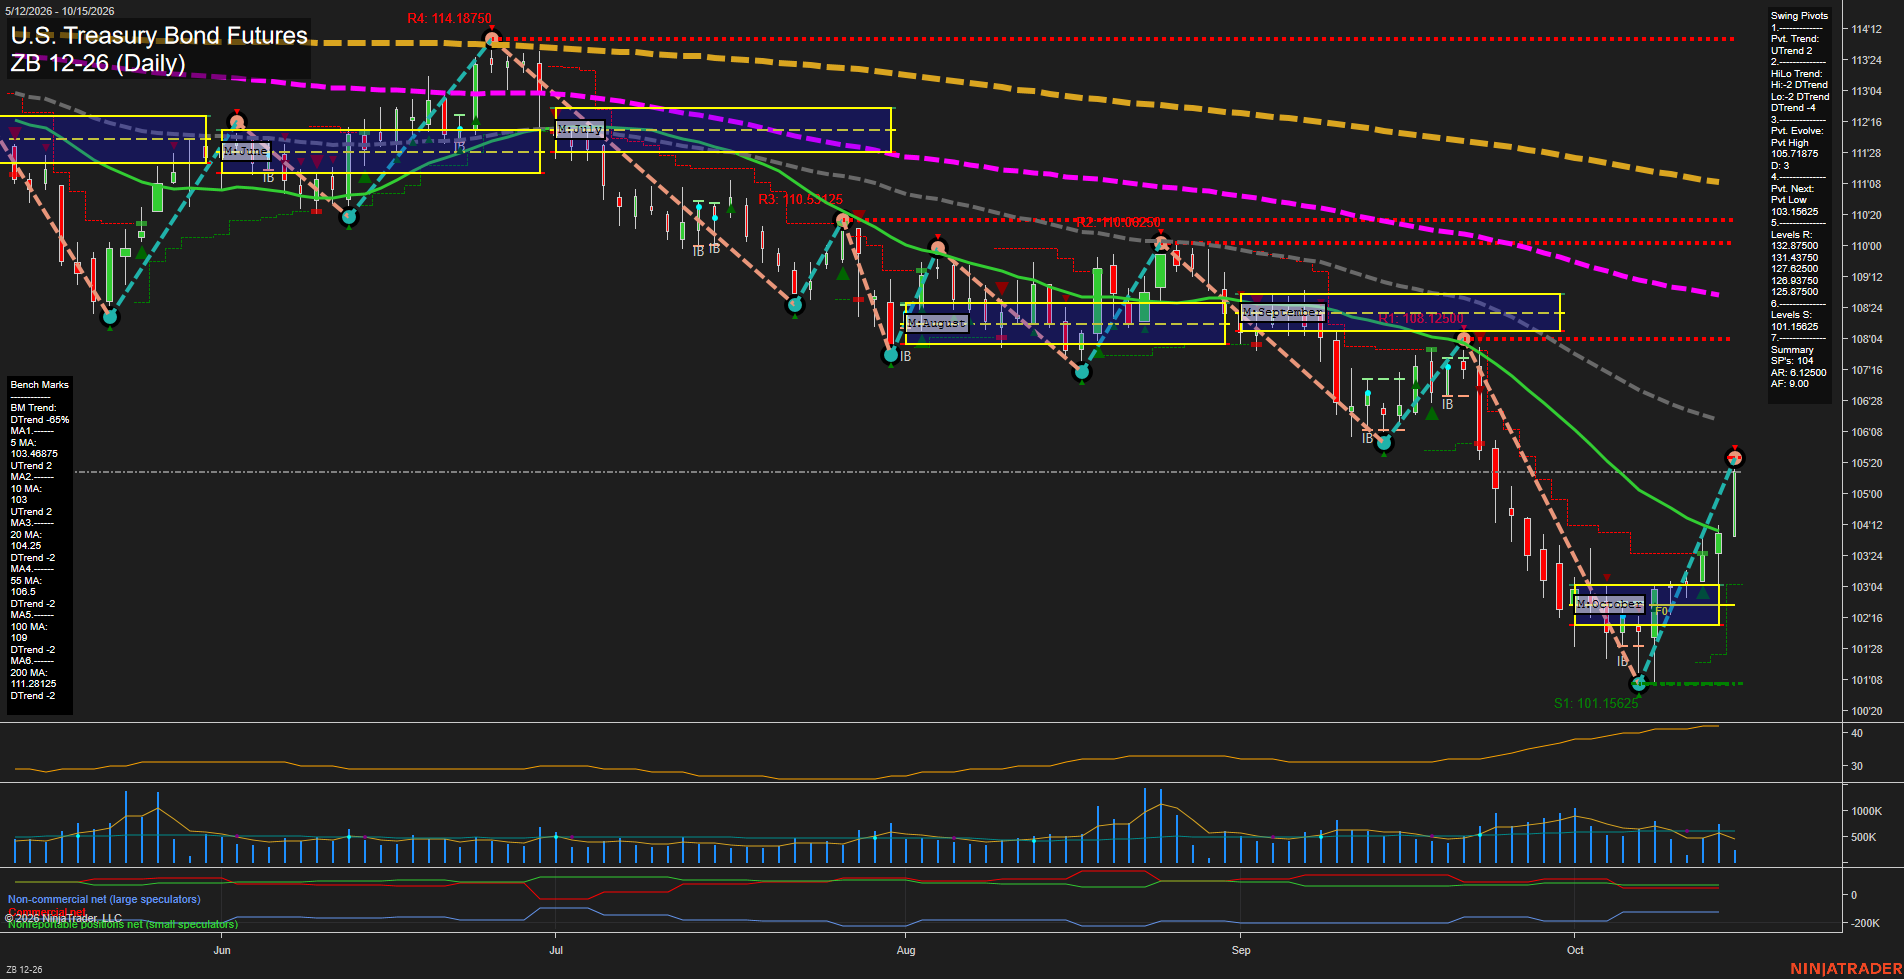
Overall Rating
- Short-Term: Bullish
- Intermediate-Term: Neutral
- Long-Term: Bearish.
Key Insights Summary
The October rebound has developed into a fast, large-range recovery from the 101.15625 swing low, lifting price above the weekly and monthly F0%/NTZ structures and restoring the short-term pivot trend to UTrend. Price is also above the rising 5-day and 10-day averages, while the 103.15625 pivot-next level defines the near-term pullback reference. Intermediate structure remains mixed: the HiLo trend is still DTrend and price remains beneath declining 20-day and 55-day benchmarks. The broader yearly grid and declining 100-day and 200-day averages retain a bearish long-term structure
View charts on: AlphaWebTrader HTF Charts