NYSE pre-market radar tracks ETF movers and mixed equity futures as inflation, Fed uncertainty, AI weakness, oil declines and yields shape sentiment.
Fundamentals: U.S. equity futures turned mixed following a volatile rebound, as inflation data and shifting Federal Reserve rate expectations remained central to market sentiment. Renewed pressure on AI-linked technology shares weighed on the Nasdaq, while Tesla strength, lower oil prices and a Wall Street-led Asian recovery offered selective support. Trade negotiations, chip-export restrictions, elevated yields and Hormuz shipping risks remained key cross-currents.
Technicals: USO, GLD and TLT led prior-session ETF gains, while AAPL, TSLA and NVDA declined. Futures analysis shows broadly positive long-term structures across major contracts, though short-term conditions remain mixed. ES and YM retain constructive higher-timeframe trends, while NQ, EMD and RTY reflect active pullbacks and elevated volatility. FDAX has rebounded toward key resistance.
Pre-Market Trading 360° view Market Radar of: holidays, earnings, eco-news, market-news summary, news sentiment, prior session major ETFs, MAG7, Higher Time Frame Analysis Indices Futures Summary, and E-mini S&P500, Nasdaq 100, NYMEX Crude, Gold Futures Daily Chart analysis.
As of: October 16, 2026 07:16 CT
Earnings Radar
Monitoring for earnings releases by the Magnificent 7, AI-tech-related firms, and major financial institutions.
- IBM Release: 2026-10-21 T:AMC
- META Release: 2026-10-21 T:AMC
- TSLA Release: 2026-10-21 T:AMC
Conclusion: IBM, Meta, and Tesla report after the close on 2026-10-21, concentrating broad index-relevant technology, AI, and MAG7 earnings risk into one session. Market momentum and volume can slow ahead of these major releases, while post-release index futures sensitivity centers on the reported results and guidance.
For full details visit: Yahoo Earnings Calendar
Market News Summary:
Equity futures were mixed after a volatile rebound, with inflation, Fed-rate uncertainty, and renewed pressure on AI-linked technology shares shaping risk sentiment.
Primary Drivers & Risks:
- Primary Driver: Inflation data and Fed repricing
- Primary Risk: AI weakness and trade friction
Tone:
Mixed and volatile, with selective risk recovery.
Stock Market / ETFs / Indices:
U.S. indexes recovered from early losses in the prior session, while Friday futures turned mixed as technology stocks faced renewed AI-trade concerns. Nasdaq weakness reflected profit-taking in AI shares, although Tesla strength and lower oil prices provided support. Asian equities recovered some ground following Wall Street gains, while the Nikkei rose 1.0%; Indonesian equities suffered a sharp selloff tied to a potential MSCI classification downgrade.
Geopolitical:
U.S.-Mexico tariff negotiations remained stalled over metals and autos, adding trade-policy uncertainty. Middle East supply concerns persisted around shipping through the Strait of Hormuz, while Taiwan was reported to be preparing tighter AI-chip export controls toward China.
Oil / Energy:
Oil declined as markets weighed the International Energy Agency’s planned crude and diesel reserve releases. The releases offset support from an 8.6 million-barrel U.S. crude draw and continued Hormuz-related supply and shipping risks.
Gold / Metals:
Gold initially fell ahead of Fed Chair Kevin Warsh’s remarks, then held a rebound as Treasury yields eased. Hot producer-price inflation and remaining December rate-hike risk limited the metals response; gold and silver remained focused on the Fed-rate path.
Fed / Financials:
Chicago Fed President Austan Goolsbee described stronger-than-anticipated consumer and producer inflation data as discouraging, while retaining some optimism. Warsh declined to signal the timing of a rate increase, and investors dialed back October hike bets after his remarks. Treasury yields stabilized in Asian trading, though reports highlighted elevated borrowing-cost pressure across bond markets.
Macro / Other:
Inflation remained the central macro cross-current, with PPI cited at 6.3% in metals-market coverage. Warsh described AI’s economic path as bumpy in the near term while emphasizing longer-run productivity and wealth potential. UK equities were positioned for weekly gains as investors favored defensive sectors.
Conclusion:
Inflation readings and changing Fed-rate expectations remained the main drivers for index futures. Technology and AI-related shares continued to direct broader equity volatility.
Oil-price declines and a Wall Street-led Asian rebound offered selective support. Tariff negotiations, chip-export restrictions, high yields, and Hormuz shipping risks remained active cross-currents.
Market News Sentiment
Market News Articles: 42
- Neutral: 52.38%
- Negative: 26.19%
- Positive: 21.43%
Sentiment Summary: Of 42 market news articles, 52% were neutral, 26% negative, and 21% positive, indicating primarily neutral coverage with negative articles exceeding positive ones.
Conclusion: News sentiment for indices futures is neutral overall, with a modest negative skew.
GLD,Gold Articles: 13
- Positive: 46.15%
- Negative: 38.46%
- Neutral: 15.38%
Sentiment Summary: GLD/Gold coverage is mixed, with 46% positive, 38% negative, and 15% neutral sentiment across 13 articles.
Conclusion: Gold-related news tone is modestly positive overall, though negative coverage remains substantial for indices futures day traders.
USO,Oil Articles: 11
- Negative: 45.45%
- Positive: 36.36%
- Neutral: 18.18%
Sentiment Summary: USO/Oil coverage is mixed with a negative tilt: 45% negative, 36% positive, and 18% neutral across 11 articles.
Conclusion: Oil-related news tone is modestly negative, representing a potential cross-market sentiment factor for indices futures day traders.
Market Data Snapshot
ETF Snapshot of major stock market ETFs, Mag7, and others as of: October 16, 2026 07:16
Top Movers & Losers
- USO 157.31 Bullish 2.44% ▲
- GLD 382.71 Bullish 1.79% ▲
- TLT 79.97 Bullish 1.37% ▲
- AAPL 342.00 Bearish -0.28% ▼
- TSLA 362.44 Bearish -1.29% ▼
- NVDA 217.23 Bearish -1.84% ▼
Major Index ETFs: SPY, QQQ, DIA, IWM, IJH
- IWM 275.08 Bullish 1.37% ▲
- DIA 521.18 Bullish 1.08% ▲
- IJH 73.03 Bullish 1.05% ▲
- SPY 771.79 Bullish 0.28% ▲
- QQQ 728.00 Bearish -0.13% ▼
Mixed index ETF context: IWM is the most bullish mover at +1.37%, followed by DIA at +1.08% and IJH at +1.05%. SPY is modestly Bullish at +0.28%, while QQQ is the most bearish mover, marginally Bearish at -0.13%.
Mag 7 Stocks: AAPL, MSFT, GOOG, AMZN, META, NVDA, TSLA
- MSFT 539.44 Bullish 1.08% ▲
- GOOG 344.91 Bullish 0.37% ▲
- AMZN 254.76 Bullish 0.27% ▲
- META 736.72 Bearish -0.11% ▼
- AAPL 342.00 Bearish -0.28% ▼
- TSLA 362.44 Bearish -1.29% ▼
- NVDA 217.23 Bearish -1.84% ▼
Mixed Mag7 snapshot: MSFT is the most bullish mover at +1.08%, followed by GOOG at +0.37% and AMZN at +0.27%. META is marginally Bearish at -0.11%, while AAPL is Bearish at -0.28%. TSLA is Bearish at -1.29%, and NVDA is the most bearish mover at -1.84%.
Cross-Market ETFs: TLT, GLD, USO, IBIT
- USO 157.31 Bullish 2.44% ▲
- GLD 382.71 Bullish 1.79% ▲
- TLT 79.97 Bullish 1.37% ▲
- IBIT 46.59 Bullish 0.76% ▲
Other ETFs are Bullish across the snapshot: USO is the most bullish mover at +2.44%, followed by GLD at +1.79% and TLT at +1.37%. IBIT is the least positive mover at +0.76%.
ETF, Mag7, and Cross-Market ETF Insights
Overall Tone
Mixed, with broad strength in several equity and cross-market ETFs alongside Bearish pressure in key technology leaders.
Equity ETFs and Mag7:
Major Index ETFs were Mixed: IWM led at +1.37%, followed by DIA at +1.08% and IJH at +1.05%, while SPY was marginally Bullish at +0.28% and QQQ was marginally Bearish at -0.13%. Mag7 action was selective, with MSFT leading higher at +1.08%, GOOG at +0.37%, and AMZN at +0.27%, while META was near-flat at -0.11%, AAPL declined -0.28%, TSLA fell -1.29%, and NVDA was the most bearish equity mover at -1.84%. The most bullish equity mover was IWM at +1.37%, showing broader strength outside the largest technology names.
Cross-Market ETFs:
Cross-Market ETFs were Bullish across the group, led by USO as the most bullish mover at +2.44%, with GLD higher +1.79% and TLT higher +1.37%. IBIT gained +0.76% and was the least positive mover, while simultaneous gains in energy, gold, and bonds diverged from the Mixed equity and Mag7 picture.
Futures Indices – Higher Time Frame Analysis
Summary of the current state of US Indices Futures based on higher time-frame (HTF) technical analysis as of: 2026-10-16: 07:16 CT.
US Indices Futures
- ES: YSFG/MSFG bullish, WSFG below F0%; benchmarks broadly rising, pivots 7906.25 resistance and 7583.75 reversal support.
- NQ: YSFG bullish, MSFG/WSFG below F0%; mixed benchmarks, 31616.50 pivot resistance, 29424.00 downside pivot reference.
- YM: YSFG/MSFG/WSFG above F0%; benchmarks rising, recovery structure upward, 52868 resistance, 51513 reversal reference, 50859 pivotal support.
- EMD: YSFG/MSFG above F0%, WSFG below F0%; short benchmarks declining, 3696.6 resistance, 3600.3 support, 3332.6 lower support.
- RTY: YSFG above F0%, MSFG/WSFG below F0%; benchmarks weakened short-term, 2871.1-2899.1 reversal zone, 2734.9 support.
- FDAX: YSFG/MSFG/WSFG above F0%; long benchmarks rising, recovery above short benchmarks, 25817-25990 resistance, 24847 support.
Overall State
- Short-Term: Bearish
- Intermediate-Term: Neutral
- Long-Term: Bullish
Conclusion
US index futures show divergent short-term structure within broadly upward yearly frameworks. ES, NQ, EMD, and RTY remain below key weekly or monthly grid references, while YM and FDAX hold stronger recovery alignment. ES, YM, and FDAX retain bullish intermediate correlations; NQ, EMD, and RTY show corrective intermediate conditions. Long-term benchmark and YSFG alignment remains upward across the group, with active pivots defining nearby support, resistance, and reversal thresholds.
Note: Intra-day counter-trend pullbacks or retracements may occur, HTF is context for informational usage and market structure. Glossary: Session Fib Grids periods of YSFG:’Yearly’, MSFG:’Monthly’, WSFG:’Weekly’
For full details visit: AlphaWebTrader Technicals
ES Daily View
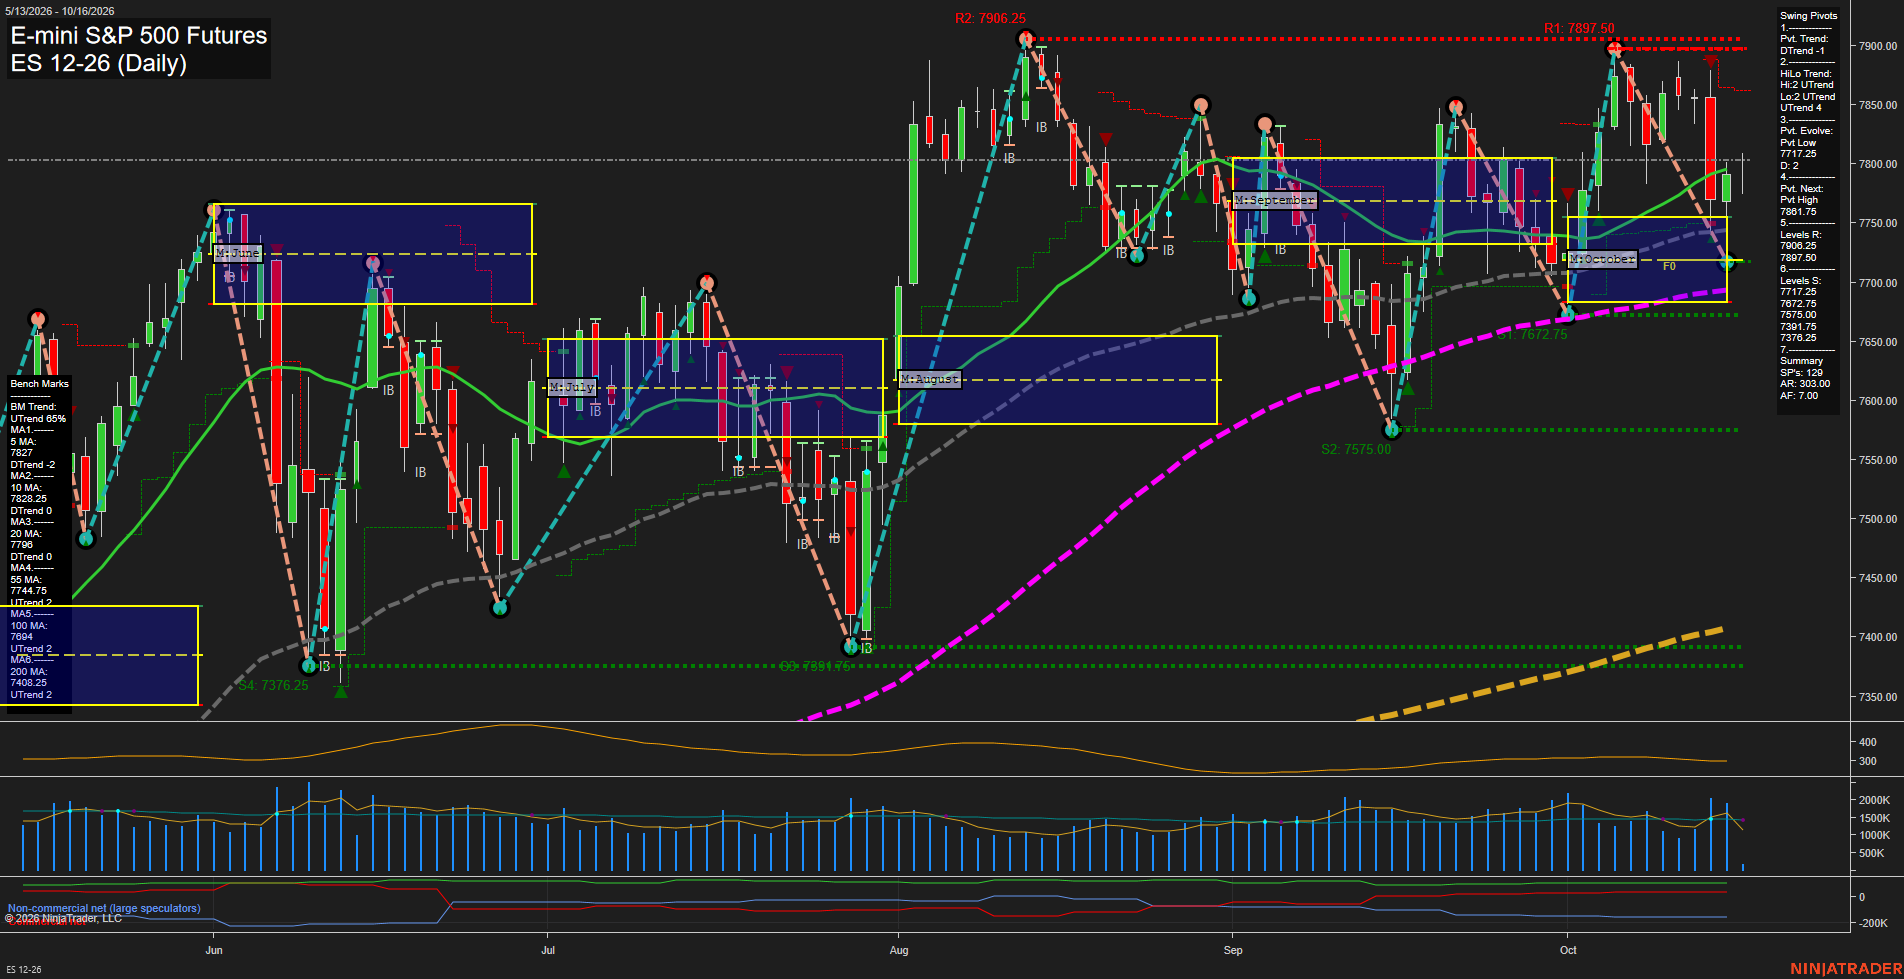
Overall Rating
- Short-Term: Bearish
- Intermediate-Term: Bullish
- Long-Term: Bullish.
Key Insights Summary
Price is consolidating beneath the 5-day and 10-day benchmarks after a rejection from the 7897.50 to 7906.25 resistance area. The short-term pivot structure remains in a DTrend and the weekly fib-grid position is below F0%, reflecting a countertrend pullback within a broader advancing structure. Intermediate and long-term conditions remain constructive: price is above the rising 20-day, 55-day, 100-day, and 200-day averages, while the monthly and yearly fib grids remain positive. The 7772.75 pivot-low area is the nearest structural support, with 7831.75 defining the next pivot-high reversal threshold.
View charts on: AlphaWebTrader HTF Charts
NQ Daily View
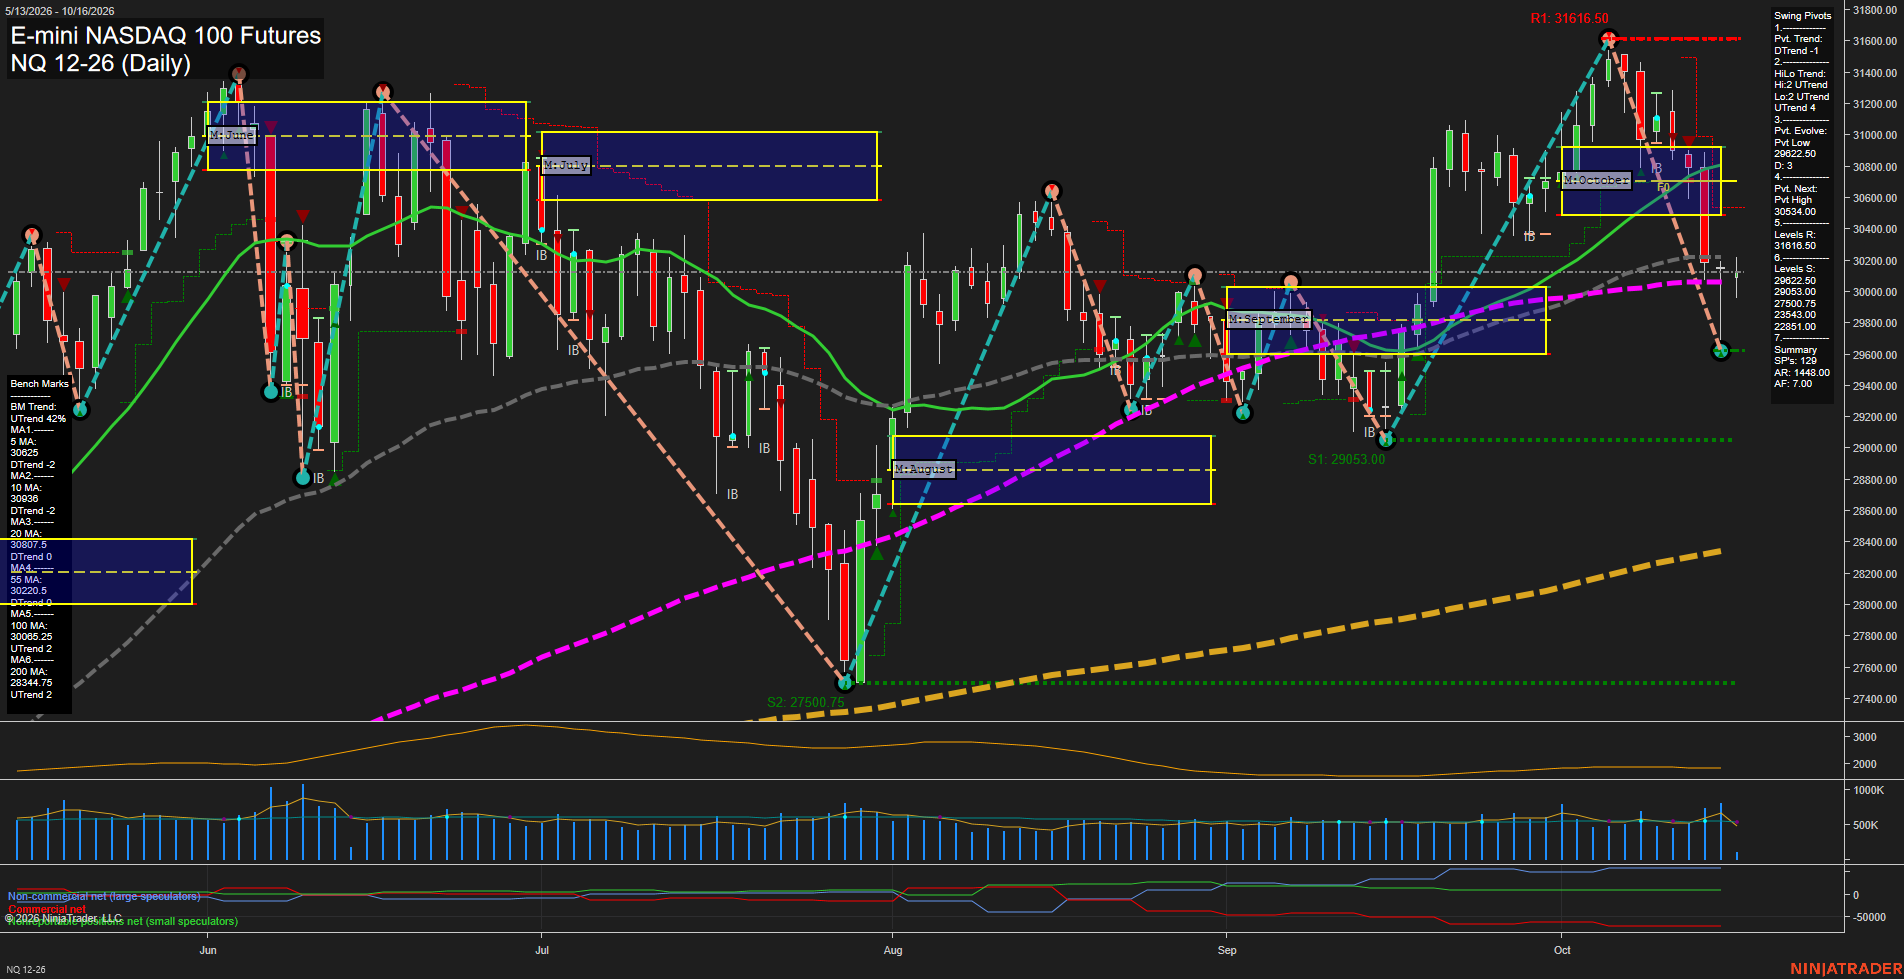
Overall Rating
- Short-Term: Bearish
- Intermediate-Term: Bearish
- Long-Term: Bullish.
Key Insights Summary
The daily structure shows a fast, high-range pullback from the 31616.50 pivot high, with price below the weekly and monthly Fibonacci grids and below the declining 5-, 10-, and 20-day benchmarks. The short-term pivot trend is down, while the larger HiLo structure remains up and price remains marginally above the rising 100-day average, defining the decline as a meaningful countertrend retracement within a still-positive long-term structure. The 30220.50 55-day average and 30534.00 next pivot-high level frame nearby overhead pressure, while 29822.50 is the first pivotal downside support. Elevated ATR and large recent bars reflect an active volatility expansion following the October rejection from the highs.
View charts on: AlphaWebTrader HTF Charts
CL Daily View
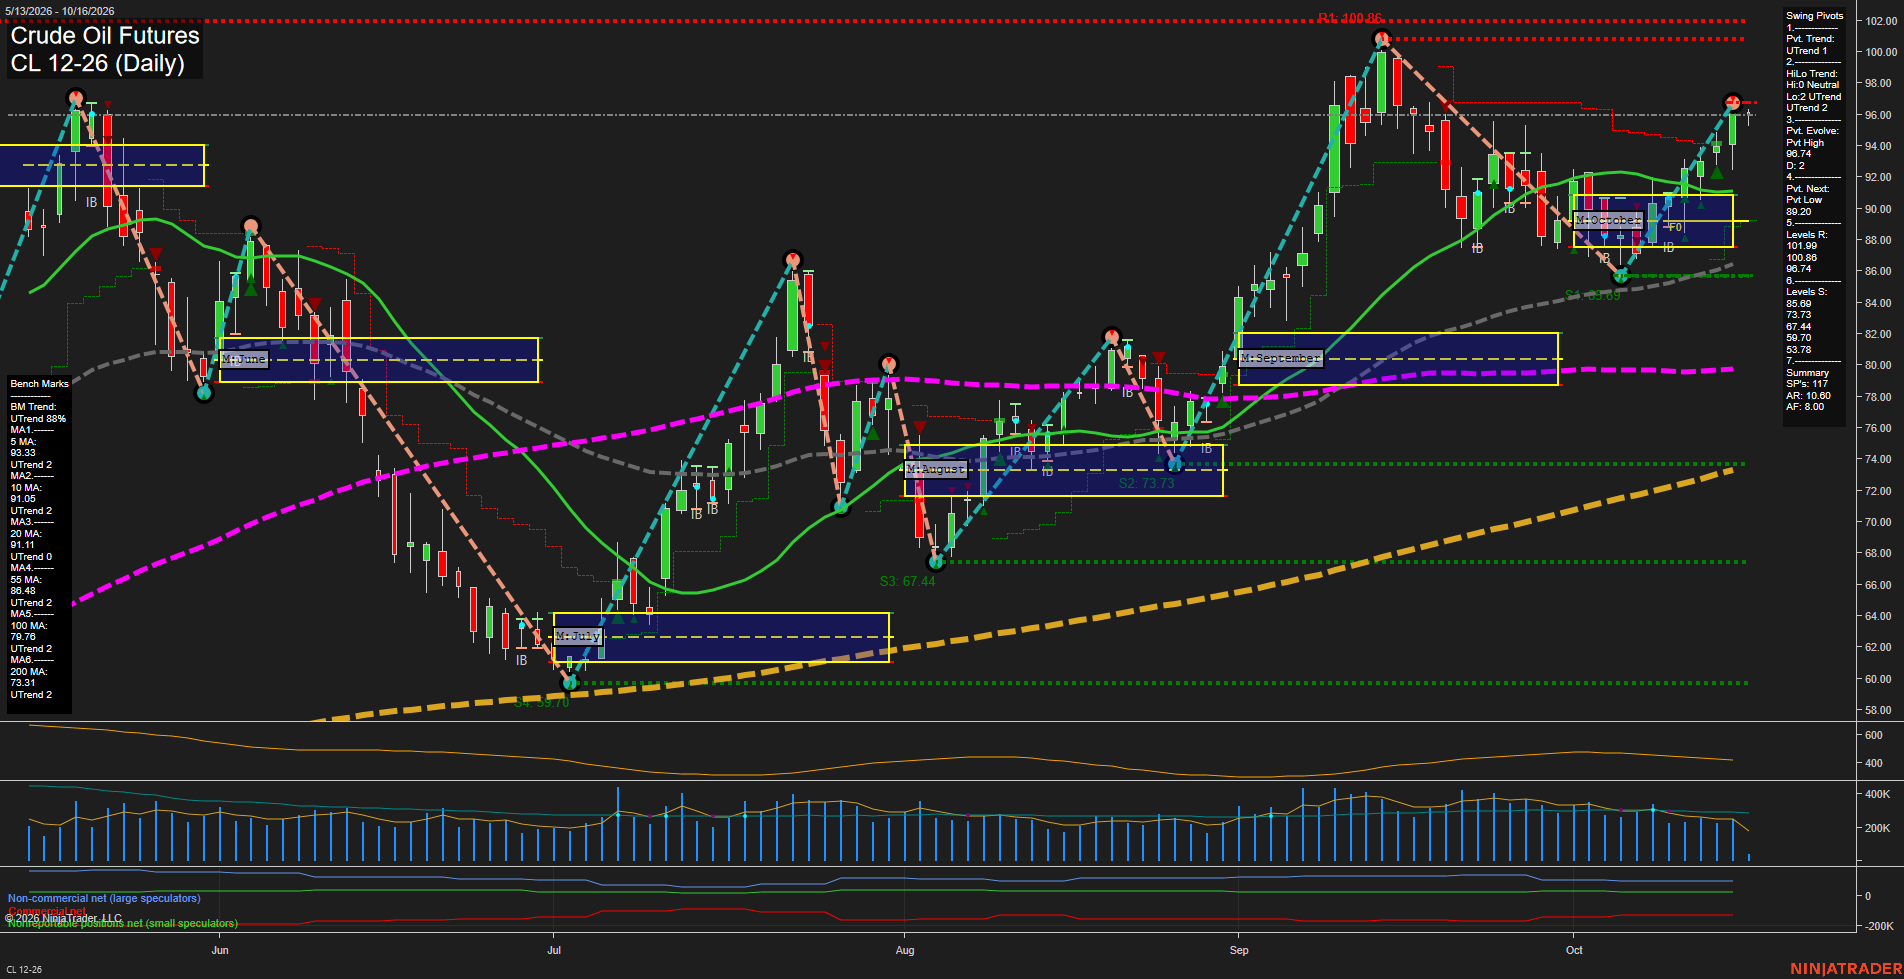
Overall Rating
- Short-Term: Bullish
- Intermediate-Term: Bullish
- Long-Term: Bullish.
Key Insights Summary
Price is advancing from the early-October pivot low and has reclaimed the 5-, 10-, 20-, and 55-day benchmarks, producing a fast short-term recovery into the 96.74 pivot-high area. Both pivot trend measures remain in UTrend, while the weekly, monthly, and yearly fib-grid biases are above F0%, aligning the short-, intermediate-, and long-term structure positively. The immediate chart focus is the 96.74 pivot high and the overhead 100.20-100.86 resistance band; support is layered at 90.20, 85.69, and 83.73. The broad structure retains higher lows from the August base, and price remains materially above the rising 100- and 200-day averages, confirming a sustained longer-cycle recovery.
View charts on: AlphaWebTrader HTF Charts
GC Daily View
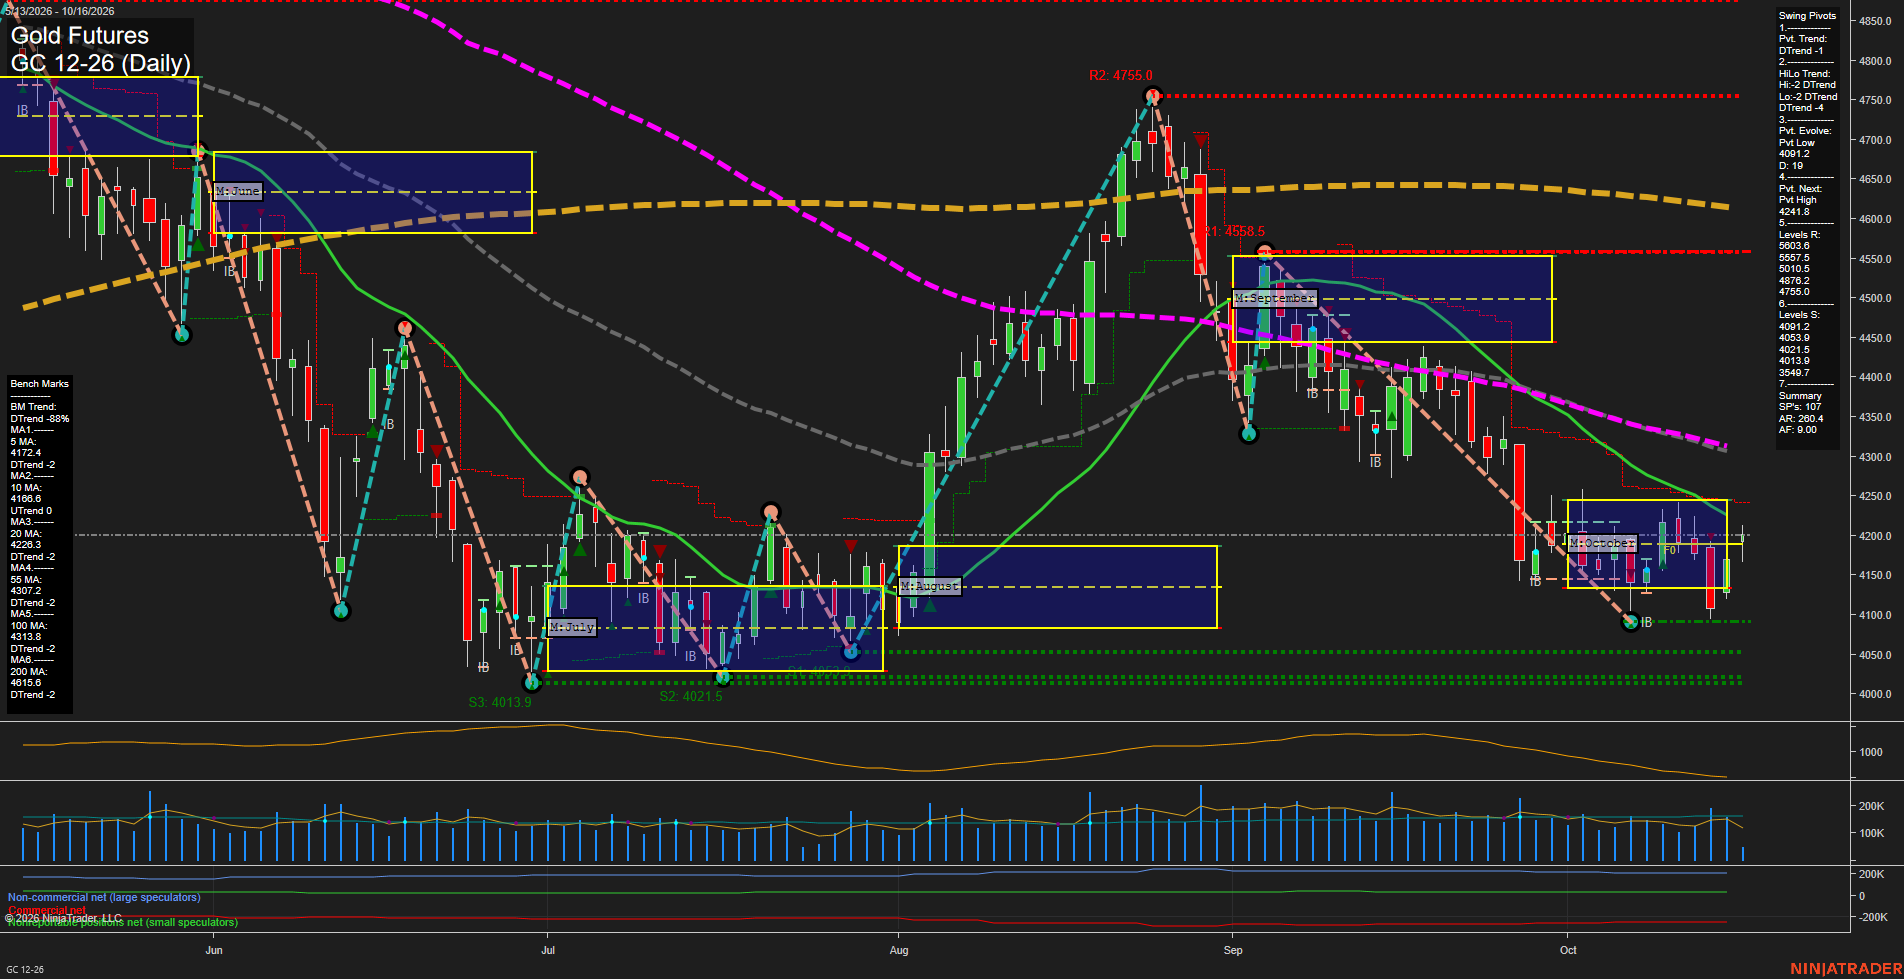
Overall Rating
- Short-Term: Bearish
- Intermediate-Term: Bearish
- Long-Term: Bearish.
Key Insights Summary
Gold is consolidating below the October monthly F0% area and the declining 20-day average after a sharp September reversal from 4755.0. The short-term pivot structure remains in a DTrend, with the current low pivot at 4091.2 and 4241.8 defining the next pivot reversal threshold. Price is holding above nearby 4091.2 to 4021.5 support, but lower highs beneath the 20-, 55-, 100-, and 200-day benchmarks preserve the broader corrective structure. Recent bars reflect compressed, choppy momentum following the selloff, while the mixed 5- and 10-day averages describe a narrow countertrend stabilization within a bearish intermediate and long-term trend.
View charts on: AlphaWebTrader HTF Charts
ZB Daily View
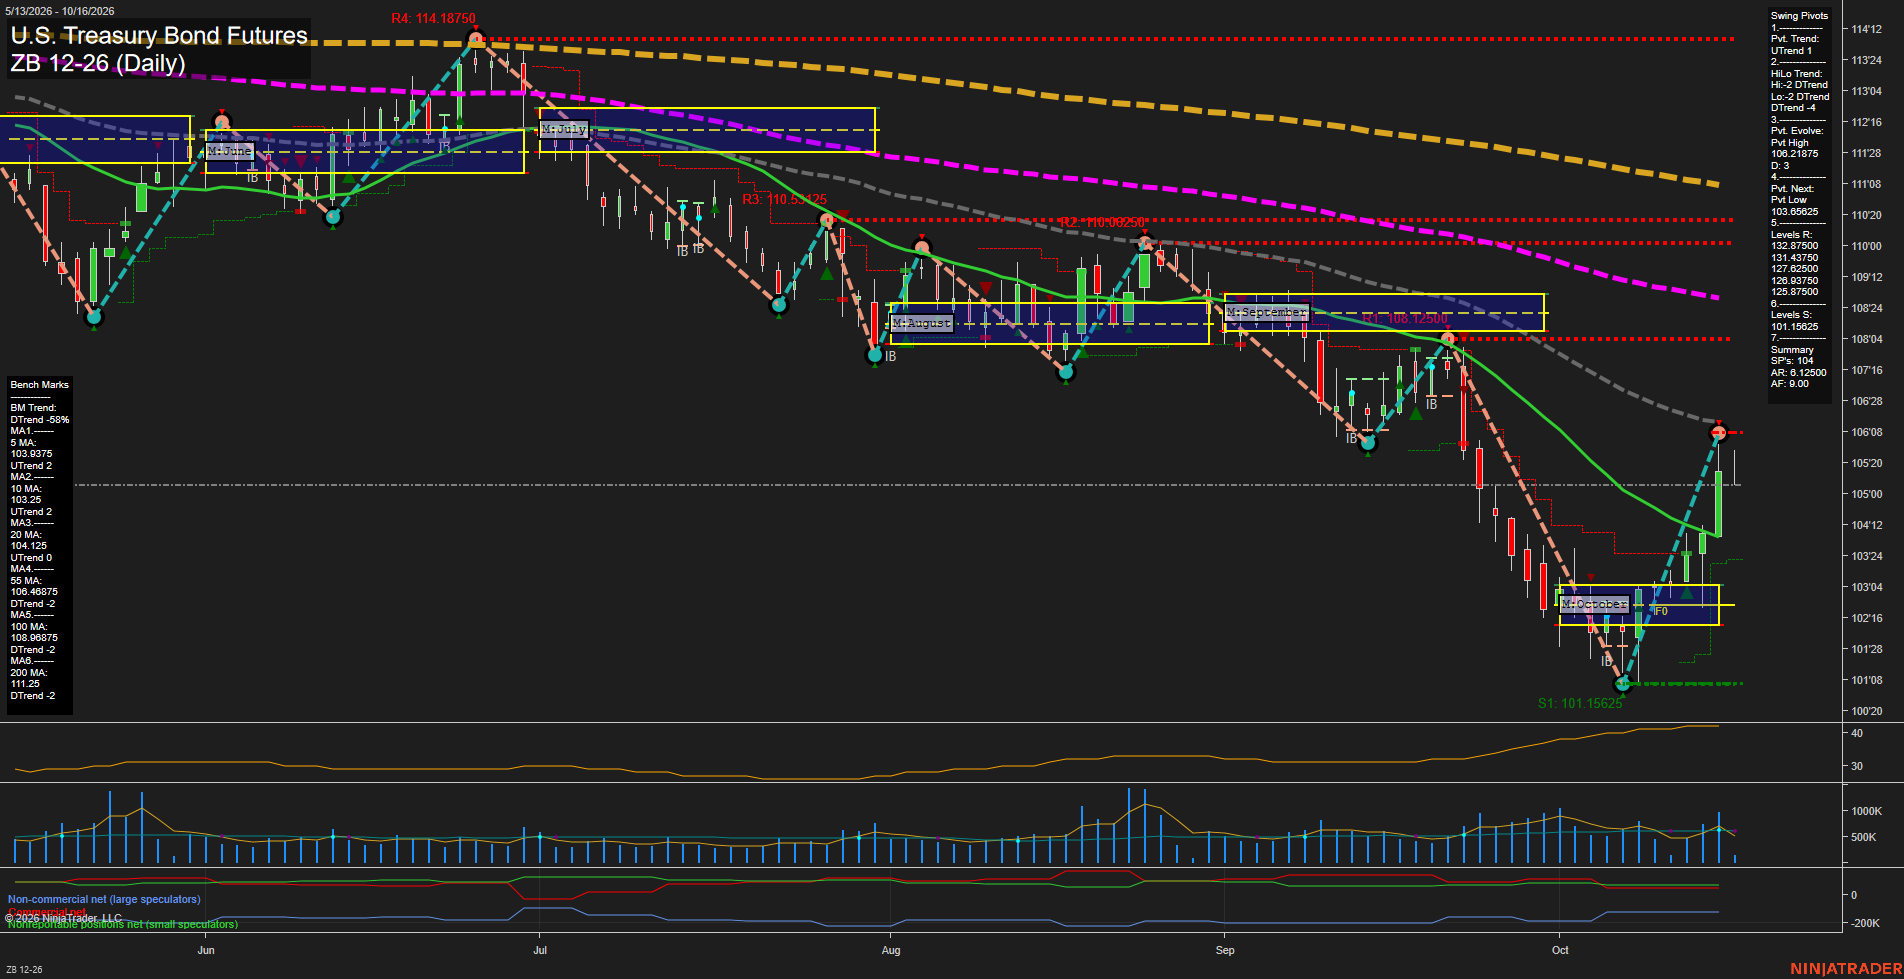
Overall Rating
- Short-Term: Bullish
- Intermediate-Term: Neutral
- Long-Term: Bearish.
Key Insights Summary
The daily chart shows a sharp V-style recovery from the October 101-05 swing low, with price rebounding above the 5-, 10-, and 20-day benchmarks and the short-term pivot trend turning higher. The intermediate pivot structure remains down, however, as price is still beneath the declining 55-, 100-, and 200-day averages. The recovery is fast and volatility has expanded, leaving the 106-03 pivot-high area as the nearest structural test while the broader long-term pattern continues to reflect lower highs and a bearish major-trend alignment.
View charts on: AlphaWebTrader HTF Charts