Markets navigated rising yields, sticky inflation, AI volatility and geopolitical oil risks, with technology under pressure and energy support.
Fundamentals: U.S. markets faced cross-currents from rising Treasury yields, persistent inflation concerns, AI-sector volatility and elevated energy prices. Technology and semiconductor shares remained pressured, while energy, defensive and value areas showed relative strength. Oil supply disruptions, credit-market strain, housing weakness and demand for downside hedges added to a cautious technical backdrop.
Technicals: Equity ETFs showed strength in Amazon, Tesla and Nvidia, while USO, GLD and TLT declined. Futures technical readings were mixed: ES, YM and FDAX retained broadly constructive long-term structures despite corrective pressure, while NQ, EMD and RTY showed bearish short-term or daily conditions. Key pivot levels and moving-average alignment underscored elevated volatility across several markets.
After Market Close daily snapshot: market news summary and sentiment, major ETFs, Magnificent 7 analysis, Indices Futures Higher Time Frame Analysis, and E-mini S&P500, Nasdaq 100, NYMEX Crude, Gold Futures Daily Chart analysis.
As of: October 19, 2026 05:00 CT
Market News Summary:
Index-futures sentiment remains shaped by bond yields, inflation concerns, AI-sector volatility, and elevated energy prices.
Primary Drivers & Risks:
- Primary Driver: Bond yields and AI earnings
- Primary Risk: Sticky inflation and credit stress
Tone:
Cautious and cross-current, with selective rebounds after technology weakness.
Stock Market / ETFs / Indices:
Technology and growth stocks faced pronounced selling pressure, with the Nasdaq 100 ETF down 5.54% and technology down 7.70% in the cited weekly commentary. Semiconductor weakness raised concerns for AI-linked equity indices, while a later rebound in some technology shares followed easing AI credit concerns. Demand for downside hedges lifted the VIX to 20 ahead of mega-cap earnings.
Geopolitical:
The Iran war remained a pressure point for agriculture, household costs, and retailers. Iran-backed Houthi attacks on Saudi infrastructure, including the Shaybah oil field and airports, added to regional risk.
Oil / Energy:
WTI approached $100 resistance after an 8.6 million-barrel U.S. crude inventory draw and stronger refinery runs, while Brent drew buyers near $107. Low U.S. strategic petroleum reserve stocks and geopolitical disruptions reinforced attention on supply conditions, although one report noted an oil pullback.
Gold / Metals:
Gold struggled under persistent inflation, a stronger dollar, and rising interest rates, while silver and platinum gained ground. Commentary also highlighted ongoing interest in gold as an alternative asset amid inflation and bank-sector concerns.
Fed / Financials:
Hotter CPI and PPI readings revived rate-hike concerns as Treasury yields resumed rising after the prior week’s decline. Surveyed economists described firmer growth alongside higher yields for longer and eventual inflation relief; Bank of Canada inflation expectations also increased. Treasury financing anxiety and mixed signals from riskier junk bonds added to financial-market strain.
Macro / Other:
Higher mortgage rates kept homebuyers sidelined and prompted some builders to cut prices, pressuring housing margins. Retailers faced higher household-cost pressures, while China showed signs of economic strength despite uneven growth concerns. AI investment supplied a large share of S&P 500 earnings growth, but capex growth figures pointed to a substantial slowdown from 2026 levels by 2028.
Conclusion:
Bond yields, inflation data, oil prices, and AI-related earnings and financing concerns dominated the market narrative. Equity performance diverged between pressured technology shares and stronger energy, defensive, and value areas.
Geopolitical disruptions supported energy and added to food and consumer-cost pressures. Credit-market signals, housing weakness, Treasury financing concerns, and elevated demand for downside hedges remained important cross-currents.
Market News Sentiment
Market News Articles: 61
- Neutral: 52.46%
- Negative: 34.43%
- Positive: 13.11%
Sentiment Summary: Market news sentiment is predominantly neutral at 52%, with negative coverage at 34% and positive coverage at 13%.
Conclusion: The news flow is neutral overall, while negative articles outnumber positive articles.
GLD,Gold Articles: 11
- Neutral: 54.55%
- Positive: 45.45%
Sentiment Summary: Gold-related coverage is mixed, with 55% neutral articles and 45% positive articles across 11 items.
Conclusion: The sentiment balance indicates largely neutral coverage with a modest positive tilt.
USO,Oil Articles: 10
- Negative: 50.00%
- Neutral: 30.00%
- Positive: 20.00%
Sentiment Summary: USO/Oil coverage is predominantly negative, with 50% negative, 30% neutral, and 20% positive articles.
Conclusion: Oil-related news tone is net negative, which may be relevant context for indices futures day traders monitoring energy-sector sentiment.
Market Data Snapshot
ETF Snapshot of major stock market ETFs, Mag7, and others as of: October 19, 2026 05:00
Top Movers & Losers
- AMZN 262.45 Bullish 4.98% ▲
- TSLA 368.06 Bullish 3.76% ▲
- NVDA 217.09 Bullish 1.38% ▲
- USO 160.81 Bearish -0.59% ▼
- GLD 379.69 Bearish -0.61% ▼
- TLT 79.46 Bearish -0.74% ▼
Major Index ETFs: SPY, QQQ, DIA, IWM, IJH
- QQQ 718.36 Bullish 1.21% ▲
- SPY 766.48 Bullish 0.42% ▲
- IWM 271.28 Bullish 0.31% ▲
- IJH 72.38 Bullish 0.04% ▲
- DIA 518.92 Bearish -0.03% ▼
Mixed index ETF snapshot: QQQ was the most bullish mover at +1.21%, followed by SPY at +0.42% and IWM at +0.31%. IJH was marginally Bullish at +0.04%, while DIA was the most bearish mover, near-flat at -0.03%.
Mag 7 Stocks: AAPL, MSFT, GOOG, AMZN, META, NVDA, TSLA
- AMZN 262.45 Bullish 4.98% ▲
- TSLA 368.06 Bullish 3.76% ▲
- NVDA 217.09 Bullish 1.38% ▲
- GOOG 340.16 Bullish 0.96% ▲
- MSFT 533.52 Bullish 0.84% ▲
- AAPL 342.94 Bearish -0.15% ▼
- META 705.44 Bearish -0.55% ▼
Mag7 is Mixed: AMZN is the most bullish mover at +4.98%, followed by TSLA at +3.76%. NVDA, GOOG, and MSFT remain Bullish at +1.38%, +0.96%, and +0.84%. META is the most bearish mover at -0.55%, while AAPL is marginally Bearish at -0.15%.
Cross-Market ETFs: TLT, GLD, USO, IBIT
- IBIT 46.30 Bullish 0.33% ▲
- USO 160.81 Bearish -0.59% ▼
- GLD 379.69 Bearish -0.61% ▼
- TLT 79.46 Bearish -0.74% ▼
Cross-market action was Mixed: IBIT was the most bullish mover at +0.33%, while TLT was the most bearish mover at -0.74%. GLD declined -0.61% and USO fell -0.59%, keeping the broader group Bearish outside of IBIT.
ETF, Mag7, and Cross-Market ETF Insights
Overall Tone
Mixed, with Bullish technology-led equity strength offset by Bearish defensive and commodity-linked cross-market ETFs.
Equity ETFs and Mag7:
Major Index ETFs were selectively Bullish: QQQ led at +1.21%, followed by SPY at +0.42%, IWM at +0.31%, and marginal IJH at +0.04%, while DIA was near-flat Bearish at -0.03%. Mag7 leadership was concentrated in AMZN, the most bullish mover at +4.98%, and TSLA at +3.76%; META was the most bearish mover at -0.55%, with AAPL also Bearish at -0.15%. NVDA, GOOG, and MSFT remained Bullish, supporting a selective rather than fully broad equity advance.
Cross-Market ETFs:
Cross-market ETFs were Mixed but tilted Bearish, with IBIT the only Bullish instrument at +0.33%. TLT was the most bearish mover at -0.74%, followed by GLD at -0.61% and USO at -0.59%. The contrast between Bullish QQQ and Bearish TLT, GLD, and USO reflects divergence across equities, rates, metals, and energy.
Futures Indices – Higher Time Frame Analysis
Summary of the current state of US Indices Futures based on higher time-frame (HTF) technical analysis as of: 2026-10-19: 17:00 CT.
US Indices Futures
- ES YSFG above F0%, MSFG below F0%, WSFG mixed; UTrend weekly pivots, daily DTrend; resistance 7824-7906.25, support 7672.75-7676, 7502.25.
- NQ YSFG up, MSFG below F0%, WSFG rebound above F0%; weekly and daily DTrend; resistance 30191, 31369-31616.50, support 29226-29262, 27500.75.
- YM YSFG, MSFG and WSFG above F0%; weekly consolidation, daily UTrend; resistance 52838, 53199, 55316; support 51681 and 50859.
- EMD YSFG, MSFG and WSFG above F0%; weekly pullback and daily DTrend; resistance 3708.7-3737.8, 3792.3; support 3600.3.
- RTY YSFG and WSFG above F0%, MSFG below F0%; weekly and daily DTrend; resistance 2808.7, 2887.1-3101.8; support 2723.3.
- FDAX YSFG and MSFG above F0%, WSFG below F0%; weekly and daily correction; resistance 25454-25686, 26247; support 25247-24925.
Overall State
- Short-Term: Bearish
- Intermediate-Term: Neutral
- Long-Term: Bullish
Conclusion
US index futures display broad short-term corrective alignment, led by bearish daily pivot and benchmark structures in ES, NQ, EMD, RTY, and FDAX. YM is the relative exception, holding a daily UTrend above its short benchmarks. Yearly grids and rising longer-period benchmarks retain bullish long-term structure across most contracts. Monthly grids remain mixed, with ES, NQ, and RTY below F0%, while YM, EMD, and FDAX remain above F0%. Key pivot supports define current downside references; overhead reversal pivots and benchmark clusters define resistance.
Note: Intra-day counter-trend pullbacks or retracements may occur, HTF is context for informational usage and market structure. Glossary: Session Fib Grids periods of YSFG:’Yearly’, MSFG:’Monthly’, WSFG:’Weekly’
For full details visit: AlphaWebTrader Technicals
ES Daily View
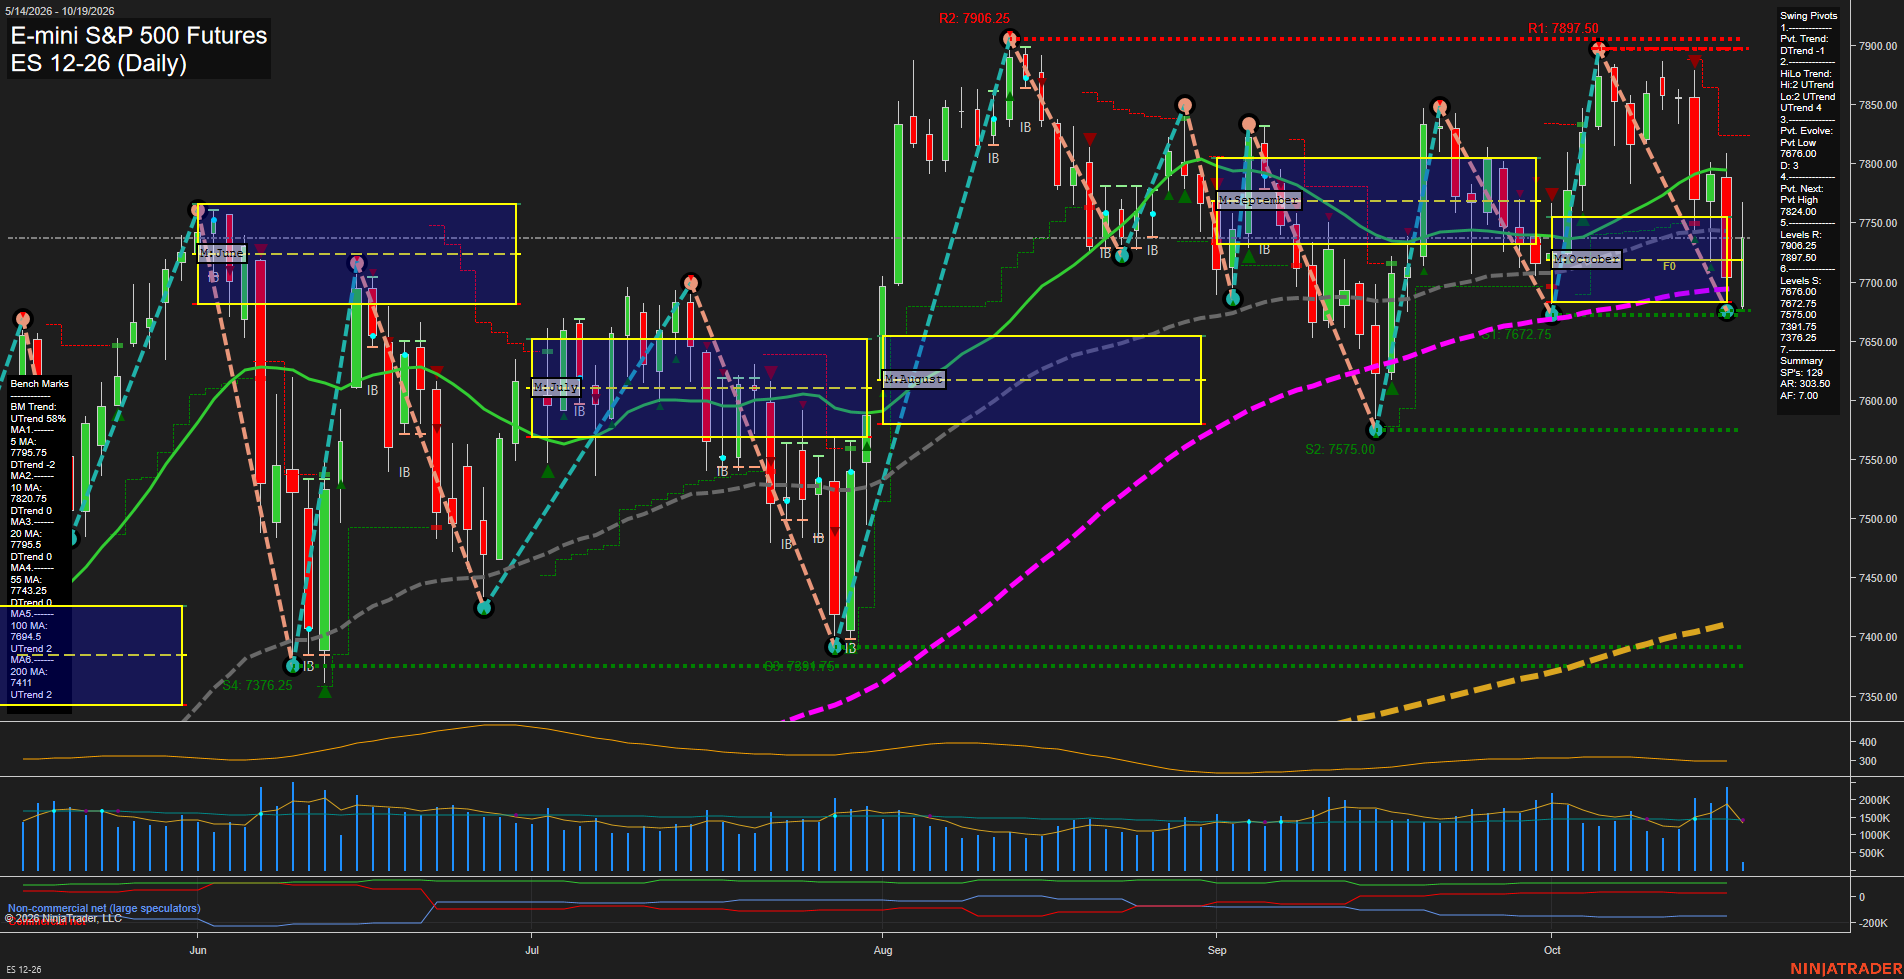
Overall Rating
- Short-Term: Bearish
- Intermediate-Term: Bearish
- Long-Term: Bullish.
Key Insights Summary
Daily price action reflects a sharp, high-range retracement from the 7897.50-7906.25 resistance zone, with the short-term pivot structure now in DTrend and price trading beneath the 10-, 20-, and 55-day benchmarks. The October MSFG remains below its F0% area, reinforcing the intermediate corrective phase. The 7676.00-7672.75 support band is the immediate downside reference, while 7824.00 is the next pivot reversal threshold. Despite the short- and intermediate-term weakness, the higher-level structure remains constructive: the HiLo pivot trend, yearly fib-grid position, and rising 100- and 200-day benchmarks retain a longer-term bullish backdrop.
View charts on: AlphaWebTrader HTF Charts
NQ Daily View
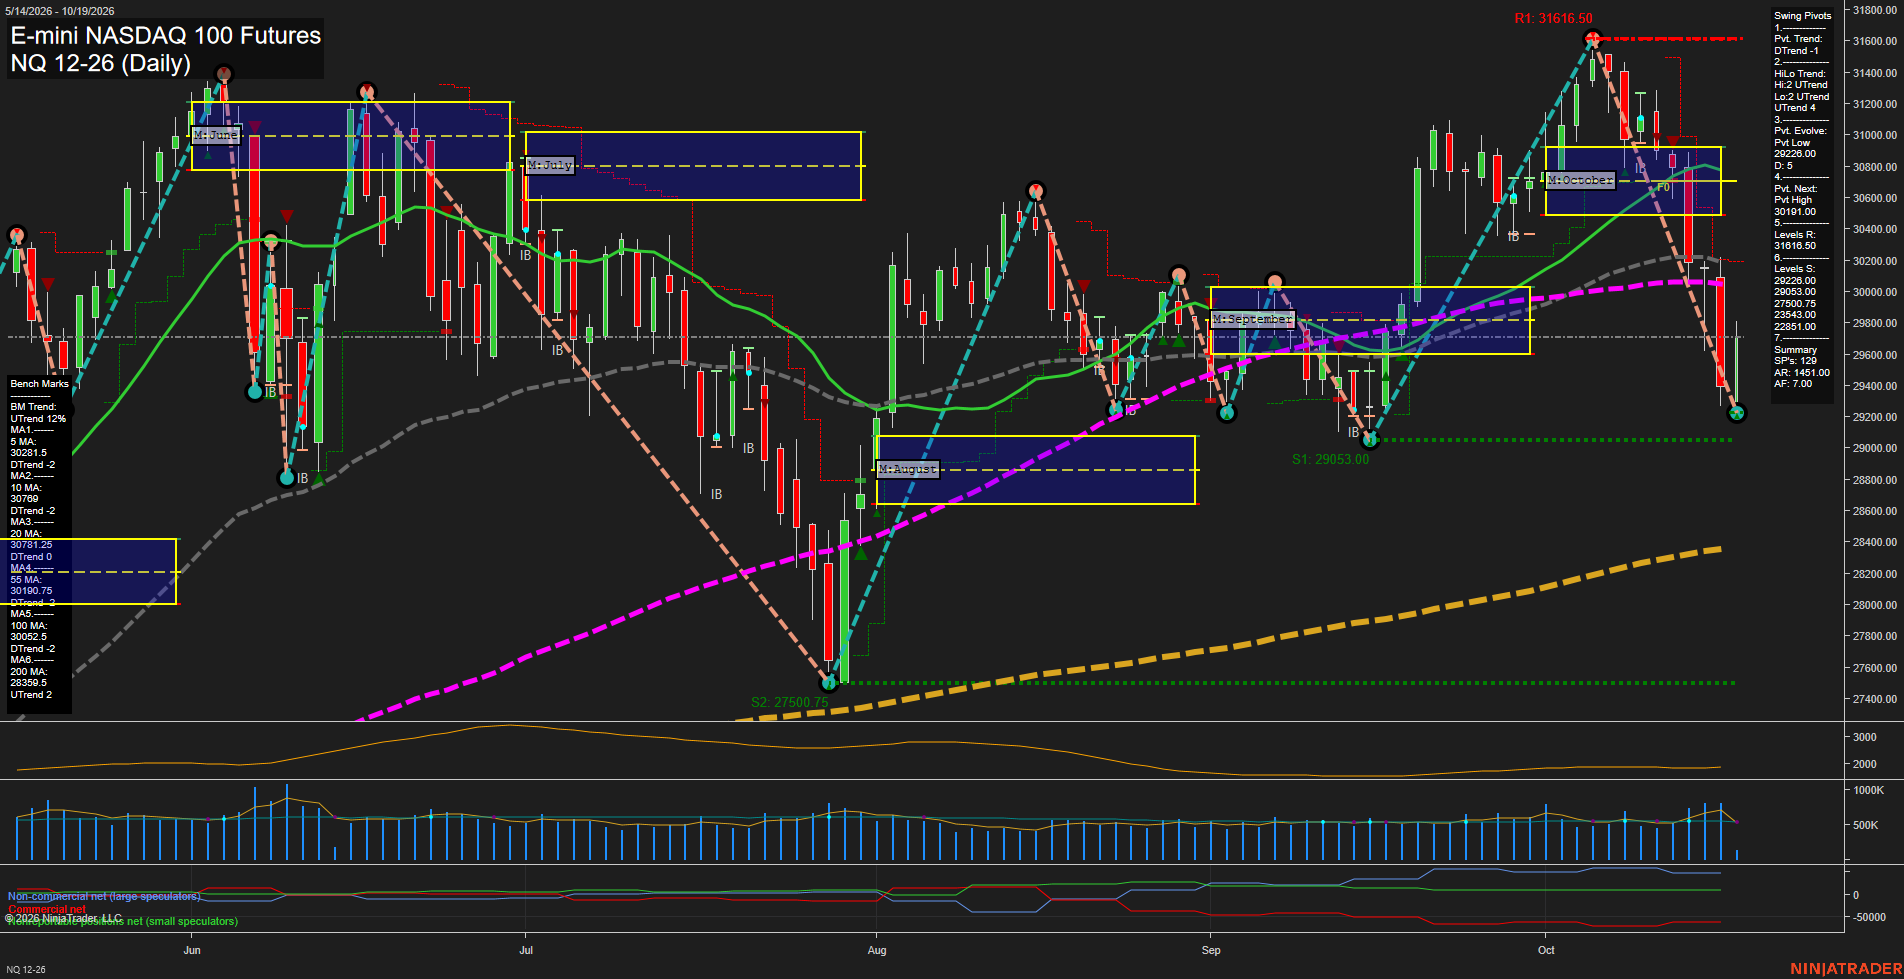
Overall Rating
- Short-Term: Bearish
- Intermediate-Term: Bearish
- Long-Term: Neutral.
Key Insights Summary
Price has staged a sharp rebound from the 29236 pivot low, placing it above the weekly F0% area, but the daily swing structure remains in a short-term DTrend. The recovery is counter-trend relative to declining 5-, 10-, 20-, 55-, and 100-day benchmarks, with 30191 acting as the next pivot-reversal threshold. The October monthly grid remains below F0% and the intermediate trend is down, while the yearly grid and rising 200-day average preserve a constructive longer-term backdrop. The market is experiencing elevated, fast momentum and wide daily movement following a steep selloff from the 31616.50 swing high; 29226 and 29053 define the nearby support zone beneath the rebound.
View charts on: AlphaWebTrader HTF Charts
CL Daily View
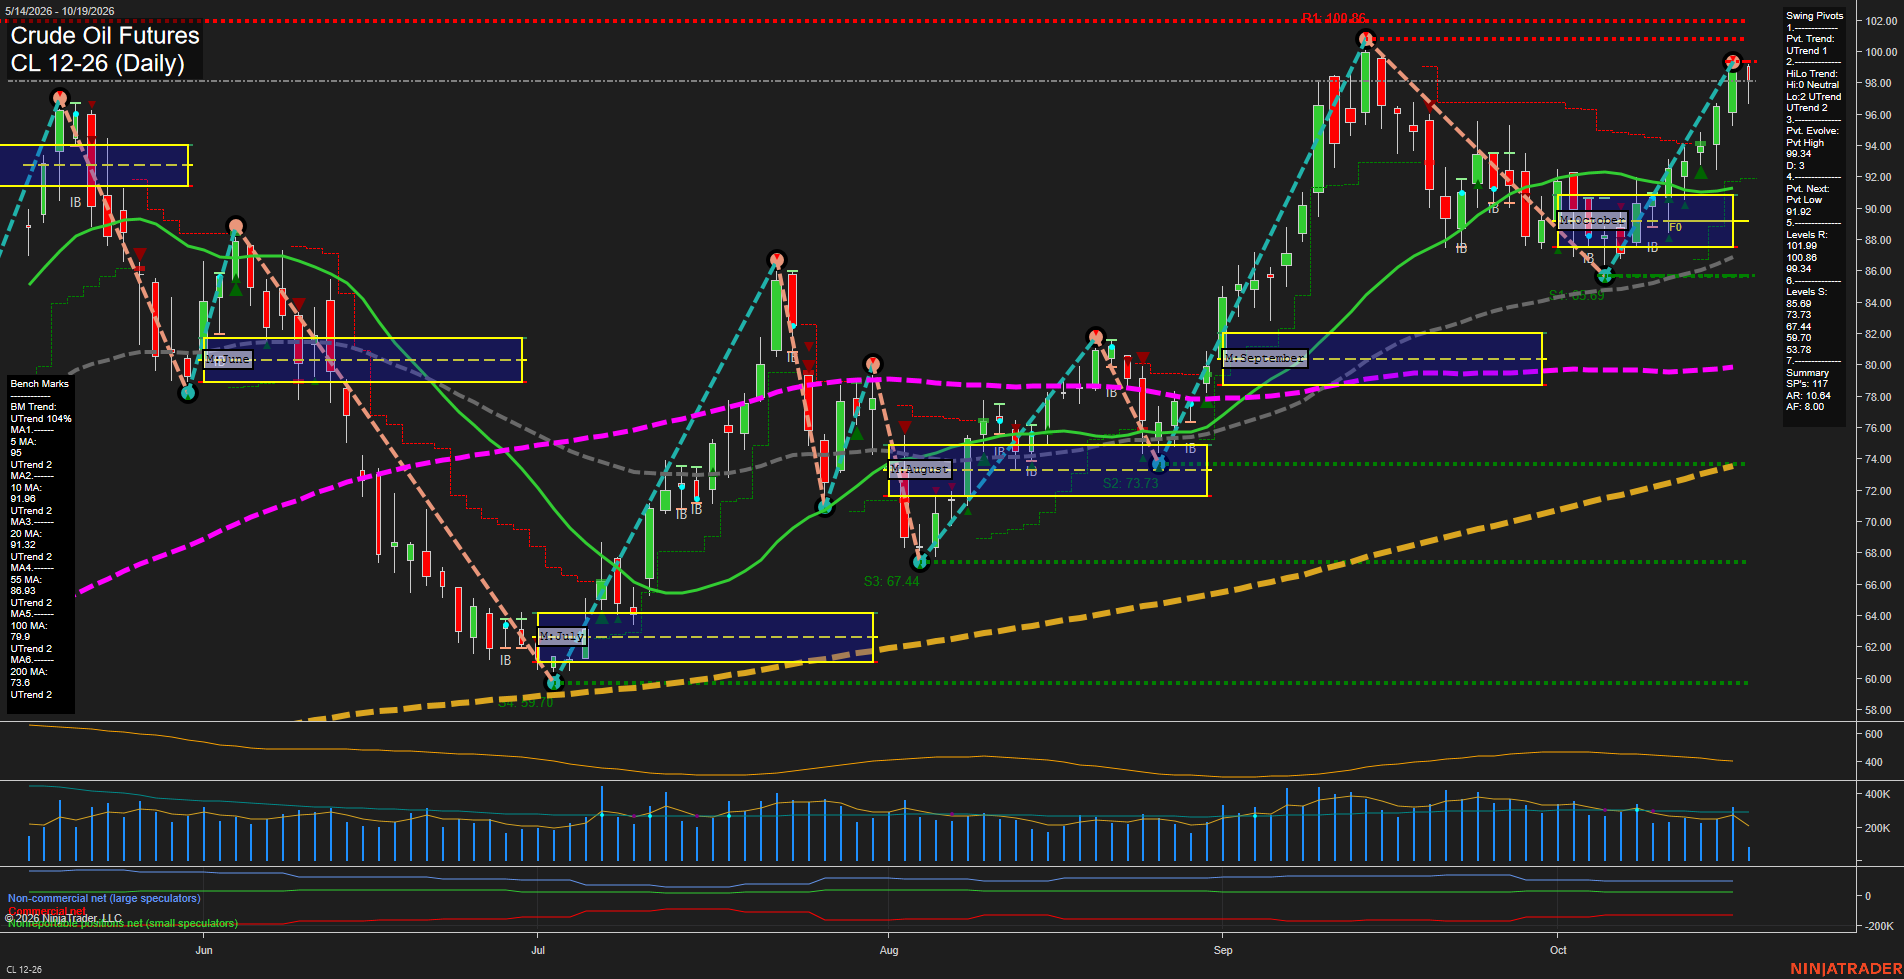
Overall Rating
- Short-Term: Bullish
- Intermediate-Term: Bullish
- Long-Term: Bullish.
Key Insights Summary
Price is extending sharply from the early-October 86.09 swing low, with a sequence of higher lows and higher highs carrying CL back into the 99.34 pivot-high area. The short-term weekly grid remains countertrend bearish below its F0% reference, while the monthly and yearly grids remain positive. Price is above all rising daily benchmarks, confirming broad multi-timeframe upside alignment. The immediate chart structure is testing clustered pivot resistance at 99.34, 100.86, and 101.99 following a fast, high-range advance; 91.92 is the next pivot-reversal reference, with 86.09 the major nearby swing support.
View charts on: AlphaWebTrader HTF Charts
GC Daily View
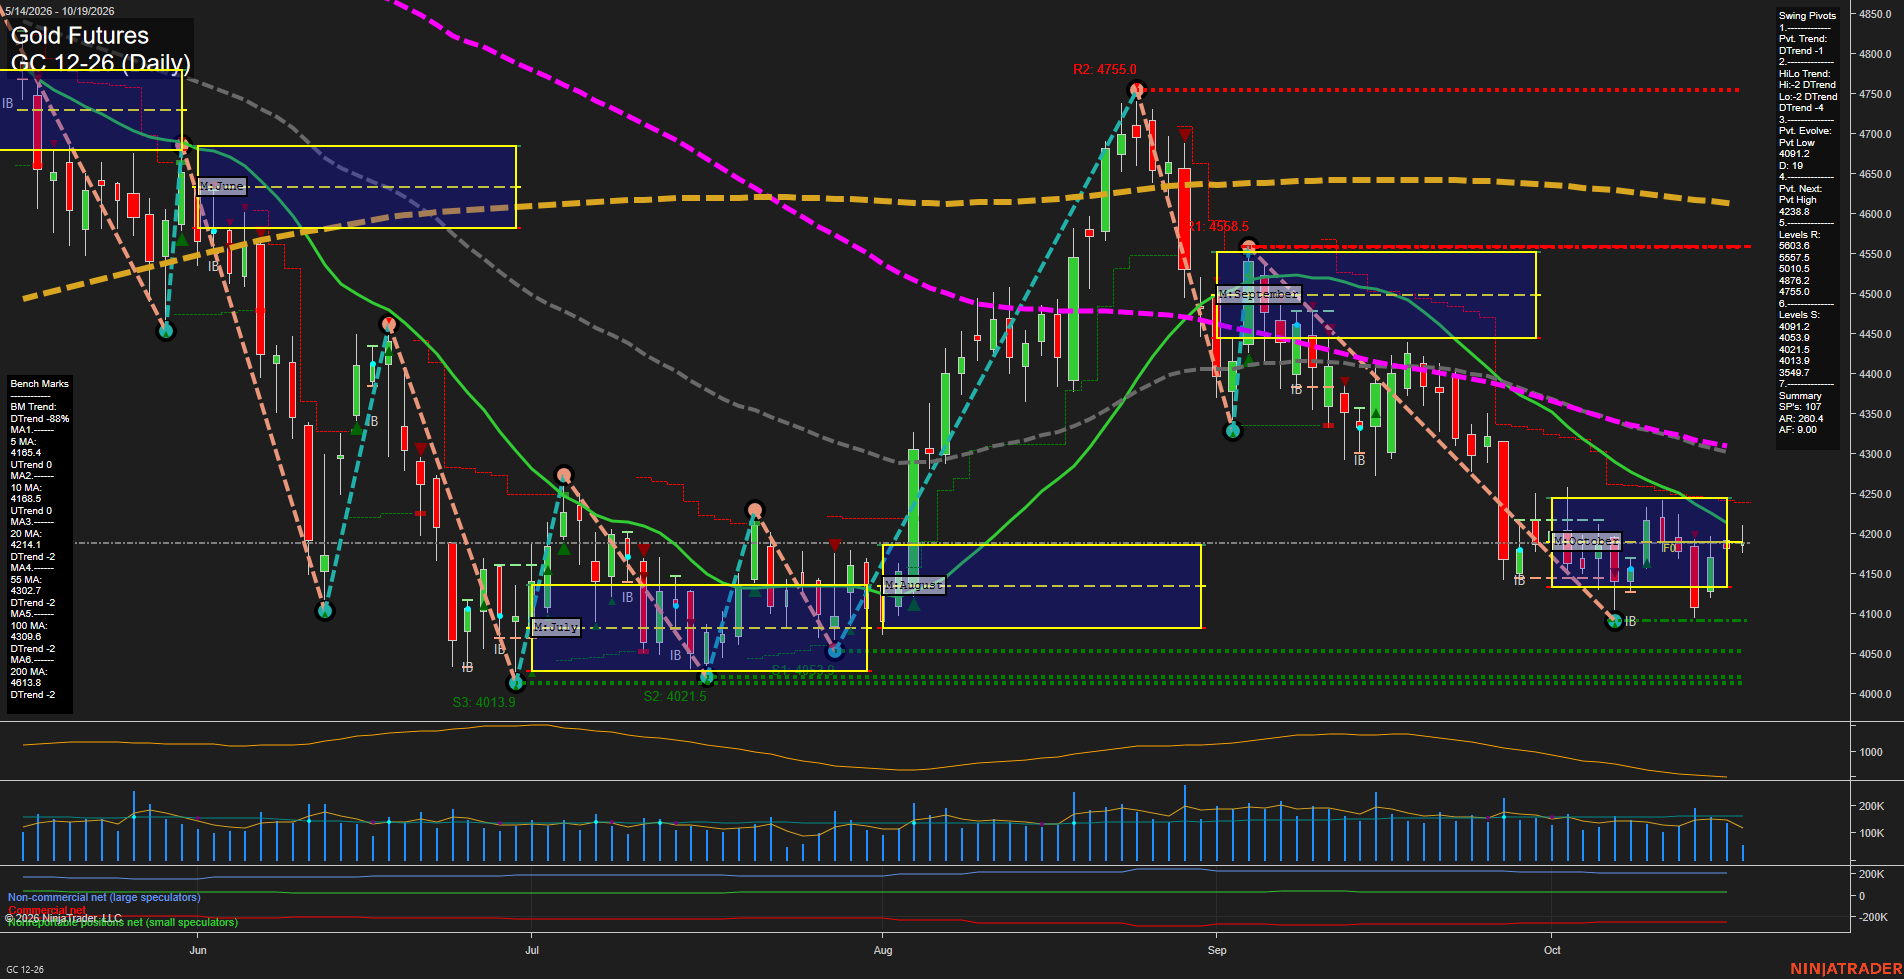
Overall Rating
- Short-Term: Neutral
- Intermediate-Term: Bearish
- Long-Term: Bearish.
Key Insights Summary
Gold is consolidating in a narrow October range after a sharp September-to-early-October decline. Small daily bars and slow momentum reflect balance around the 5- and 10-day averages, while price remains below the 20-, 55-, 100-, and 200-day benchmarks. The pivot structure remains bearish on both short- and intermediate-term measures, with 4238.8 defining the next upside pivot threshold and 4091.2 as nearby downside pivot support. The monthly and yearly Fib-grid biases remain below F0%, maintaining the broader corrective, lower-high trend despite the short-term stabilization.
View charts on: AlphaWebTrader HTF Charts
ZB Daily View
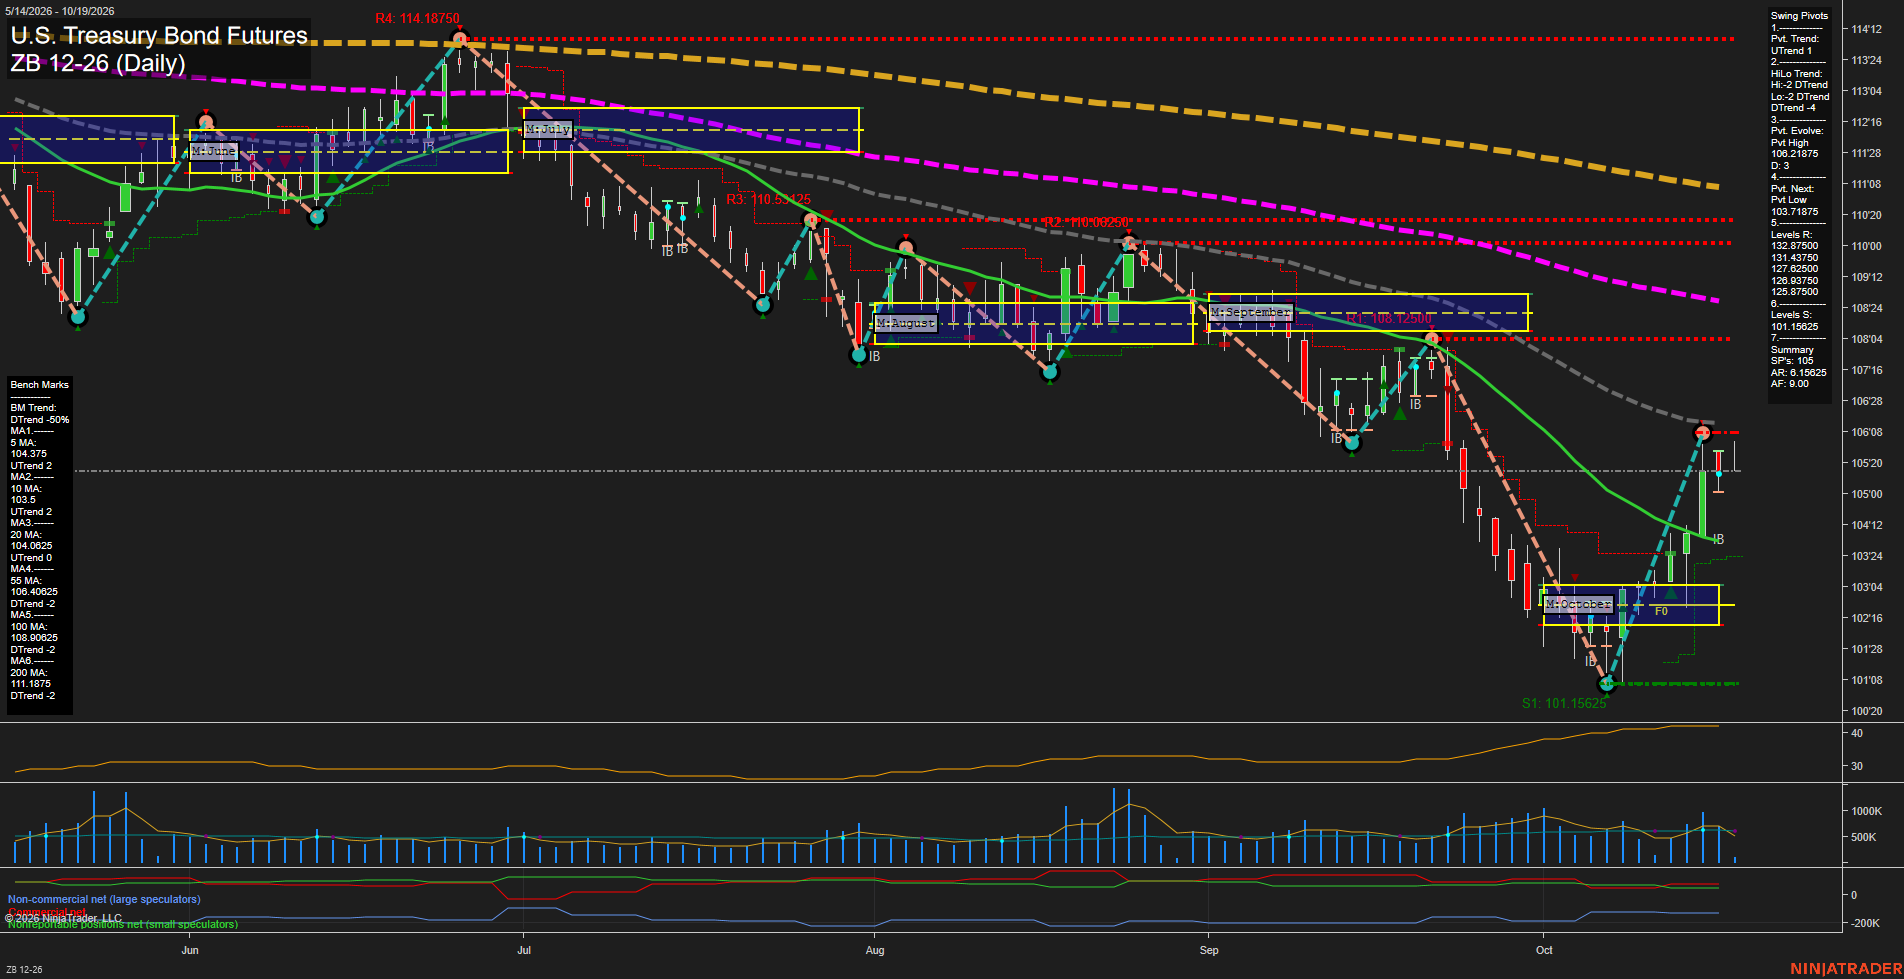
Overall Rating
- Short-Term: Bullish
- Intermediate-Term: Neutral
- Long-Term: Bearish.
Key Insights Summary
The daily chart shows a sharp V-style rebound from the 101-05 swing-low support area, with the short-term pivot structure now in UTrend and price above the rising 10-day and 20-day benchmarks. The rebound remains countertrend within a broader intermediate and long-term decline: the HiLo trend is DTrend and price remains below the declining 55-day, 100-day, and 200-day averages. Current action is testing the 105-20 region after a fast recovery, while the evolving 106-03 pivot high is the nearby structural ceiling. The October monthly grid remains constructive above F0%, but the weekly grid remains negative, highlighting a short-term recovery inside a larger bearish price cycle.
View charts on: AlphaWebTrader HTF Charts