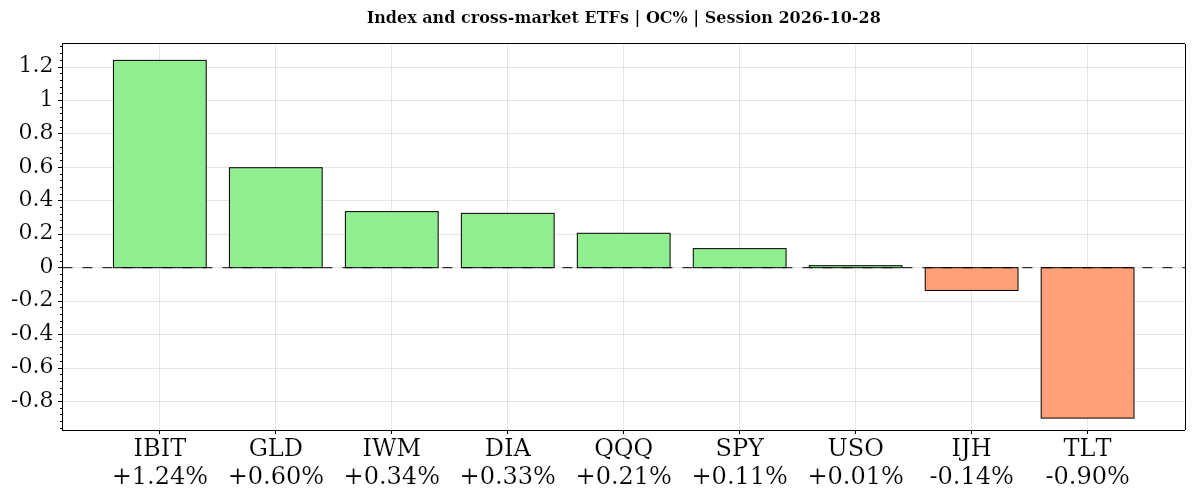
Stocks and tech edged higher ahead of Alphabet and Microsoft earnings after Wednesday's close; the Fed held rates steady and oil retained its opening gap.
Fundamentals: Stocks and tech rose Wednesday ahead of Alphabet and Microsoft earnings after the close. The day's agenda included $30 billion in 2-year floating-rate notes and $75 billion in 17-week bills at 11:30 a.m. ET, the Fed decision at 2 p.m. and its press conference at 2:30 p.m. The Fed held rates at 3.75%–4.00%, with two pro-hike dissents. Oil gained amid Middle East escalation risks, while gold fell after the decision.
Technicals: Stocks and tech rose in the completed October 28 session, with S&P 500 and Nasdaq-100 ETFs gaining 0.11% and 0.21% from their opens on below-average volume. Megacaps were mixed: Alphabet advanced while Nvidia and Meta fell. The oil ETF gained just 0.01% from its open but finished 1.64% above its prior close. Gold rose 0.60% from its open despite falling longer-term averages, while far-term Treasury bonds lost 0.90%.
After Market Close daily snapshot: market news summary and sentiment, major ETFs, Magnificent 7 analysis, Indices Futures Higher Time Frame Analysis, and E-mini S&P500, Nasdaq 100, NYMEX Crude, Gold Futures Daily Chart analysis.
As of: October 28, 2026 05:00 CT
Earnings Radar Day Recap
Monitoring for earnings releases by the Magnificent 7, AI-tech-related firms, and major financial institutions.
| Date/Day | Impact | Company / Symbol | Time | EPS | Revenue | ||||||||
|---|---|---|---|---|---|---|---|---|---|---|---|---|---|
| 2026-10-28 – Wednesday | High | Alphabet (GOOGL) | After close |
|
| ||||||||
| 2026-10-28 – Wednesday | High | Microsoft (MSFT) | After close |
|
| ||||||||
| 2026-10-28 – Wednesday | Medium | Vertiv (VRT) | Before open |
|
|
For full details visit: Yahoo Earnings Calendar
EcoNews Radar U.S. Events Day Recap
| Date | Impact | Event, Prev, Forecast, Actual | Info |
|---|---|---|---|
| 2026-10-28 Wednesday 10:30 | Low | EIA Crude Oil Stocks Change Prev: -3.06M Forecast: -0.30M Actual: — | Measures the weekly change in commercial crude inventories, offering insight into petroleum supply-demand balances that traders monitor for energy-sector earnings and inflation implications. |
| 2026-10-28 Wednesday 11:30 | High | 2-Year FRN Auction · $30B Prev: — Forecast: — Actual: — | Reveals demand and pricing for Treasury floating-rate debt, helping traders assess government funding conditions and investor appetite for securities whose payments adjust with short-term rates. |
| 2026-10-28 Wednesday 11:30 | Medium | 17-Week Bill Auction · $75B Prev: — Forecast: — Actual: — | Shows demand and clearing yields for short-term government funding, providing context on money-market conditions and cash allocation that can inform broader rate expectations. |
| 2026-10-28 Wednesday 14:00 | High | Fed Interest Rate Decision Prev: 4% Forecast: 4.00% Actual: — | Sets the central bank’s policy rate target, a key input to financing costs and equity valuations; traders monitor the accompanying statement for changes in the policy outlook. |
| 2026-10-28 Wednesday 14:30 | High | FOMC Press Conference Prev: — Forecast: — Actual: — | Provides policymakers’ explanation of their decision and responses to questions, helping traders interpret the outlook for inflation, employment and the future path of interest rates. |
Summary: The calendar centers on monetary policy, alongside Treasury funding and energy-inventory updates.
Conclusion: All listed releases were scheduled before the publication cutoff.
Market News Summary:
The Fed held rates steady with two pro-hike dissents, while Middle East tensions lifted oil and Alphabet’s earnings approached after the close.
Primary Drivers & Risks:
- Primary Driver: Fed pause with December hike pricing
- Primary Risk: Middle East escalation and energy inflation
Tone:
Cautious, with persistent inflation concerns and mixed megacap developments.
Data, Market and System
Geopolitical:
- Ceasefire optimism faded amid concerns about renewed military operations against Iran.
Oil / Energy:
- WTI and Brent gained as traders positioned around Middle East escalation risks.
- Energy Secretary Chris Wright linked lower diesel prices to increased exports from the Arabian Gulf amid the Iran war.
Gold / Metals:
- Gold fell to $4,035 per ounce following the Fed’s decision to keep rates unchanged.
Fed / Financials:
- The FOMC voted 10–2 to maintain the federal funds target range at 3.75%–4.00%, with Beth Hammack and Lisa Cook dissenting in favor of an increase.
- Investors continued pricing a quarter-point December rate increase against a backdrop of worsening inflation data.
- Chair Kevin Warsh described the economy positively and said it was not running too hot, while stressing that inflation remained too high.
- Warsh attributed the pause to an approaching information-rich period and said politics played no role in the decision.
- Warsh announced seven rate decisions for 2027 and six for 2028, down from eight annually.
Macro / Other:
- The supplied economic coverage linked recent inflation acceleration to oil and gasoline price spikes caused by the Iran war.
- Consumer sentiment has weakened amid higher costs for gasoline, groceries, and clothing ahead of next week’s midterm elections.
Conclusion:
The Fed’s rate hold left the policy range unchanged, but two pro-hike dissents and December hike pricing kept inflation central to the news. Warsh paired a positive economic assessment with continued concern about elevated prices.
Rising crude prices and fading ceasefire optimism added an energy-related cross-current. Alphabet’s after-close earnings and cloud investment scrutiny at Amazon and Microsoft supplied additional megacap context, while gold declined after the Fed decision.
Market News Sentiment
Sentiment Bias shows the balance of positive and negative news coverage sampled from 2026-10-27 16:01 to 2026-10-28 15:58 ET, covering stocks, energy and gold.
▲ Market news
- Bias
- ▲ +17.37%
- Articles
- 213
- Positive
- ▲ 34.27%
- Neutral
- — 48.83%
- Negative
- ▼ 16.90%
▲ GLD / Gold
- Bias
- ▲ +10.53%
- Articles
- 19
- Positive
- ▲ 31.58%
- Neutral
- — 47.37%
- Negative
- ▼ 21.05%
Sentiment Summary: Gold coverage was mostly neutral (47%), with positive sentiment (32%) exceeding negative (21%), reflecting October 27’s recovery above $4,050 as lower crude eased inflation concerns alongside a Wall Street rally. That support weakened on October 28 as renewed regional tensions lifted oil and inflation concerns, while rising Treasury yields pressured precious metals ahead of the Fed decision. The Fed subsequently held rates at 3.75%–4.00% in a 10–2 vote, with gold reported down to $4,035, tempering the earlier rebound.
Conclusion: For indices futures traders, the main cross-market context is renewed oil-driven inflation concern alongside elevated yields and an unchanged Fed policy rate.
▲ USO / Oil
- Bias
- ▲ +7.14%
- Articles
- 28
- Positive
- ▲ 28.57%
- Neutral
- — 50.00%
- Negative
- ▼ 21.43%
Sentiment Summary: Oil coverage was mostly neutral (50%), with a modest positive bias (+7 percentage points), as October 28 reports linked rising crude to renewed Iran escalation concerns and the Houthis’ October 27 claim of a Saudi refinery strike. The EIA reported a 1.9-million-barrel crude inventory draw for last week, reinforcing supply concerns, while elevated oil and Treasury yields pressured equity sentiment. The main counterweight was October 27’s technology-led rally, when falling oil eased inflation concerns and the Nasdaq gained 1.14%.
Conclusion: Renewed energy-driven inflation pressure tempered the earnings backdrop, while October 28 coverage still described a Fed rate hold as expected, not announced.
Glossary: Sentiment Bias = (positive articles − negative articles) ÷ total articles × 100. It ranges from −100% negative to +100% positive. A reading near zero indicates little directional bias. Neutral articles reduce the score’s strength. ▲ positive; ▼ negative; — balanced. These readings describe news coverage, not market-price direction.
Market Technical Analysis
Analysis of VIX volatility, the completed session in major ETFs and mega-cap tech stocks, and futures snapshots and higher-time-frame analysis.
VIX — Market Fear Gauge Daily
| Level | Open | High | MaxVix | Low | MinVix | DNC% | DOC% | VR | MaxVR | MinVR |
|---|---|---|---|---|---|---|---|---|---|---|
| 16.92 | 17.38 | 17.77 | 22.31 | 16.21 | 14.77 | -3.42% | -2.65% | 9.95 | 41.30 | -0.20 |
VIX fell 2.65% from the session's opening level. VIX fell 3.42% versus the previous session close. Expected volatility eased from the period open. VIX is 28.5% up the recent 15-session range (14.77–22.31), in the 20–30% band.
VR: ATN Volatility Ratio (VR): 9.95 – Stocks rose while expected volatility eased. VR is in the lower part of its preceding 15-session VR range (-0.20 to 41.30), in the 20–30% band. VR rose 1.51 points from the previous session, a small shift relative to that range.
Range lookback: preceding 15 completed sessions.
Major ETFs and Mega Cap Tech Stocks
- Alphabet’s third-quarter earnings release is scheduled after the October 28 market close, with its shares up approximately 3% for the year.
- Google launched its Gemini 4 Carbon AI model with a cybersecurity focus.
- A securities lawsuit alleges Alphabet failed to disclose Gemini 3.5 Pro development delays and training-data setbacks.
- Amazon’s earnings coverage centers on AWS growth, a $496 billion backlog, AI partnerships, and capital-spending pressure on margins and free cash flow.
- Microsoft’s earnings coverage focuses on Azure growth relative to capital spending.
- Apple shares slipped Wednesday after the company unveiled its first touchscreen MacBook Pro, with earnings scheduled for next week.
- Meta indefinitely delayed new commercial terms following publishers’ concerns.
ETF, Mag7, and Cross-Market ETF Insights
Overall Tone
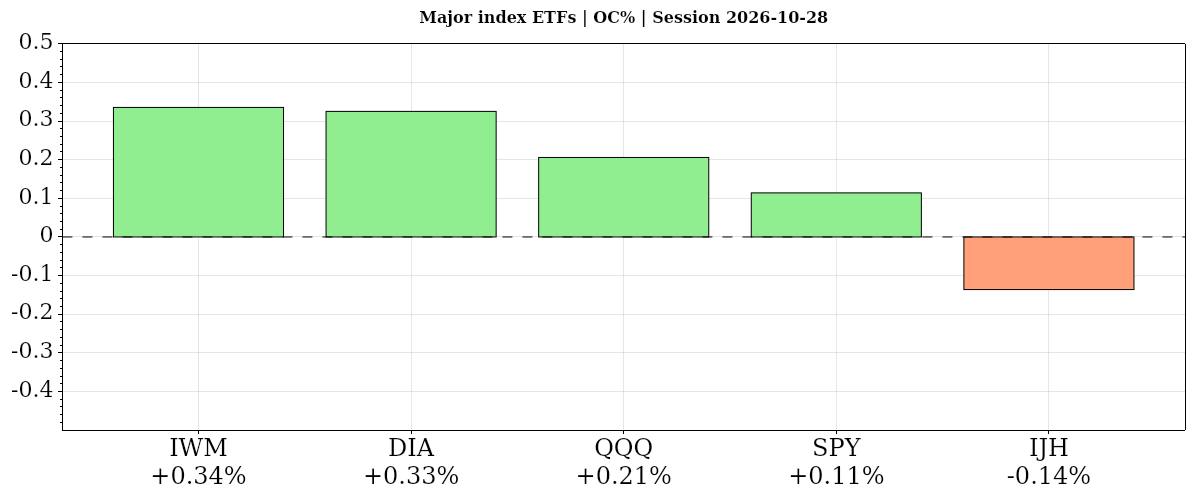
The October 28, 2026 daily session showed selective risk appetite: most index ETFs gained from the open, but most mega-caps declined, tempering the positive prior-close index picture.
| Instrument | Bias | Date | DNC% | DOC% | O | H | L | C | VWAP | Vol |
|---|---|---|---|---|---|---|---|---|---|---|
| ▲ IWM | ▲ ▲ ▲ | 2026-10-28 | ▲ +0.40% | ▲ +0.34% | 280.35 | 281.48 | 279.05 | 281.29 | ▲ 280.29 | 18,220,793 |
| ▲ DIA | ▲ ▲ ▲ | 2026-10-28 | ▲ +0.27% | ▲ +0.33% | 522.98 | 525.77 | 522.80 | 524.68 | ▲ 524.23 | 2,194,529 |
| ▲ QQQ | ▲ ▲ ▲ | 2026-10-28 | ▲ +0.60% | ▲ +0.21% | 724.12 | 726.14 | 720.30 | 725.61 | ▲ 722.99 | 27,761,001 |
| ▲ SPY | ▲ ▲ ▲ | 2026-10-28 | ▲ +0.34% | ▲ +0.11% | 771.43 | 773.36 | 769.24 | 772.31 | ▲ 771.29 | 29,181,630 |
| ▼ IJH | ▲ ▼ ▲ | 2026-10-28 | ▲ +0.18% | ▼ -0.14% | 73.45 | 73.48 | 72.87 | 73.35 | ▲ 73.22 | 6,579,738 |
| AVG/Sum | — | — | +0.36% | +0.17% | — | — | — | — | — | 83,937,691 |
Index ETFs
Positive confluence: average DOC% +0.17% from the open and DNC% +0.36% versus the prior close. Four of five gained from the open, led by IWM and DIA; IJH lagged with a decline, while all five rose versus the prior close, led by QQQ. Index volumes were below average.
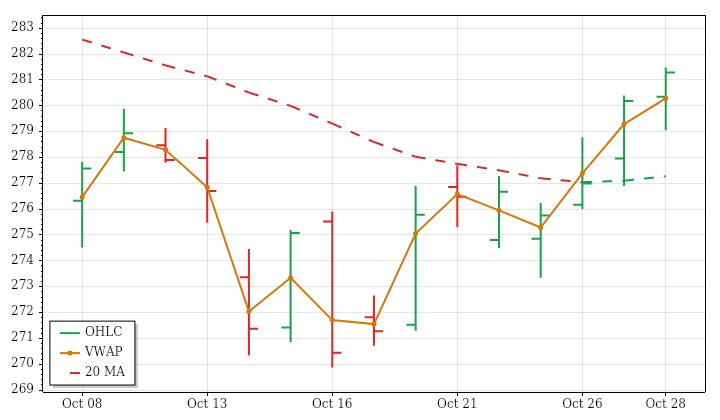
IWM · D:2026-10-28 NC% ▲ +0.40% OC% ▲ +0.34%
IWM – Small Cap Technicals Summary
IWM’s completed daily session on October 28 closed at 281.29, up 0.40% from the prior close and 0.34% from the open. After filling its small opening gap up, price formed a higher high and higher low and finished above the prior day’s high. The close near the session high and above VWAP supported the day’s positive tone.
That improvement did not fully align the trend horizons. Price was above falling near- and intermediate-term averages, leaving both mixed, while the far-term structure remained downward. The preceding 15-session price trend was nearly flat, with very little directional efficiency. Range and volume were below average; the smaller range opposed lookback expansion, while lighter participation matched declining volume. PSAR and the median-based indicator were bullish. A next-session low below 273.4051 would conditionally reverse PSAR downward.
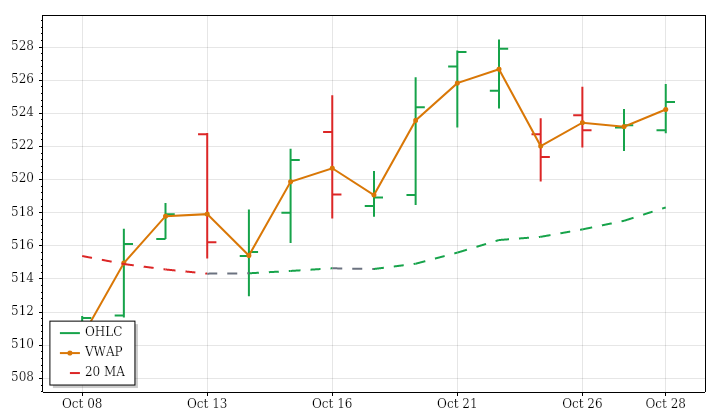
DIA · D:2026-10-28 NC% ▲ +0.27% OC% ▲ +0.33%
DIA – Dow Jones Technicals Summary
DIA’s completed daily session on October 28 closed at 524.68, up 0.27% from the prior close and 0.33% from the open. The opening gap down was filled, and price established a higher high and higher low before finishing above the prior day’s high and session VWAP. Although trading crossed both sides of the open, the closing position favored the session’s upward move.
That advance aligned with the preceding 15-session price uptrend and rising near- and far-term averages. The intermediate structure remained mixed because price was above an average that still sloped slightly downward. Range and volume were both below recent averages, consistent with contracting ranges and declining participation across the lookback. This limited the strength of the day’s expansion beyond the previous high. PSAR remained bearish; a next-session high above 527.2277 would conditionally reverse it.
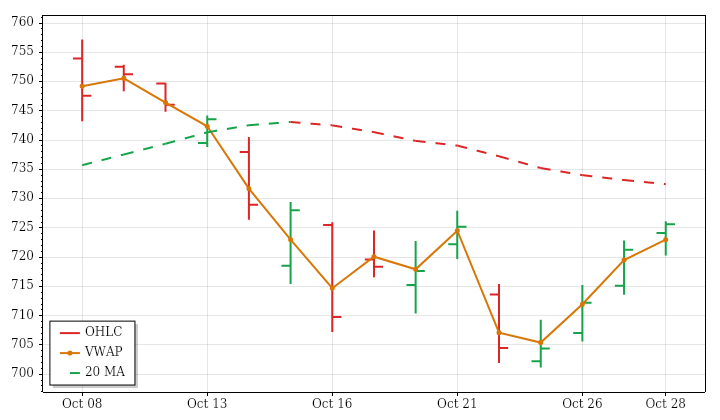
QQQ · D:2026-10-28 NC% ▲ +0.60% OC% ▲ +0.21%
QQQ – Nasdaq 100 Technicals Summary
QQQ’s completed daily session on October 28 closed at 725.61, up 0.60% from the prior close and 0.21% from the open. The opening gap above the previous range was filled before price finished above the prior day’s high, near the session high and above VWAP. The difference between the two returns shows that the opening gap contributed materially to the daily gain.
The rebound contrasted with the preceding 15-session downtrend. Price stood above a falling near-term average but below a slightly rising intermediate average, leaving both horizons mixed; the far-term uptrend remained intact. Daily range and volume were below average, opposing the lookback trends of expanding ranges and increasing participation. PSAR had turned upward while the median-based indicator remained bearish. A next-session low below 702.409 would conditionally reverse PSAR downward.
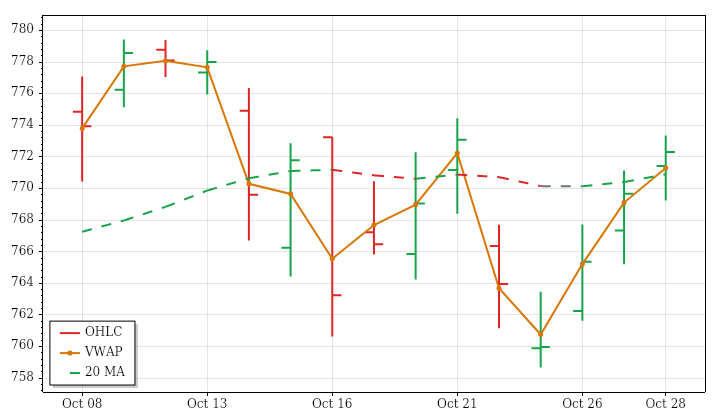
SPY · D:2026-10-28 NC% ▲ +0.34% OC% ▲ +0.11%
SPY – S&P 500 Technicals Summary
SPY’s completed daily session on October 28 closed at 772.31, up 0.34% from the prior close and 0.11% from the open. The opening gap above the previous range was filled, but price subsequently finished above the prior day’s high, near its session high and above VWAP. The modest open-to-close return shows that the opening gap accounted for much of the daily gain.
Price remained above rising intermediate- and far-term averages, while the near-term picture was mixed because its average still declined. This left the advance aligned with the broader upward structure but opposed to the preceding 15-session price decline. Range and volume were below average, unlike the expanding ranges and increasing participation across that lookback. PSAR was in a long state while the median-based indicator stayed bearish. A next-session low below 758.68 would conditionally reverse PSAR.
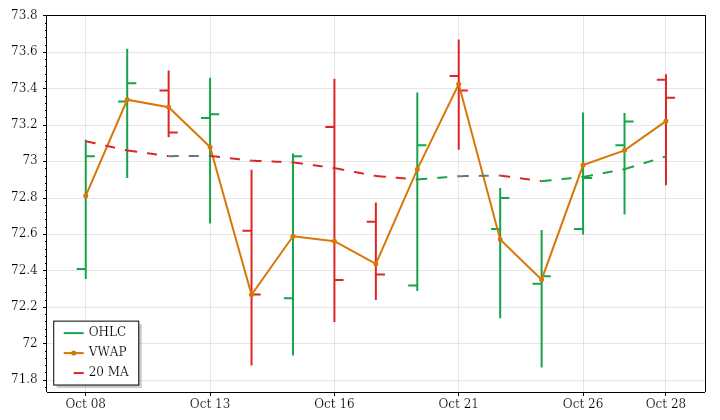
IJH · D:2026-10-28 NC% ▲ +0.18% OC% ▼ -0.14%
IJH – Mid Cap Technicals Summary
IJH’s completed daily session on October 28 closed at 73.35, gaining 0.18% against the prior close despite falling 0.14% from the open. Its opening gap above the previous range was filled, but the session still formed a higher high and higher low and finished above the previous high and VWAP. The close near the session high contrasts with the modest open-to-close loss.
The broader picture remained uneven. Price was above a falling near-term average, below a falling intermediate average, and below a slightly rising far-term average. The preceding 15-session trend was mildly downward with limited directional progress. Range and volume were below average, consistent with contracting ranges and decreasing participation. Against that background, PSAR entered a long state and the median-based indicator crossed bullishly. A next-session low below 71.87 would conditionally reverse PSAR downward.
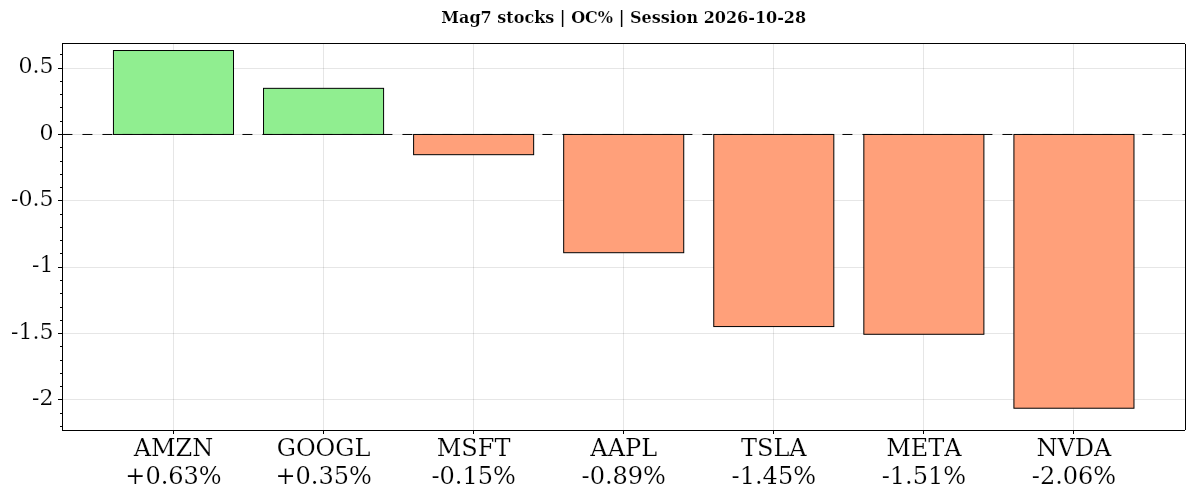
| Instrument | Bias | Date | DNC% | DOC% | O | H | L | C | VWAP | Vol |
|---|---|---|---|---|---|---|---|---|---|---|
| ▲ AMZN | ▲ ▲ ▲ | 2026-10-28 | ▲ +0.59% | ▲ +0.63% | 253.00 | 255.36 | 251.98 | 254.60 | ▲ 253.69 | 33,492,996 |
| ▲ GOOGL | ▲ ▲ ▲ | 2026-10-28 | ▲ +1.34% | ▲ +0.35% | 323.76 | 326.40 | 322.65 | 324.89 | ▲ 324.50 | 49,928,713 |
| ▼ MSFT | ▼ ▼ ▲ | 2026-10-28 | ▼ -0.06% | ▼ -0.15% | 531.82 | 535.00 | 526.13 | 531.01 | ▲ 529.55 | 24,192,445 |
| ▼ AAPL | ▼ ▼ ▼ | 2026-10-28 | ▼ -0.94% | ▼ -0.89% | 346.92 | 347.18 | 343.52 | 343.83 | ▼ 344.61 | 34,348,858 |
| ▼ TSLA | ▼ ▼ ▲ | 2026-10-28 | ▼ -0.80% | ▼ -1.45% | 410.15 | 410.85 | 397.18 | 404.22 | ▲ 402.22 | 35,206,848 |
| ▼ META | ▼ ▼ ▼ | 2026-10-28 | ▼ -1.24% | ▼ -1.51% | 621.85 | 624.42 | 609.00 | 612.49 | ▼ 613.98 | 34,463,595 |
| ▼ NVDA | ▼ ▼ ▼ | 2026-10-28 | ▼ -1.17% | ▼ -2.06% | 219.91 | 219.99 | 214.47 | 215.38 | ▼ 216.61 | 90,447,100 |
| AVG/Sum | — | — | -0.33% | -0.73% | — | — | — | — | — | 302,080,555 |
Mag7 Stocks
Negative confluence: average DOC% -0.73% from the open and DNC% -0.33% versus the prior close. Only AMZN and GOOGL advanced on both comparisons; AMZN led from the open, while GOOGL led versus the prior close despite falling moving-average structures. NVDA lagged from the open and META versus the prior close; MSFT and TSLA declined but closed above VWAP.
AMZN · D:2026-10-28 NC% ▲ +0.59% OC% ▲ +0.63%
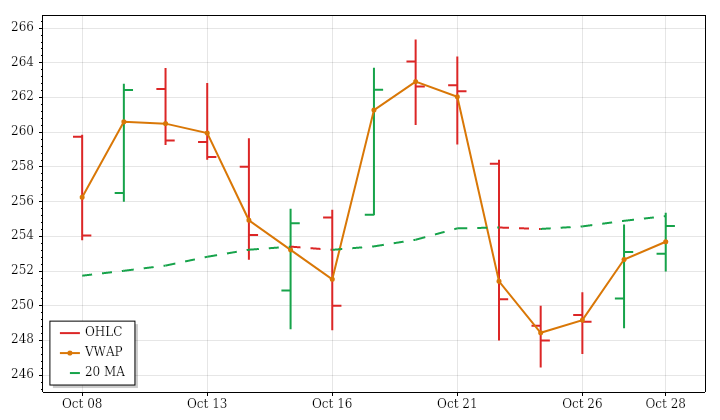
AMZN – Amazon Technicals Summary
AMZN’s completed daily session on October 28 ended at 254.60, gaining 0.59% from the prior close and 0.63% from the open. After filling a small opening gap down, price formed a higher high and higher low and finished near the session high, above VWAP. Nevertheless, the close remained inside the previous day’s range, keeping the advance within a contained trading structure.
The gain contrasted with the preceding 15-session downtrend, whose very low directional efficiency indicated little sustained net progress. Near-term positioning improved above a slightly falling average, while price remained just below a rising intermediate average. The far-term structure stayed upward. Range and volume were below recent averages: range contraction continued, but lighter participation opposed the increasing volume trend. A high above 259.5326 next session would conditionally reverse bearish PSAR.
Amazon News and Fundamentals
Amazon unveiled five Alexa-powered devices on October 28, including a redesigned Echo Show 16, the Alexa Photo Frame and the Echo Time smart alarm clock. Third-quarter results are due October 29 after market close, with AWS growth and AI spending in focus. AWS has a reported $496 billion backlog, while rising capital expenditures pose risks to margins and free cash flow. Amazon is also deploying hundreds of Hercules robots to bring inventory pods to warehouse employees.
GOOGL · D:2026-10-28 NC% ▲ +1.34% OC% ▲ +0.35%
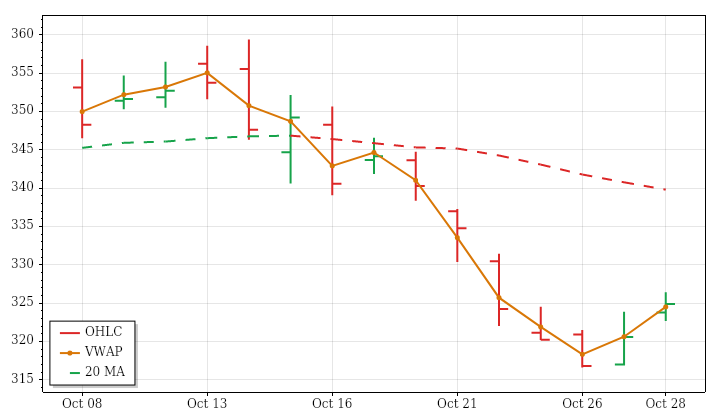
GOOGL – Alphabet Technicals Summary
GOOGL’s completed daily session on October 28 closed at 324.89, up 1.34% from the prior close but only 0.35% from the open. Much of the gain therefore came through the opening gap up, which remained unfilled. Price formed a higher high and higher low, ending above the prior day’s high, near the session high and slightly above VWAP.
Despite that improvement, near-, intermediate- and far-term averages all remained falling above price. The advance thus opposed the preceding 15-session downtrend rather than resolving it. Volume exceeded twice its recent average, while the daily range was less than half its average, showing unusually heavy participation within limited price movement. This combined continued lookback range contraction with increasing volume. PSAR and the median-based indicator remained bearish; a next-session high above 328.6827 would conditionally reverse PSAR.
MSFT · D:2026-10-28 NC% ▼ -0.06% OC% ▼ -0.15%
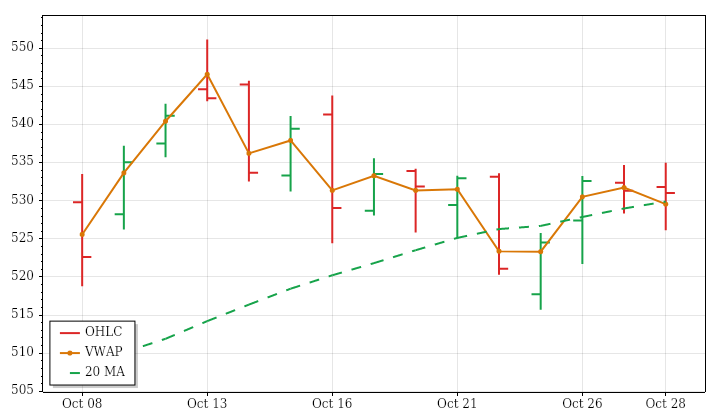
MSFT – Microsoft Technicals Summary
MSFT’s completed daily session on October 28 ended at 531.01, down 0.06% from the prior close and 0.15% from the open. The small opening gap up was filled, and an outside bar showed trading beyond both ends of the previous range. Yet the close remained inside that range, near the open and above VWAP, making the outcome more balanced than the wider bar structure alone suggests.
Near-, intermediate- and far-term averages remained rising beneath price, despite the slight daily loss. The preceding 15-session price trend was mildly downward with exceptionally little directional progress, contrasting with that aligned moving-average structure. Range was below average and consistent with contraction, whereas above-average volume opposed the declining lookback volume trend. PSAR was newly bullish while the median-based indicator remained bearish. A next-session low below 516.665 would conditionally reverse PSAR.
Microsoft News and Fundamentals
Microsoft is scheduled to report fiscal first-quarter earnings after the close on October 28, with Azure growth and returns on substantial AI investment in focus. The company plans to disclose quarterly Azure revenue in dollars for the first time. Microsoft announced job cuts during the quarter as it sought to maintain free cash flow while expanding its AI business.
AAPL · D:2026-10-28 NC% ▼ -0.94% OC% ▼ -0.89%
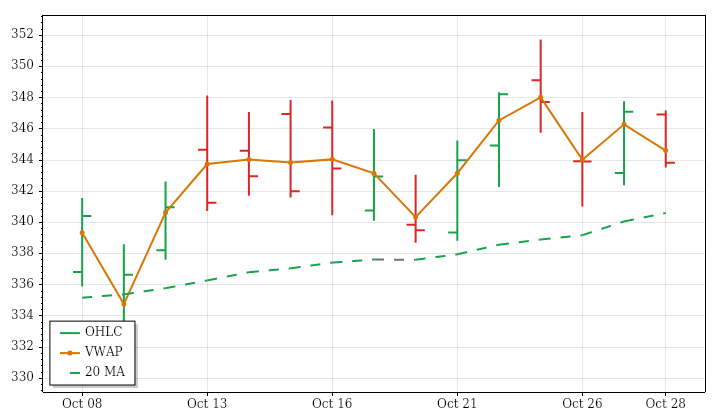
AAPL – Apple Technicals Summary
AAPL’s completed daily session on October 28 closed at 343.83, down 0.94% from the prior close and 0.89% from the open. The small opening gap down was filled, but the session finished near its low and below VWAP. An inside bar and a close within the previous day’s range frame the decline as contained weakness rather than a broader range expansion.
The setback left price below a rising near-term average, creating a mixed short-term picture, while intermediate- and far-term uptrends remained intact. The preceding 15-session price trend was also rising. Daily range and volume were below their recent averages; the smaller range matched the lookback contraction, whereas lighter volume contrasted with its increasing trend. PSAR remained bearish; a next-session high above 350.6868 would conditionally trigger a bullish reversal.
Apple News and Fundamentals
Apple unveiled its first touchscreen MacBook Pro on October 28, reversing its longstanding stance against touchscreen laptops. The 14-inch model starts at $2,899. The launch follows September’s folding iPhone Duo and a smart-home hub introduced earlier in October. Apple faces falling global PC shipments, rising memory costs and higher computer prices. Earnings are due next week, when John Ternus is set to conduct his first earnings call as CEO.
TSLA · D:2026-10-28 NC% ▼ -0.80% OC% ▼ -1.45%
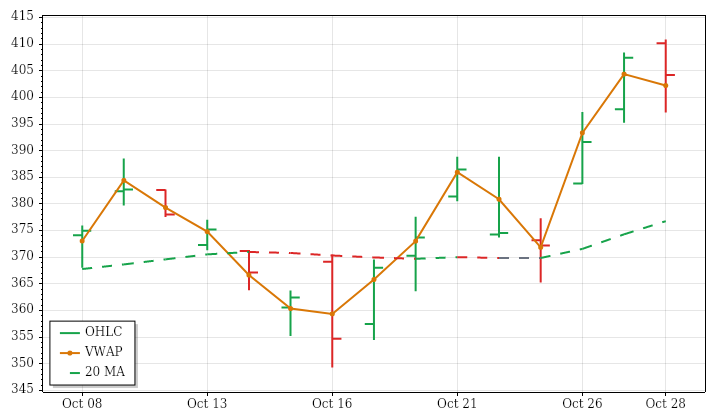
TSLA – Tesla Technicals Summary
TSLA’s completed daily session on October 28 closed at 404.22, down 0.80% from the prior close and 1.45% from the open. The opening gap above the previous range was filled, but the day still produced a higher high and higher low. Its close remained inside the prior range and above VWAP, tempering the weakness implied by the open-to-close decline.
Near- and intermediate-term averages continued rising beneath price, aligning with the preceding 15-session uptrend. The far-term picture was mixed because price remained above an average that still declined. Range was about 125% of average, continuing the expanding lookback pattern and a sequence of large-range sessions. Volume was slightly below average, however, contrasting with its increasing trend. Both technical states remained bullish. A next-session low below 375.4962 would conditionally trigger a bearish PSAR reversal.
Tesla News and Fundamentals
Tesla’s third-quarter earnings call highlighted rising Full Self-Driving adoption, Robotaxi expansion, Optimus commercialization and a $20 billion capital-spending plan for 2026. Quarterly capital expenditures totaled $4.73 billion, below analysts’ roughly $7.77 billion expectation, helping free cash flow turn positive. Operating income nevertheless fell 56% to $718 million. AI, robotaxis and Optimus remain major investment priorities.
META · D:2026-10-28 NC% ▼ -1.24% OC% ▼ -1.51%
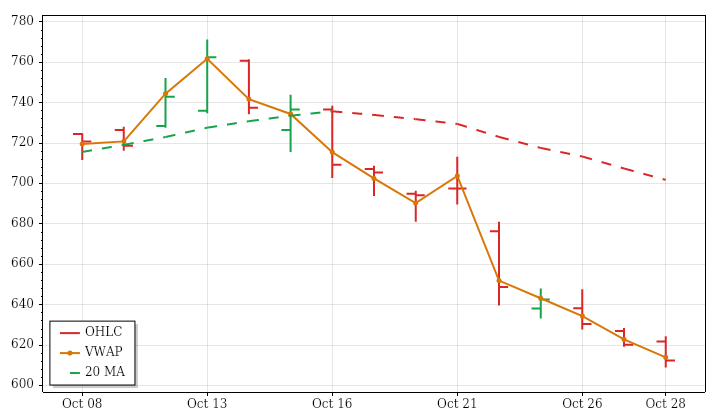
META – Meta Platforms Technicals Summary
META’s completed daily session on October 28 closed at 612.49, down 1.24% from the prior close and 1.51% from the open. The opening gap up was filled and lost, with a lower high and lower low followed by a close below the previous day’s low. Finishing near the session low and below VWAP reinforced the day’s negative direction.
The decline aligned with the preceding 15-session downtrend and falling near-term average. Intermediate- and far-term structures remained mixed: their averages still rose, but price stood below both. Range was below average, continuing the lookback contraction, while volume reached about 150% of average and matched the increasing participation trend. Thus, heavier activity accompanied further weakness without an unusually wide daily range. Both technical states remained bearish; a next-session high above 665.4943 would conditionally reverse PSAR upward.
Meta News and Fundamentals
Meta reported quarterly capital expenditures of $34.9 billion and negative free cash flow of $2.1 billion, while share buybacks were paused. The company also launched Waddle World, an AI-powered virtual-pet app resembling Tamagotchi, as part of its ongoing experiments with AI applications. Meta is in the early stages of developing its own consumer-electronics business.
NVDA · D:2026-10-28 NC% ▼ -1.17% OC% ▼ -2.06%
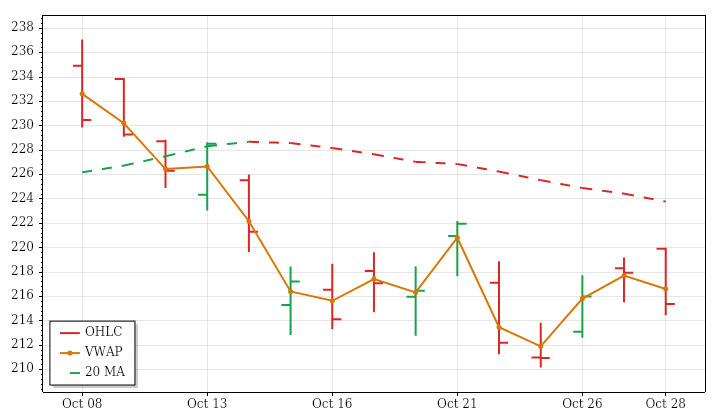
NVDA – Nvidia Technicals Summary
NVDA’s completed daily session on October 28 closed at 215.38, losing 1.17% from the prior close and 2.06% from the open. An opening gap above the previous range was filled, and the session became an outside bar that finished below the prior day’s low. The close near the session low and below VWAP marked a clear reversal of the opening strength.
The weakness aligned with the preceding 15-session decline and intermediate downtrend. Near-term positioning remained mixed because price was barely above a sharply falling average, while the far-term average still rose beneath price. Range was modestly above average, contrary to the lookback contraction, but volume remained below average alongside its declining trend. PSAR was in a long state despite the bearish median-based indicator. A next-session low below 210.18 would conditionally trigger a bearish PSAR reversal.
Nvidia News and Fundamentals
Nvidia released Nemotron 3.5 Transcribe on October 28, a free, open-weight model capable of transcribing audio in up to 40 languages. The company also released version 2 of Granary, its open-source speech dataset.
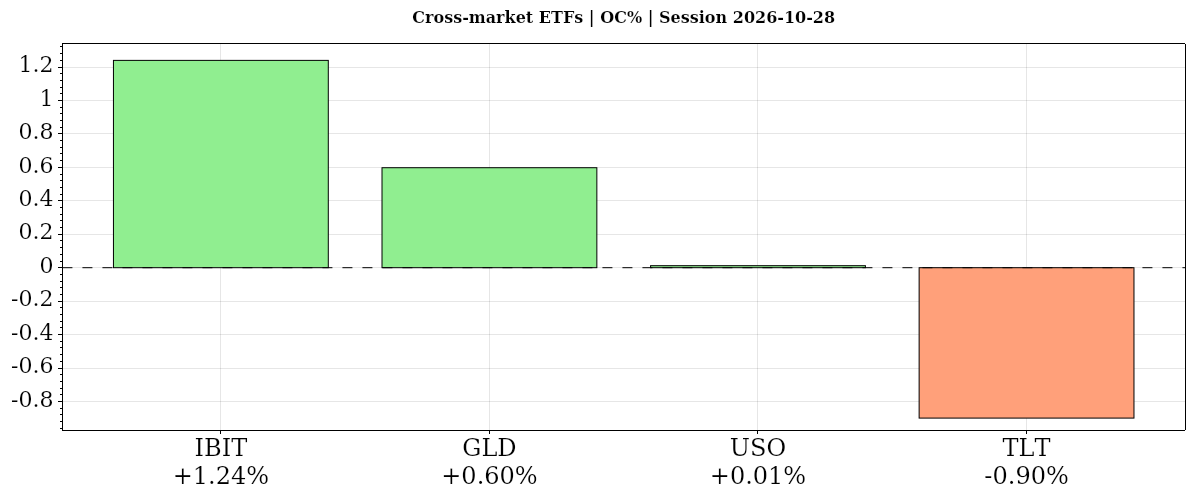
| Instrument | Bias | Date | DNC% | DOC% | O | H | L | C | VWAP | Vol |
|---|---|---|---|---|---|---|---|---|---|---|
| ▲ IBIT | ▲ ▲ ▲ | 2026-10-28 | ▲ +0.96% | ▲ +1.24% | 45.58 | 46.14 | 45.43 | 46.14 | ▲ 45.75 | 19,841,541 |
| ▲ GLD | ▲ ▲ ▲ | 2026-10-28 | ▲ +0.33% | ▲ +0.60% | 371.29 | 373.60 | 368.88 | 373.51 | ▲ 371.24 | 8,876,305 |
| ▲ USO | ▲ ▲ ▼ | 2026-10-28 | ▲ +1.64% | ▲ +0.01% | 166.55 | 169.40 | 166.34 | 166.57 | ▼ 167.96 | 5,341,147 |
| ▼ TLT | ▼ ▼ ▼ | 2026-10-28 | ▼ -0.78% | ▼ -0.90% | 81.72 | 81.76 | 80.73 | 80.99 | ▼ 81.17 | 35,166,586 |
| AVG/Sum | — | — | +0.54% | +0.24% | — | — | — | — | — | 69,225,579 |
Cross-Market ETFs
Positive confluence: average DOC% +0.24% from the open and DNC% +0.54% versus the prior close. Bitcoin led from the open; oil was nearly flat but strongest versus the prior close, reflecting its opening gap. Gold advanced despite longer-term downtrends, while bonds fell against equities’ gains.
IBIT · D:2026-10-28 NC% ▲ +0.96% OC% ▲ +1.24%
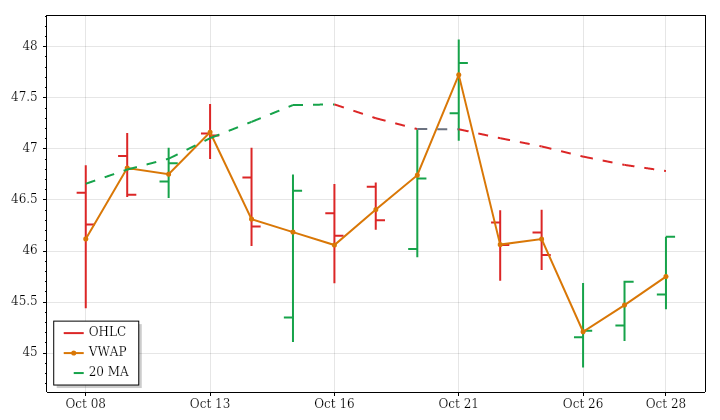
IBIT – Bitcoin Technicals Summary
IBIT’s completed daily session on October 28 ended at 46.14, up 0.96% from the prior close and 1.24% from the open. Price recovered the opening gap down, established a higher high and higher low, and closed above the previous day’s high. A finish near the session high and above VWAP gave the completed day a firmer tone than the recent declining price trend.
The close stood just above both near- and intermediate-term averages. However, the near-term average was still falling, leaving that horizon mixed, while intermediate- and far-term structures remained upward. The session’s below-average range and volume matched the preceding 15 sessions’ contraction and declining participation. Volume was only about 55% of average, limiting participation behind the rebound. Bearish indicator states persisted; a next-session high above 47.757 would conditionally reverse PSAR upward.
GLD · D:2026-10-28 NC% ▲ +0.33% OC% ▲ +0.60%
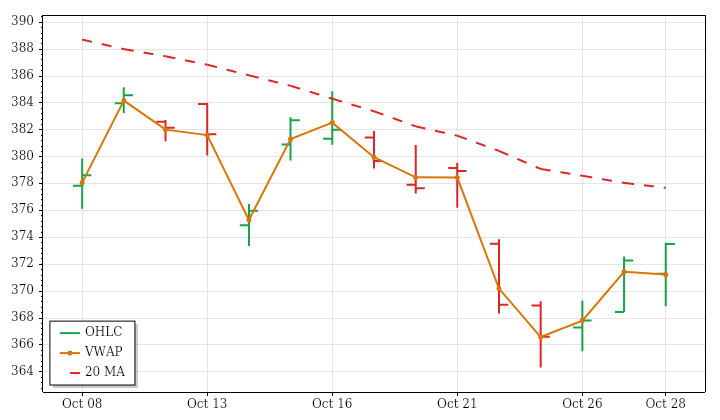
GLD – Gold Technicals Summary
GLD’s completed daily session on October 28 closed at 373.51, rising 0.33% from the prior close and 0.60% from the open. It recovered its opening gap down, formed a higher high and higher low, and finished above the previous day’s high, near the session high and above VWAP. The larger open-to-close gain reflects the recovery from an opening discount.
This was a daily advance against a falling broader structure, not an established trend reversal. Price moved above its declining near-term average, leaving that horizon mixed, while intermediate- and far-term averages remained falling overhead. Range reached about 132% of its recent average, with above-average volume; both matched expanding ranges and increasing participation over the preceding 15 sessions. Bearish technical states persisted. A next-session high above 378.5619 would conditionally trigger a bullish PSAR reversal.
Gold News and Fundamentals
The Federal Reserve voted 10–2 on October 28 to hold its policy-rate target at 3.75%–4%, as expected. Separately, the Bank of Canada raised its overnight rate by 25 basis points to 2.50%, also matching expectations, with its bank rate increasing to 2.75% and deposit rate to 2.45%.
USO · D:2026-10-28 NC% ▲ +1.64% OC% ▲ +0.01%
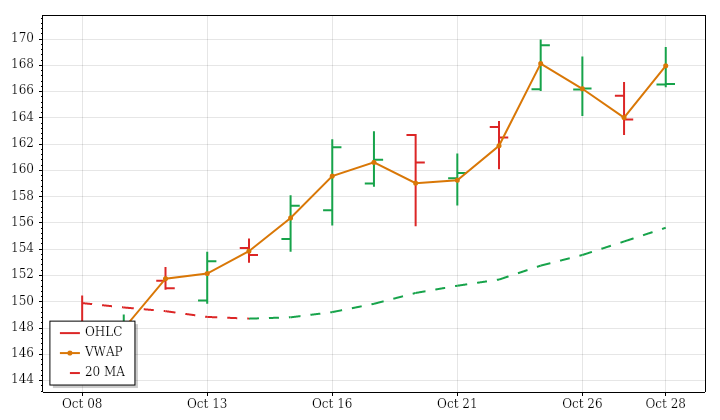
USO – Oil Technicals Summary
USO’s completed daily session on October 28 closed at 166.57, up 1.64% from the prior close but only 0.01% from the open. Almost all the gain came through an opening gap up that remained unfilled. Although price formed a higher high and higher low, it closed inside the prior day’s range, near its session low and below VWAP, showing weaker intraday positioning than the headline return suggests.
Near-, intermediate- and far-term uptrends remained aligned, consistent with the preceding 15-session advance. The session therefore preserved the broader rising structure without adding meaningful open-to-close progress. Range was below average, opposing the lookback expansion, while above-average volume matched increasing participation. PSAR and the median-based indicator remained bullish. A next-session low below 162.69 would conditionally trigger a bearish PSAR reversal rather than represent an already confirmed change.
Oil News and Fundamentals
U.S. commercial crude inventories fell 1.9 million barrels last week, their fourth consecutive weekly decline, the EIA reported October 28. Distillate inventories also declined, while gasoline stocks increased. Energy Secretary Chris Wright described elevated oil prices as a temporary interruption caused by the war in Iran and said substantial military forces were being used to move ships through the Strait of Hormuz. He declined to predict future oil prices.
TLT · D:2026-10-28 NC% ▼ -0.78% OC% ▼ -0.90%
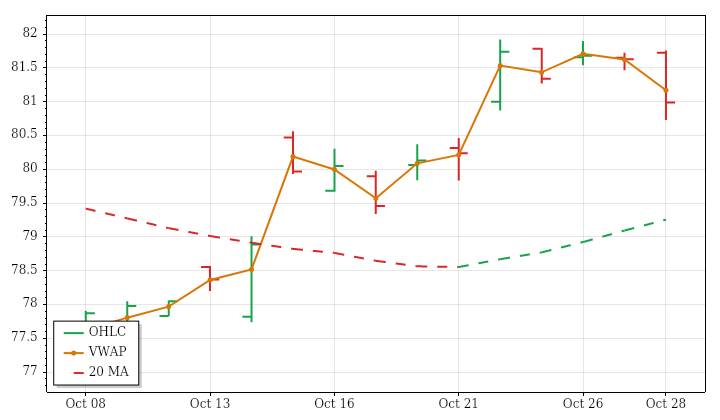
TLT – Long-Term Treasury Bonds Technicals Summary
TLT’s completed daily session on October 28 closed at 80.99, down 0.78% from the prior close and 0.90% from the open. Its opening gap up was filled, and an outside bar ended below the previous day’s low and session VWAP. Range expanded to about 164% of its recent average, sharply contrasting with the preceding 15 sessions’ contracting range trend.
The decline interrupted a comparatively directional lookback advance. It left price below a rising near-term average but above a falling intermediate average, making both horizons mixed. The far-term structure remained downward, so the recent rally had not aligned the broader trend. Volume was below average, consistent with declining lookback participation despite the unusually wide session. PSAR entered a short state while the median-based indicator stayed bullish. A next-session high above 81.92 would conditionally reverse PSAR upward.
Glossary: Instrument — ticker symbol; hover for the instrument or company name; Date — session date. DNC% — prior-session close to this session’s close; DOC% — daily session open-to-close percentage change. O — open; H — high; L — low; C — close, all for the table’s daily or weekly session; VWAP — volume-weighted average price; its arrow shows whether the close is above or below VWAP. Vol — period trading volume.
Bias — three directional readings, in order: DNC%, DOC%, then VWAP. ▲ positive/above; ▼ negative/below; — neutral or unavailable. Matching arrows show alignment; opposing arrows show mixed conditions. AVG/Sum — simple average of percentage changes and sum of reported volumes.
Futures Session Fib Grid Analysis – Snapshot
Session Fib Grids normalise market positioning as percentages, making direction and alignment comparable across different asset types.
Latest available snapshot for each instrument; Time(CT) shows the individual update date and time.
| Instrument | Bias | Time(CT) | YSFG | MSFG | WSFG | RSFG | SFG | TSI |
|---|---|---|---|---|---|---|---|---|
| ▼ ES | ▲ ▲ ▲ ▼ ▼ ▼ | 2026-10-28 17:00:15 | ▲ +60 | ▲ +7 | ▲ +52 | ▼ -16 | ▼ -16 | ▼ -33 |
| ▼ NQ | ▲ ▼ ▲ ▼ ▼ ▼ | 2026-10-28 17:00:21 | ▲ +72 | ▼ -58 | ▲ +49 | ▼ -32 | ▼ -32 | ▼ -98 |
| ▲ YM | ▲ ▲ ▲ ▲ ▲ ▲ | 2026-10-28 17:00:20 | ▲ +33 | ▲ +75 | ▲ +18 | ▲ +50 | ▲ +50 | ▲ +73 |
| ▲ EMD | ▲ ▲ ▲ ▲ ▲ ▲ | 2026-10-28 15:58:32 | ▲ +34 | ▲ +32 | ▲ +37 | ▲ +3 | ▲ +3 | ▲ +23 |
| ▲ RTY | ― ▲ ▲ ▲ ▲ ▲ | 2026-10-28 17:00:12 | — 0 | ▲ +16 | ▲ +56 | ▲ +62 | ▲ +62 | ▲ +193 |
| ▲ FDAX | ▲ ▲ ▲ ▲ ▲ ▲ | 2026-10-28 16:03:25 | ▲ +6 | ▲ +76 | ▲ +69 | ▲ +75 | ▲ +7 | ▲ +26 |
| ▲ NKD | ▲ ▼ ▲ ▲ ▲ ▼ | 2026-10-28 15:59:41 | ▲ +165 | ▼ -66 | ▲ +36 | ▲ +27 | ▲ +20 | ▼ -14 |
| Instrument | Bias | Time(CT) | YSFG | MSFG | WSFG | RSFG | SFG | TSI |
|---|---|---|---|---|---|---|---|---|
| ▲ BTC | ▼ ▼ ▲ ▲ ▲ ▲ | 2026-10-28 16:40:56 | ▼ -35 | ▼ -24 | ▲ +18 | ▲ +13 | ▲ +35 | ▲ +56 |
| ▲ GC | ▼ ▼ ▲ ▲ ▲ ▲ | 2026-10-28 17:00:14 | ▼ -129 | ▼ -35 | ▲ +32 | ▲ +17 | ▲ +27 | ▲ +79 |
| ▲ CL | ▲ ▲ ▲ ▲ ▲ ▼ | 2026-10-28 17:00:12 | ▲ +191 | ▲ +88 | ▲ +14 | ▲ +4 | ▲ +11 | ▼ -23 |
| ▲ 6E | ▼ ▼ ▼ ▲ ▲ ▲ | 2026-10-28 17:00:18 | ▼ -60 | ▼ -94 | ▼ -50 | ▲ +44 | ▲ +49 | ▲ +33 |
| ▼ ZB | ▼ ▲ ▲ ▼ ▼ ▲ | 2026-10-21 09:39:59 | ▼ -39 | ▲ +77 | ▲ +6 | ▼ -3 | ▼ -2 | ▲ +29 |
Glossary: YSFG — yearly; MSFG — monthly; WSFG — weekly; RSFG — regular trading hours (RTH); SFG — the current session, including pre-market or other sessions. TSI indicates trend strength and power.
Bias shows trend alignment across these six readings. The arrows follow the column order: YSFG, MSFG, WSFG, RSFG, SFG and TSI. Matching arrows show alignment; opposing arrows show mixed conditions.
Futures Higher Time Frame Analysis
Summary of the current state of US Indices Futures based on higher time-frame (HTF) technical analysis as of: 2026-10-28 16:00 -04:00 CT.
US Indices Futures
- ES YSFG/MSFG/WSFG above F0%, daily short-term benchmarks overhead, weekly pivots UTrend, daily DTrend, support 7648.50–7695.00, resistance 7897.50–7906.25.
- NQ YSFG/WSFG upward, MSFG below F0%, rising 5/10-day benchmarks, declining 20/55-day benchmarks, pivots DTrend, support 28987.00, reversal thresholds 30102.50 daily/31113.00 weekly, resistance 31616.50.
- YM YSFG/MSFG above F0%, WSFG below F0%, short-term benchmarks overhead, pivots DTrend, support 50859/51970, resistance 53168–53199, higher resistance 54259–54294.
- EMD YSFG/MSFG/WSFG above F0%, daily 5/10-day benchmarks below price, 100/200-day benchmarks overhead, pivots DTrend, support 3600.3, resistance 3704.5–3737.8/3791.9.
- RTY YSFG/WSFG upward, MSFG below F0%, rising 5/10/20-day benchmarks, longer daily benchmarks overhead, daily pivots UTrend versus weekly DTrend, support 2723.3–2741.7, resistance 2831.7/2887.2–2888.9.
- FDAX YSFG/MSFG/WSFG above F0%, all benchmarks rising below price, daily pivots UTrend versus weekly DTrend, support 24925–25119, resistance 25759–25890, weekly reversal threshold 26255.
Overall State
- Short-Term: Neutral
- Intermediate-Term: Neutral
- Long-Term: Bullish
Conclusion
YSFG positioning and rising longer-term weekly benchmarks retain broad upward alignment. FDAX shows the strongest daily alignment across grids, benchmarks, and pivots; ES retains bullish intermediate structure despite daily consolidation. NQ and RTY rebounds remain divergent from their weaker MSFG and intermediate structures, while YM retains short-term downward alignment. EMD shows the clearest timeframe divergence, with bullish weekly structure but price beneath declining 100-day and 200-day benchmarks. Recent EMD weekly long-signal alignment and the RTY long-term signal coexist with corrective weekly pivots. Nearby resistance and pivot-reversal thresholds continue to distinguish daily recoveries from confirmed weekly pivot reversals.
Note: Intra-day counter-trend pullbacks or retracements may occur, HTF is context for informational usage and market structure. Glossary: Session Fib Grids periods of YSFG:’Yearly’, MSFG:’Monthly’, WSFG:’Weekly’
For full details visit: AlphaWebTrader Technicals
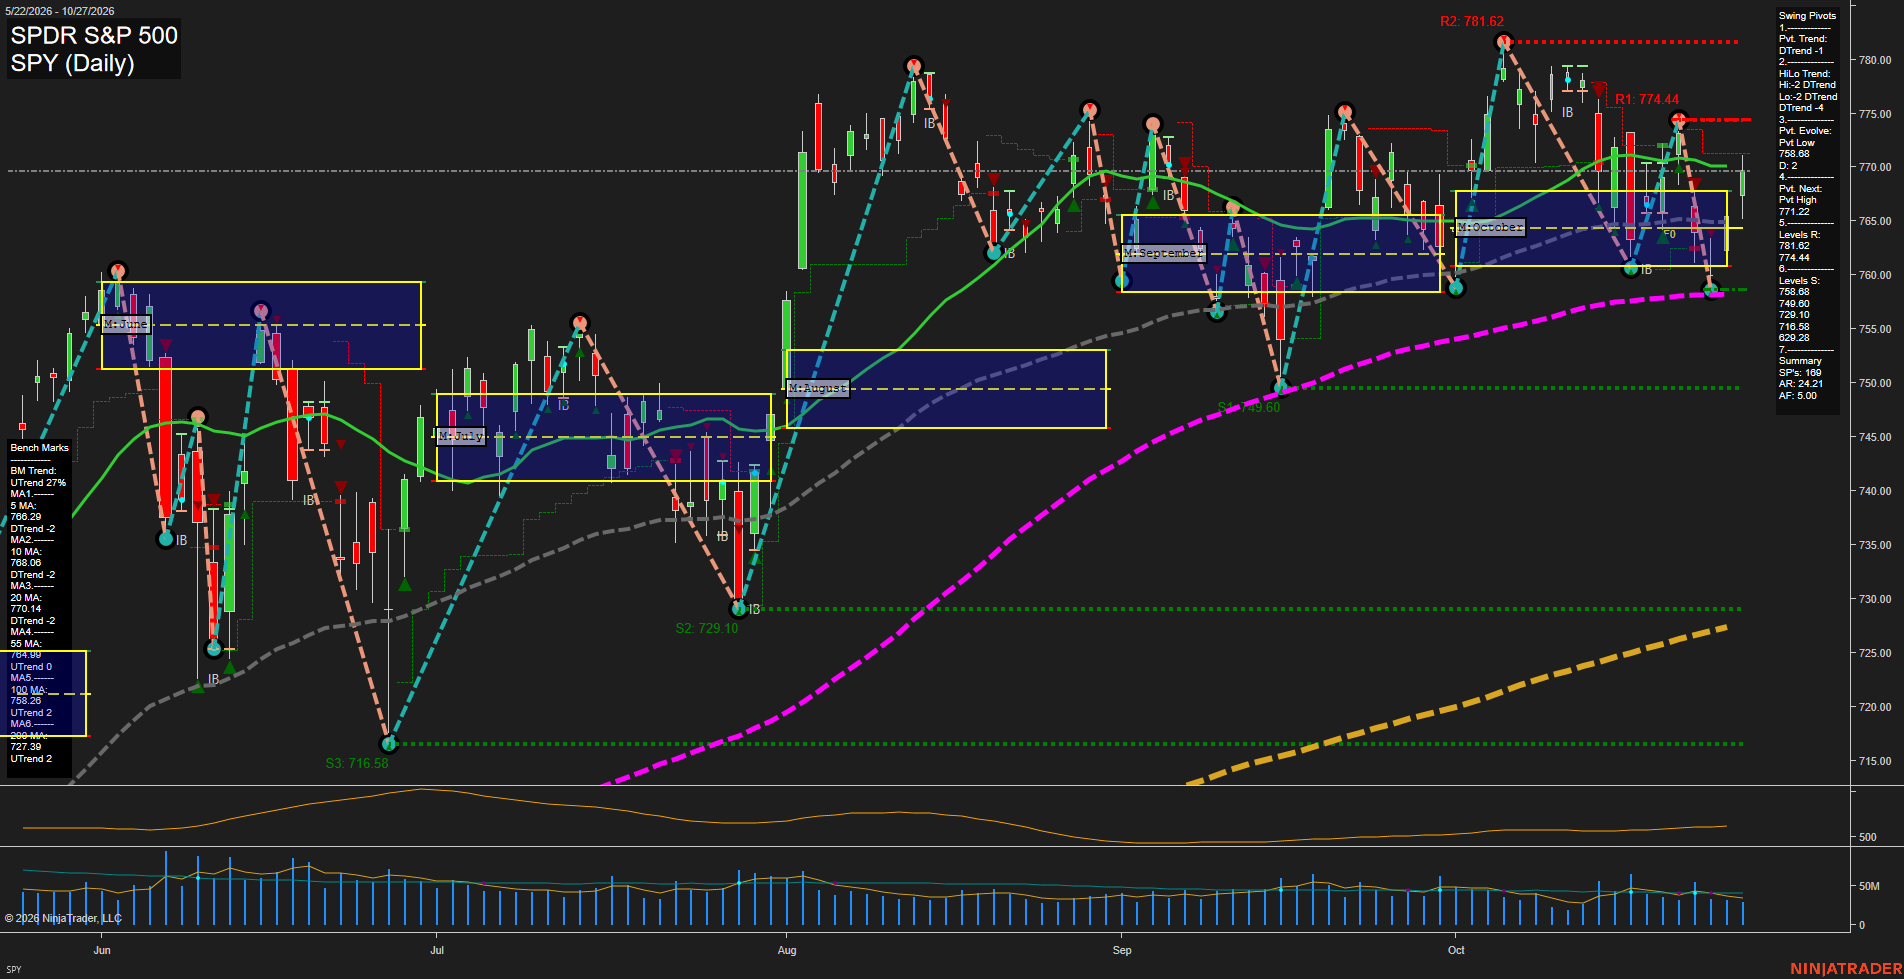
SPY Daily View
Overall Rating
- Short-Term: Neutral
- Intermediate-Term: Neutral
- Long-Term: Bullish.
Key Insights Summary
SPY, as an equity-index futures proxy, is consolidating following a sharp October swing sequence. Price recovered from the 758.68 pivot low and is holding above the rising 55-day, 100-day, and 200-day benchmarks, preserving the broader bullish structure. Short-term pivot and HiLo trends remain down, however, with price clustered around the declining 10-day and 20-day averages. The 771.22 to 774.44 area defines the nearby overhead pivot band, while 758.68 is the principal swing support; the wide 24.21 ATR reflects an elevated daily rotation environment rather than a low-volatility trend advance.
View charts on: AlphaWebTrader HTF Charts
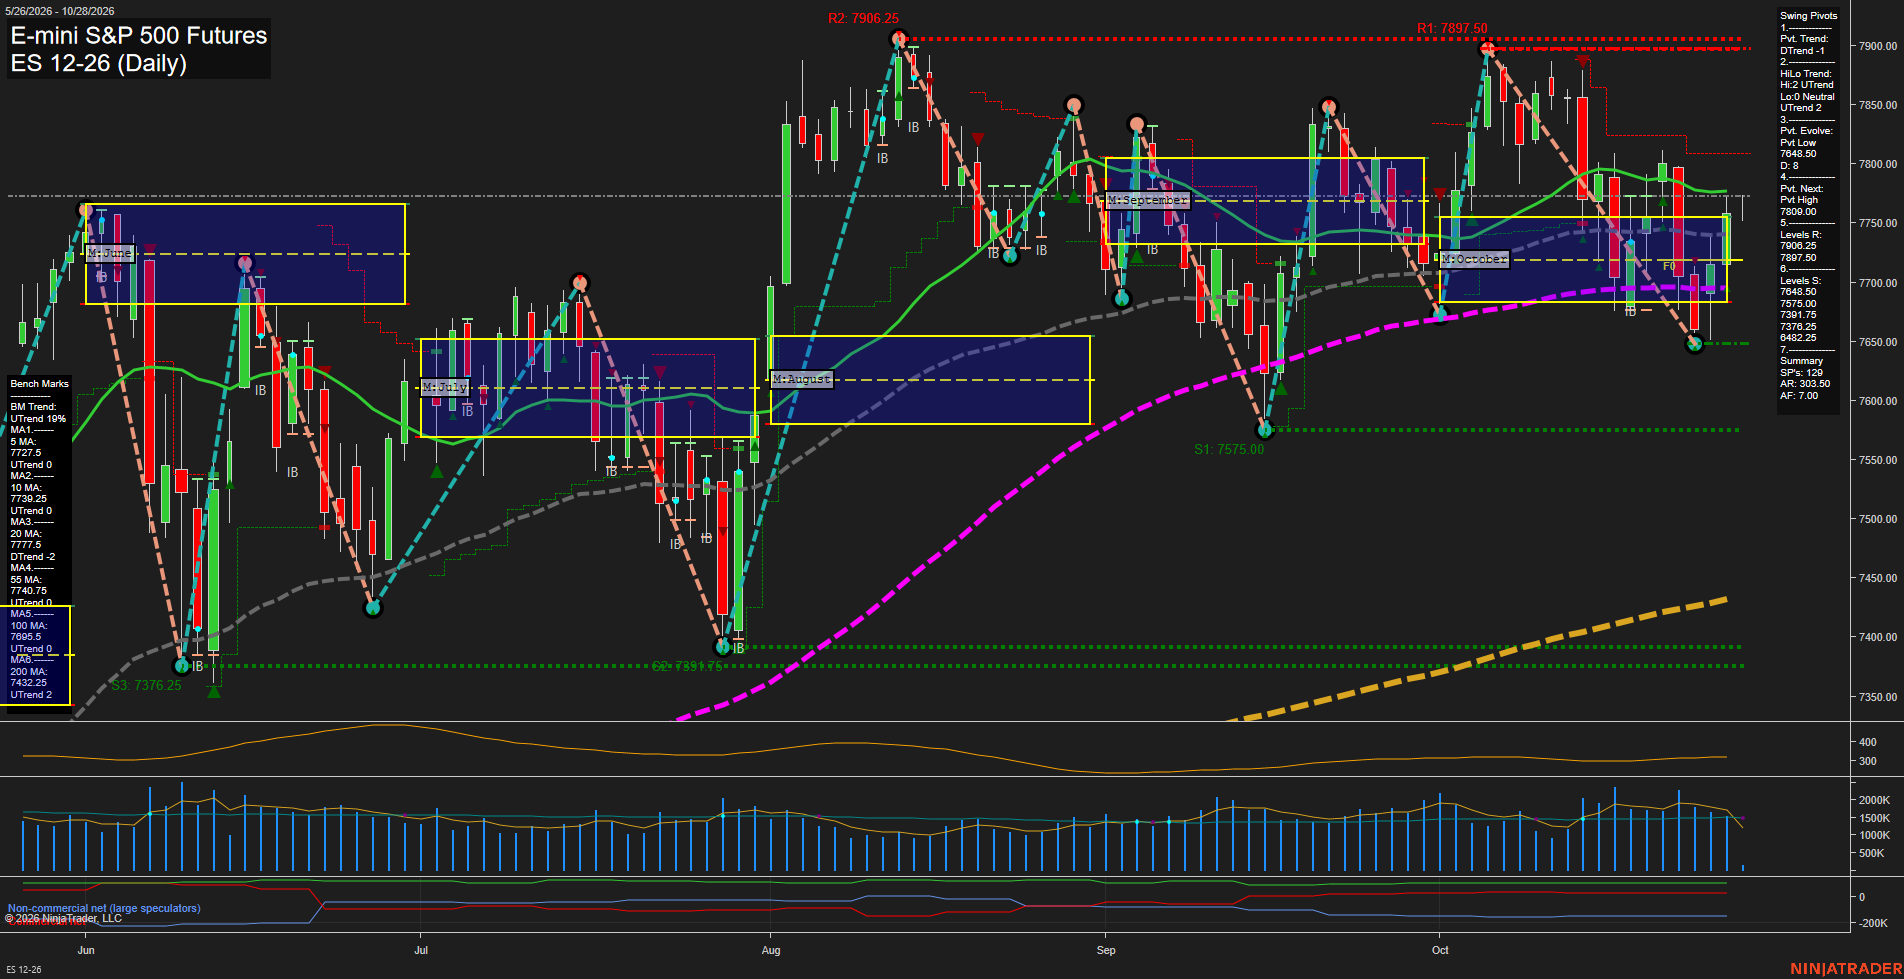
ES Daily View
Overall Rating
- Short-Term: Neutral
- Intermediate-Term: Bullish
- Long-Term: Bullish.
Key Insights Summary
The daily structure is consolidative after the October rejection beneath the 7897.50-7906.25 resistance band. Short-term pivots remain in a DTrend and price is below the 5, 10, 20, and 55 day benchmark area, reflecting a slow pullback rather than impulsive downside momentum. The intermediate HiLo trend, monthly grid, and longer benchmark alignment remain constructive, with 7648.50 defining the key recent higher-low pivot and 7695.00 providing nearby long-term moving-average support. Volatility remains elevated on the ATR measure, while recent smaller bars indicate compression following the sharp October swings.
View charts on: AlphaWebTrader HTF Charts
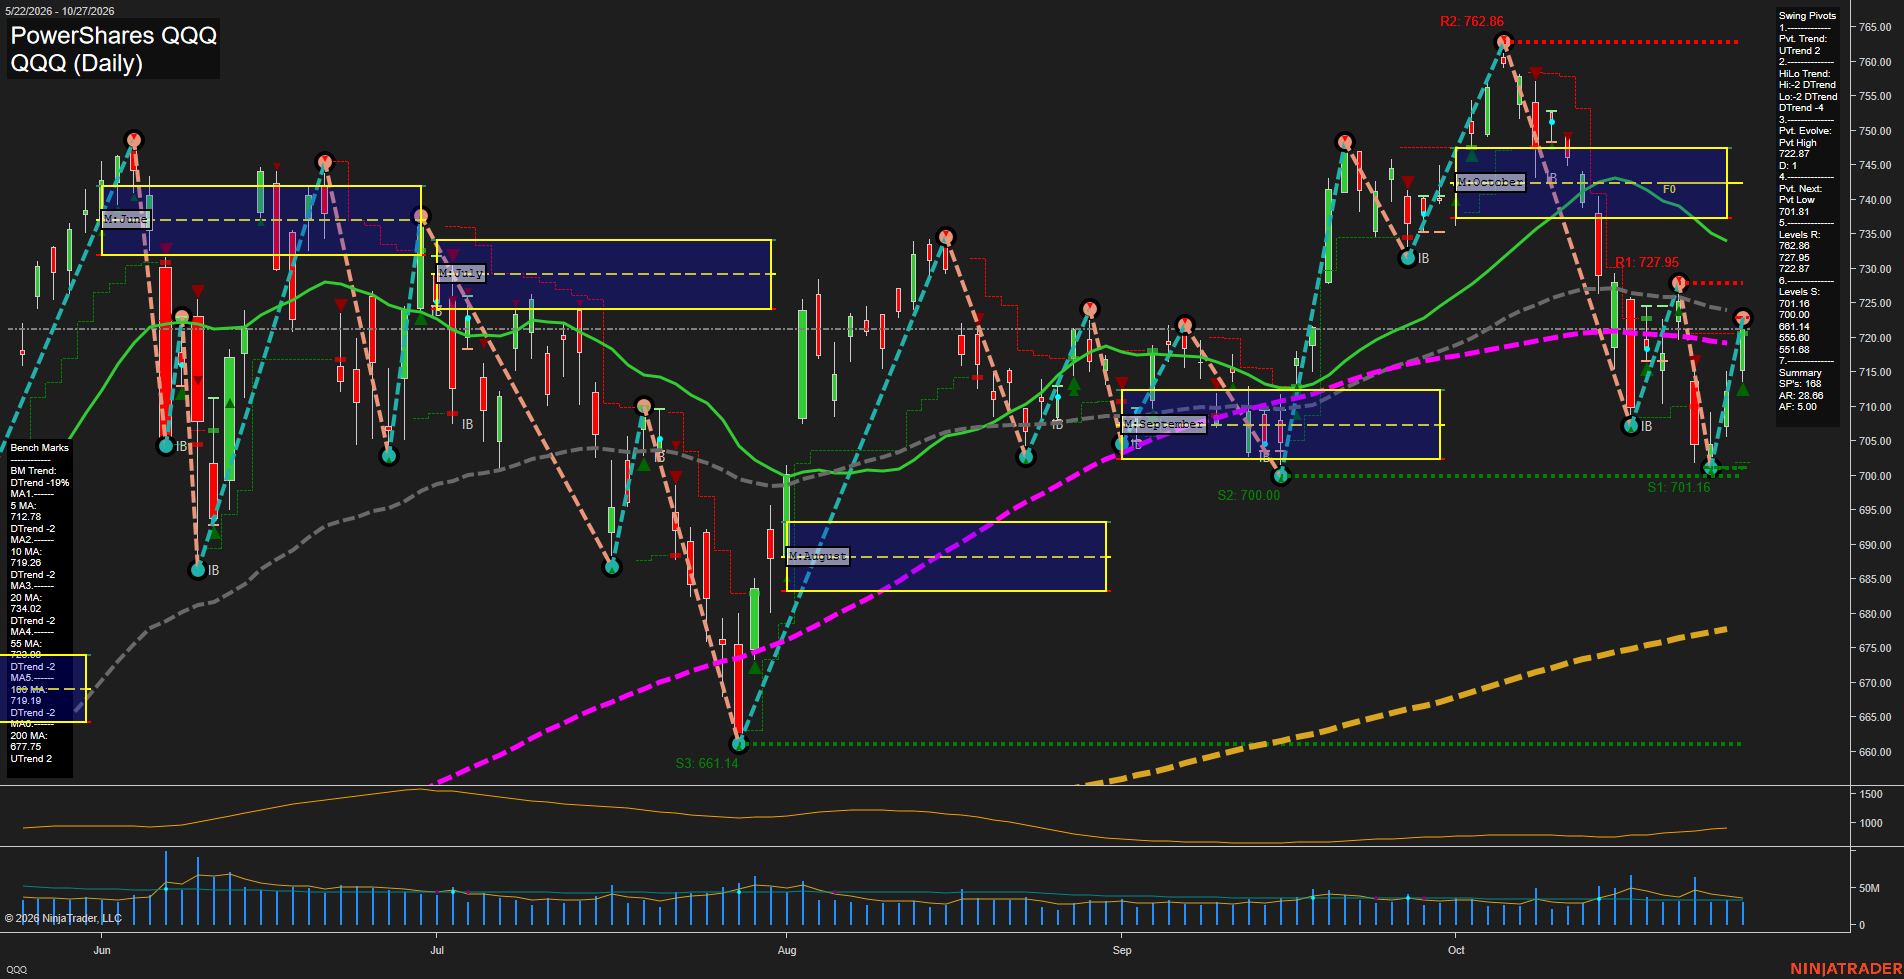
QQQ Daily View
Overall Rating
- Short-Term: Neutral
- Intermediate-Term: Bearish
- Long-Term: Neutral.
Key Insights Summary
QQQ is showing a sharp rebound from the 700.00-701.16 support cluster, producing a short-term pivot uptrend and recovering above the declining 5-day average. From a futures swing perspective, the rebound remains countertrend within a weaker intermediate structure: price is below the October MSFG NTZ and beneath declining 20-day and 55-day benchmarks. The 722.87 pivot-high area and 727.95 resistance define the immediate overhead supply zone, while 701.16-700.00 remains the key downside reference. The longer-term 200-day average remains rising well below price, preserving the broader cyclical uptrend despite the current volatile consolidation and lower intermediate pivot structure.
View charts on: AlphaWebTrader HTF Charts
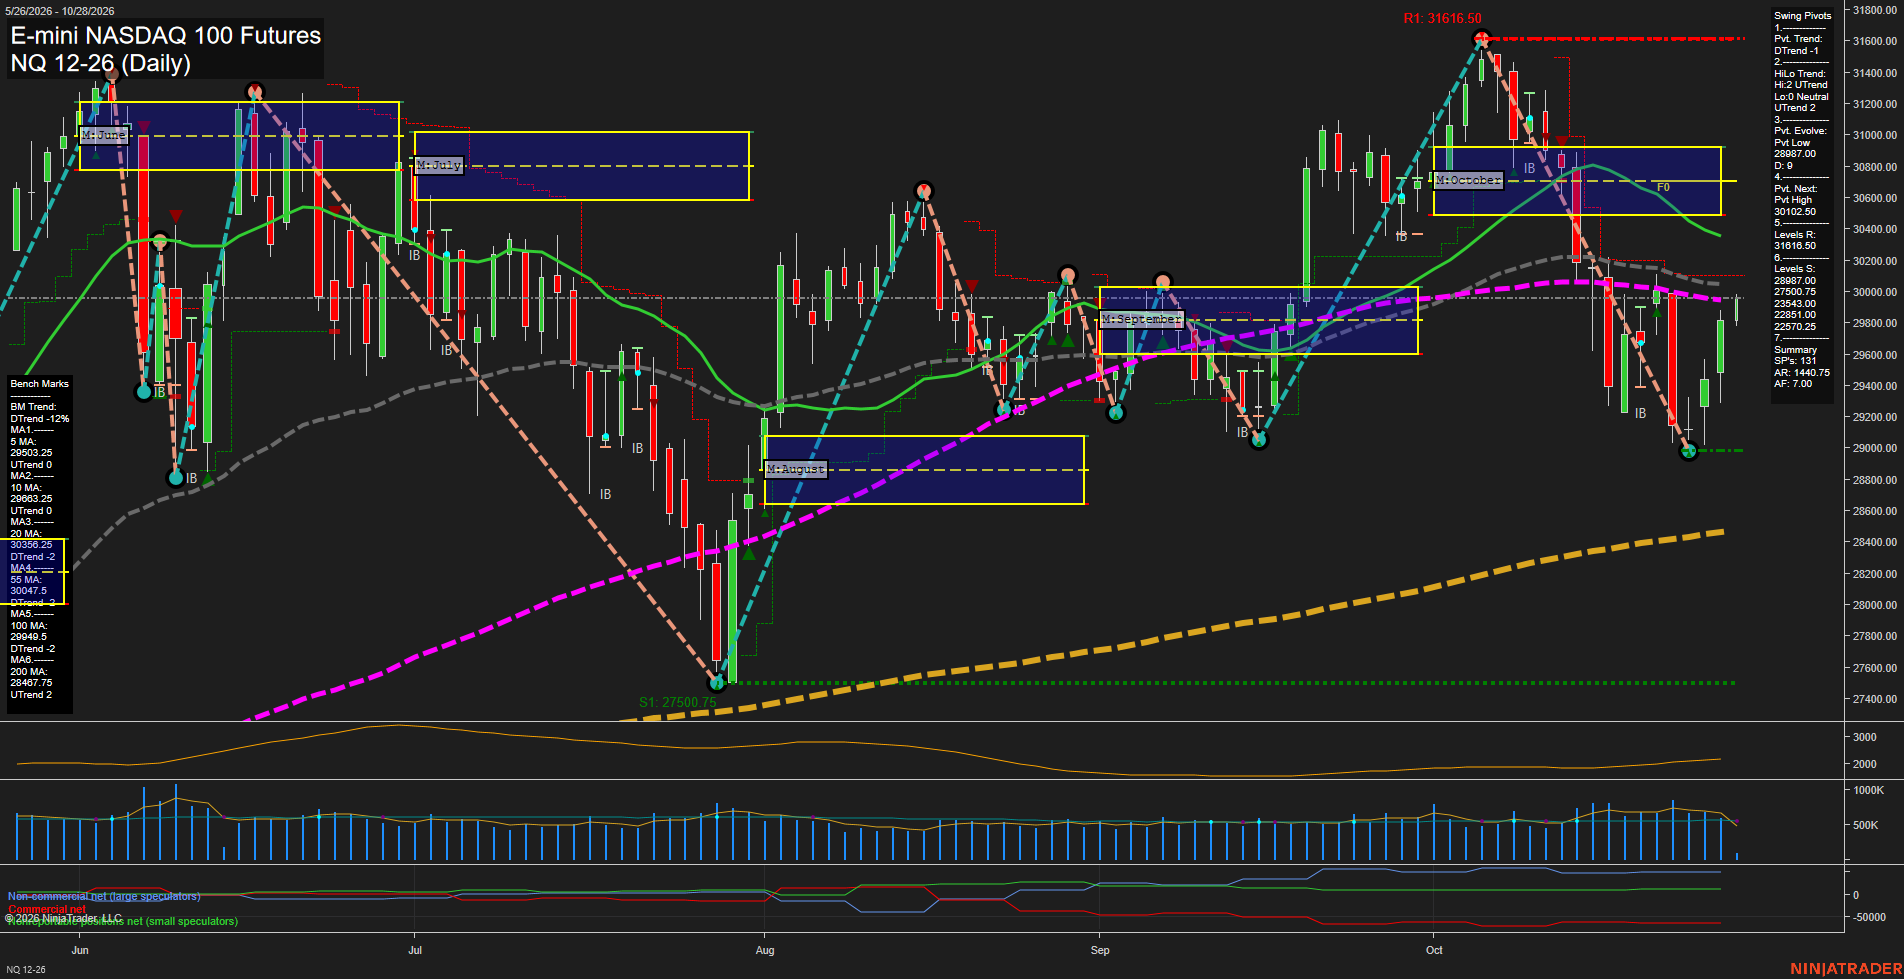
NQ Daily View
Overall Rating
- Short-Term: Bullish
- Intermediate-Term: Bearish
- Long-Term: Bullish.
Key Insights Summary
The daily structure reflects a sharp rebound from the 28987.00 pivot low, with price back above the rising 5-day and 10-day benchmarks and the weekly fib grid retaining an upward bias. The short-term pivot trend remains down until a new pivot high is confirmed above 30102.50, while the 20-day and 55-day averages remain declining and the October monthly grid remains below its F0% level. This leaves the intermediate structure as a countertrend recovery within a monthly downswing. The long-term backdrop remains constructive above the rising 200-day average and within the positive yearly grid, while elevated ATR and recent wide swings indicate an active, volatile daily range.
View charts on: AlphaWebTrader HTF Charts
USO Daily View
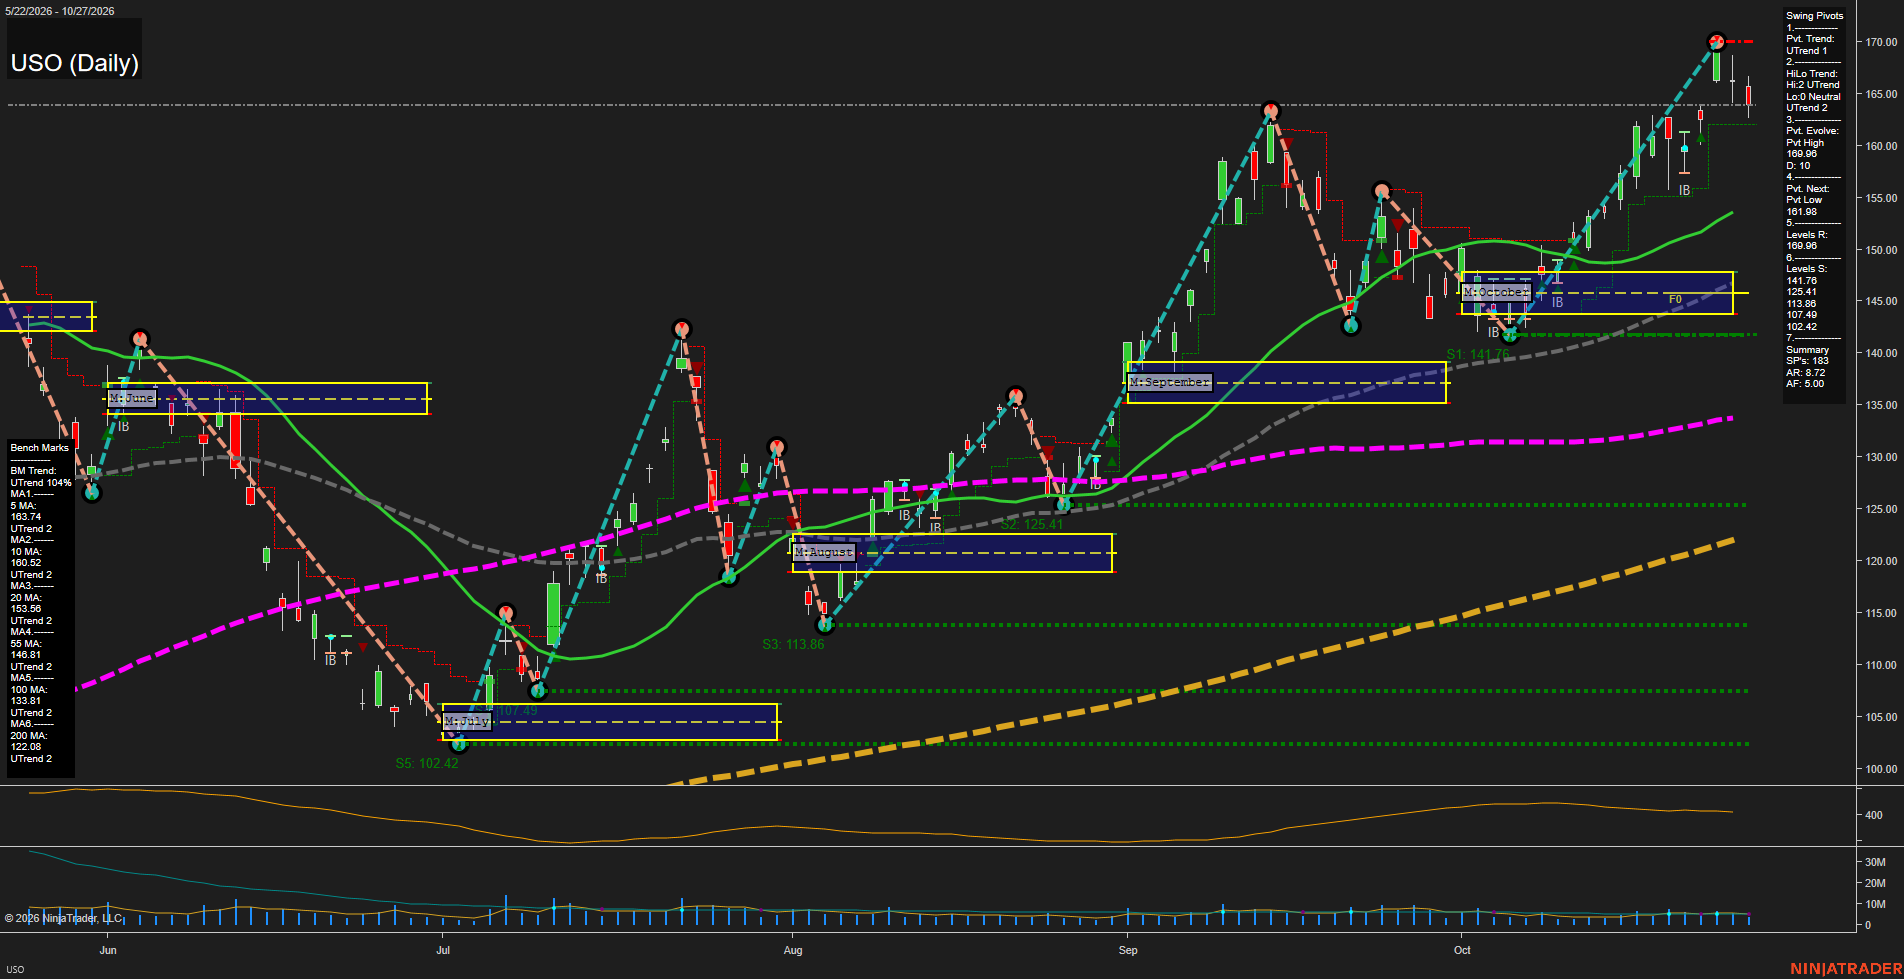
Overall Rating
- Short-Term: Bullish
- Intermediate-Term: Bullish
- Long-Term: Bullish.
Key Insights Summary
USO remains in a broad multi-timeframe advance, with price holding above every benchmark moving average and the moving-average stack positively aligned from 5 through 200 days. The recent push to the 169.98 pivot high established the primary upside reference, while the current pullback is contained above the 5-day and 10-day averages near 163.74 and 160.52. The short-term pivot structure remains an UTrend, with 161.98 defining the opposite-pivot reversal reference. October’s monthly fib grid is well below current price, reflecting a strong extension above its NTZ; 145.61 is the major nearby structural support zone. Medium-sized daily bars and a 5.00 ATR indicate active but orderly volatility following a strong directional rally rather than a broad breakdown.
View charts on: AlphaWebTrader HTF Charts
CL Daily View
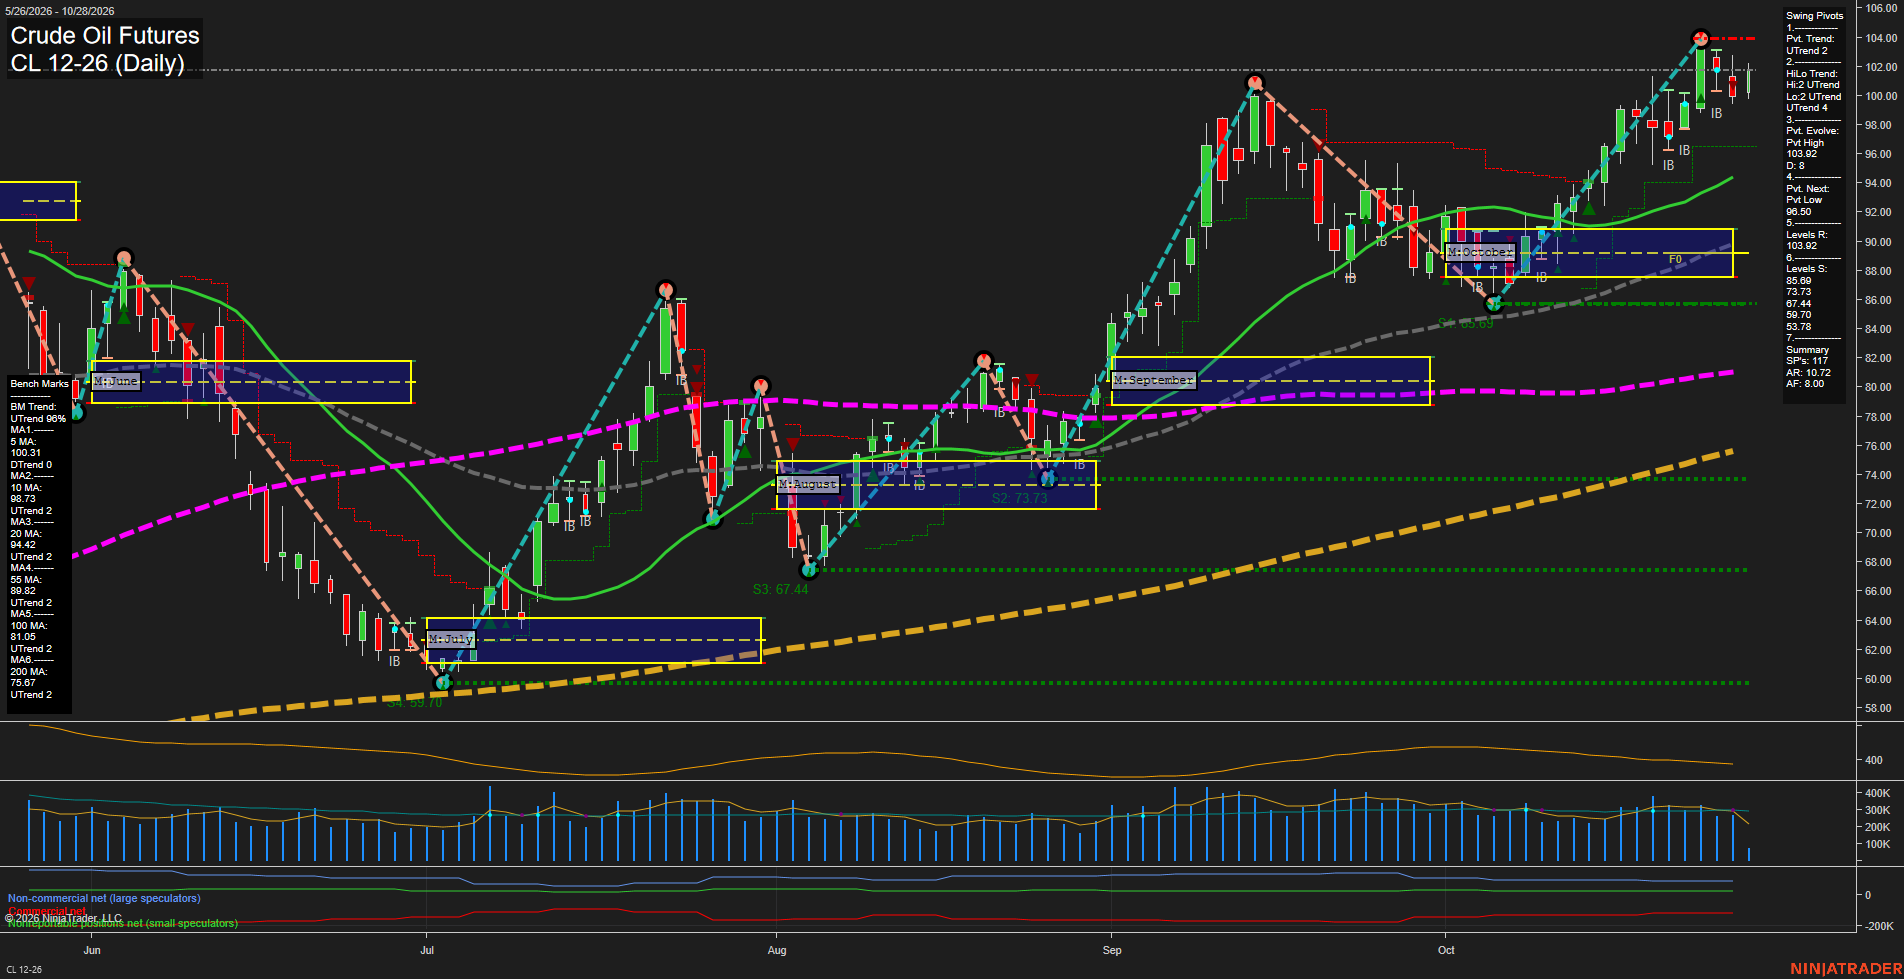
Overall Rating
- Short-Term: Bullish
- Intermediate-Term: Bullish
- Long-Term: Bullish.
Key Insights Summary
CL remains in a broad multi-timeframe advance, with price above every benchmark average and all benchmark trends pointed higher. The daily swing structure retains an UTrend and the intermediate HiLo structure confirms higher highs and higher lows. Price is consolidating beneath the 103.92 pivot-high resistance after a strong October recovery from the 86.00 area; the 96.50 next-pivot level defines the near-term pullback threshold. The recent short signals reflect countertrend pressure near the upper swing extreme, while the prevailing technical structure remains upward as long as price holds above the rising short- and intermediate-term averages.
View charts on: AlphaWebTrader HTF Charts
GLD Daily View
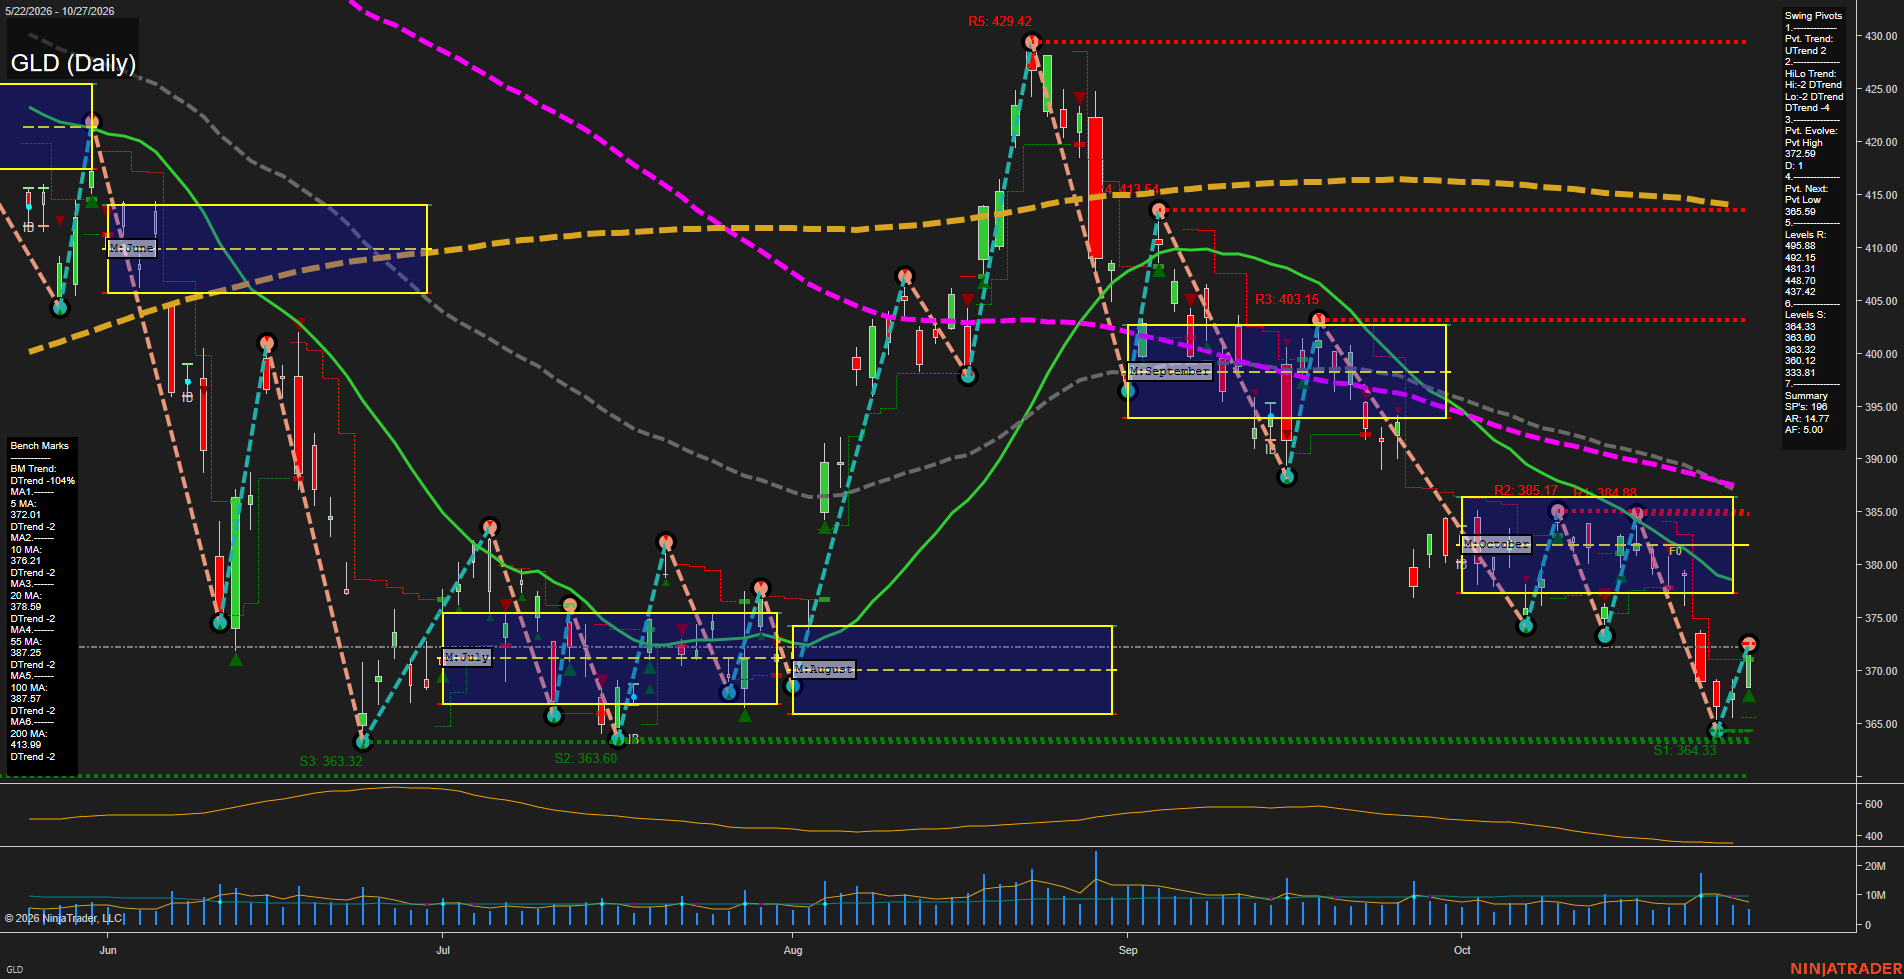
Overall Rating
- Short-Term: Bearish
- Intermediate-Term: Bearish
- Long-Term: Bearish.
Key Insights Summary
GLD remains in a broad futures-style swing downtrend, with price beneath every benchmark average and both pivot structures classified DTrend. The recent rebound from the 364.33 support cluster has been sharp, but it is currently testing the evolving 372.59 pivot-high area while remaining below the declining 5-day through 200-day averages. The October monthly grid is overhead, creating a lower-high and retracement character rather than a confirmed trend reversal. The dominant near-term range is defined by 372.59 to 376.21 overhead and 365.59 to 364.33 below; a sustained move through the upper range would improve recovery structure, while renewed weakness toward the support cluster would preserve the larger bearish swing cycle.
View charts on: AlphaWebTrader HTF Charts
GC Daily View
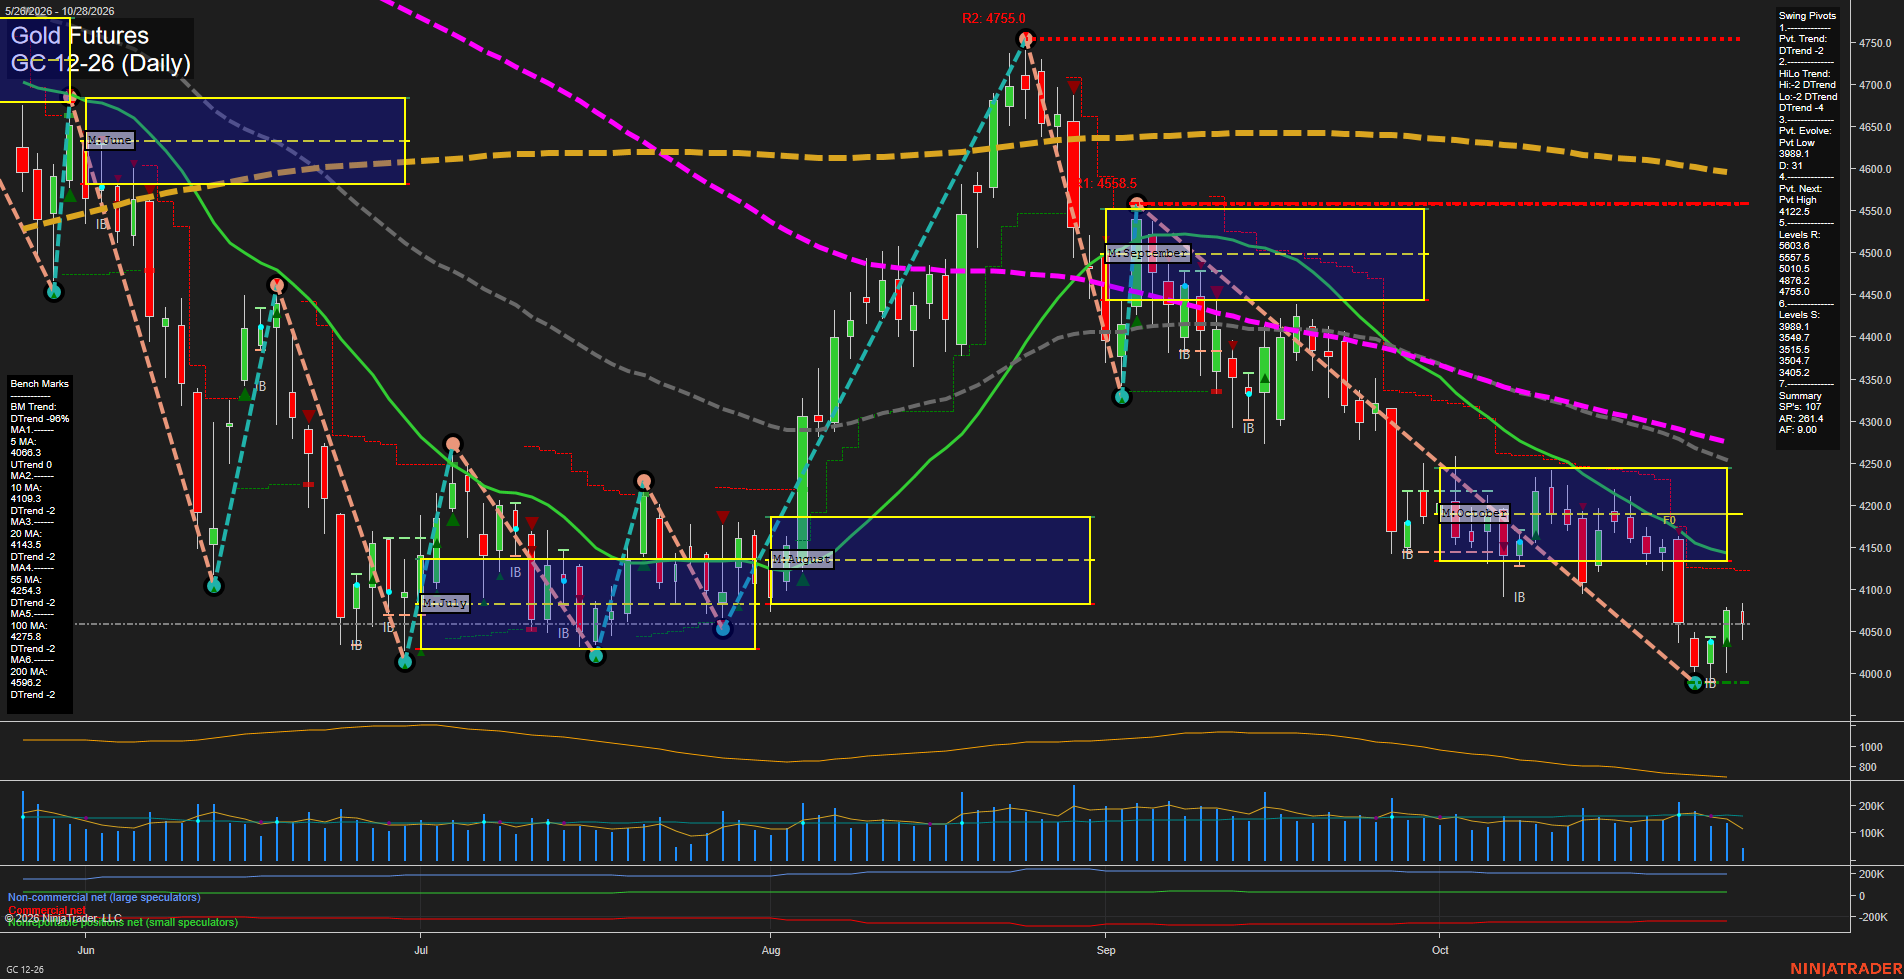
Overall Rating
- Short-Term: Neutral
- Intermediate-Term: Bearish
- Long-Term: Bearish.
Key Insights Summary
Gold is attempting a measured rebound from the 3993 pivot low, but the recovery remains below the 5, 10, 20, 55, 100, and 200-day benchmark cluster. The weekly fib structure is constructive above its F0% area, while the monthly and yearly grids remain decisively below F0%, framing the current bounce as counter-trend within broader intermediate- and long-term downtrends. The 4122.5 next-pivot threshold and the 4143.5 20-day average define the nearby overhead technical barrier, while 3989.1 remains the closest swing support. Medium-sized bars, slowing momentum, and elevated ATR conditions indicate a volatile consolidation following the October selloff rather than a confirmed broad trend reversal.
View charts on: AlphaWebTrader HTF Charts
ZB Daily View
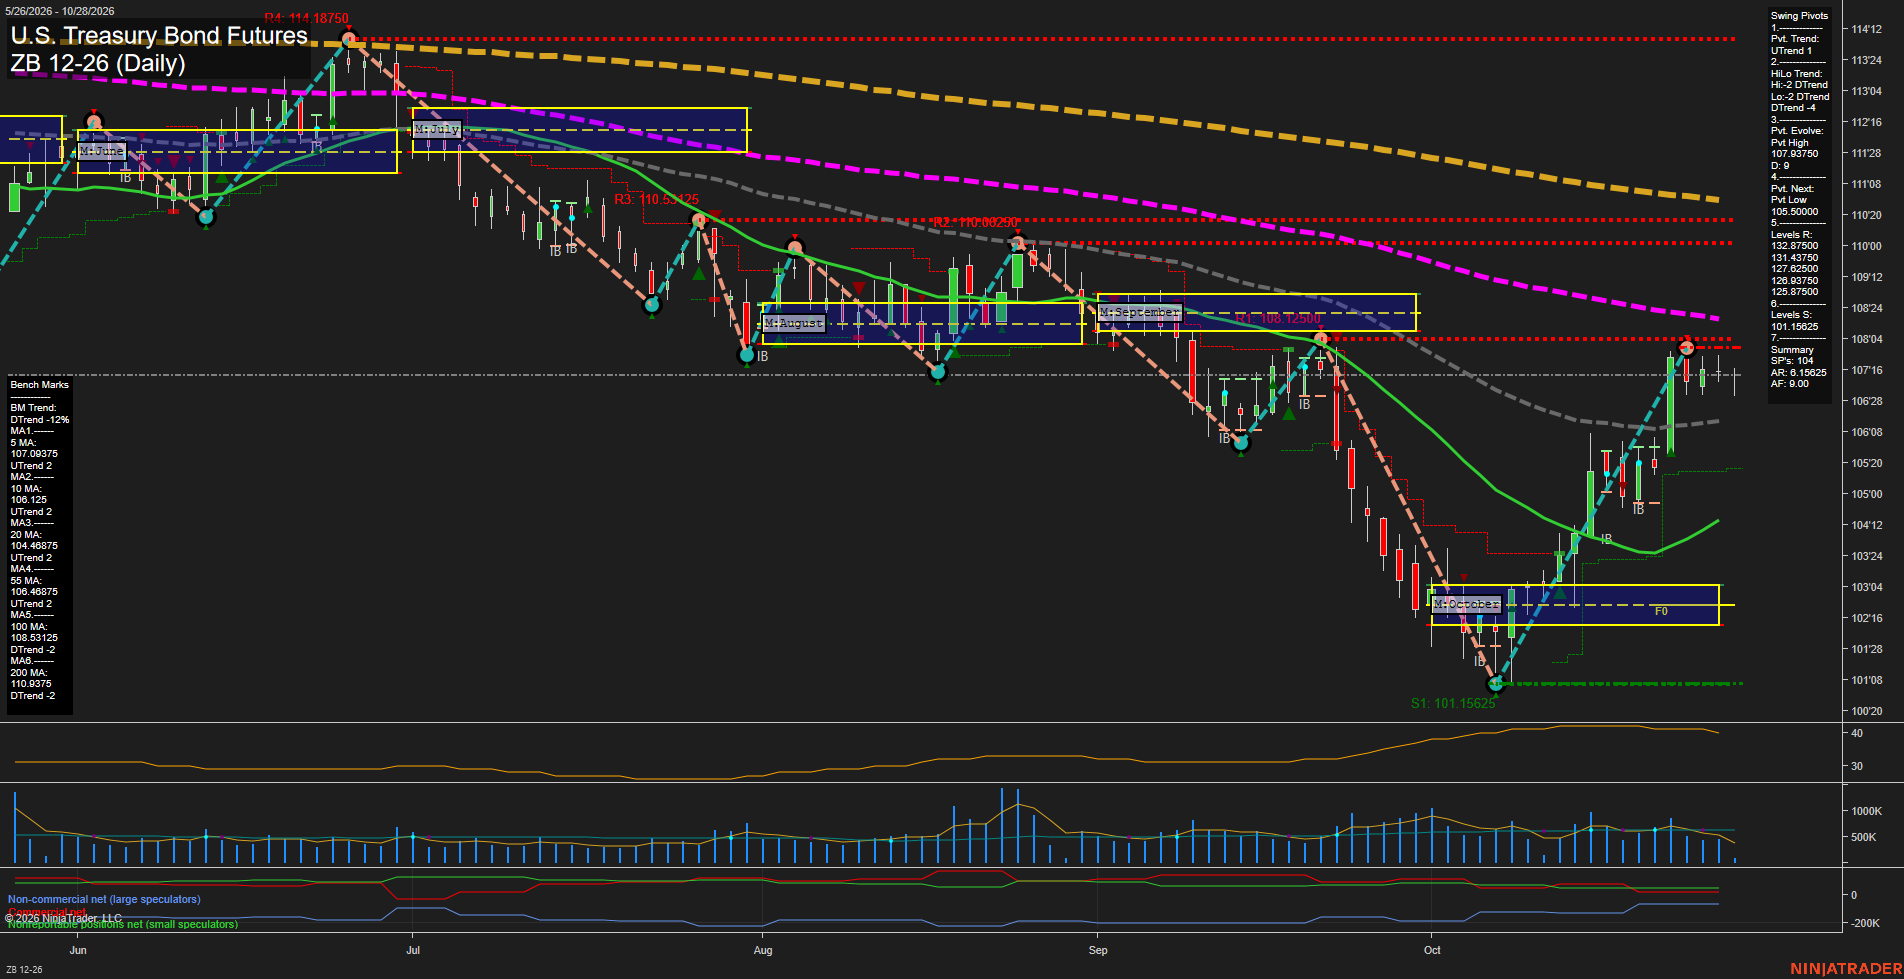
Overall Rating
- Short-Term: Bullish
- Intermediate-Term: Bullish
- Long-Term: Bearish.
Key Insights Summary
The October rebound has developed into a short-term pivot uptrend, with price holding above the weekly and monthly F0% areas and above the rising 5-, 10-, 20-, and 55-day benchmarks. The recovery has slowed beneath the 107.93750 developing pivot-high area, producing smaller daily ranges and consolidation after a sharp advance from the October low. Intermediate structure remains constructive through the rising moving-average cluster and positive monthly grid position, although the broader HiLo pivot trend remains down. Long-term structure is still bearish because price remains below declining 100- and 200-day benchmarks and well beneath major overhead pivot resistance. Recent short-term trend and grid signals reflect the rebound, while the long-term trend signal remains counter to the rally.
View charts on: AlphaWebTrader HTF Charts
Sentiment Summary: Coverage leaned positive (34% positive, 17% negative), but 49% was neutral as AI/cloud earnings optimism and strong SK Hynix results supported semiconductor leadership; October 27’s megacap-led advance left the equal-weight S&P 500 lagging. On October 28, the Fed held rates at 3.75%–4.00%, with two officials favoring an increase; Warsh stressed elevated inflation, and a December hike remained widely expected. AI spending and cash-flow concerns counterbalanced optimism ahead of Microsoft and Alphabet earnings after the October 28 close and Amazon’s October 29 report.
Conclusion: Index sentiment remained concentrated in technology rather than broad-based market strength.