Stocks are mixed, with Nasdaq weakness ahead of Apple's earnings after Monday's close; no economic events remain today. JOLTS and elections are tomorrow.
Fundamentals: Stocks face mixed technology signals ahead of Apple's earnings after Monday's close, with no economic events remaining on today's supplied calendar. Tomorrow, Tuesday, brings JOLTS at 10:00 ET and congressional elections listed at 10:16 ET, followed by AMD, Arista Networks and Super Micro Computer earnings after close. Amazon's rebound supports technology shares, while falling oil eases inflation concerns. Gold rebounded more than 2%, though weekly charts remained bearish.
Technicals: Stock index futures show divergent technical conditions: the S&P 500 and Dow remain in near-term corrections within longer-term uptrends, while the Nasdaq is bearish across near and medium horizons. Small- and mid-cap futures have rebounded into overhead resistance. Germany's DAX retains a bullish daily structure despite a corrective weekly pattern, with wide swings signaling elevated volatility.
Pre-Market Trading 360° view Market Radar of: holidays, earnings, eco-news, market-news summary, news sentiment, prior session major ETFs, MAG7, Higher Time Frame Analysis Indices Futures Summary, and E-mini S&P500, Nasdaq 100, NYMEX Crude, Gold Futures Daily Chart analysis.
As of: November 2, 2026 11:55 CT
Earnings Radar
Monitoring for earnings releases by the Magnificent 7, AI-tech-related firms, and major financial institutions.
| Date/Day | Impact | Company / Symbol | Time | EPS | Revenue | ||||
|---|---|---|---|---|---|---|---|---|---|
| 2026-11-02 – Monday | High | Apple (AAPL) | After close |
|
| ||||
| 2026-11-03 – Tuesday | Medium | Advanced Micro Devices (AMD) | After close |
|
| ||||
| 2026-11-03 – Tuesday | Medium | Arista Networks (ANET) | After close |
|
| ||||
| 2026-11-03 – Tuesday | Medium | Super Micro Computer (SMCI) | After close |
|
| ||||
| 2026-11-04 – Wednesday | Medium | Riot Platforms (RIOT) | Before open |
|
| ||||
| 2026-11-05 – Thursday | Medium | Microchip Technology (MCHP) | After close |
|
|
Conclusion: AAPL reports today, Nov. 2, after market close; its results are still ahead at publication. AMD, ANET and SMCI follow Nov. 3 after close, RIOT Nov. 4 before open, and MCHP Nov. 5 after close, placing major tech, AI and semiconductor earnings on the index-futures calendar. Market momentum and volume can slow ahead of major earnings releases, especially MAG7, AI and semiconductor names.
For full details visit: Yahoo Earnings Calendar
EcoNews Radar U.S. Events
| Date | Impact | Event, Prev, Forecast, Actual | Info |
|---|---|---|---|
| 2026-11-02 Monday 10:00 | Medium | ISM Manufacturing PMI Prev: 54.5 Forecast: 54.7 Actual: — | Surveys factory purchasing managers on business conditions, including orders, output and employment. Index futures traders monitor it for signals about economic momentum, corporate demand and inflation pressures. |
| 2026-11-03 Tuesday 10:00 | Medium | JOLTS Job Openings Prev: 7.08M Forecast: 7.11M Actual: — | Counts unfilled positions employers are actively recruiting for. Traders monitor labor demand for clues about wage pressure, hiring conditions and the Federal Reserve’s policy outlook. |
| 2026-11-03 Tuesday 10:16 | High | Congressional Elections Prev: — Forecast: — Actual: — | Determines the composition of Congress. Traders monitor the outcome for implications for taxes, spending, regulation and the ability to enact fiscal policy. |
| 2026-11-04 Wednesday 10:00 | Medium | ISM Services PMI Prev: 54.9 Forecast: 54.9 Actual: — | Surveys purchasing managers across service industries on business activity, orders, employment and prices. Traders track it as a broad gauge of growth and inflation pressures outside manufacturing. |
| 2026-11-04 Wednesday 10:30 | High | Crude Oil Inventories Prev: -1.9M Forecast: — Actual: — | Tracks weekly changes in commercial crude stockpiles. Traders monitor supply-demand conditions for implications for energy prices, energy-sector earnings and inflation. |
| 2026-11-05 Thursday 08:30 | Medium | Unemployment Claims Prev: 194K Forecast: 197K Actual: — | Counts new applications for unemployment benefits. Traders watch this timely indicator of layoffs for signs of changing labor conditions and potential shifts in monetary policy expectations. |
| 2026-11-06 Friday 08:30 | High | Average Hourly Earnings m/m Prev: 0.1% Forecast: 0.3% Actual: — | Measures monthly changes in average hourly pay for private-sector workers. Traders track wage growth for implications for household spending, business margins, inflation and interest-rate expectations. |
| 2026-11-06 Friday 08:30 | High | Non-Farm Employment Change Prev: 29K Forecast: 63K Actual: — | Measures the monthly change in payroll employment outside agriculture. Traders monitor hiring momentum as a key signal of economic growth and the outlook for Federal Reserve policy. |
| 2026-11-06 Friday 08:30 | High | Unemployment Rate Prev: 4.2% Forecast: 4.2% Actual: — | Measures the share of the labor force without work and actively seeking employment. Traders assess labor-market slack for implications for spending, wage pressure and monetary policy. |
| 2026-11-06 Friday 10:00 | Medium | Prelim UoM Consumer Sentiment Prev: 46.3 Forecast: 47.8 Actual: — | Provides an early survey-based reading of consumers’ assessments of current conditions and future prospects. Traders monitor confidence for clues about household spending and the economic outlook. |
| 2026-11-06 Friday 10:00 | Medium | Prelim UoM Inflation Expectations Prev: 4.7% Forecast: — Actual: — | Captures consumers’ expectations for price increases over the coming year. Traders monitor whether inflation beliefs are becoming entrenched, with implications for wage demands and Federal Reserve policy. |
Summary: The calendar centers on U.S. growth, labor conditions and inflation expectations, alongside political and energy developments.
Conclusion: Friday brings the densest cluster of releases, led by the employment report.
NYSE Session Open Gap Radar
Session gaps compare the predicted opening price with the prior session’s close to predict the upcoming session’s opening gap pattern.
| Instrument | Gap | Prior Close | Predicted Open | Gap % |
|---|---|---|---|---|
| GLD | ▲ OGU | 355.78 | 361.74 | ▲ +1.68% |
| IBIT | ▼ IGU | 43.36 | 43.90 | ▲ +1.25% |
| IWM | ▼ IGU | 279.33 | 281.64 | ▲ +0.83% |
| DIA | ▼ IGU | 517.13 | 520.89 | ▲ +0.73% |
| IJH | ▼ IGU | 73.33 | 73.86 | ▲ +0.72% |
| QQQ | ▼ IGU | 690.49 | 695.32 | ▲ +0.70% |
| SPY | ▼ IGU | 755.72 | 759.45 | ▲ +0.49% |
| TLT | ▲ IGD | 81.84 | 81.83 | ▼ -0.01% |
| USO | ▼ OGD | 168.83 | 159.52 | ▼ -5.51% |
Before the session opens, the table shows the predicted opening price and gap. Once the session opens, it uses the recorded opening price.
Glossary: IGU — Inside Gap Up: above the prior close, within the prior session’s range. IGD — Inside Gap Down: below the prior close, within that range. OGU — Outside Gap Up: above the prior session’s high. OGD — Outside Gap Down: below the prior session’s low.
As of: 2026-11-02 11:55 CT.
Market News Summary:
U.S. equities face mixed technology earnings signals, falling oil prices and stronger manufacturing activity ahead of Apple’s results and Tuesday’s midterm elections.
Primary Drivers & Risks:
- Primary Driver: Cloud earnings strength and falling oil prices
- Primary Risk: Apple earnings and midterm election uncertainty
Tone:
Mixed, with selective technology strength offset by investment-cost and event risks.
Data, Market and System
Geopolitical:
- Iran talks accompanied Brent’s 5% decline, with Strait shipping also in focus.
- Tuesday’s U.S. midterm elections form a near-term event backdrop for equities.
Oil / Energy:
- WTI and Brent faced selling pressure despite crude inventory draws and unchanged OPEC+ production requirements.
- The UAE reported higher oil exports after being freed from OPEC quotas.
- A demand downgrade and thin U.S. diesel inventories added competing signals to the energy backdrop.
Gold / Metals:
- Gold rebounded more than 2% as falling oil prices eased inflation concerns, although weekly charts remained bearish.
Fed / Financials:
- The oil-price decline reduced expectations for Federal Reserve rate increases.
- Lower interest rates helped support October’s broad sector gains.
Macro / Other:
- The ISM manufacturing purchasing managers’ index rose to 55.5 in October from 54.5 in September, indicating faster expansion.
- Manufacturing output reached its highest level in five years as economic growth and AI-related demand increased, while producers faced inflation and difficulty meeting demand.
- Binance recorded $4.7 billion in customer withdrawals following a reported North Korea hack, with the exchange stating that withdrawals were stabilizing.
Conclusion:
Cloud growth and Amazon’s rebound provide support within technology, while falling oil prices ease inflation and rate-hike concerns. Apple’s after-close results remain a central earnings event for index traders.
Stronger manufacturing activity contrasts with persistent cost pressures and heavy AI investment spending. Tuesday’s midterms and an unreactive VIX add event and volatility cross-currents.
Market News Sentiment
Sentiment Bias shows the balance of positive and negative news coverage sampled from 2026-11-01 13:54 to 2026-11-02 12:01 ET, covering stocks, energy and gold.
▲ Market news
- Bias
- ▲ +0.78%
- Articles
- 128
- Positive
- ▲ 27.34%
- Neutral
- — 46.09%
- Negative
- ▼ 26.56%
▲ GLD / Gold
- Bias
- ▲ +14.29%
- Articles
- 7
- Positive
- ▲ 42.86%
- Neutral
- — 28.57%
- Negative
- ▼ 28.57%
Sentiment Summary: Coverage has a modest positive balance (43% positive versus 29% negative), as November 2 reports linked gold’s rebound of more than 2% to falling oil prices, easing inflation concerns and reduced Fed hike expectations. Bargain hunting followed gold’s worst October since 2008, but reports still described bearish weekly charts and vulnerability below $4,000 despite lower real yields. Earlier November 1 coverage emphasized tighter-policy pressure, while November 2 reporting highlighted upcoming U.S. employment data as the next test.
Conclusion: The main cross-market context is an oil-led reassessment of rate expectations, with gold’s recovery still constrained by technical weakness.
▼ USO / Oil
- Bias
- ▼ -13.04%
- Articles
- 23
- Positive
- ▲ 26.09%
- Neutral
- — 34.78%
- Negative
- ▼ 39.13%
Sentiment Summary: Oil coverage leaned negative (39% negative versus 26% positive), as reported U.S.–Iran diplomatic efforts drove Monday, November 2 crude declines of 4–5%, easing supply fears and inflation concerns. Lower oil accompanied higher U.S. equity futures and a technology-led stock rebound, with the Dow up about 400 points after the open. Tight supplies, inventory draws and continuing Hormuz shipping risks counterbalanced oil’s decline, while OPEC+’s November 1 decision left December output targets unchanged.
Conclusion: The reported equity recovery coincided with easing oil-related inflation pressure, ahead of Apple and Palantir earnings after Monday’s close, U.S. midterms and Friday’s jobs data.
Glossary: Sentiment Bias = (positive articles − negative articles) ÷ total articles × 100. It ranges from −100% negative to +100% positive. A reading near zero indicates little directional bias. Neutral articles reduce the score’s strength. ▲ positive; ▼ negative; — balanced. These readings describe news coverage, not market-price direction.
Market Technical Analysis
Analysis of VIX volatility, prior-session major ETFs and mega-cap tech stocks, and real-time futures snapshots and higher-time-frame analysis.
VIX — Market Fear Gauge Daily
| Level | Open | High | MaxVix | Low | MinVix | DNC% | DOC% | VR | MaxVR | MinVR |
|---|---|---|---|---|---|---|---|---|---|---|
| 18.96 | 18.93 | 23.93 | 22.31 | 18.54 | 14.77 | +10.23% | +0.16% | 5.77 | 41.30 | -0.20 |
VIX rose 0.16% from the session's opening level. VIX rose 10.23% versus the previous session close. Expected volatility rose from the period open. VIX is 55.6% up the recent 15-session range (14.77–22.31), in the 50–60% band.
VR: ATN Volatility Ratio (VR): 5.77 – Stocks fell while expected volatility rose. VR is in the lower part of its preceding 15-session VR range (-0.20 to 41.30), in the 10–20% band. VR rose 1.28 points from the previous session, a small shift relative to that range.
Range lookback: preceding 15 completed sessions.
Major ETFs and Mega Cap Tech Stocks
- Amazon rose 5% in morning trading as an upgrade and AWS strength supported its post-earnings rebound.
- Amazon reported operating income growth of 61% to $28.1 billion, while trailing free cash flow fell to negative $42.4 billion amid rising capital spending and debt.
- Apple reports fiscal fourth-quarter results after Monday’s close, with attention on iPhone demand, AI strategy and rising memory-chip costs.
- Microsoft remained below its year-earlier share price despite beating earnings estimates, while its bond issuance drew investor concern.
- Alphabet’s cloud business showed strong growth, while AI search generated less advertising revenue than traditional search.
- Options traders described the VIX as unreactive.
- Nine of 11 S&P 500 sectors advanced in October, but the index declined approximately 1%.
- SpaceX gained 4% on reported Boost Mobile acquisition talks, while AST SpaceMobile fell 4% and Rocket Lab declined.
ETF, Mag7, and Cross-Market ETF prior day Insights
Overall Tone
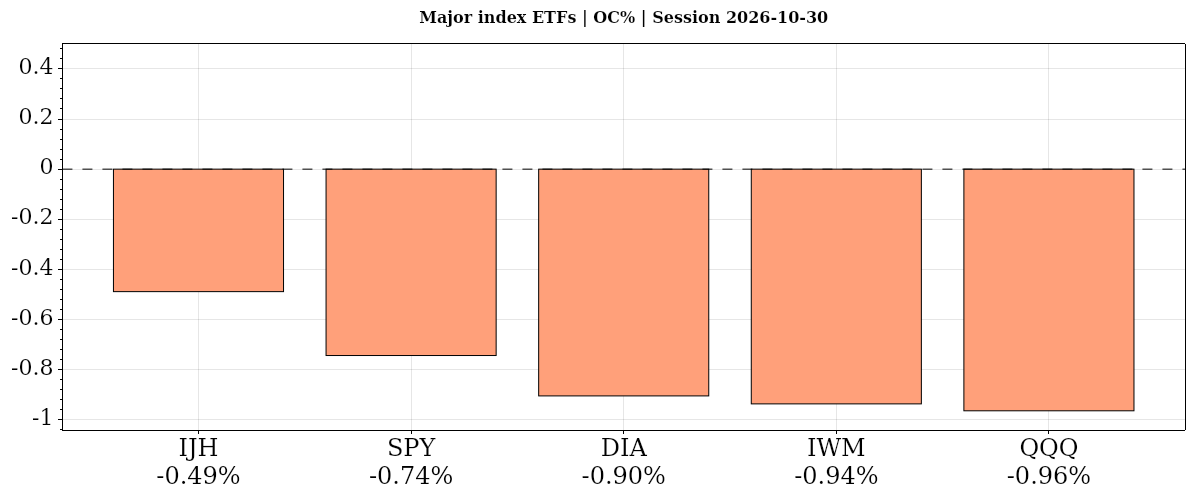
The October 30, 2026 daily session leaned risk-off from the open, with index ETFs uniformly lower and mega-cap technology mixed; prior-close comparisons showed broader equity weakness.
| Instrument | Bias | Date | DNC% | DOC% | O | H | L | C | VWAP | Vol |
|---|---|---|---|---|---|---|---|---|---|---|
| ▼ IJH | ▼ ▼ ▲ | 2026-10-30 | ▼ -1.17% | ▼ -0.49% | 73.69 | 74.01 | 72.75 | 73.33 | ▲ 73.28 | 7,729,251 |
| ▼ SPY | ▼ ▼ ▼ | 2026-10-30 | ▼ -1.77% | ▼ -0.74% | 761.38 | 761.46 | 750.36 | 755.72 | ▼ 755.85 | 76,819,094 |
| ▼ DIA | ▼ ▼ ▼ | 2026-10-30 | ▼ -1.07% | ▼ -0.90% | 521.85 | 522.02 | 515.01 | 517.13 | ▼ 518.39 | 4,484,961 |
| ▼ IWM | ▼ ▼ ▼ | 2026-10-30 | ▼ -1.65% | ▼ -0.94% | 281.97 | 282.71 | 276.91 | 279.33 | ▼ 279.38 | 23,650,327 |
| ▼ QQQ | ▼ ▼ ▼ | 2026-10-30 | ▼ -3.47% | ▼ -0.96% | 697.21 | 698.63 | 683.45 | 690.49 | ▼ 690.77 | 84,212,888 |
| AVG/Sum | — | — | -1.83% | -0.81% | — | — | — | — | — | 196,896,521 |
Index ETFs
Negative confluence: average DOC% -0.81% from the open, DNC% -1.83% versus the prior close. All five index ETFs fell from the open, with IJH least weak and QQQ lagging; versus the prior close, DIA was most resilient and QQQ weakest. SPY and QQQ declined on more than twice average volume.
IJH · D:2026-10-30 NC% ▼ -1.17% OC% ▼ -0.49%
IJH – Mid Cap Technicals Summary
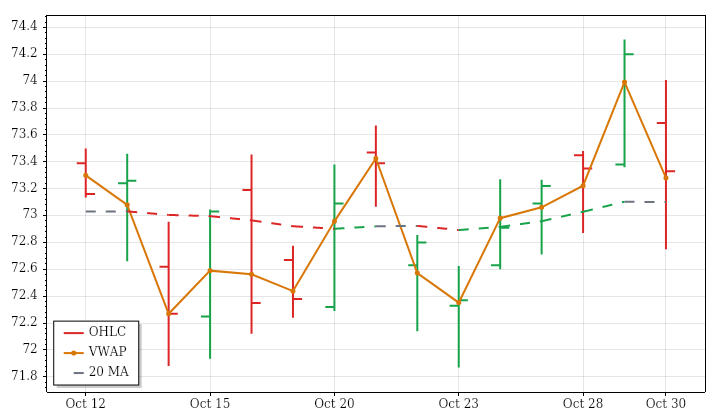
IJH’s October 30 daily session closed at 73.33, down 1.17% from the prior close and 0.49% from the open. The opening gap down stayed unfilled, and the session made a lower high and lower low before closing below the prior day’s low. Nevertheless, the finish was slightly above session VWAP, creating a modest intraday contrast with the negative daily result.
Trend alignment is incomplete. Price is just above a falling near-term benchmark, below a falling intermediate benchmark, and below a slightly rising far-term benchmark. That leaves intermediate weakness surrounded by mixed shorter- and longer-horizon readings. The latest range was roughly 1.6 times average, with moderately above-average volume; both interrupted the prior 15-session pattern of contracting ranges and declining activity. PSAR remains in an uptrend, but a next-session low below 72.2238 would trigger a conditional short reversal.
SPY · D:2026-10-30 NC% ▼ -1.77% OC% ▼ -0.74%
SPY – S&P 500 Technicals Summary
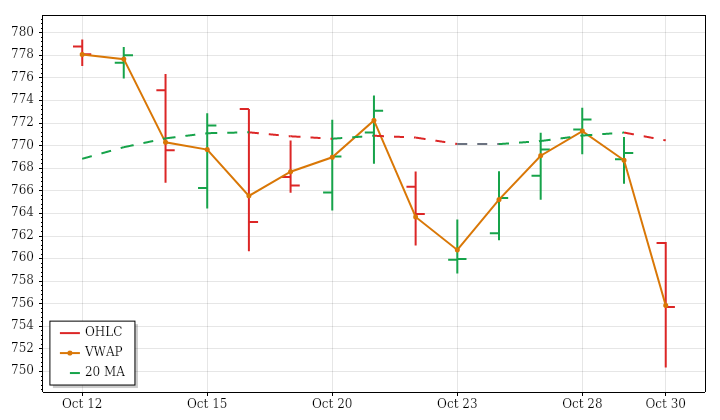
SPY’s October 30 daily session closed at 755.72, down 1.77% from the prior close and 0.74% from the open. The opening gap down remained unfilled, and subsequent trading produced a lower high and lower low before a finish below the prior day’s low. The close was only slightly below session VWAP, despite the broader daily decline.
Shorter-term weakness still conflicts with the longer-term structure. Price is below a falling near-term average and a slightly rising intermediate benchmark, but remains above its rising far-term average. The latest range was about 1.8 times average, reversing the preceding 15-session tendency toward contraction, while volume exceeded twice average alongside an increasing-volume trend. The lookback’s low directional efficiency also indicates considerable offsetting movement rather than a smooth decline. PSAR is short; a next-session high above 773.36 would conditionally trigger a long reversal.
S&P 500 News and Fundamentals
The S&P 500 lost approximately 0.57% in the week ended Oct. 30, marking its third consecutive weekly decline amid a technology selloff. The index finished roughly 3% below its record close. Separately, FactSet’s blended third-quarter earnings growth estimate for S&P 500 companies stood at 29.5% as of Oct. 23.
DIA · D:2026-10-30 NC% ▼ -1.07% OC% ▼ -0.90%
DIA – Dow Jones Technicals Summary
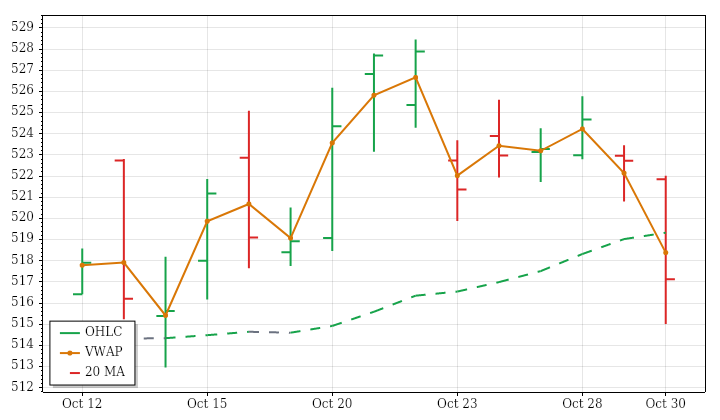
DIA’s completed October 30 daily session closed at 517.13, losing 1.07% against the prior close and 0.90% from the open. Its small opening gap down remained unfilled. Although trading crossed both sides of the open, the eventual close below session VWAP and the prior day’s low left the session’s technical emphasis on weakness.
The broader structure is divided. Price is below a rising near-term benchmark and a falling intermediate-term benchmark, but remains above its rising far-term average. Thus, the latest decline fits intermediate weakness without establishing alignment across all horizons. Range expanded to roughly one and a half times average and volume was meaningfully above average, contrasting with the preceding 15-session contraction in ranges and declining volume. PSAR remains bearish; a next-session high above 526.2678 would trigger a long reversal only if reached.
IWM · D:2026-10-30 NC% ▼ -1.65% OC% ▼ -0.94%
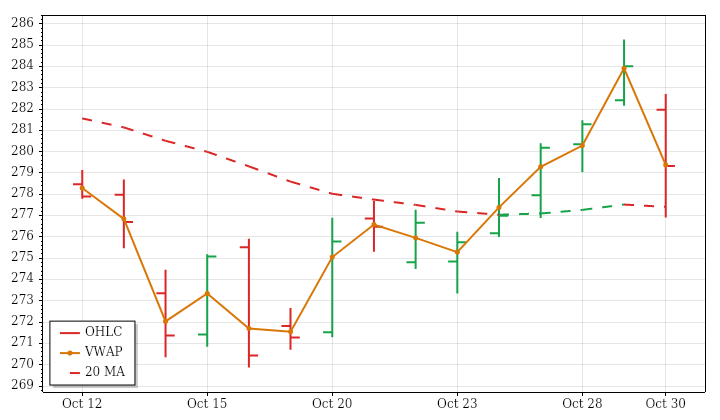
IWM – Small Cap Technicals Summary
IWM’s completed October 30 daily session closed at 279.33, losing 1.65% from the prior close and 0.94% from the open. The opening gap down remained unfilled. A lower high and lower low, followed by a close below the prior day’s low, emphasized daily weakness, although the finish was only marginally below session VWAP rather than substantially separated from it.
The latest decline sits within intermediate- and far-term downtrends, while the near-term picture remains mixed because price is slightly above a gently falling benchmark. This contrasts with the modest upward price trend across the preceding 15 sessions, which showed limited directional efficiency. The daily range was nearly 1.8 times average against a contracting range trend, but volume was essentially average despite a declining lookback trend. PSAR remains bullish; a next-session low below 276.91 would conditionally trigger a short reversal.
QQQ · D:2026-10-30 NC% ▼ -3.47% OC% ▼ -0.96%
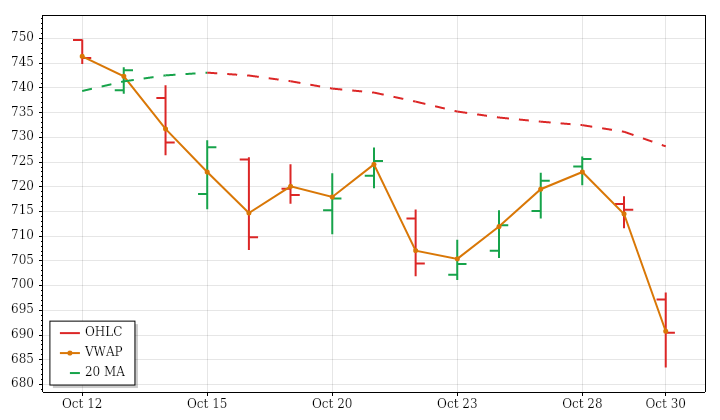
QQQ – Nasdaq 100 Technicals Summary
QQQ’s completed October 30 daily session closed at 690.49, down 3.47% from the prior close and 0.96% from the open. The substantial opening gap down remained unfilled, accounting for much of the daily loss. Price subsequently finished below the prior day’s low and slightly below session VWAP, following a lower high and lower low.
The decline aligns with falling near- and intermediate-term averages. The far-term structure remains mixed, however, because price is below a benchmark that still slopes upward. The latest range was roughly 1.6 times average, interrupting a slight contraction across the preceding 15 sessions. Volume was about 2.2 times average, extending the lookback’s increasing-volume tendency and distinguishing this session from a quiet pullback. PSAR is in a short state; a next-session high above 726.14 would conditionally trigger a long reversal.
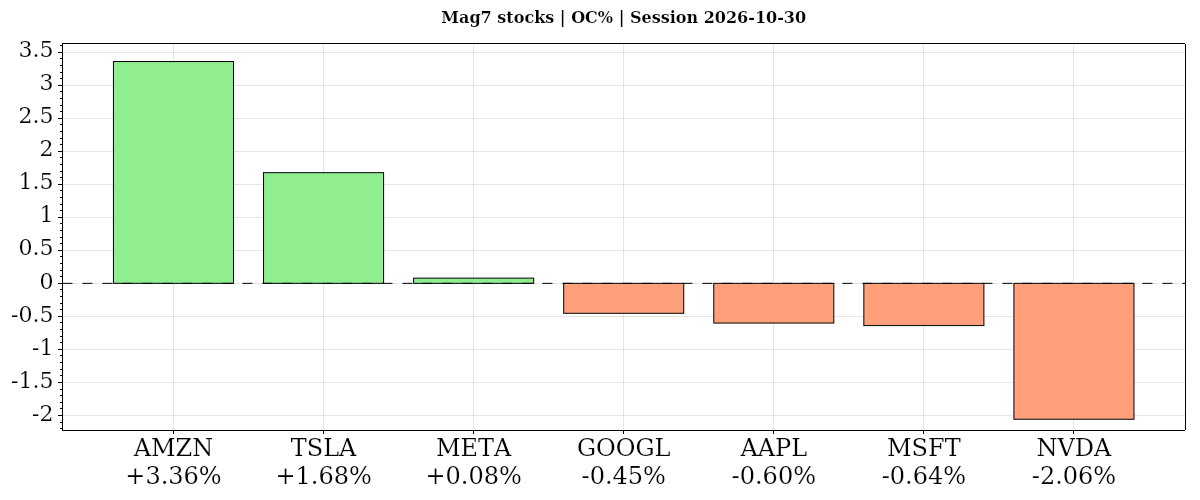
| Instrument | Bias | Date | DNC% | DOC% | O | H | L | C | VWAP | Vol |
|---|---|---|---|---|---|---|---|---|---|---|
| ▲ AMZN | ▼ ▲ ▲ | 2026-10-30 | ▼ -1.41% | ▲ +3.36% | 232.54 | 241.55 | 229.36 | 240.35 | ▲ 238.39 | 103,606,524 |
| ▲ TSLA | ▼ ▲ ▲ | 2026-10-30 | ▼ -0.87% | ▲ +1.68% | 393.22 | 404.22 | 387.52 | 399.81 | ▲ 397.70 | 41,696,277 |
| ▲ META | ▼ ▲ ▼ | 2026-10-30 | ▼ -1.53% | ▲ +0.08% | 614.50 | 626.37 | 610.13 | 614.99 | ▼ 617.78 | 25,073,011 |
| ▼ GOOGL | ▼ ▼ ▼ | 2026-10-30 | ▼ -1.40% | ▼ -0.45% | 281.12 | 283.14 | 276.92 | 279.84 | ▼ 280.05 | 64,854,067 |
| ▼ AAPL | ▼ ▼ ▼ | 2026-10-30 | ▼ -1.23% | ▼ -0.60% | 346.71 | 349.19 | 334.35 | 344.63 | ▼ 345.40 | 67,640,741 |
| ▼ MSFT | ▼ ▼ ▲ | 2026-10-30 | ▼ -1.55% | ▼ -0.64% | 525.27 | 526.00 | 514.35 | 521.91 | ▲ 521.69 | 34,715,706 |
| ▼ NVDA | ▼ ▼ ▼ | 2026-10-30 | ▼ -4.22% | ▼ -2.06% | 208.94 | 209.06 | 200.92 | 204.64 | ▼ 204.67 | 166,517,499 |
| AVG/Sum | — | — | -1.74% | +0.19% | — | — | — | — | — | 504,103,825 |
Mag7 Stocks
Mixed: average DOC% +0.20% from the open, DNC% -1.74% versus the prior close. Three Mag7 stocks gained from the open: AMZN led, META was near-flat, and NVDA lagged; all seven fell versus the prior close, with TSLA most resilient. TSLA retained near-term and intermediate uptrends despite its daily loss.
AMZN · D:2026-10-30 NC% ▼ -1.41% OC% ▲ +3.36%
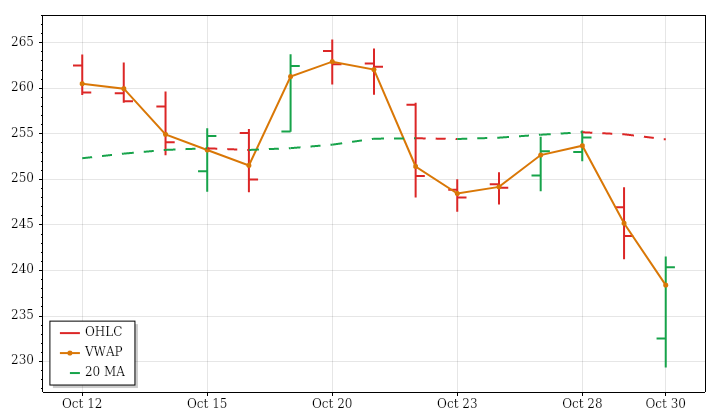
AMZN – Amazon Technicals Summary
AMZN’s October 30 daily session combined a sharp opening markdown with a substantial intraday recovery. The close at 240.35 was 1.41% below the prior close but 3.36% above the open, so the positive open-to-close move did not erase the overnight loss. Price finished above session VWAP, although the opening gap remained unfilled and the close was below the prior day’s low.
That recovery contrasts with near- and intermediate-term downtrends. The far-term structure is mixed: its average is still rising slightly, but price is below it. The session range exceeded twice its prior 15-session average despite a contracting range trend, while volume was roughly 2.7 times average alongside an increasing volume trend. This was a second consecutive large-range session, not a confirmed trend reversal. A next-session high above 253.4523 would conditionally reverse PSAR to long.
Amazon News and Fundamentals
Amazon’s third-quarter results missed Wall Street expectations, and its fourth-quarter sales outlook was cautious heading into the holiday season. AWS revenue rose 39.3% to $46 billion, while AWS operating income increased 55%. Companywide operating income grew 61%. Heavy AI infrastructure spending pressured free cash flow, despite an AWS backlog of $578 billion. Management projects AWS growth above 40% in both 2027 and 2028.
TSLA · D:2026-10-30 NC% ▼ -0.87% OC% ▲ +1.68%
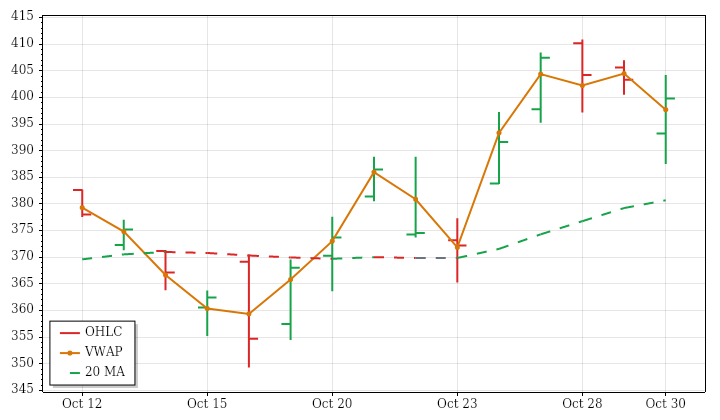
TSLA – Tesla Technicals Summary
TSLA’s October 30 daily session closed at 399.81, down 0.87% from the prior close but up 1.68% from the open. The opening gap down was filled, and price finished above session VWAP, showing an intraday recovery. Nevertheless, the close remained below the prior day’s low after a lower high and lower low, so the rebound did not restore the previous daily range.
Near- and intermediate-term averages remain rising with price above them, contrasting with the latest prior-close loss. The far-term picture is mixed because price is above an average that still declines. Range was approximately one and a half times average and volume modestly above average, both consistent with expanding ranges and increasing activity over the preceding 15 sessions. PSAR remains bullish; a next-session low below 387.52 would trigger a short reversal only if reached.
Tesla News and Fundamentals
Tesla launched its Cybercab in September, advancing its robotaxi ambitions. Separately, an analyst warned that Optimus production could be delayed until 2028, highlighting execution risks surrounding the company’s expansion beyond vehicles.
META · D:2026-10-30 NC% ▼ -1.53% OC% ▲ +0.08%
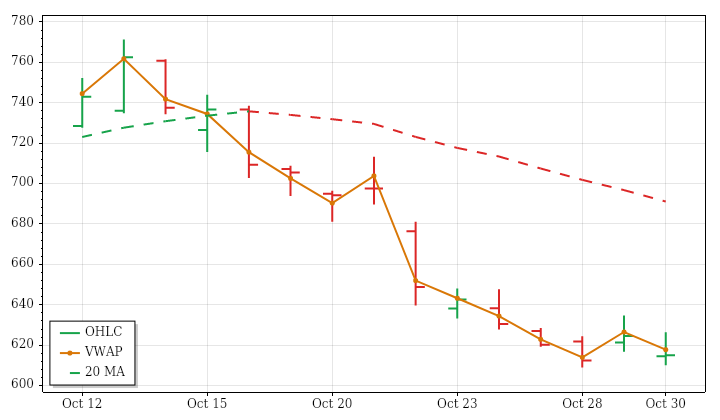
META – Meta Platforms Technicals Summary
META’s October 30 daily session closed at 614.99, down 1.53% from the prior close but up just 0.08% from the open. The opening gap down was filled during trading, yet the recovery did not hold: the close remained below the prior day’s low and session VWAP. Finishing almost unchanged from the open therefore should not be confused with an unchanged daily result.
The near-term trend is falling, while intermediate- and far-term readings are mixed because price is below averages that still rise. The latest session thus reflects shorter-term weakness without complete bearish alignment across horizons. Its range was below average, consistent with the prior 15-session contraction, while volume was approximately average rather than extending the lookback’s increasing-volume pattern. PSAR and the ATR-median trend remain bearish. A next-session high above 645.1563 would conditionally trigger a PSAR long reversal.
Meta News and Fundamentals
S&P Global Ratings revised Meta’s outlook to negative on Oct. 30, citing uncertainty over elevated capital spending and free operating cash flow. Meta also settled a teen’s claims that social media caused depression and eating disorders after jury selection began Wednesday, following another teen settlement days earlier. Separately, Meta, TikTok and X lost a legal challenge against the UK regulator’s information demands. Meta’s free Muse service reportedly costs up to $40 per user monthly.
GOOGL · D:2026-10-30 NC% ▼ -1.40% OC% ▼ -0.45%
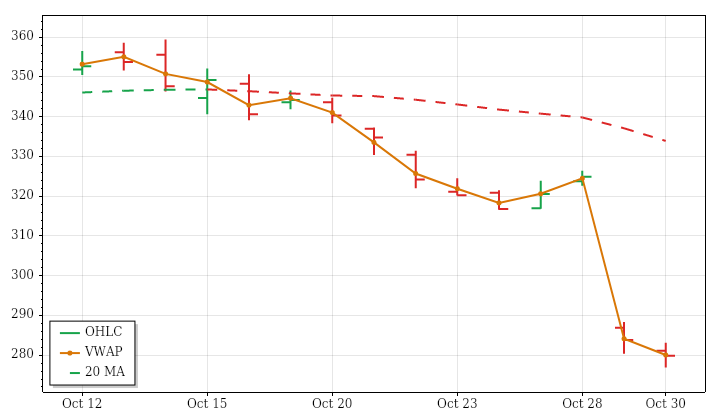
GOOGL – Alphabet Technicals Summary
GOOGL’s October 30 daily session closed at 279.84, down 1.40% from the prior close and 0.45% from the open. The opening gap down remained unfilled, and a lower high and lower low culminated in a close below the prior day’s low. Price finished only slightly below session VWAP, so that relationship added little separation despite the negative daily result.
The session followed an aligned bearish structure: price remains below falling near-, intermediate- and far-term averages. The prior 15-session decline also showed relatively substantial directional progress, rather than predominantly offsetting moves. Yet the latest range was below average, consistent with contracting ranges, while volume was nearly twice average alongside a strong increasing-volume trend. Heavy activity therefore did not produce an unusually wide daily range. PSAR remains bearish; a next-session high above 316.508 would conditionally trigger a long reversal.
AAPL · D:2026-10-30 NC% ▼ -1.23% OC% ▼ -0.60%
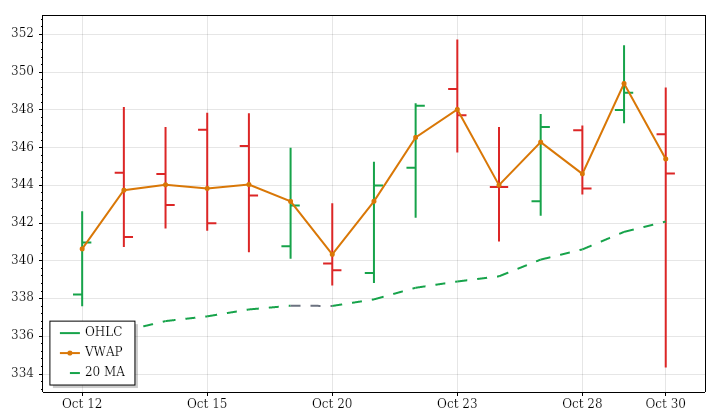
AAPL – Apple Technicals Summary
AAPL’s completed daily session on October 30 closed at 344.63, down 1.23% from the prior close and 0.60% from the open. The opening gap down was filled, but that recovery did not hold: price finished below the prior day’s low and below session VWAP. A lower high and lower low reinforced the day’s weakness rather than suggesting a sustained recovery.
The decline conflicts with rising intermediate- and far-term averages, while the near-term picture is mixed because price sits below a still-rising benchmark. The session’s range was about two and a half times average, sharply interrupting the preceding 15-session contraction in ranges. Above-average volume accompanied that expansion, consistent with the lookback’s increasing activity. PSAR is in a short state; a next-session high above 351.43 would trigger a long reversal, but that remains conditional.
Apple News and Fundamentals
Apple reports earnings Monday, Nov. 2, with Visible Alpha consensus forecasting fiscal fourth-quarter revenue of $113.6 billion. Fiscal 2026 iPhone unit expectations rose to 261 million from 258 million. Apple recently announced its first foldable iPhone, touchscreen MacBook Pro and a smart-home display. The iPhone Duo sold out on launch day, with orders backed up into January. Management warned that soaring memory costs would pressure gross margins and slow iPhone sales growth.
MSFT · D:2026-10-30 NC% ▼ -1.55% OC% ▼ -0.64%
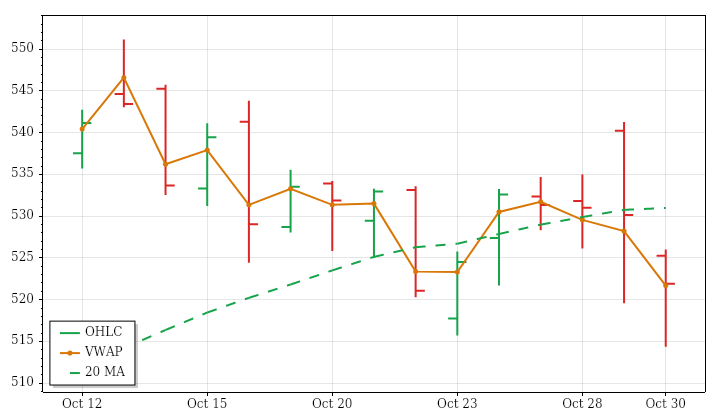
MSFT – Microsoft Technicals Summary
MSFT’s completed October 30 daily session closed at 521.91, down 1.55% from the prior close and 0.64% from the open. The opening gap down remained unfilled, and the session recorded a lower high and lower low while breaching the preceding outside-bar low. However, the close stayed inside the prior day’s range and slightly above session VWAP, qualifying the bearish daily picture.
Near-term averages are falling, but price remains just above its rising intermediate benchmark and well above the rising far-term structure. The main conflict is therefore shorter-term weakness within broader upward trends. Range was only modestly above average, while volume was substantially elevated; both were consistent with expanding ranges and increasing volume across the preceding 15 sessions. PSAR is in a short state. A next-session high above 541.29 would trigger a long reversal, but only conditionally.
Microsoft News and Fundamentals
Microsoft’s fiscal 2027 first-quarter revenue rose 19%, operating income increased 21% and operating cash flow grew 29%. Azure growth accelerated to 48%; management forecast 49–50% growth in the second quarter despite continuing capacity constraints. Remaining performance obligations reached $677 billion, up 73% annually. Microsoft also lined up its first bond-market borrowing since 2017, with a reported $25 billion AI financing deal, and offered employee buyouts to 60,000 workers this week.
NVDA · D:2026-10-30 NC% ▼ -4.22% OC% ▼ -2.06%
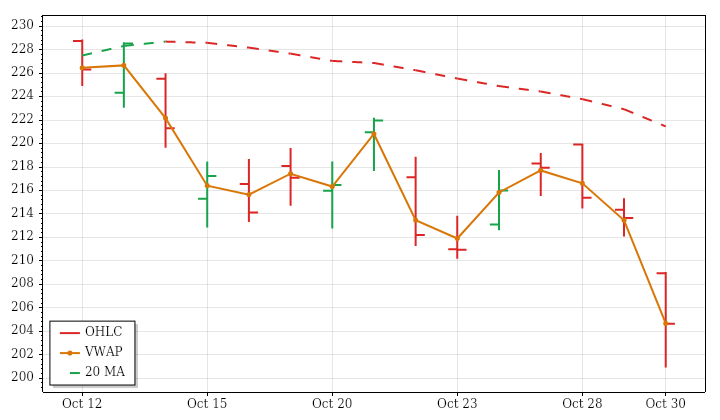
NVDA – Nvidia Technicals Summary
NVDA’s October 30 daily session closed at 204.64, down 4.22% from the prior close and 2.06% from the open. An unfilled opening gap down was followed by additional intraday losses. The lower high, lower low and close beneath the prior day’s low reinforced weakness, although the finish was almost level with session VWAP rather than materially below it.
Near- and intermediate-term downtrends are aligned, while the far-term picture is mixed because price has moved below a still-rising average. The latest decline therefore extends established shorter-horizon weakness without making every trend horizon bearish. Range was about 1.6 times average and volume about 1.75 times average, both contrasting with the preceding 15-session contraction in ranges and declining activity. PSAR is in a short state; a next-session high above 219.99 would conditionally trigger a long reversal.
Nvidia News and Fundamentals
Nvidia is reportedly discussing guarantees for billions of dollars in debt financing for Nscale’s planned Anthropic data center in West Virginia, according to The Information and Bloomberg. The talks have raised investor concerns about circular financing within the AI industry. Nvidia also announced a $3 billion investment in Meta’s share sale Tuesday. Separately, reports said a suspected Chinese intelligence asset developed a close relationship with CEO Jensen Huang while her employer purchased billions of dollars of Nvidia chips.
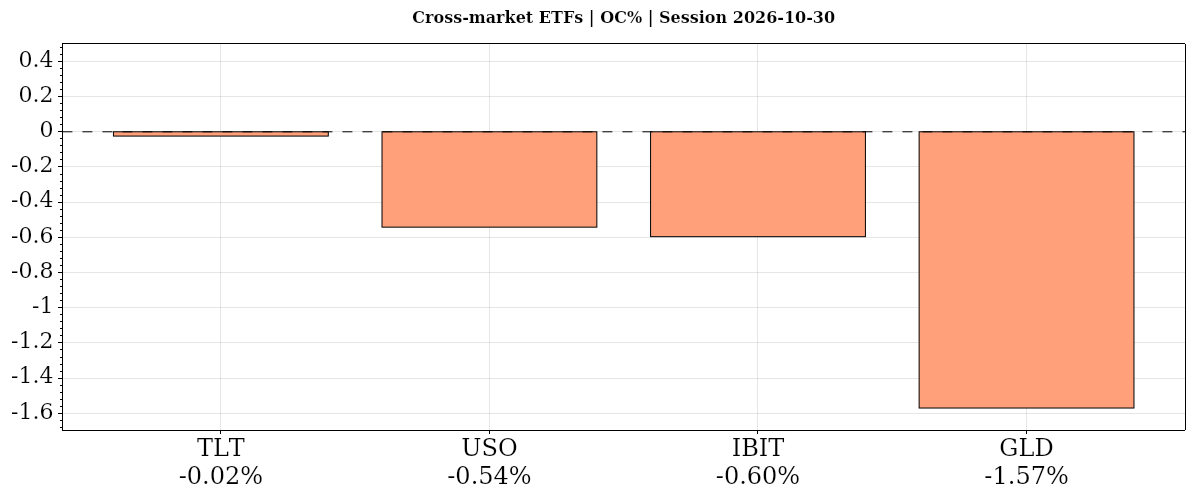
| Instrument | Bias | Date | DNC% | DOC% | O | H | L | C | VWAP | Vol |
|---|---|---|---|---|---|---|---|---|---|---|
| ▼ TLT | ▲ ▼ ▲ | 2026-10-30 | ▲ +0.43% | ▼ -0.02% | 81.86 | 82.03 | 81.38 | 81.84 | ▲ 81.66 | 40,593,142 |
| ▼ USO | ▲ ▼ ▼ | 2026-10-30 | ▲ +0.38% | ▼ -0.54% | 169.75 | 171.82 | 168.50 | 168.83 | ▼ 170.27 | 4,960,655 |
| ▼ IBIT | ▼ ▼ ▼ | 2026-10-30 | ▼ -5.14% | ▼ -0.60% | 43.62 | 44.10 | 43.02 | 43.36 | ▼ 43.47 | 119,406,069 |
| ▼ GLD | ▼ ▼ ▼ | 2026-10-30 | ▼ -3.47% | ▼ -1.57% | 361.45 | 361.68 | 354.67 | 355.78 | ▼ 357.28 | 16,103,205 |
| AVG/Sum | — | — | -1.95% | -0.68% | — | — | — | — | — | 181,063,071 |
Cross-Market ETFs
Negative confluence: average DOC% -0.68% from the open, DNC% -1.95% versus the prior close. All four declined from the open, TLT nearly flat and gold weakest; versus the prior close, bonds and oil rose against equities while bitcoin fell 5.14%. Gold’s decline aligned with downtrends across moving-average horizons.
TLT · D:2026-10-30 NC% ▲ +0.43% OC% ▼ -0.02%
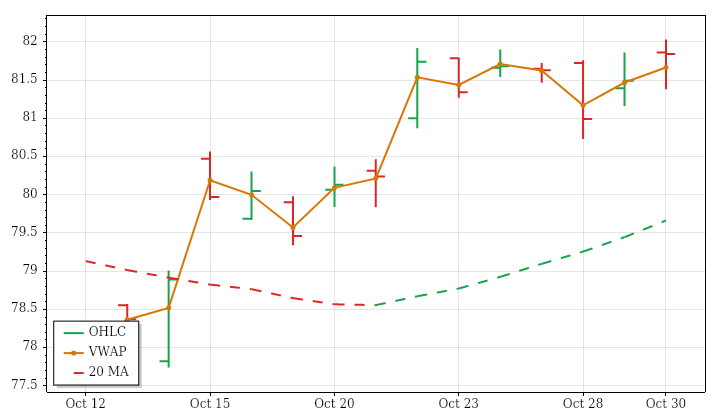
TLT – Long-Term Treasury Bonds Technicals Summary
TLT’s completed October 30 daily session closed at 81.84, up 0.43% from the prior close but down 0.02% from the open. The opening gap up was filled, yet price recovered enough to finish above session VWAP. A higher high and higher low supported the positive daily comparison, although the close remained inside the prior day’s range and nearly unchanged from the open.
Near-term strength contrasts with a falling far-term structure. Price is also above a still-declining intermediate benchmark, making that horizon mixed rather than a confirmed uptrend. The latest range was only slightly above average, consistent with expanding ranges over the preceding 15 sessions. Volume was moderately above average despite a declining lookback trend, and this was a third consecutive large-range session. PSAR is long; a next-session low below 80.73 would conditionally trigger a short reversal.
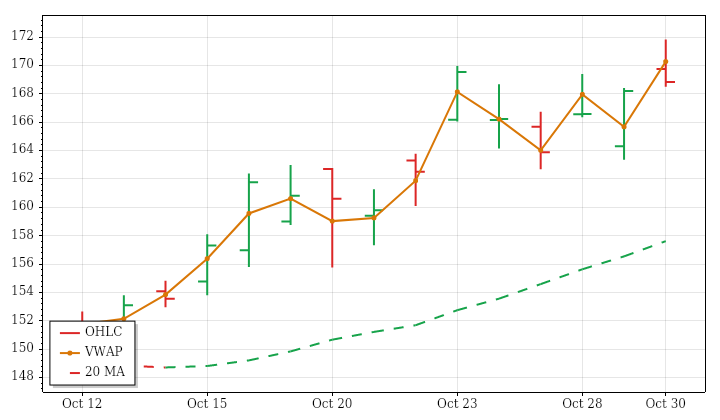
USO · D:2026-10-30 NC% ▲ +0.38% OC% ▼ -0.54%
USO – Oil Technicals Summary
USO’s completed October 30 daily session closed at 168.83, up 0.38% from the prior close but down 0.54% from the open. Its opening gap up remained unfilled, preserving a positive daily return despite intraday erosion. A higher high and higher low accompanied a close above the prior day’s high, but the finish below session VWAP and near the day’s low showed a softer ending.
Near-, intermediate- and far-term uptrends remain aligned, with price above rising averages across all three horizons. The latest intraday decline therefore contrasts with, rather than overturns, the broader upward structure. The session range was below average despite expanding ranges across the preceding 15 sessions, while volume was slightly above average alongside an increasing-volume trend. PSAR and the ATR-median trend remain bullish. A next-session low below 163.35 would conditionally trigger a PSAR short reversal.
Oil News and Fundamentals
Crude oil held near monthly highs after a tanker attack in the Strait of Hormuz renewed supply-risk concerns. Falling crude inventories also supported prices, although demand signals remained mixed. WTI approached $105–$106.50, while Brent traded between $108 and $117.
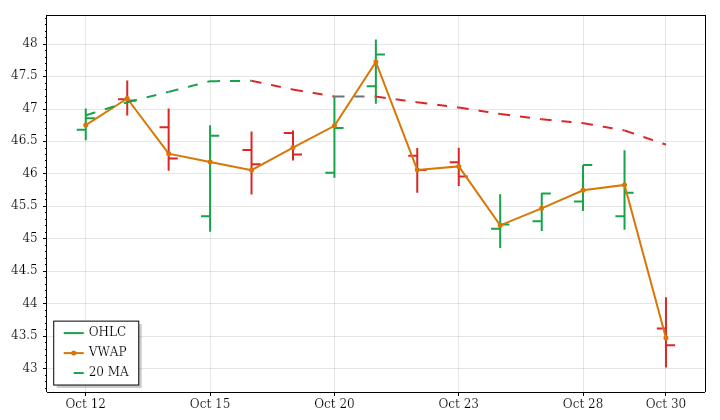
IBIT · D:2026-10-30 NC% ▼ -5.14% OC% ▼ -0.60%
IBIT – Bitcoin Technicals Summary
IBIT’s completed October 30 daily session closed at 43.36, down 5.14% from the prior close but only 0.60% from the open. Most of the daily loss therefore came through the opening gap down, which remained unfilled. Trading crossed both sides of the open before finishing below session VWAP and the prior day’s low, with the preceding outside-bar low also breached.
Near-term weakness contrasts with a rising far-term structure. The intermediate picture is mixed because price is below an average that still slopes upward. The latest range was above average, consistent with the preceding 15-session expansion in ranges, but volume surged to about 3.6 times average against a slightly declining volume trend. This marked a second consecutive large-range session rather than evidence of a completed recovery. A next-session high above 47.3826 would conditionally reverse bearish PSAR to long.
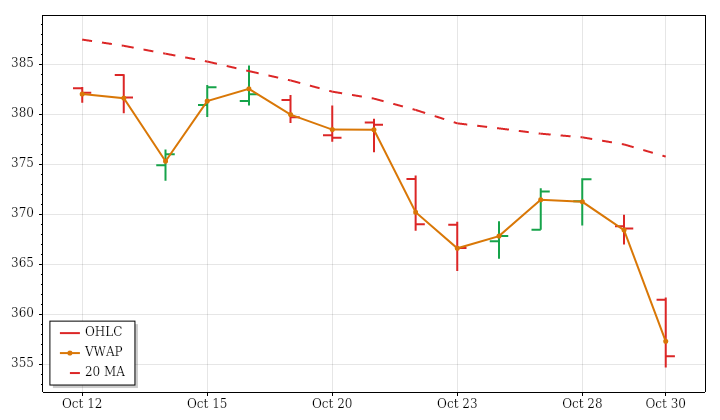
GLD · D:2026-10-30 NC% ▼ -3.47% OC% ▼ -1.57%
GLD – Gold Technicals Summary
GLD’s completed October 30 daily session extended weakness across all three trend horizons. It closed at 355.78, down 3.47% from the prior close and 1.57% from the open. An unfilled opening gap down accounted for part of the loss, with further selling leaving price below session VWAP and the prior day’s low. The close was only 0.31% above the supplied 52-week low.
Near-, intermediate- and far-term averages are all falling, with price below each, so the latest session aligns with the broader bearish structure. Both the daily range and volume were approximately twice their prior 15-session averages. Unlike a temporary expansion against quieter conditions, those readings accompanied already-expanding ranges and increasing volume over the lookback. PSAR and the ATR-median trend also remain bearish. A next-session high above 374.8918 would trigger a conditional PSAR long reversal, not an already-established recovery.
Gold News and Fundamentals
Gold fell below $4,000 an ounce on Oct. 30 and reached its lowest price in a year. Persistent inflation and elevated real yields were reported as pressures on prices. The decline occurred despite renewed concerns about potential Middle East attacks following the U.S. midterm elections on Tuesday.
Glossary: Instrument — ticker symbol; hover for the instrument or company name; Date — session date. DNC% — prior-session close to this session’s close; DOC% — daily session open-to-close percentage change. O — open; H — high; L — low; C — close, all for the table’s daily or weekly session; VWAP — volume-weighted average price; its arrow shows whether the close is above or below VWAP. Vol — period trading volume.
Bias — three directional readings, in order: DNC%, DOC%, then VWAP. ▲ positive/above; ▼ negative/below; — neutral or unavailable. Matching arrows show alignment; opposing arrows show mixed conditions. AVG/Sum — simple average of percentage changes and sum of reported volumes.
Futures Session Fib Grid Analysis – Snapshot
Session Fib Grids normalise market positioning as percentages, making direction and alignment comparable across different asset types.
Latest available snapshot for each instrument; Time(CT) shows the individual update date and time.
| Instrument | Bias | Time(CT) | YSFG | MSFG | WSFG | RSFG | SFG | TSI |
|---|---|---|---|---|---|---|---|---|
| ▲ YM | ▲ ▲ ▲ ▲ ▲ ▼ | 2026-11-02 11:58:22 | ▲ +33 | ▲ +16 | ▲ +31 | ▲ +23 | ▲ +23 | ▼ -29 |
| ▲ EMD | ▲ ▲ ▲ ▲ ▲ ▲ | 2026-11-02 11:58:13 | ▲ +41 | ▲ +28 | ▲ +47 | ▲ +47 | ▲ +47 | ▲ +67 |
| ▲ FDAX | ▲ ▲ ▲ ▲ ▲ ▲ | 2026-11-02 11:57:57 | ▲ +29 | ▲ +11 | ▲ +17 | ▲ +54 | ▲ +39 | ▲ +88 |
| ▲ NKD | ▲ ▲ ▲ ▲ ▼ ▼ | 2026-11-02 11:56:45 | ▲ +153 | ▲ +9 | ▲ +17 | ▲ +50 | ▼ -8 | ▼ -76 |
| Instrument | Bias | Time(CT) | YSFG | MSFG | WSFG | RSFG | SFG | TSI |
|---|---|---|---|---|---|---|---|---|
| ▼ BTC | ▼ ▼ ▼ ▼ ▼ ▼ | 2026-11-02 11:57:25 | ▼ -49 | ▼ -4 | ▼ -14 | ▼ -19 | ▼ -24 | ▼ -138 |
| ▲ GC | ▼ ▲ ▲ ▲ ▲ ▲ | 2026-11-02 11:58:26 | ▼ -153 | ▲ +18 | ▲ +42 | ▲ +101 | ▲ +14 | ▲ +109 |
| ▼ 6E | ▼ ▲ ▲ ▼ ▼ ▼ | 2026-11-02 11:57:52 | ▼ -56 | ▲ +21 | ▲ +43 | ▼ -18 | ▼ -22 | ▼ -23 |
| ▼ ZB | ▼ ▲ ▲ ▼ ▼ ▲ | 2026-10-21 09:39:59 | ▼ -39 | ▲ +77 | ▲ +6 | ▼ -3 | ▼ -2 | ▲ +29 |
Glossary: YSFG — yearly; MSFG — monthly; WSFG — weekly; RSFG — regular trading hours (RTH); SFG — the current session, including pre-market or other sessions. TSI indicates trend strength and power.
Bias shows trend alignment across these six readings. The arrows follow the column order: YSFG, MSFG, WSFG, RSFG, SFG and TSI. Matching arrows show alignment; opposing arrows show mixed conditions.
Futures Higher Time Frame Analysis
Summary of the current state of US Indices Futures based on higher time-frame (HTF) technical analysis as of: 2026-11-02 11:55 -06:00 CT.
US Indices Futures
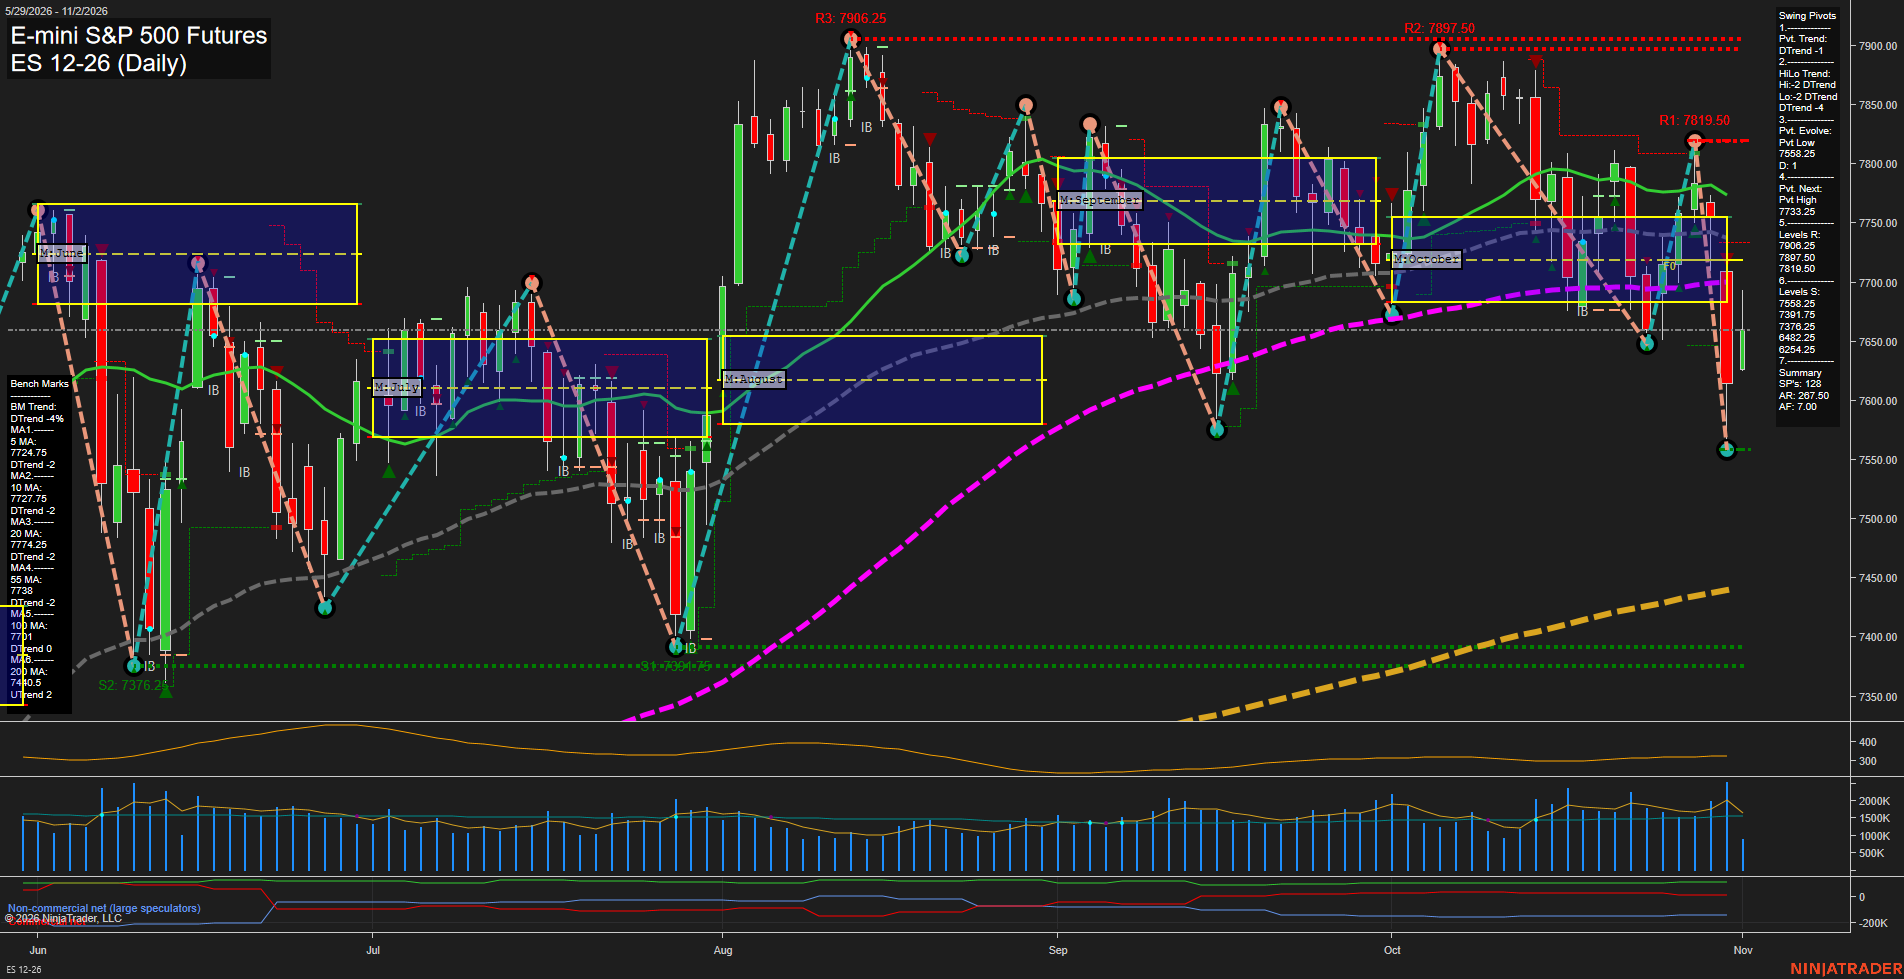
- ES YSFG/MSFG upward, rising 55/100/200-period benchmarks, below declining 5/10/20-period benchmarks, pivot support 7558.25, resistance 7874.75–7906.25.
- NQ short/intermediate pivots DTrend, below 5/10/20/55/100-day benchmarks, rising 200-day benchmark, support 28220.75–28232.75, pivot-reversal threshold 29463.25.
- YM YSFG/MSFG upward, rising weekly 55/100/200-period benchmarks, daily pivots DTrend, support 51700/50859, daily resistance 52961–53168, weekly reversal 53223.
- EMD above WSFG/MSFG/YSFG F0%, weekly HiLo UTrend, daily pivots upward, declining daily benchmarks overhead 3782–3868, support 3600–3604, resistance 3739/3793.5/3825.
- RTY above WSFG/MSFG/YSFG references, weekly HiLo UTrend, daily pivots upward, above rising daily 10/20 benchmarks, resistance 2869–2888.9/3101.8, support 2723.3.
- FDAX WSFG/MSFG/YSFG aligned upward, daily pivots UTrend, above six rising daily benchmarks, weekly pivots DTrend, resistance 26246/26255/26844–26847, support 25560/25119/24897–24925.
Overall State
- Short-Term: Neutral
- Intermediate-Term: Neutral
- Long-Term: Bullish
Conclusion
Weekly YSFG/MSFG structures and rising longer-period benchmarks retain a broadly bullish framework, while daily and weekly signals diverge. ES, NQ, and YM retain short-term downswings; EMD and RTY show daily pivot recoveries, and FDAX holds daily UTrends despite its weekly downswing. NQ shows the broadest short/intermediate benchmark weakness, while FDAX has the strongest daily benchmark alignment. EMD and RTY recoveries remain bounded by overhead benchmark and pivot resistance. These directional differences leave short- and intermediate-term alignment mixed within the broader weekly uptrend.
Note: Intra-day counter-trend pullbacks or retracements may occur, HTF is context for informational usage and market structure. Glossary: Session Fib Grids periods of YSFG:’Yearly’, MSFG:’Monthly’, WSFG:’Weekly’
For full details visit: AlphaWebTrader Technicals
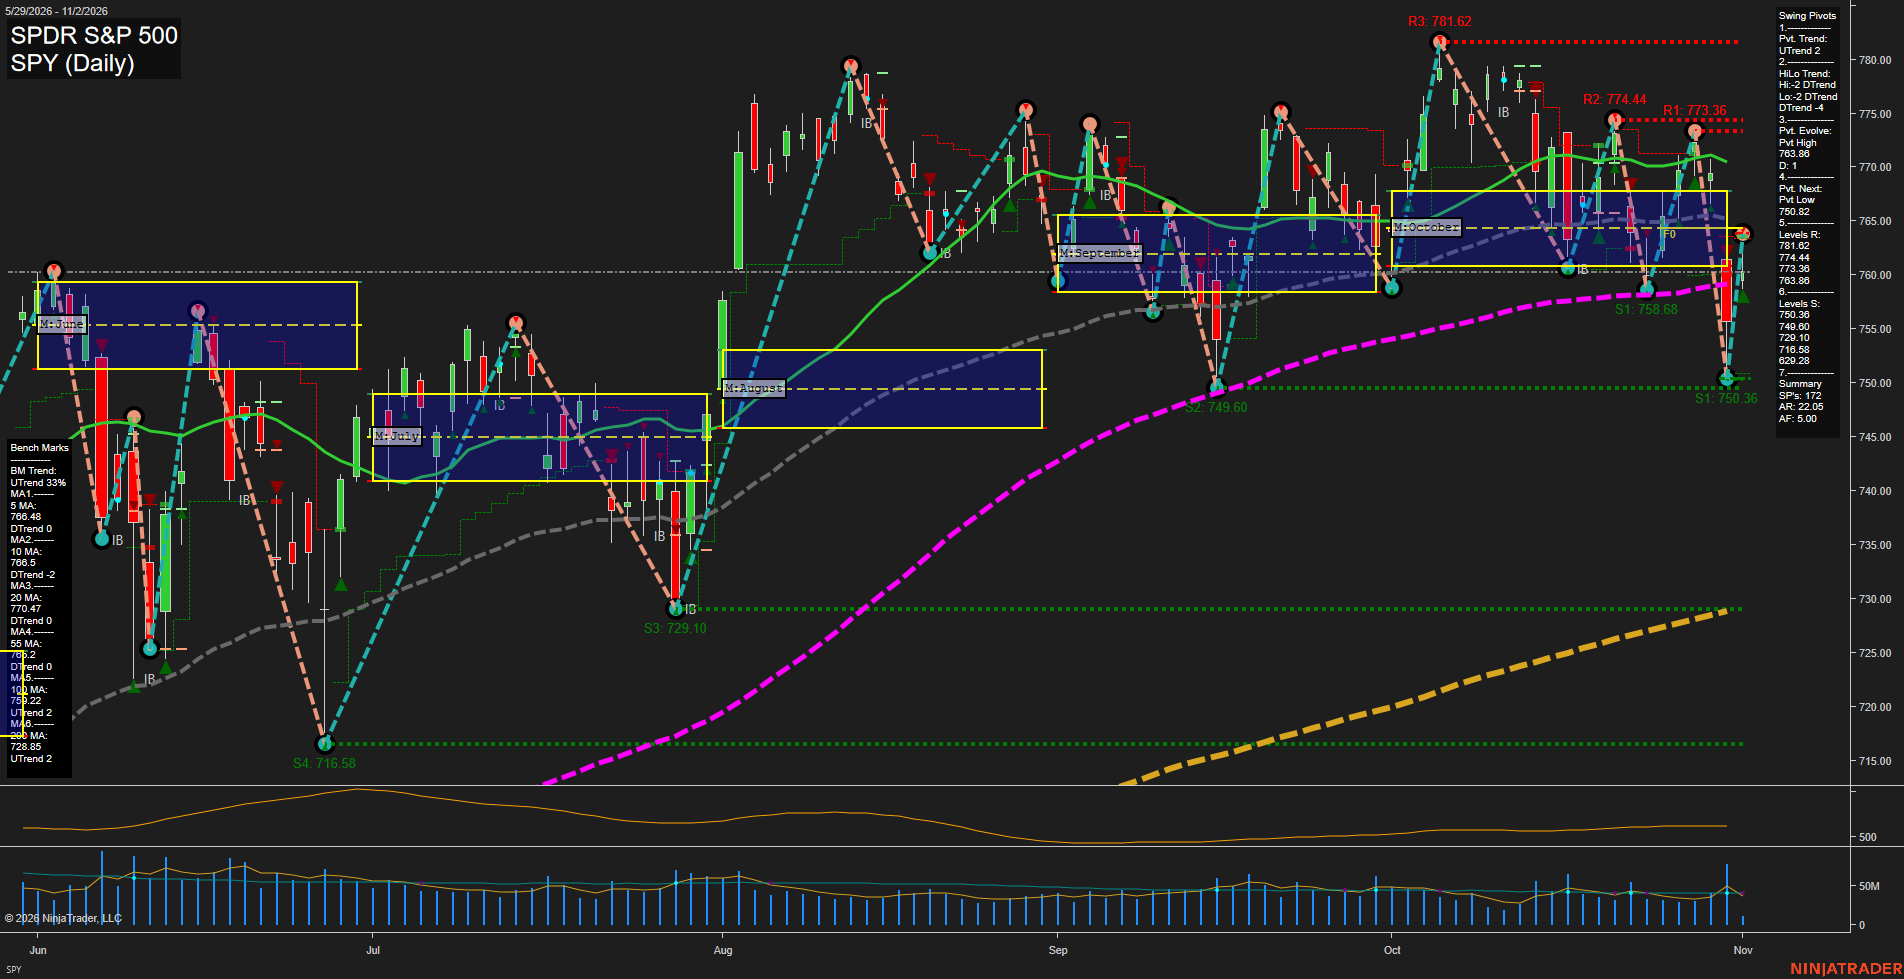
SPY Daily View
Overall Rating
- Short-Term: Neutral
- Intermediate-Term: Neutral
- Long-Term: Bullish.
Key Insights Summary
SPY futures-equivalent price action shows a large V-style rebound from the 750.36 support area back to 763.88, returning to the monthly and weekly F0% balance zone. The short-term pivot structure remains in UTrend, but price is still beneath declining 5, 10, 20, and 55-day benchmarks, leaving the near-term structure rotational and choppy. The 763.88 to 774.44 area contains layered pivot and moving-average resistance, while 758.68 and 749.60 define the nearest swing-support sequence. The broader futures swing backdrop remains constructive because price holds above rising 100-day and 200-day benchmarks, although the current rebound is occurring within an intermediate-term consolidation rather than a confirmed momentum expansion.
View charts on: AlphaWebTrader HTF Charts
ES Daily View
View charts on: AlphaWebTrader HTF Charts
QQQ Daily View
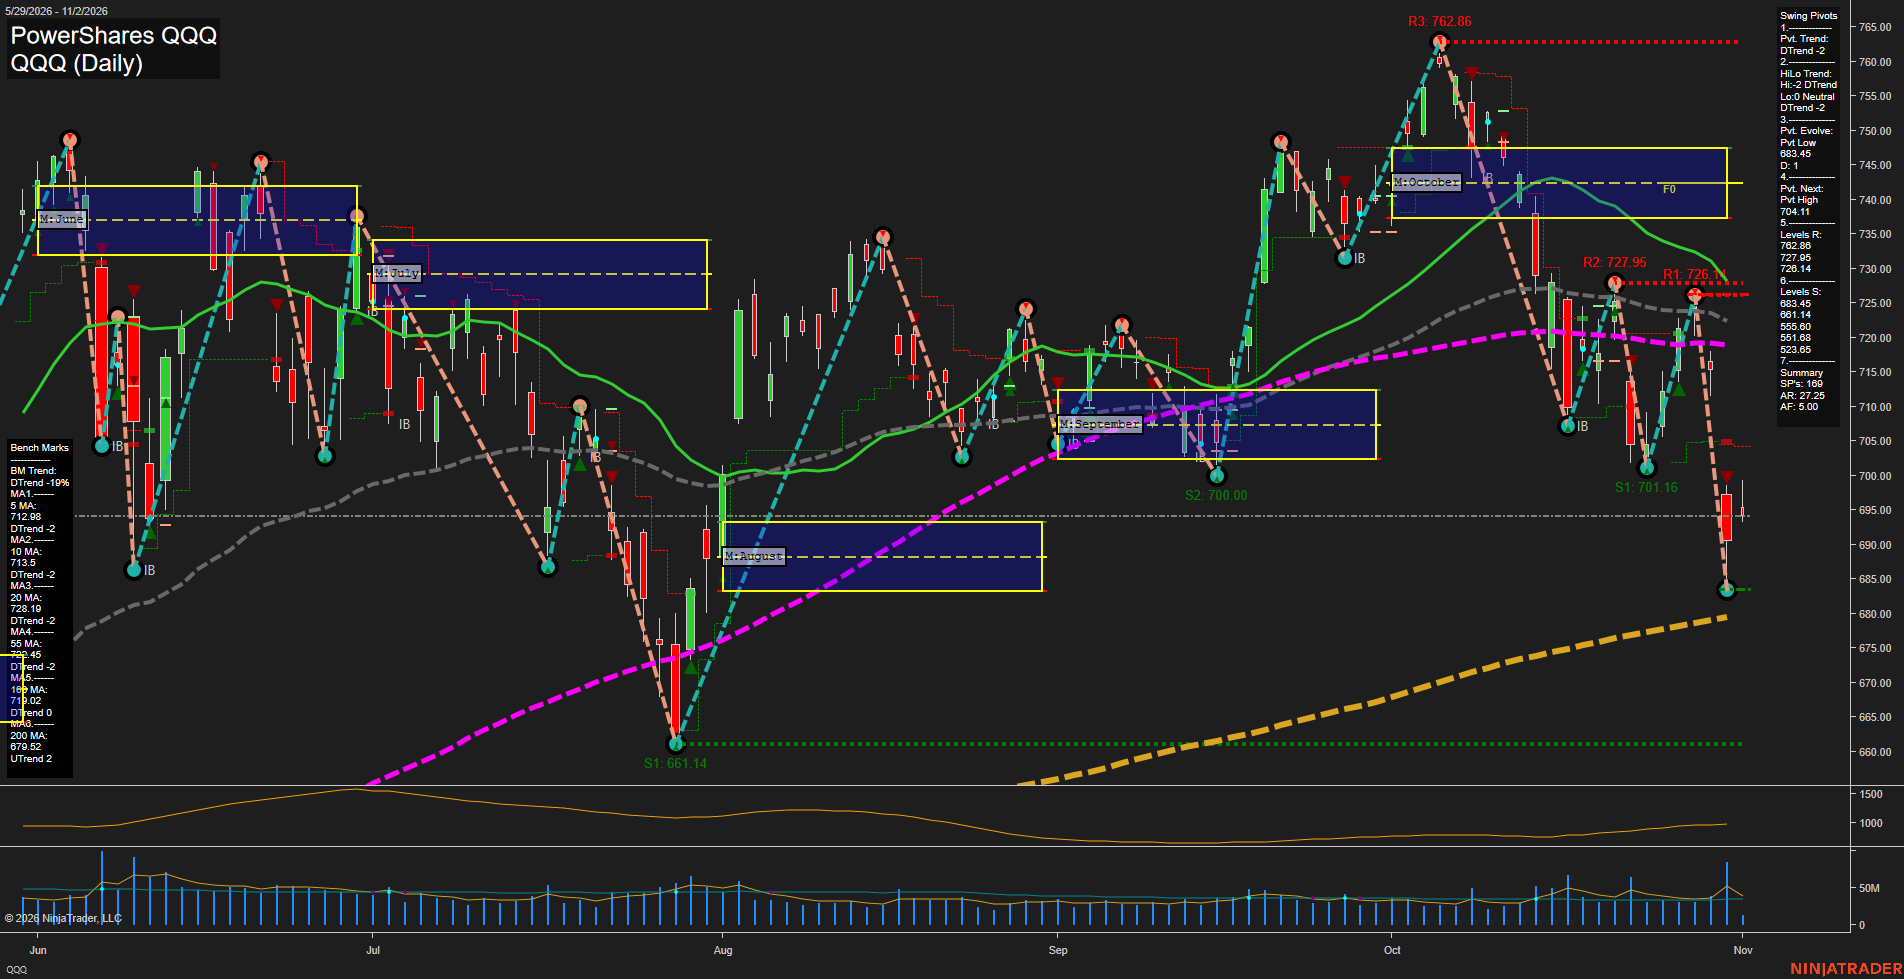
Overall Rating
- Short-Term: Bearish
- Intermediate-Term: Bearish
- Long-Term: Neutral.
Key Insights Summary
QQQ futures-equivalent swing structure is decisively lower across the short and intermediate horizons: price is beneath the declining 5, 10, 20, 55, and 100-day benchmarks, while the pivot sequence remains DTrend with lower highs and a fresh 683.45 pivot low. The rapid decline from the 726-728 resistance cluster has expanded daily range and momentum, with 704.11 defining the nearest opposing pivot level. The 683.45 area is the immediate structural reference, followed by 661.14 support; the still-rising 200-day average near 679.52 preserves a neutral longer-cycle backdrop despite the current corrective downswing.
View charts on: AlphaWebTrader HTF Charts
NQ Daily View
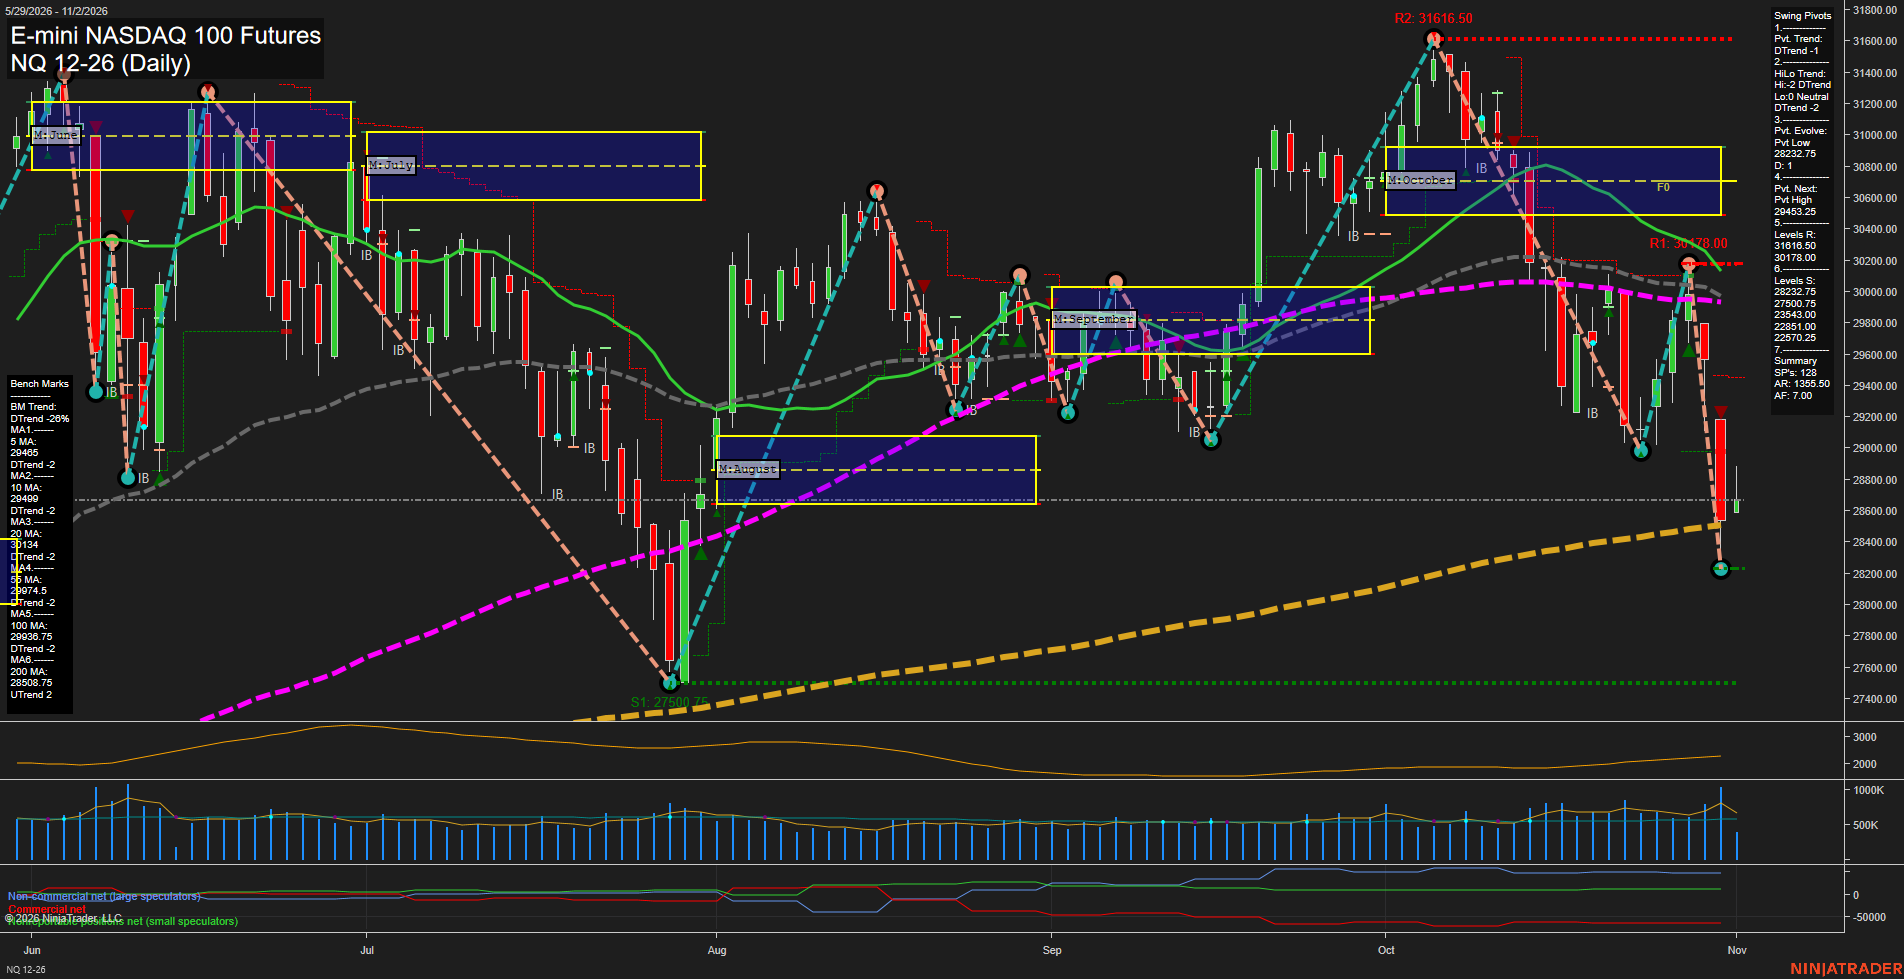
Overall Rating
- Short-Term: Bearish
- Intermediate-Term: Bearish
- Long-Term: Bullish.
Key Insights Summary
Price action has shifted into a fast, large-range downswing, with the active short-term pivot trend and intermediate HiLo structure both in DTrend. The decline has pushed price beneath the 5, 10, 20, 55, and 100-day benchmarks, confirming broad downside alignment across the short and intermediate horizons. The 28220.75 pivot low and nearby 28232.75 support define the current downswing floor, while 29463.25 is the reversal threshold for a new short-term pivot high. The 200-day average remains upward sloping and sits near current price, preserving a constructive longer-term backdrop despite the sharp countertrend liquidation from the October high.
View charts on: AlphaWebTrader HTF Charts
USO Daily View
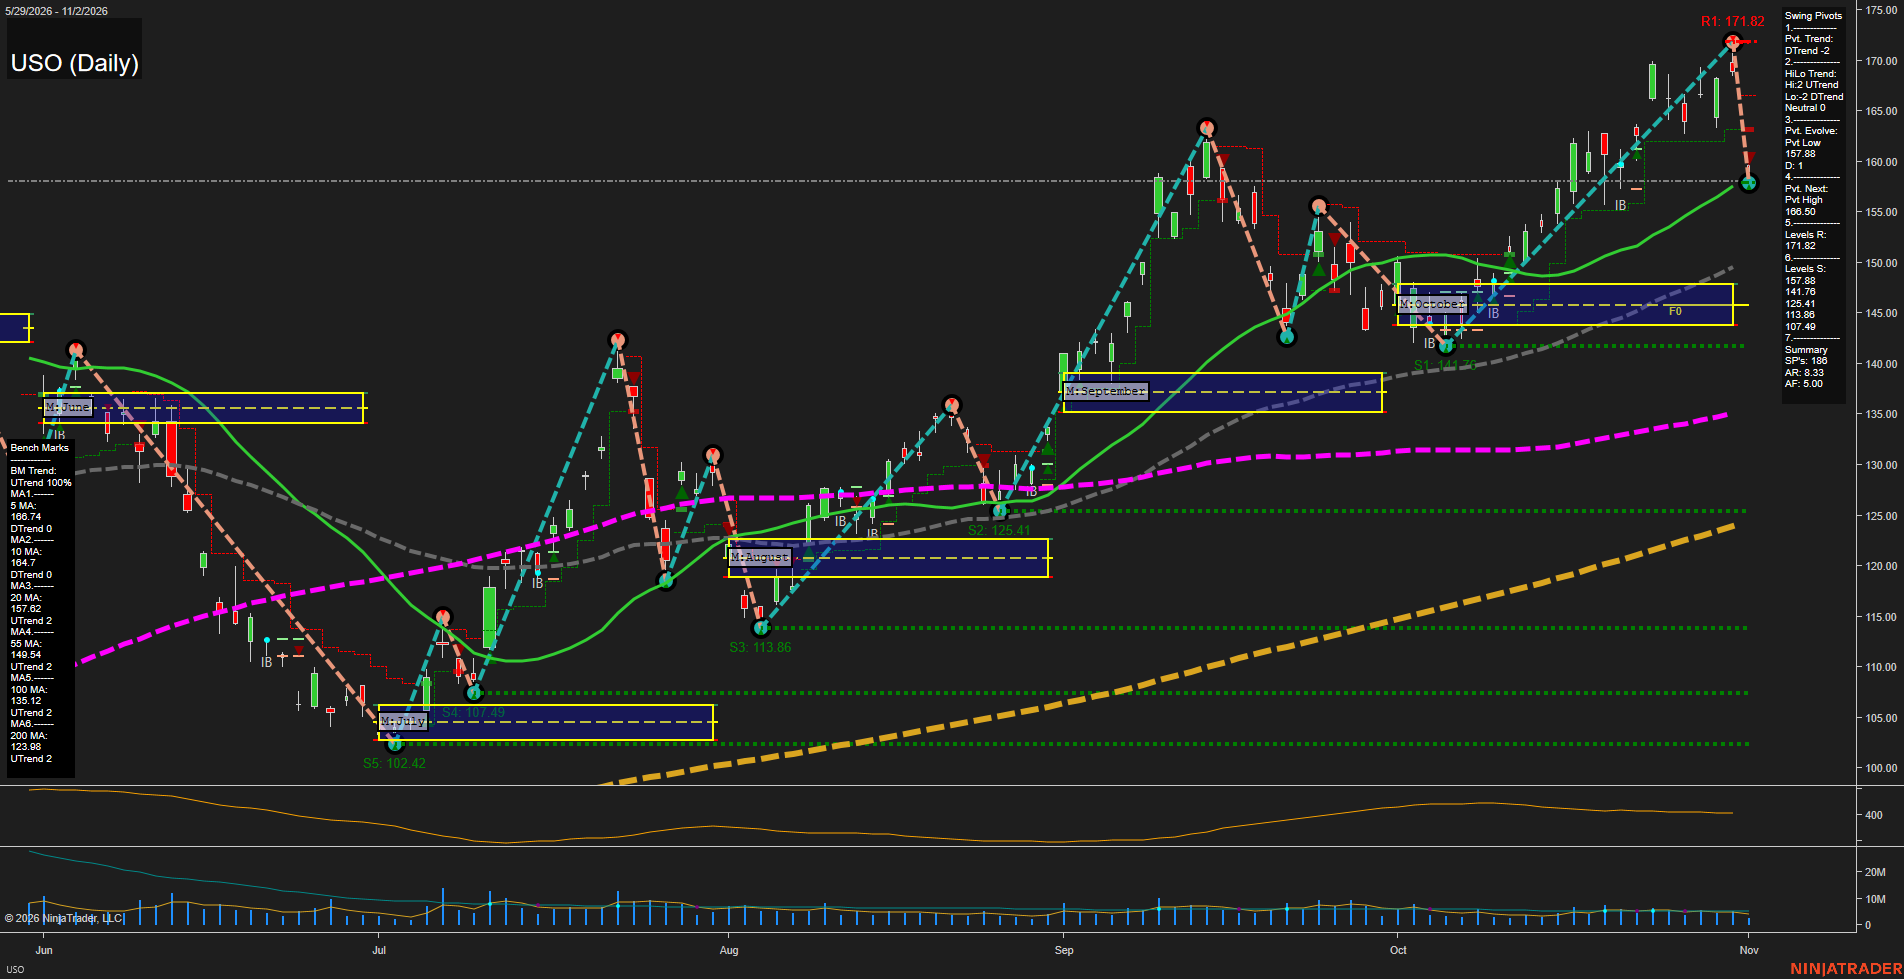
Overall Rating
- Short-Term: Bearish
- Intermediate-Term: Bullish
- Long-Term: Bullish.
Key Insights Summary
USO remains within a broad daily uptrend, supported by rising 20-, 55-, 100-, and 200-day benchmarks and an intermediate pivot structure that remains UTrend. The latest large downside bar reversed sharply from the 171.82 swing-high resistance area and shifted the short-term pivot condition to DTrend, with price now below the declining 5- and 10-day averages. The 157.38 pivot low and rising 20-day average form the immediate technical balance area, while 160.59 marks the next pivot reversal threshold. The November monthly grid remains below current price, preserving a bullish intermediate-term location despite the near-term pullback and elevated daily volatility.
View charts on: AlphaWebTrader HTF Charts
CL Daily View
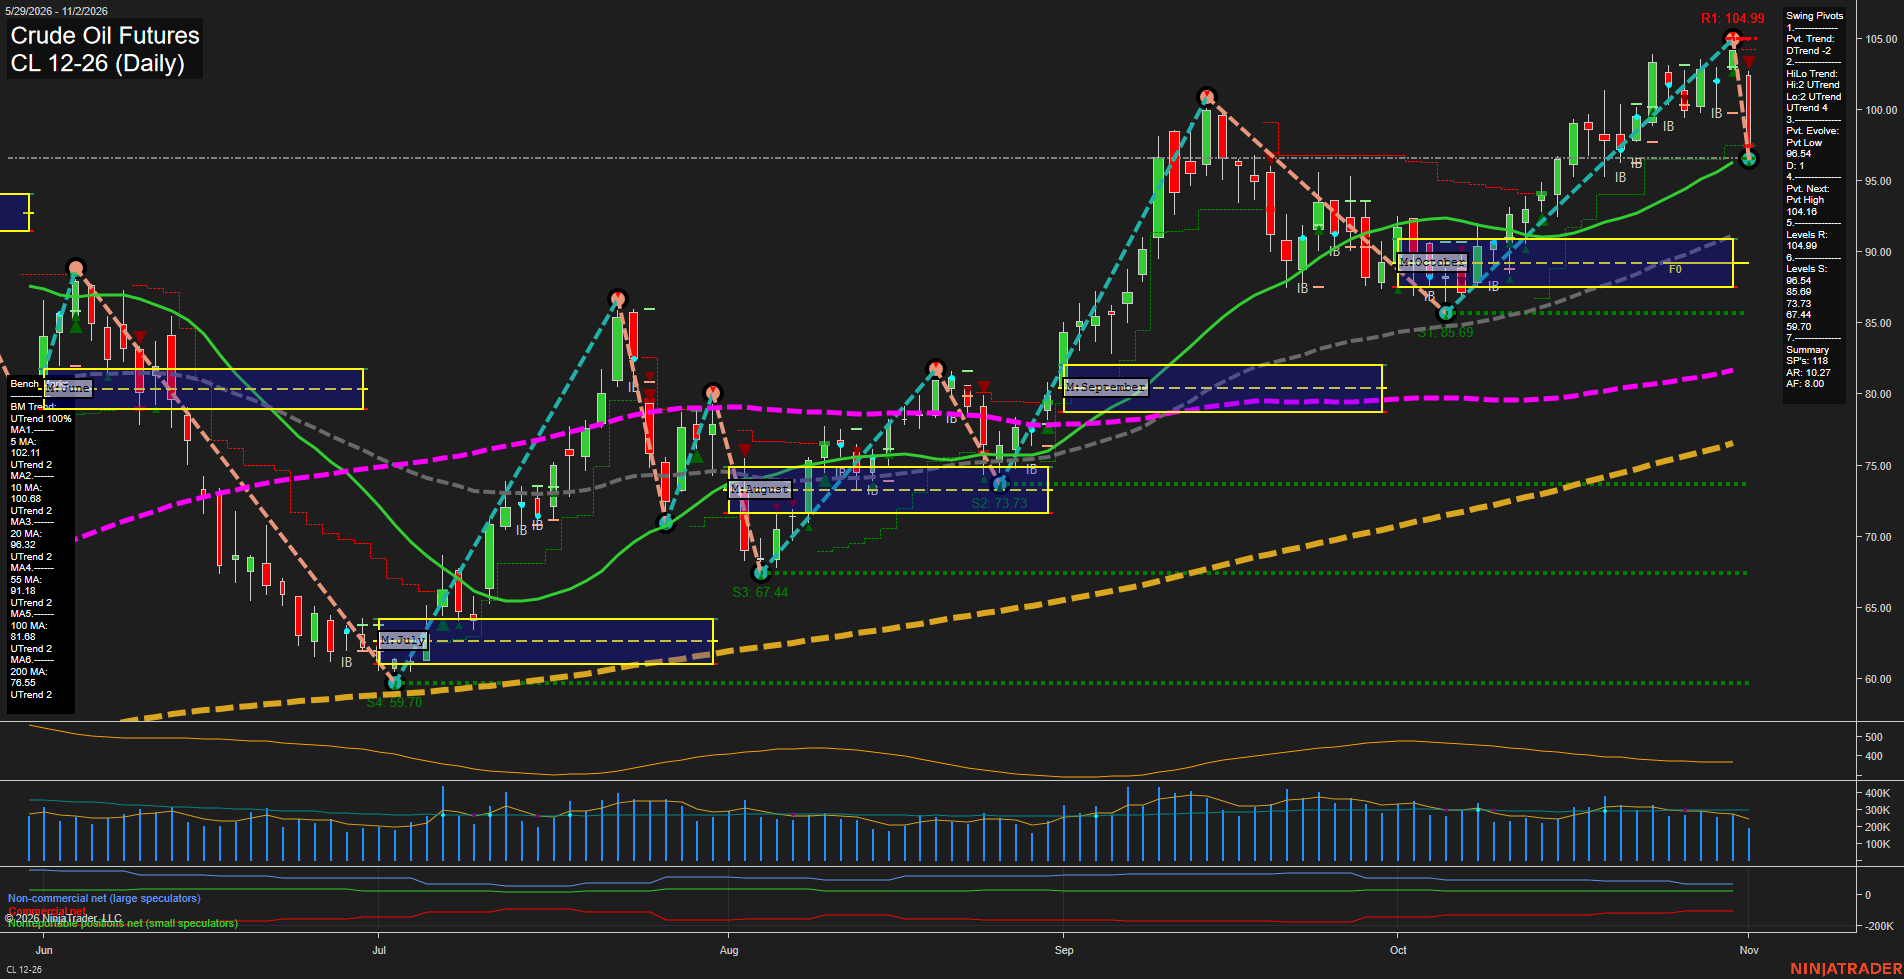
Overall Rating
- Short-Term: Bearish
- Intermediate-Term: Neutral
- Long-Term: Bullish.
Key Insights Summary
Price action has shifted sharply lower from the 104.99 resistance area, producing a large-range decline and a short-term DTrend pivot structure. The decline has pushed price beneath the 5, 10, and 20-day benchmarks and below the weekly and monthly Fib-grid bias levels, confirming fast bearish swing momentum. The broader structure remains constructive because the HiLo pivot trend is up and price remains above the rising 55, 100, and 200-day averages. The 96.54 pivot low is the immediate structural support, while
View charts on: AlphaWebTrader HTF Charts
GLD Daily View
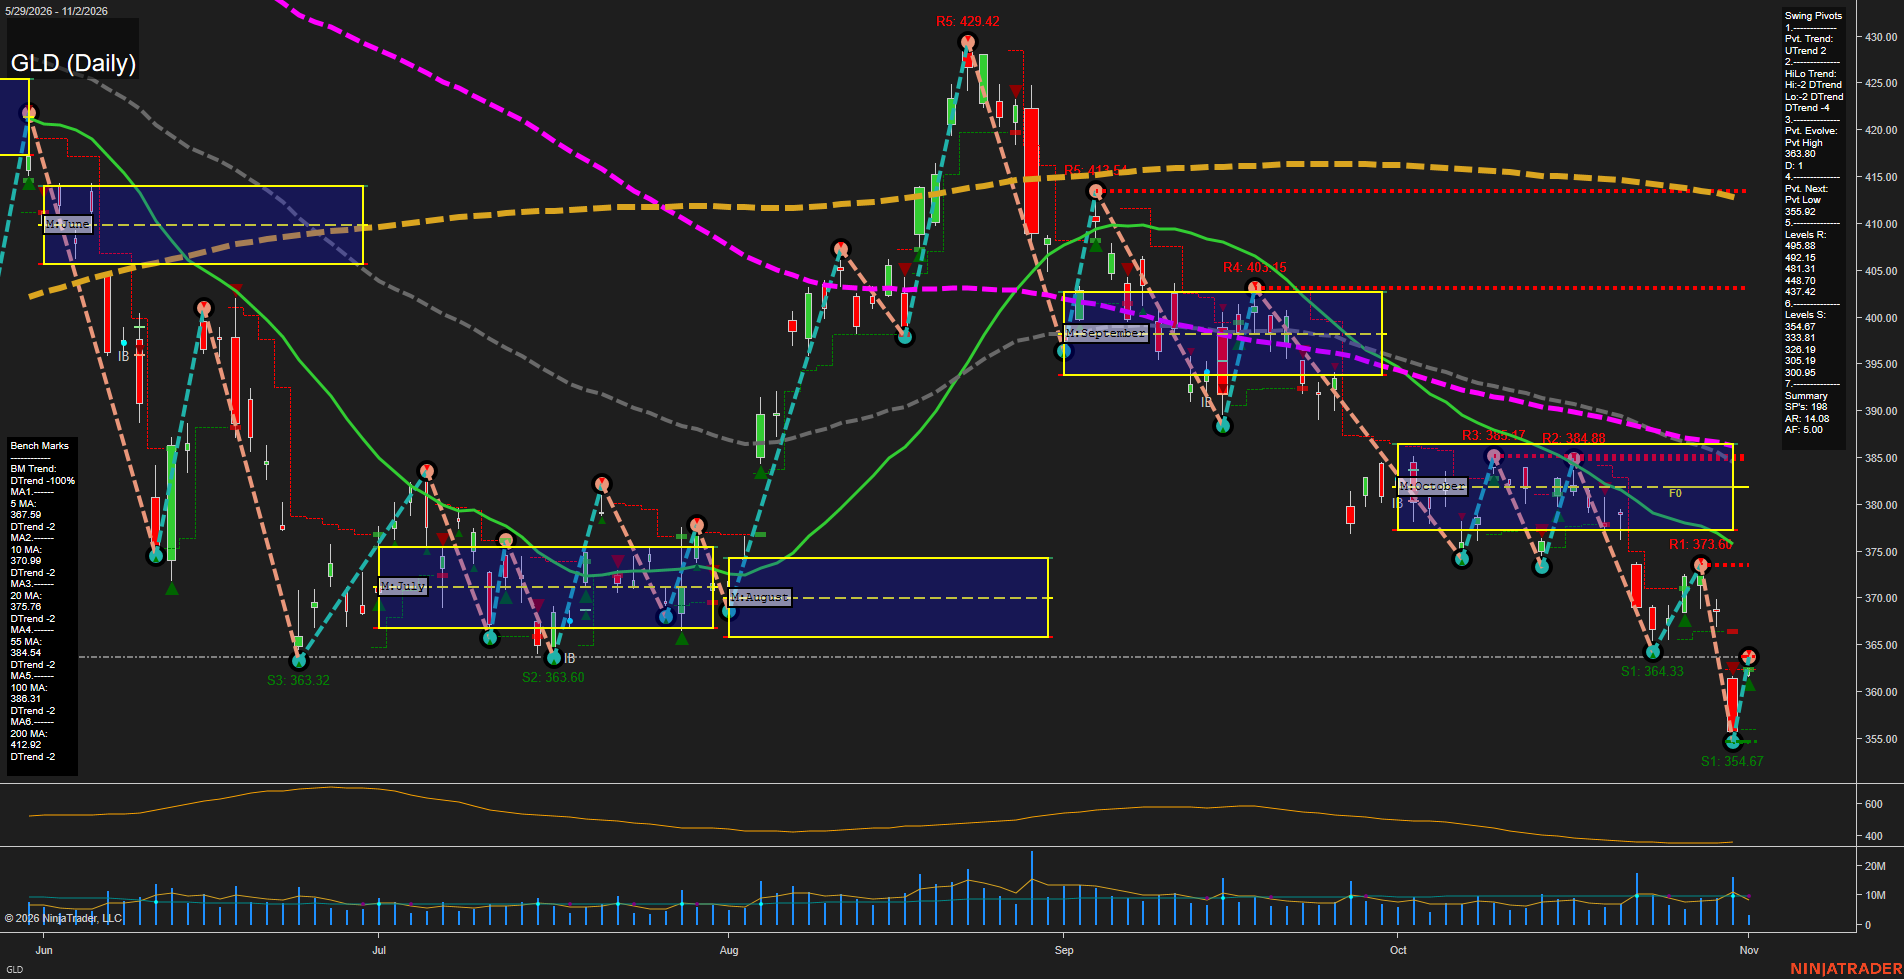
Overall Rating
- Short-Term: Bearish
- Intermediate-Term: Bearish
- Long-Term: Bearish.
Key Insights Summary
GLD reflects a futures-style bearish trend structure: price is below every tracked benchmark, with the 5/10-day averages declining and the intermediate and long-term moving-average stack materially overhead. The short-term pivot remains UTrend following the rebound from 354.67, but the broader HiLo DTrend and the latest rejection beneath the 373.66 pivot resistance characterize that rebound as a countertrend bounce within a larger selloff. Price is compressing near 364.67 support after a fast decline; a break below this area would maintain the lower-high/lower-low sequence, while the nearest meaningful overhead pivot level is 373.66, followed by the October grid and 384.88 area. Volatility remains elevated relative to the recent consolidation, consistent with an active directional futures market rather than a stable basing pattern.
View charts on: AlphaWebTrader HTF Charts
GC Daily View
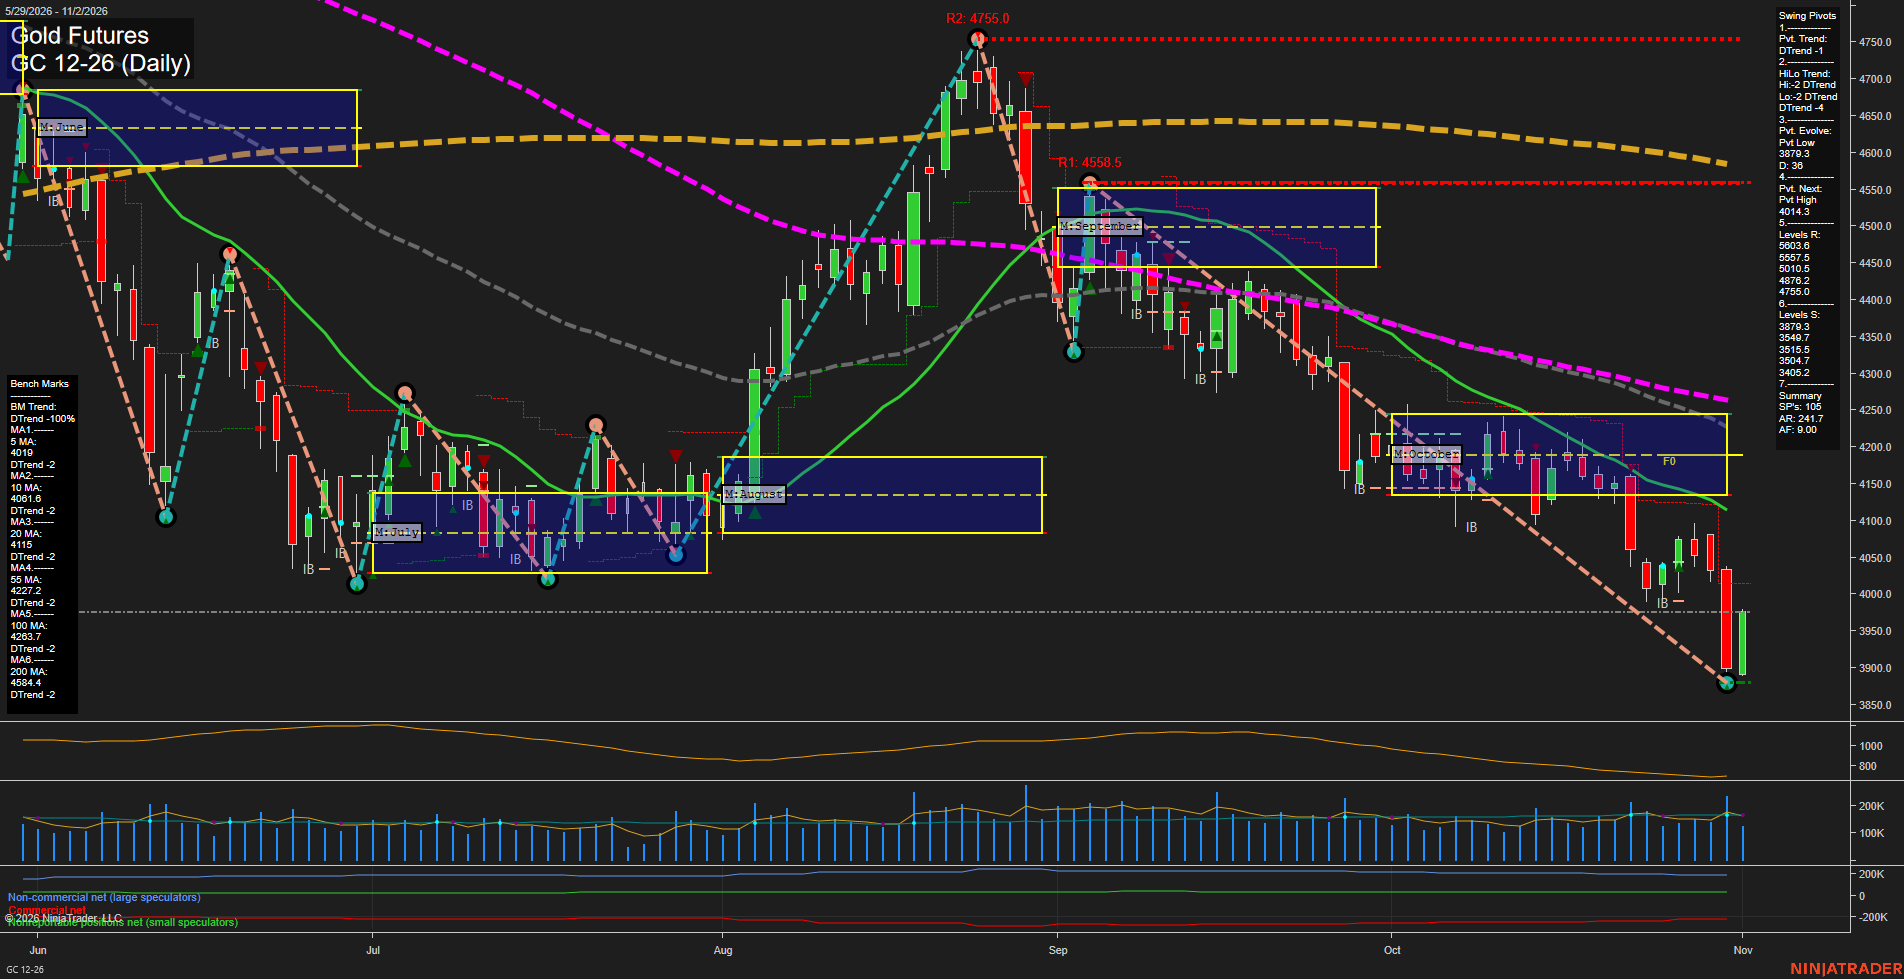
Overall Rating
- Short-Term: Bearish
- Intermediate-Term: Bearish
- Long-Term: Bearish.
Key Insights Summary
GC has extended its decline from the late-August peak, producing lower highs and lower lows while trading beneath every daily benchmark. The latest rebound from the 3879.3 pivot low is a sharp counter-trend bounce, but price remains below the 5-day and 10-day averages and the next pivot threshold at 4014.3. Weekly and monthly Fib-grid readings remain above their F0% levels, indicating an oversold recovery phase within the broader daily downtrend. Elevated range expansion and large recent bars reflect a volatile, fast-momentum environment, with 4014.3 and the clustered 4019.0-4061.6 short-term averages defining the nearest overhead technical zone.
View charts on: AlphaWebTrader HTF Charts
ZB Daily View
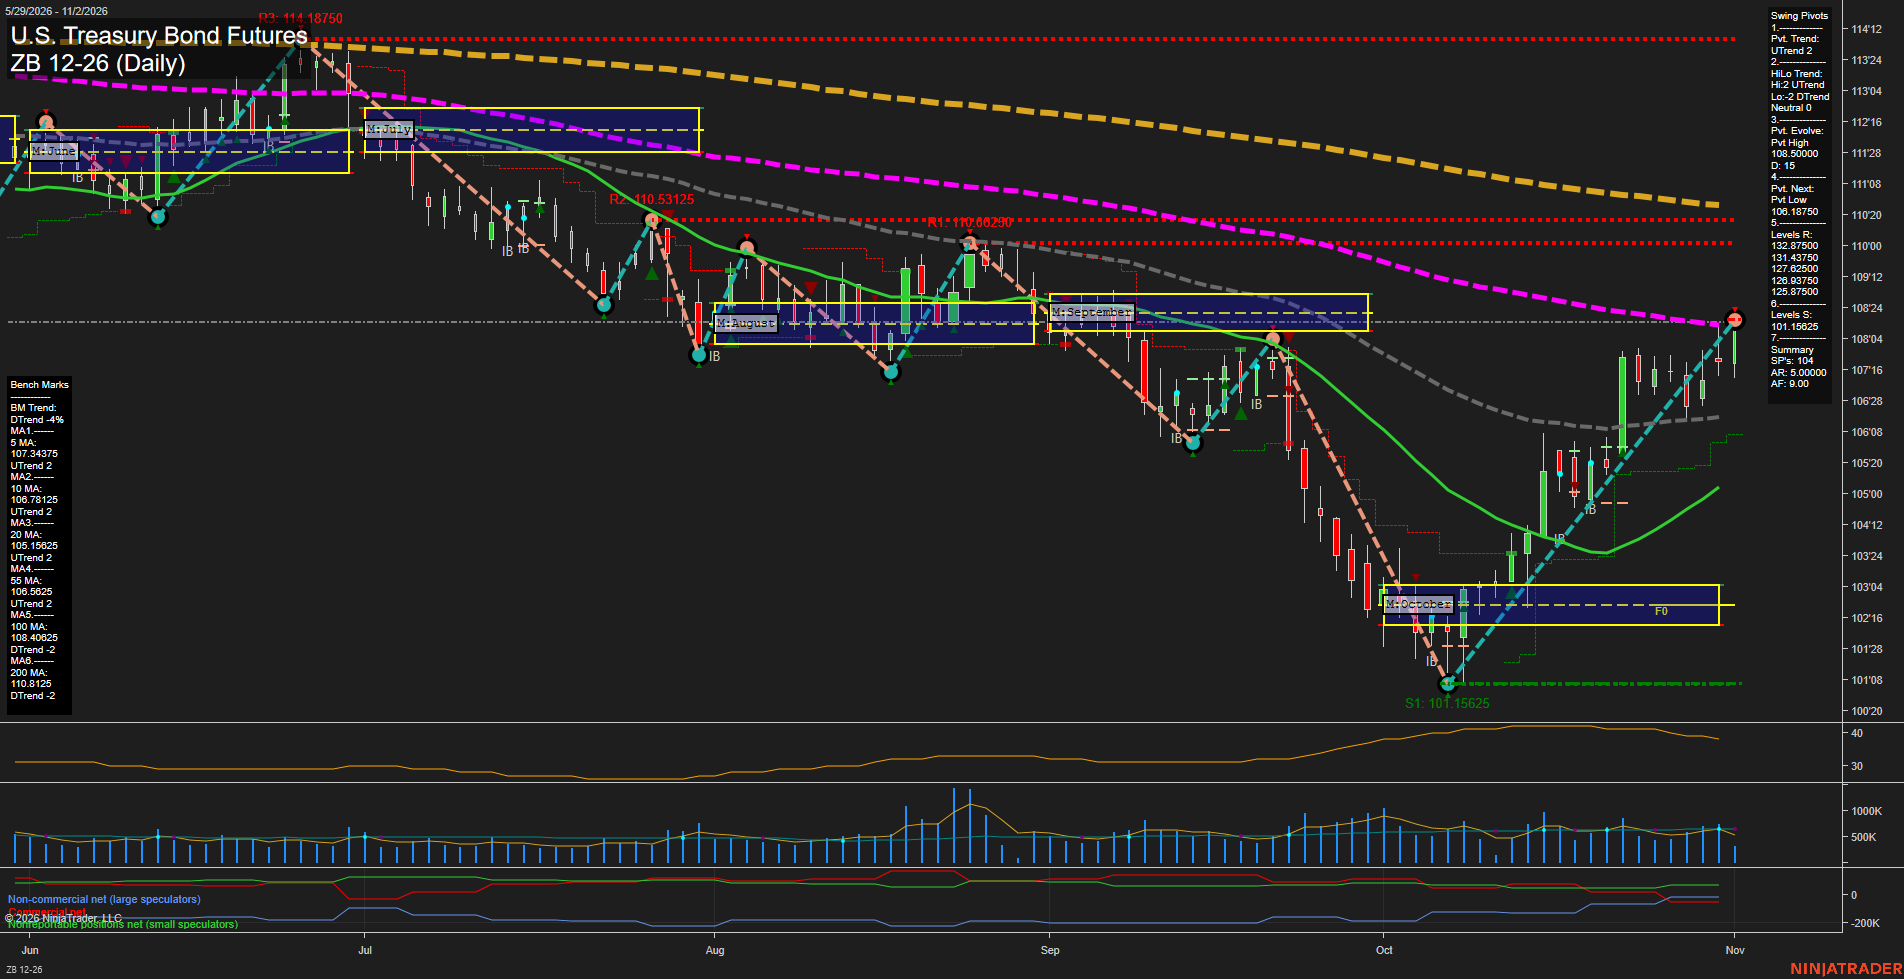
Overall Rating
- Short-Term: Bullish
- Intermediate-Term: Bullish
- Long-Term: Bearish.
Key Insights Summary
The daily structure reflects a strong recovery leg from the October low, with higher lows, an active UTrend pivot condition, and price holding above the rising 5, 10, 20, and 55-day benchmarks. The advance has reached the evolving 108.50000 pivot-high area and remains beneath the declining 100-day benchmark, leaving the broader yearly structure in a downtrend. Weekly and monthly Fib-grid positioning are positive, while the long-term moving-average alignment and yearly grid describe the current rally as an intermediate countertrend recovery within a still-bearish major trend.
View charts on: AlphaWebTrader HTF Charts
Sentiment Summary: Coverage is predominantly neutral (46%), with positive (27%) and negative (27%) sentiment nearly balanced as November 2 futures rebounded after the October 30 technology selloff. Strong cloud growth, Amazon’s reported 5% gain and technology upgrades supported the recovery, while AI capital spending, weakening free cash flow and fresh borrowing remained the main counterweight. Oil fell on reports of further U.S.–Iran diplomacy, and October ISM manufacturing expanded to 55.5 from 54.5; Apple and Palantir earnings remain scheduled after today’s close.
Conclusion: Index context remains a technology-led rebound ahead of major earnings and the November 3 midterm elections.