Monday’s Fed speeches and 1 p.m. ET Treasury note auction open the week as stock futures show bearish near-term trends within bullish weekly structures.
Fundamentals: Monday opens the coming week with Fed speeches at 8:40 a.m., 10 a.m. and 12:15 p.m. ET, bill auctions at 11:30 a.m. and 1 p.m., and a three-year note auction at 1 p.m. Tuesday’s CPI and Friday’s PPI are due at 8:30 a.m. ET. Treasury supply also includes Tuesday’s 10-year note and Thursday’s 30-year bond auctions. Thursday brings jobless claims and housing data, while MARA Holdings reports Monday after the close.
Technicals: Stock index futures enter the coming week with bearish near-term trends after sharp, volatile declines. S&P 500 and Nasdaq futures remain below key daily averages, with support references near 7,322–7,325 and 26,368.50, respectively. Longer-term weekly structures remain bullish across the major indexes, but Russell 2000 futures carry bearish ratings across all daily time horizons. DAX futures also show a near-term pullback within a broader bullish trend.
Market Week Ahead – Trading 360° view Market Radar for: holidays, earnings, eco-news, and ETF SPY S&P500, QQQ Tech, USO Oil, GLD Gold Weekly Chart analysis
As of: November 8, 2026 06:15 CT
Weekly Earnings Radar
Monitoring for earnings releases by the Magnificent 7, AI-tech-related firms, and major financial institutions.
| Date/Day | Impact | Company / Symbol | Time | EPS | Revenue | ||||
|---|---|---|---|---|---|---|---|---|---|
| 2026-11-09 – Monday | Medium | MARA Holdings (MARA) | After close |
|
|
Conclusion: MARA’s earnings release is scheduled for November 9, 2026, after market close; it remains upcoming as of the November 8 publication context. No releases or actual results for today are provided, and the data contain no major tech earnings catalyst with broad index relevance.
For full details visit: Yahoo Earnings Calendar
Weekly EcoNews Radar U.S. Events
| Date | Impact | Event, Prev, Forecast, Actual | Info |
|---|---|---|---|
| 2026-11-09 Monday 08:40 | Medium | Fed's Bowman speech Prev: — Forecast: — Actual: — | Remarks may clarify the policy outlook and assessment of inflation and employment, helping traders evaluate interest-rate expectations and equity valuations. |
| 2026-11-09 Monday 10:00 | Medium | Fed's Goolsbee speech Prev: — Forecast: — Actual: — | Comments may reveal how policymakers weigh growth, employment and inflation, informing rate expectations relevant to index futures. |
| 2026-11-09 Monday 11:30 | Medium | 13-Week Bill Auction · $95B Prev: 4.04% Forecast: — Actual: — | Auction results reveal demand for short-term government debt and prevailing funding yields, providing context for liquidity conditions and interest-rate expectations. |
| 2026-11-09 Monday 11:30 | Medium | 26-Week Bill Auction · $82B Prev: 4.15% Forecast: — Actual: — | The sale tests demand for short-term Treasury funding; yields and bidding strength help traders assess cash-market conditions and the expected policy path. |
| 2026-11-09 Monday 12:15 | Medium | Fed's Barkin speech Prev: — Forecast: — Actual: — | Remarks may offer perspective on economic conditions and the policy outlook, which traders monitor for implications for yields and equity discount rates. |
| 2026-11-09 Monday 13:00 | High | 3-Year Note Auction · $58B Prev: 4.932% Forecast: — Actual: — | Results show demand for intermediate-maturity government debt, with bidding strength and yields informing assessments of financing conditions and rate-sensitive equity valuations. |
| 2026-11-09 Monday 13:00 | Medium | 6-Week Bill Auction · $100B Prev: — Forecast: — Actual: — | The sale gauges demand for very short-term government debt, offering insight into cash demand and near-term funding conditions relevant to broader markets. |
| 2026-11-10 Tuesday 04:00 | Medium | Fed's Waller speech Prev: — Forecast: — Actual: — | Comments may clarify the balance of inflation and employment risks, helping traders assess the potential direction of monetary policy and equity discount rates. |
| 2026-11-10 Tuesday 08:15 | Medium | ADP Employment Change 4-week average Prev: 17K Forecast: — Actual: — | This smoothed measure tracks private-sector employment changes, helping traders assess labor-market momentum and its implications for growth and monetary policy. |
| 2026-11-10 Tuesday 08:30 | High | Consumer Price Index ex Food & Energy (MoM) Prev: 0.30% Forecast: 0.20% Actual: — | Measures monthly consumer-price changes excluding volatile food and energy categories; traders watch it for underlying inflation momentum and implications for interest rates and equity valuations. |
| 2026-11-10 Tuesday 08:30 | High | Consumer Price Index (MoM) Prev: 0.60% Forecast: 0.30% Actual: — | Tracks monthly changes in a broad consumer basket, offering a timely inflation signal that can shape policy expectations and equity discount rates. |
| 2026-11-10 Tuesday 08:30 | High | Consumer Price Index (YoY) Prev: 3.7% Forecast: 3.9% Actual: — | Measures broad consumer-price growth over the past year, helping traders assess inflation trends, purchasing power and the monetary-policy backdrop. |
| 2026-11-10 Tuesday 08:30 | High | Consumer Price Index ex Food & Energy (YoY) Prev: 2.6% Forecast: 2.8% Actual: — | Tracks annual consumer-price growth excluding food and energy, helping traders judge persistent inflation pressures and the outlook for policy rates. |
| 2026-11-10 Tuesday 13:00 | High | 10-Year Note Auction · $42B Prev: 5.3% Forecast: — Actual: — | Results gauge demand for benchmark government debt; auction yields and bidding strength matter for long-term borrowing costs and equity valuation benchmarks. |
| 2026-11-10 Tuesday 15:30 | Medium | Fed's Bowman speech Prev: — Forecast: — Actual: — | Remarks may provide additional context on inflation, employment and policy priorities, informing traders' assessments of interest rates and financial conditions. |
| 2026-11-10 Tuesday 16:30 | Low | API Weekly Crude Oil Stock Prev: -5.27M Forecast: — Actual: — | An industry estimate tracks weekly changes in domestic crude inventories, helping traders assess oil-market balances and potential implications for energy shares and inflation. |
| 2026-11-10 Tuesday 18:30 | Medium | Fed's Paulson speech Prev: — Forecast: — Actual: — | Comments may offer insight into the economic outlook and policy considerations, which traders monitor for implications for rates and equity valuations. |
| 2026-11-12 Thursday 08:30 | Medium | Initial Jobless Claims Prev: 189K Forecast: 195K Actual: — | Counts new applications for unemployment benefits, providing a timely signal of layoffs that traders use to assess labor demand, growth and monetary-policy expectations. |
| 2026-11-12 Thursday 09:00 | Medium | Fed's Hammack speech Prev: — Forecast: — Actual: — | Remarks may illuminate policymakers' assessment of inflation and labor-market risks, helping traders evaluate the interest-rate outlook. |
| 2026-11-12 Thursday 10:00 | Medium | Fed's Barr speech Prev: — Forecast: — Actual: — | Comments may address monetary policy, financial conditions or banking risks, offering context for interest-rate expectations and financial-sector sentiment. |
| 2026-11-12 Thursday 10:00 | Medium | Existing Home Sales Change (MoM) Prev: 1.5 Forecast: — Actual: — | Measures the monthly change in completed sales of previously owned homes, helping traders assess housing demand, interest-rate sensitivity and broader economic momentum. |
| 2026-11-12 Thursday 11:30 | Medium | Fed's Goolsbee speech Prev: — Forecast: — Actual: — | Remarks may provide further insight into growth, employment and inflation assessments, informing expectations for monetary policy and equity discount rates. |
| 2026-11-12 Thursday 11:30 | Medium | 4-Week Bill Auction Prev: 3.89% Forecast: — Actual: — | Results gauge demand for near-term government debt, helping traders monitor cash-market liquidity and short-term funding yields. |
| 2026-11-12 Thursday 11:30 | Medium | 17-Week Bill Auction Prev: — Forecast: — Actual: — | The sale reveals demand for short-dated Treasury debt, providing context on funding conditions and market expectations for near-term interest rates. |
| 2026-11-12 Thursday 11:30 | Medium | 8-Week Bill Auction Prev: — Forecast: — Actual: — | Auction yields and bidding strength indicate demand for short-term government securities, which traders monitor for signals about cash allocation and funding conditions. |
| 2026-11-12 Thursday 12:00 | Low | EIA Crude Oil Stocks Change Prev: -0.86M Forecast: — Actual: — | Tracks weekly changes in domestic crude inventories, helping traders assess petroleum supply-demand balances and implications for energy-sector earnings and inflation pressures. |
| 2026-11-12 Thursday 13:00 | High | 30-Year Bond Auction · $25B Prev: 5.62% Forecast: — Actual: — | Results test demand for long-duration government debt, informing long-term yield assessments that matter for financing costs and rate-sensitive equity valuations. |
| 2026-11-12 Thursday 13:10 | Medium | Fed's Daly speech Prev: — Forecast: — Actual: — | Comments may clarify the economic outlook and policy priorities, helping traders assess the expected rate path and broader financial conditions. |
| 2026-11-12 Thursday 14:00 | Medium | Monthly Budget Statement Prev: -27.0B Forecast: — Actual: — | Reports federal receipts, spending and the resulting surplus or deficit, helping traders assess fiscal financing needs and the Treasury supply backdrop. |
| 2026-11-12 Thursday 18:30 | Medium | Fed's Williams speech Prev: — Forecast: — Actual: — | Remarks may offer perspective on inflation, employment and monetary policy, informing rate expectations and valuation assumptions across equity markets. |
| 2026-11-13 Friday 08:30 | High | Producer Price Index ex Food & Energy (MoM) Prev: 0.70% Forecast: 0.30% Actual: — | Measures monthly changes in producer selling prices excluding food and energy, helping traders assess underlying price pressures and potential implications for margins and monetary policy. |
| 2026-11-13 Friday 08:30 | High | Producer Price Index (MoM) Prev: 1.30% Forecast: 0.40% Actual: — | Tracks monthly changes in prices received by domestic producers, offering insight into inflation pressures and the pricing environment facing businesses. |
| 2026-11-13 Friday 08:30 | Medium | Producer Price Index (YoY) Prev: 6.3% Forecast: 6.6% Actual: — | Measures annual growth in producer selling prices, helping traders assess broader inflation trends and potential pressures on corporate margins and policy expectations. |
| 2026-11-13 Friday 08:30 | High | Producer Price Index ex Food & Energy (YoY) Prev: 5.0% Forecast: 5.0% Actual: — | Tracks annual producer-price growth excluding food and energy, helping traders evaluate persistent inflation pressures and their relevance to margins and interest rates. |
| 2026-11-13 Friday 10:50 | Medium | Fed's Bowman speech Prev: — Forecast: — Actual: — | Comments may update the assessment of inflation and employment risks, providing context for monetary-policy expectations and equity discount rates. |
| 2026-11-13 Friday 12:00 | Medium | Fed's Daly speech Prev: — Forecast: — Actual: — | Remarks may offer additional insight into economic conditions and the policy outlook, helping traders evaluate rates and financial conditions. |
| 2026-11-13 Friday 19:00 | Medium | Fed's Jefferson speech Prev: — Forecast: — Actual: — | Comments may clarify the policy outlook and balance of economic risks, informing traders' expectations for interest rates and equity valuations. |
Summary: The calendar centers on U.S. inflation, monetary-policy communication and Treasury financing, with supporting signals on employment, housing and energy.
Conclusion: Consumer inflation and benchmark Treasury auctions concentrate earlier in the week, while producer inflation rounds out the major data releases.
Weekly Market News Sentiment
Sentiment Bias shows the balance of positive and negative news coverage sampled from 2026-11-07 00:00 to 2026-11-08 19:08 ET, covering stocks, energy and gold.
Week-ahead news sentiment based on collected articles available as of publication, highlighting relevant upcoming events and risks.
▼ Market news
- Bias
- ▼ -21.21%
- Articles
- 99
- Positive
- ▲ 23.23%
- Neutral
- — 32.32%
- Negative
- ▼ 44.44%
▲ GLD / Gold
- Bias
- ▲ +66.67%
- Articles
- 3
- Positive
- ▲ 66.67%
- Neutral
- — 33.33%
- Negative
- — 0.00%
Sentiment Summary: Gold-related coverage is 67% positive and 33% neutral, highlighting central-bank buying as potential support for gold and strength in precious metals and miners despite the S&P 500’s fourth consecutive weekly decline. Silver held its rebound from $48 despite Friday’s dollar rally, but the coverage identifies a stronger-than-expected reading at Tuesday’s upcoming US CPI release as a risk to that recovery. Last week’s strength in REITs, utilities and staples also contrasted with broader equity weakness.
Conclusion: The coming week’s context is defensive sector divergence, with Tuesday’s CPI release the principal scheduled test highlighted for precious metals.
▼ USO / Oil
- Bias
- ▼ -20.00%
- Articles
- 5
- Positive
- ▲ 20.00%
- Neutral
- — 40.00%
- Negative
- ▼ 40.00%
Sentiment Summary: Oil coverage leans negative (40% negative versus 20% positive), with reported declines at Monday’s open following Trump’s statement that fresh Iran attacks were unlikely while talks progress; the prior week’s sell-off reflected hopes for a post-midterm end to the conflict. Reports of shipping hits near Hormuz and elevated escalation risk counter that easing narrative, while recovering chip stocks supported the Nasdaq 100 despite concerns over AI spending, rates and US-China trade tensions.
Conclusion: Upcoming October inflation data is a key scheduled catalyst for the coming week, alongside unresolved Middle East supply risks.
Glossary: Sentiment Bias = (positive articles − negative articles) ÷ total articles × 100. It ranges from −100% negative to +100% positive. A reading near zero indicates little directional bias. Neutral articles reduce the score’s strength. ▲ positive; ▼ negative; — balanced. These readings describe news coverage, not market-price direction.
SPY Weekly View
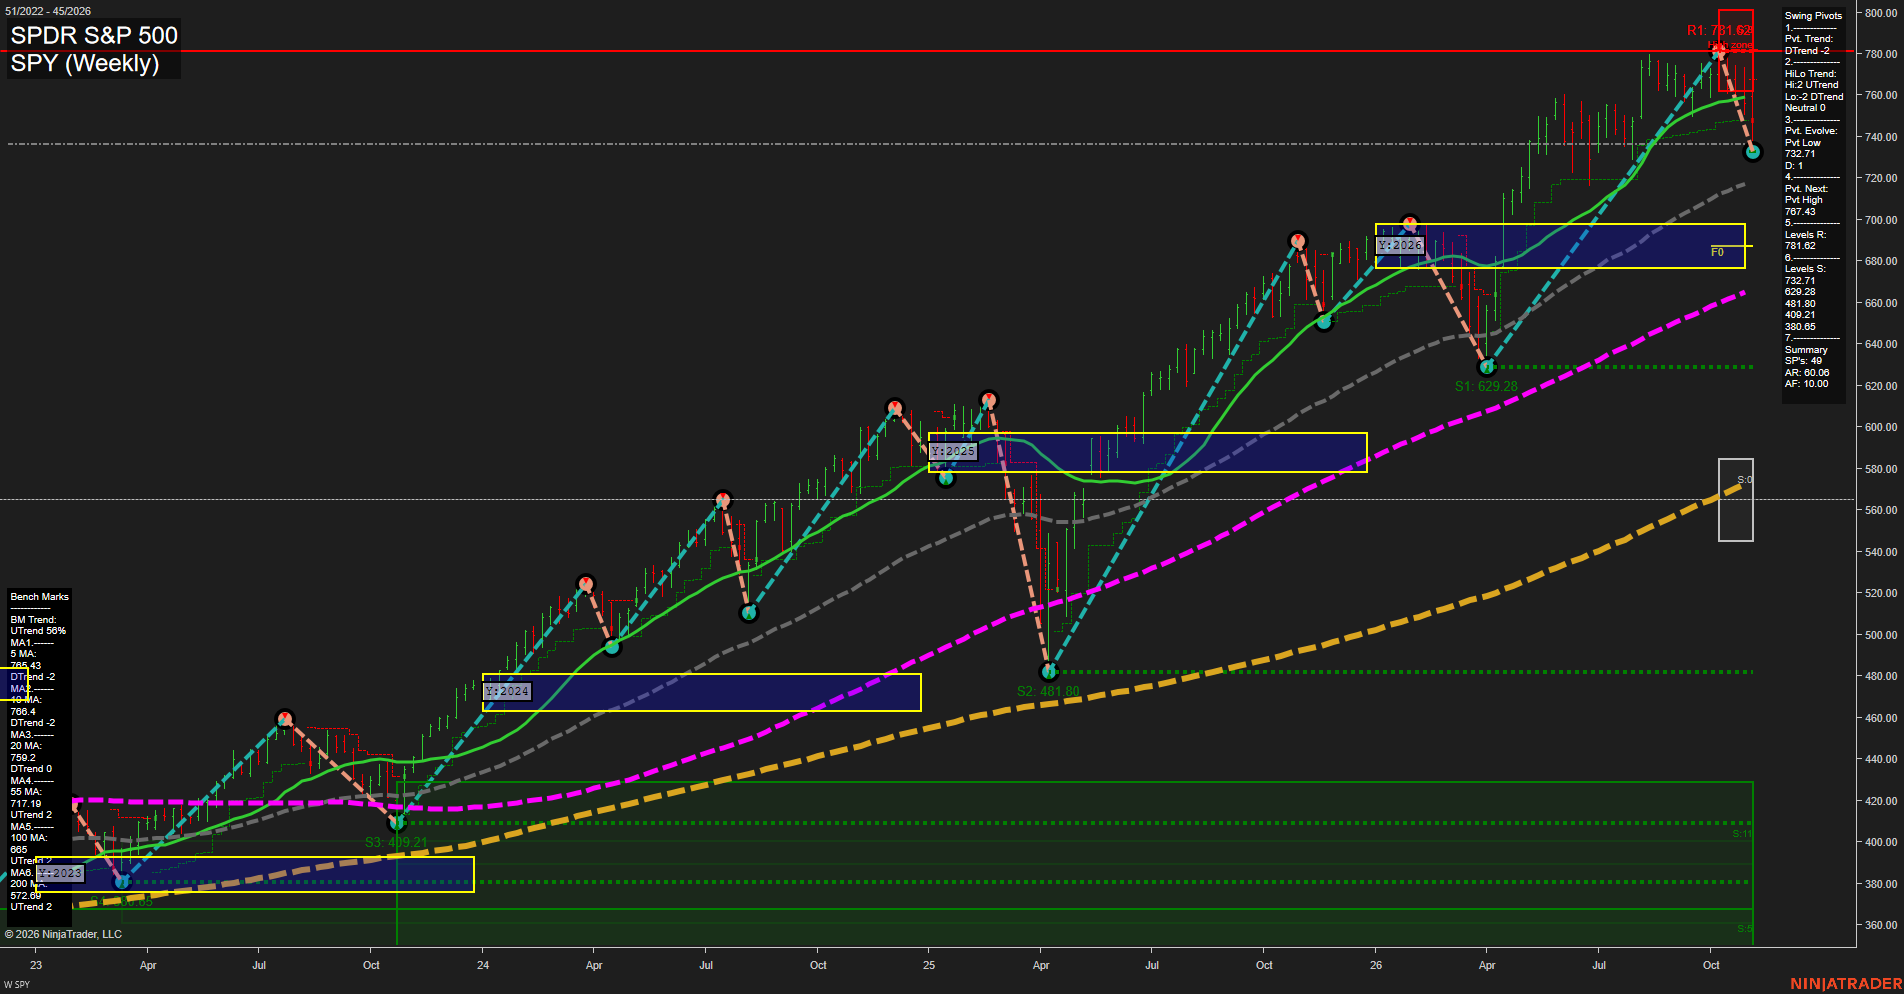
Overall Rating
- Short-Term: Bearish
- Intermediate-Term: Neutral
- Long-Term: Bullish.
Key Insights Summary
The futures swing-trader view is a sharp short-term corrective leg inside a still-positive long-term structure. SPY has rolled from the 767.43 pivot-high area into a fast decline toward the active 732.71 pivot low, while price is below the declining 5-, 10-, and 20-week benchmarks. The intermediate structure is mixed because price remains above the rising 55-week average, while the 100- and 200-week averages remain strongly upward sloped. The 767.43 pivot is the key near-term swing reversal reference, 791.62 is the higher resistance zone, and 732.71 is the immediate structural support level; lower support is shown near 629.28. The recent rejection near the highs reflects volatile, two-sided price discovery rather than a confirmed long-term trend failure.
View charts on: AlphaWebTrader HTF Charts
QQQ Weekly View
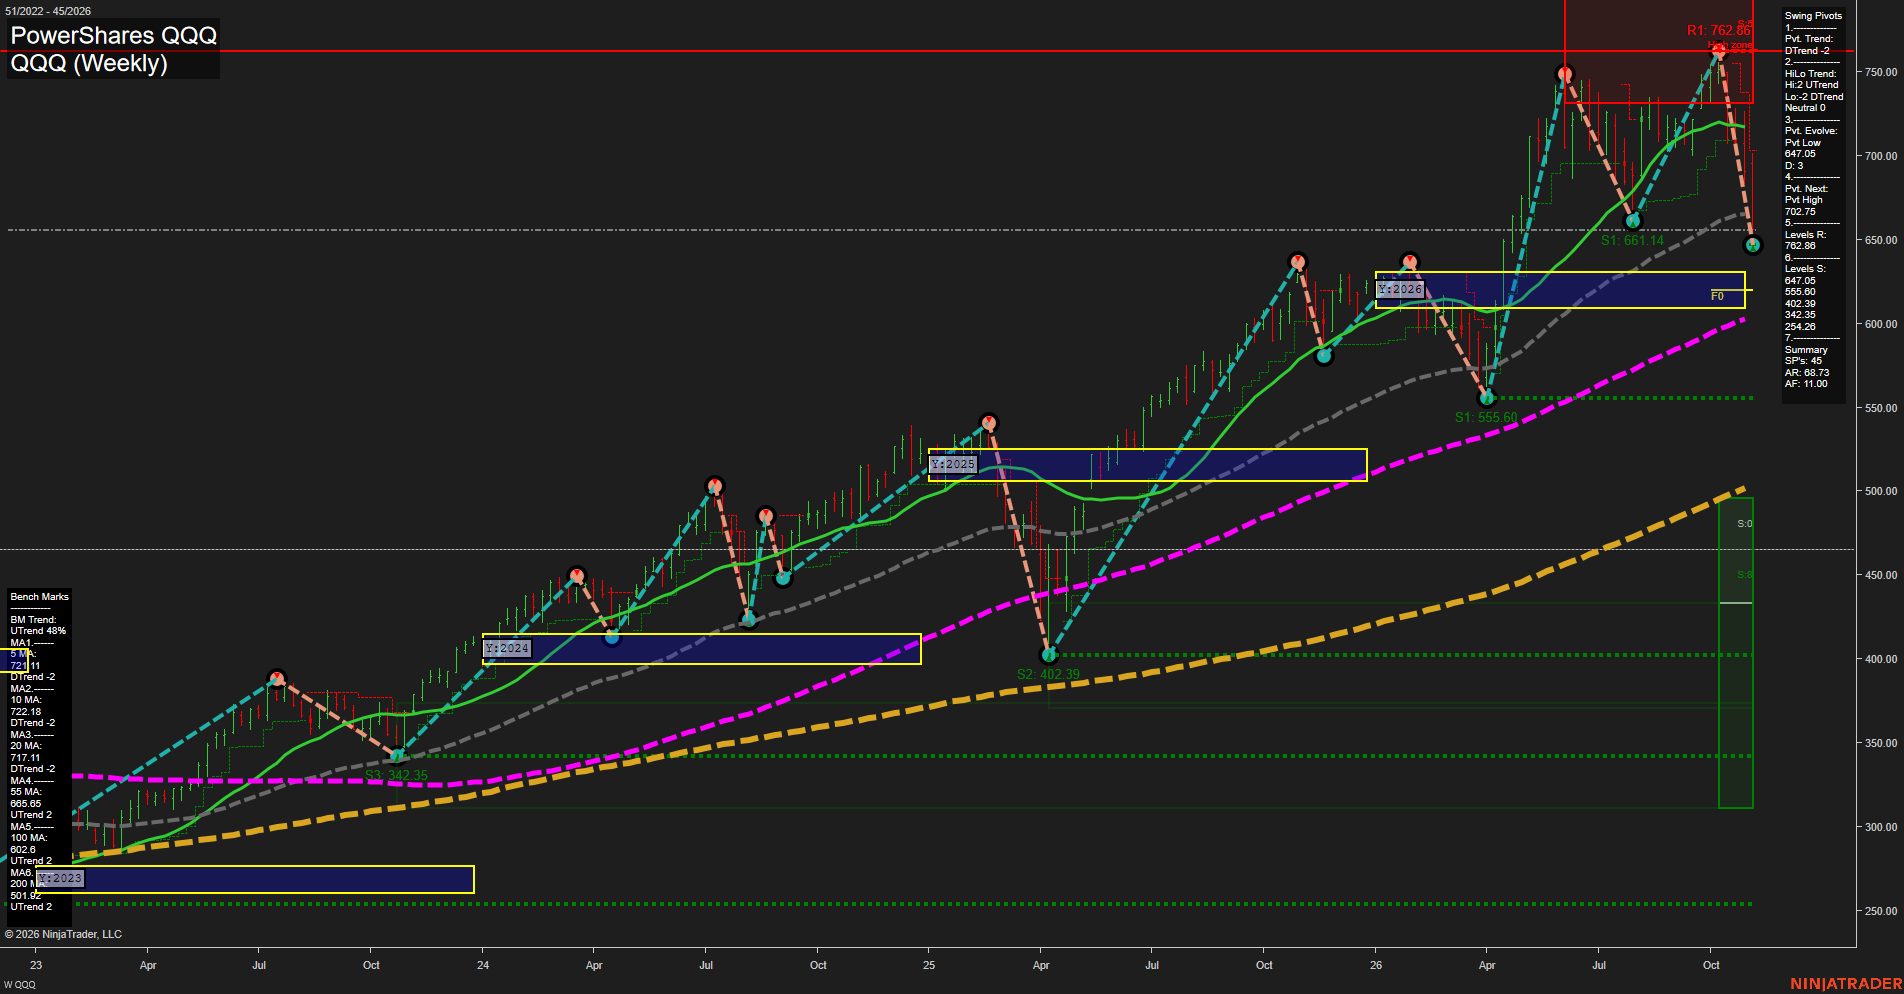
Overall Rating
- Short-Term: Bearish
- Intermediate-Term: Neutral
- Long-Term: Bullish.
Key Insights Summary
QQQ’s weekly structure reflects a sharp corrective downswing from the recent 750-area high, with large bars and fast downside momentum pushing price below the 5, 10, 20, and 55-week benchmarks. The short-term pivot sequence is bearish, while the intermediate HiLo trend remains upward and the 100- and 200-week averages retain rising long-term structure. For index-futures context, this depicts a counter-trend decline within a broader bullish cycle: 647.05 is the immediate pivot support, 702.86 is the principal overhead swing resistance, and the recent decline has shifted the weekly market from an extended advance into a volatile retracement phase.
View charts on: AlphaWebTrader HTF Charts
USO Weekly View
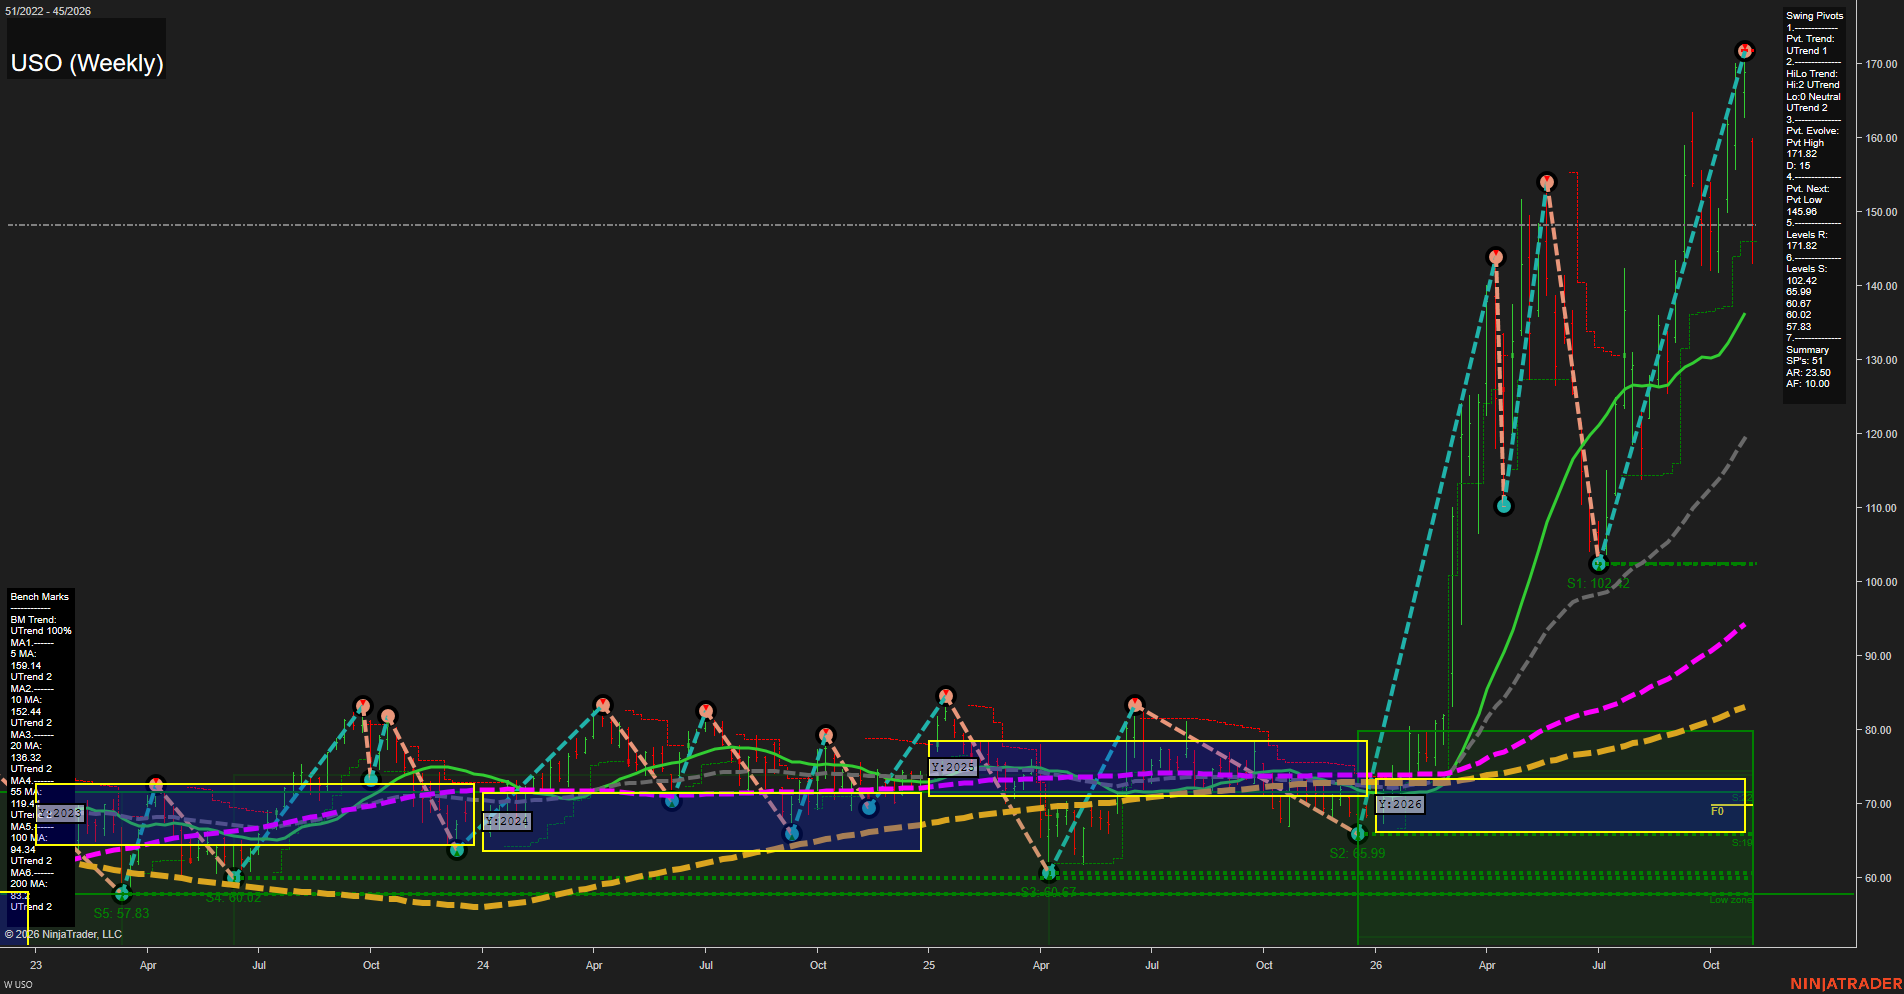
Overall Rating
- Short-Term: Bullish
- Intermediate-Term: Bullish
- Long-Term: Bullish.
Key Insights Summary
USO remains in a powerful futures-style expansion phase, with price far above the rising 20-, 55-, 100-, and 200-week benchmarks. The intermediate pivot structure remains an UTrend, defined by the major advance from the 102.42 swing low into the 171.82 pivot high. Short-term action is highly volatile after rejection from 171.82, with 147.98 below the 5- and 10-week benchmarks but still above the rising 20-week benchmark at 136.32. The 154.98 pivot level marks the nearby swing reference, while 136.32 and 119.49 define the primary intermediate trend support zone. The broader structure remains a high-momentum breakout trend rather than a mature sideways consolidation.
View charts on: AlphaWebTrader HTF Charts
GLD Weekly View
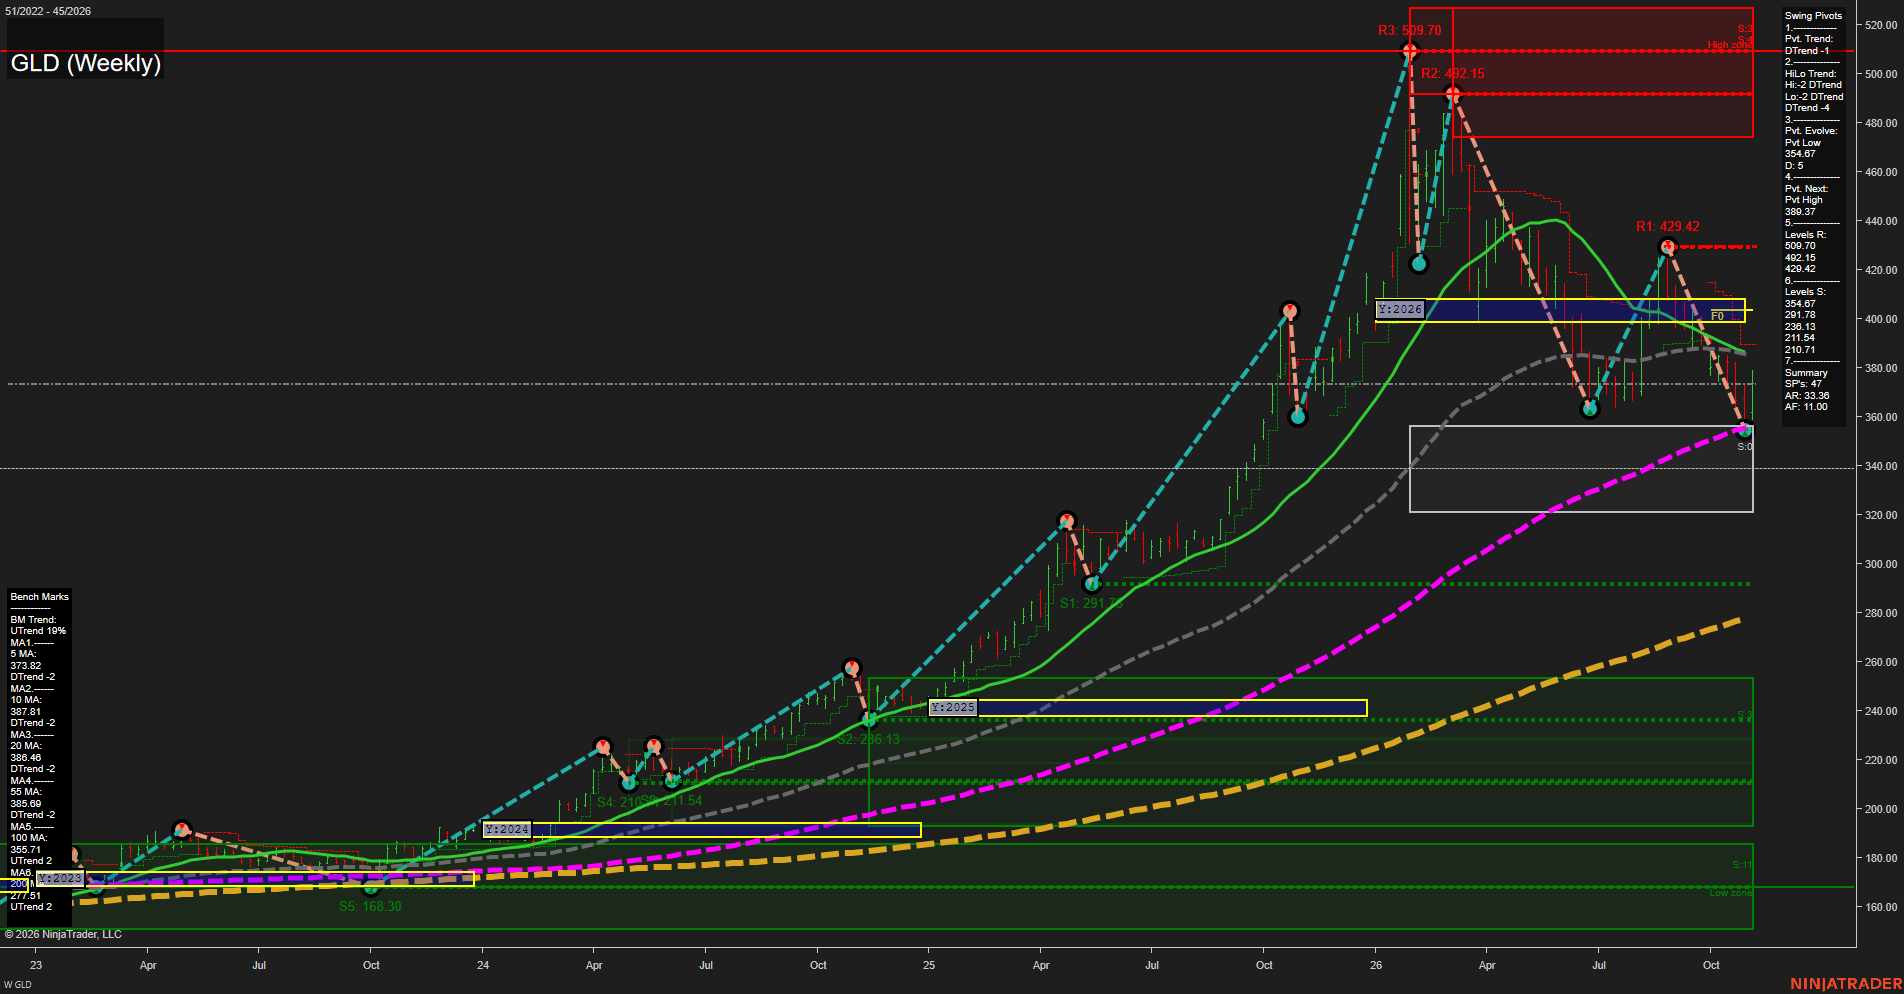
Overall Rating
- Short-Term: Bearish
- Intermediate-Term: Bearish
- Long-Term: Bullish.
Key Insights Summary
GLD is in a fast weekly decline from the 429.42 pivot high, with declining short- and intermediate-term benchmarks confirming a bearish countertrend phase. Price is testing the 354.67 pivot-low/100-week benchmark area after falling beneath the yearly F0% zone near 400. The larger structural trend remains constructive because the 100- and 200-week benchmarks retain upward slopes, but the current swing sequence is lower highs and lower lows. A recovery through 389.37 would define the next upside pivot threshold, while 291.78 is the next major lower swing-support reference beneath the current low.
View charts on: AlphaWebTrader HTF Charts
ZB Weekly View
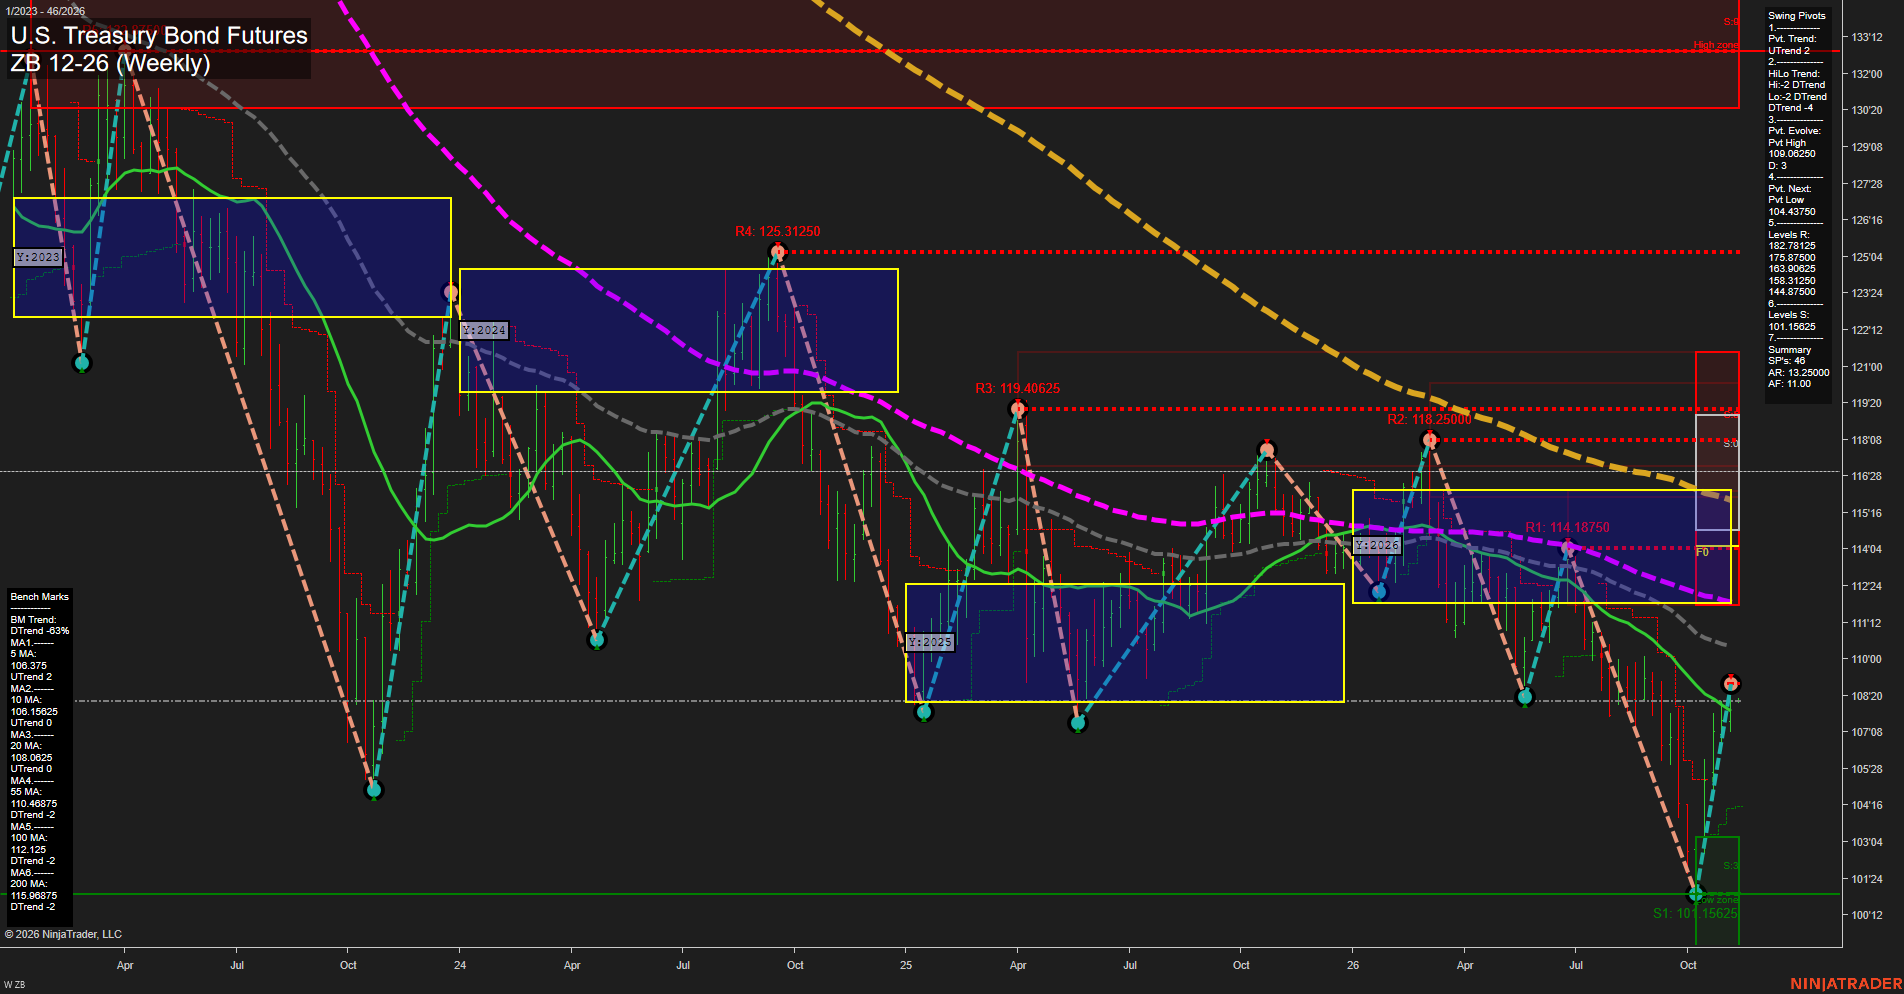
Overall Rating
- Short-Term: Bullish
- Intermediate-Term: Neutral
- Long-Term: Bearish.
Key Insights Summary
Price has produced a sharp V-style recovery from the 101'24 area and is holding above the weekly F0% region, with fast upside momentum and short-term pivot structure improving. The rebound has lifted price above the 5-, 10-, and 20-week benchmarks, while the 55-, 100-, and 200-week averages remain overhead and retain declining trends. The intermediate structure remains mixed: monthly grid positioning is positive, but the HiLo pivot trend remains down and the evolving pivot high at 109'20 to 109'25 defines nearby recovery friction. The broader yearly structure remains bearish below its F0%/NTZ zone, framing the current advance as a strong countertrend recovery within a longer-term decline.
View charts on: AlphaWebTrader HTF Charts
Sentiment Summary: Negative coverage leads at 44% versus 23% positive and 32% neutral, reflecting the prior week’s technology-led selloff, concerns about post-midterm data-center restrictions, and Nvidia’s newly announced investigation into CEO Jensen Huang. Policy-related buildout delays remain concerns rather than enacted restrictions, while reported Azure and AWS growth provides a counterweight to doubts about AI spending. For the coming week, CPI, PPI and earnings from CoreWeave, Cisco and Applied Materials are scheduled catalysts; Nvidia’s earnings are reported as due November 17, outside that window.
Conclusion: Index-futures context remains centered on technology-sector stress ahead of inflation and earnings releases.