Thursday's open faces Nvidia weakness, home sales at 10:00 ET and Treasury auctions at 11:30 and 13:00 ET as S&P 500 and Nasdaq rebounds meet resistance.
Fundamentals: Thursday's premarket setup is negative as Nvidia fell as much as 8% amid reported CEO succession deliberations, with Intel also under pressure. Today's agenda includes home sales at 10:00 ET, Treasury bill auctions at 11:30 and 13:00 ET, a $25B 30-year bond auction at 13:00 ET and the budget statement at 14:00 ET. Fed speeches run from 09:00 to 18:30 ET. Tomorrow, Friday, brings producer-price data at 08:30 ET.
Technicals: S&P 500 and Nasdaq futures show bullish near-term recoveries ahead of the open, but both remain in medium-term corrections as rebounds approach overhead resistance. Dow and midcap futures carry bullish daily ratings across all time frames, while Russell 2000 futures face a dense resistance zone. DAX futures retain bullish daily and weekly structures near 27084 pivot resistance. Volatility remains elevated across the recovery.
Pre-Market Trading 360° view Market Radar of: holidays, earnings, eco-news, market-news summary, news sentiment, prior session major ETFs, MAG7, Higher Time Frame Analysis Indices Futures Summary, and E-mini S&P500, Nasdaq 100, NYMEX Crude, Gold Futures Daily Chart analysis.
As of: November 12, 2026 07:50 CT
EcoNews Radar U.S. Events
| Date | Impact | Event, Prev, Forecast, Actual | Info |
|---|---|---|---|
| 2026-11-12 Thursday 08:30 | Medium | Initial Jobless Claims Prev: 189K Forecast: 195K Actual: — | Counts new applications for unemployment benefits, offering a timely gauge of layoffs that informs growth expectations, interest-rate pricing and equity valuations. |
| 2026-11-12 Thursday 09:00 | Medium | Fed's Hammack speech Prev: — Forecast: — Actual: — | Remarks may clarify the policymaker’s economic outlook and policy preferences; traders monitor them for implications for interest-rate expectations and equity discount rates. |
| 2026-11-12 Thursday 10:00 | Medium | Fed's Barr speech Prev: — Forecast: — Actual: — | Remarks may address monetary policy, financial conditions or banking issues; traders watch for signals relevant to rate expectations and financial-sector sentiment. |
| 2026-11-12 Thursday 10:00 | Medium | Existing Home Sales Change (MoM) Prev: 1.5 Forecast: — Actual: — | Measures the monthly percentage change in completed sales of previously owned homes, helping traders assess housing demand, rate sensitivity and broader economic momentum. |
| 2026-11-12 Thursday 11:30 | Medium | Fed's Goolsbee speech Prev: — Forecast: — Actual: — | Commentary may illuminate views on inflation, employment and the policy outlook, which traders use to assess the expected interest-rate path. |
| 2026-11-12 Thursday 11:30 | Medium | 4-Week Bill Auction · $115B Prev: 3.89% Forecast: — Actual: — | Reveals the yield and investor demand for very short-term government funding, providing context on money-market conditions and near-term rate expectations. |
| 2026-11-12 Thursday 11:30 | Medium | 8-Week Bill Auction · $110B Prev: — Forecast: — Actual: — | Shows pricing and demand for short-dated government debt, helping traders assess cash-market conditions and expectations for near-term interest rates. |
| 2026-11-12 Thursday 12:00 | Low | EIA Crude Oil Stocks Change Prev: -0.86M Forecast: -1.10M Actual: — | Tracks weekly changes in commercial crude inventories, informing oil supply-demand assessments that matter for energy shares and inflation expectations. |
| 2026-11-12 Thursday 13:00 | High | 30-Year Bond Auction · $25B Prev: 5.62% Forecast: — Actual: — | Tests demand for long-duration government debt; auction pricing and bidding strength inform long-term yield conditions relevant to equity valuations. |
| 2026-11-12 Thursday 13:00 | Medium | 17-Week Bill Auction · $75B Prev: — Forecast: — Actual: — | Shows demand and financing costs for government debt maturing within several months, offering context on money-market conditions and the expected policy-rate path. |
| 2026-11-12 Thursday 13:10 | Medium | Fed's Daly speech Prev: — Forecast: — Actual: — | Remarks may provide insight into the economic outlook and policy preferences, helping traders interpret the interest-rate backdrop for index futures. |
| 2026-11-12 Thursday 13:30 | Medium | Fed's Schmid speech Prev: — Forecast: — Actual: — | Commentary may clarify assessments of inflation and employment; traders monitor any policy signals that could inform interest-rate expectations. |
| 2026-11-12 Thursday 14:00 | Medium | Monthly Budget Statement Prev: -27.0B Forecast: -298.6B Actual: — | Reports federal receipts, spending and the resulting surplus or deficit, helping traders assess fiscal trends and government financing needs. |
| 2026-11-12 Thursday 18:30 | Medium | Fed's Williams speech Prev: — Forecast: — Actual: — | Remarks may offer perspective on economic conditions and monetary policy, informing expectations for rates and the financial conditions underlying equity valuations. |
| 2026-11-13 Friday 08:30 | High | Producer Price Index ex Food & Energy (MoM) Prev: 0.70% Forecast: 0.30% Actual: — | Measures monthly changes in producer selling prices excluding food and energy, helping traders assess underlying inflation pressure and its implications for monetary policy. |
| 2026-11-13 Friday 08:30 | High | Producer Price Index (MoM) Prev: 1.30% Forecast: 0.40% Actual: — | Tracks monthly changes in prices received by domestic producers, providing a timely inflation signal relevant to rate expectations and corporate pricing conditions. |
| 2026-11-13 Friday 08:30 | Medium | Producer Price Index (YoY) Prev: 6.3% Forecast: 6.6% Actual: — | Measures producer selling-price changes over a year, helping traders assess broader inflation trends and the monetary-policy backdrop. |
| 2026-11-13 Friday 08:30 | High | Producer Price Index ex Food & Energy (YoY) Prev: 5.0% Forecast: 5.0% Actual: — | Tracks annual producer-price changes excluding food and energy, offering a view of underlying inflation persistence relevant to interest-rate expectations. |
| 2026-11-13 Friday 10:50 | Medium | Fed's Bowman speech Prev: — Forecast: — Actual: — | Remarks may address the policy outlook or banking conditions; traders monitor them for implications for rate expectations and financial-sector sentiment. |
| 2026-11-13 Friday 12:00 | Medium | Fed's Daly speech Prev: — Forecast: — Actual: — | Commentary may update the policymaker’s assessment of inflation, employment and appropriate policy, informing the rate expectations embedded in equity valuations. |
| 2026-11-13 Friday 19:00 | Medium | Fed's Jefferson speech Prev: — Forecast: — Actual: — | Remarks may shed light on the economic outlook and policy direction, helping traders assess the interest-rate environment relevant to index futures. |
Summary: The calendar centers on U.S. inflation signals, monetary-policy commentary and Treasury financing, alongside selected activity and energy indicators.
Conclusion: Friday’s scheduled economic data are concentrated in a single producer-price release window.
NYSE Session Open Gap Radar
Session gaps compare the predicted opening price with the prior session’s close to predict the upcoming session’s opening gap pattern.
| Instrument | Gap | Prior Close | Predicted Open | Gap % |
|---|---|---|---|---|
| USO | ▼ IGU | 141.47 | 142.51 | ▲ +0.73% |
| DIA | ▲ IGD | 524.44 | 522.73 | ▼ -0.33% |
| IJH | ▲ IGD | 74.73 | 74.39 | ▼ -0.45% |
| TLT | ▲ IGD | 80.92 | 80.55 | ▼ -0.46% |
| IWM | ▲ IGD | 283.09 | 281.53 | ▼ -0.55% |
| SPY | ▼ OGD | 759.81 | 754.55 | ▼ -0.69% |
| QQQ | ▼ OGD | 690.38 | 681.35 | ▼ -1.31% |
| GLD | ▼ OGD | 365.17 | 356.75 | ▼ -2.30% |
Before the session opens, the table shows the predicted opening price and gap. Once the session opens, it uses the recorded opening price.
Glossary: IGU — Inside Gap Up: above the prior close, within the prior session’s range. IGD — Inside Gap Down: below the prior close, within that range. OGU — Outside Gap Up: above the prior session’s high. OGD — Outside Gap Down: below the prior session’s low.
As of: 2026-11-12 07:50 CT. Predicted gaps are best estimates as of publication and may change before the regular-session open, particularly when the session is still some time away.
Market News Summary:
Nvidia leadership reports dominate the premarket news flow amid broader AI and technology stock weakness.
Primary Drivers & Risks:
- Primary Driver: Nvidia leadership uncertainty and premarket losses
- Primary Risk: Broader AI and technology sector spillover
Tone:
Predominantly negative, with governance concerns outweighing positive company-specific commentary.
Market News Sentiment
Sentiment Bias shows the balance of positive and negative news coverage sampled from 2026-11-11 08:57 to 2026-11-12 07:53 ET, covering stocks, energy and gold.
▼ Market news
- Bias
- ▼ -28.07%
- Articles
- 228
- Positive
- ▲ 21.49%
- Neutral
- — 28.95%
- Negative
- ▼ 49.56%
▼ GLD / Gold
- Bias
- ▼ -28.57%
- Articles
- 14
- Positive
- ▲ 21.43%
- Neutral
- — 28.57%
- Negative
- ▼ 50.00%
Sentiment Summary: Gold coverage leaned negative (50% negative versus 21% positive), with reports linking Tuesday’s November 10 hotter-than-expected CPI to a stronger dollar, rising real yields and firmer Fed rate-hike expectations; gold fell below $4,000 on Wednesday and remained under pressure Thursday. The main counterweight was reporting that gold’s weekly breakout remained intact, alongside Standard Chartered’s bullish year-end outlook, although Wednesday morning’s reported $4,000 support subsequently gave way.
Conclusion: The main cross-market context is inflation-driven rate repricing, with Friday’s November 13 U.S. producer price report still ahead.
▼ USO / Oil
- Bias
- ▼ -53.33%
- Articles
- 15
- Positive
- ▲ 6.67%
- Neutral
- — 33.33%
- Negative
- ▼ 60.00%
Sentiment Summary: Coverage was 60% negative as oil declined late November 11 and early November 12 on hopes for Iran and Ukraine talks, easing supply fears and higher OPEC output in October. Tight distillate inventories, Tehran’s conditions for reopening the Strait of Hormuz and continuing shipping threats counterbalanced that pressure; the November 12 U.S. crude inventory report remained an upcoming catalyst. Falling oil had not translated into lower borrowing costs, with reported hotter-than-expected inflation pushing the 10-year Treasury yield back near 5%.
Conclusion: Persistent inflation and elevated yields remained a cross-market constraint despite easing oil prices.
Glossary: Sentiment Bias = (positive articles − negative articles) ÷ total articles × 100. It ranges from −100% negative to +100% positive. A reading near zero indicates little directional bias. Neutral articles reduce the score’s strength. ▲ positive; ▼ negative; — balanced. These readings describe news coverage, not market-price direction.
Market Technical Analysis
Analysis of VIX volatility, prior-session major ETFs and mega-cap tech stocks, and real-time futures snapshots and higher-time-frame analysis.
VIX — Market Fear Gauge Daily
| Level | Open | High | MaxVix | Low | MinVix | DNC% | DOC% | VR | MaxVR | MinVR |
|---|---|---|---|---|---|---|---|---|---|---|
| 17.48 | 18.26 | 18.74 | 28.36 | 17.33 | 16.21 | -10.17% | -4.27% | 7.72 | 56.57 | -6.27 |
VIX fell 4.27% from the session's opening level. VIX fell 10.17% versus the previous session close. Expected volatility eased from the period open. VIX is 10.5% up the recent 15-session range (16.21–28.36), in the 10–20% band.
VR: ATN Volatility Ratio (VR): 7.72 – Stocks rose while expected volatility eased. VR is in the lower part of its preceding 15-session VR range (-6.27 to 56.57), in the 20–30% band. VR rose 13.99 points from the previous session, a moderate shift relative to that range.
Range lookback: preceding 15 completed sessions.
Major ETFs and Mega Cap Tech Stocks
- Nvidia shares fell as much as 8% in premarket trading amid reports that its board was evaluating replacements for CEO Jensen Huang.
- Reports of analyst downgrades and price-target cuts added to the negative Nvidia news flow this week.
- Intel shares also came under premarket pressure as Nvidia’s leadership uncertainty raised questions about the companies’ strategic alliance.
- AI-related stocks and cryptocurrencies faced renewed volatility following the midterm elections.
- A market strategist warned against interpreting a sharp technology rebound as a durable recovery.
- Meta received a UK regulatory fine over repeated inaccuracies in WhatsApp Business data, alongside separate positive commentary on AI-driven engagement, advertising monetization and its net cash position.
- Alphabet shares declined despite a reported doubling of its cloud business.
- The Vanguard S&P 500 ETF was reported at $698 after months of narrow-range trading, above this month’s low of $673.
Fed / Financials:
- The autumn AI stock selloff reset convertible-security financing terms, improving conditions for investors in instruments frequently used by technology companies.
Conclusion:
Nvidia’s reported succession deliberations and sharp premarket decline are the central equity-market drivers. The associated weakness extends beyond Nvidia, with Intel also under pressure.
Broader technology volatility and warnings about rebound durability add to the cautious backdrop. Positive commentary on AI-related business performance provides a counterweight to the governance-driven headlines.
ETF, Mag7, and Cross-Market ETF prior day Insights
Overall Tone
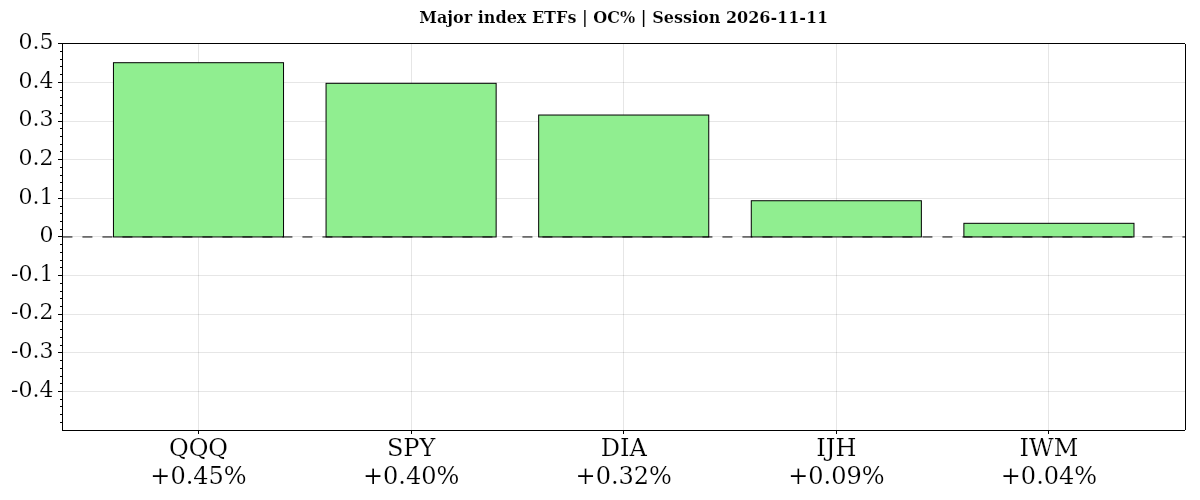
On November 11, 2026, gains from the open spanned every index ETF but only four Mag7 stocks, indicating a positive yet uneven daily risk tone.
| Instrument | Bias | Date | DNC% | DOC% | O | H | L | C | VWAP | Vol |
|---|---|---|---|---|---|---|---|---|---|---|
| ▲ QQQ | ▲ ▲ ▼ | 2026-11-11 | ▲ +2.31% | ▲ +0.45% | 687.28 | 695.57 | 683.56 | 690.38 | ▼ 690.51 | 41,602,645 |
| ▲ SPY | ▲ ▲ ▲ | 2026-11-11 | ▲ +1.32% | ▲ +0.40% | 756.80 | 762.51 | 754.90 | 759.81 | ▲ 759.44 | 37,586,690 |
| ▲ DIA | ▲ ▲ ▲ | 2026-11-11 | ▲ +0.52% | ▲ +0.32% | 522.79 | 524.63 | 520.05 | 524.44 | ▲ 522.87 | 2,628,582 |
| ▲ IJH | ▲ ▲ ▲ | 2026-11-11 | ▲ +0.81% | ▲ +0.09% | 74.66 | 74.79 | 74.05 | 74.73 | ▲ 74.62 | 7,923,393 |
| ▲ IWM | ▲ ▲ ▲ | 2026-11-11 | ▲ +0.89% | ▲ +0.04% | 282.99 | 283.72 | 281.48 | 283.09 | ▲ 282.80 | 17,349,903 |
| AVG/Sum | — | — | +1.17% | +0.26% | — | — | — | — | — | 107,091,213 |
Index ETFs
Positive confluence: average DOC% +0.26% from the open and DNC% +1.17% versus the prior close. QQQ led both comparisons, with SPY next; IWM and IJH were nearly flat from the open, while DIA lagged versus the prior close. QQQ closed below VWAP despite its gain, and all five traded on below-average volume.
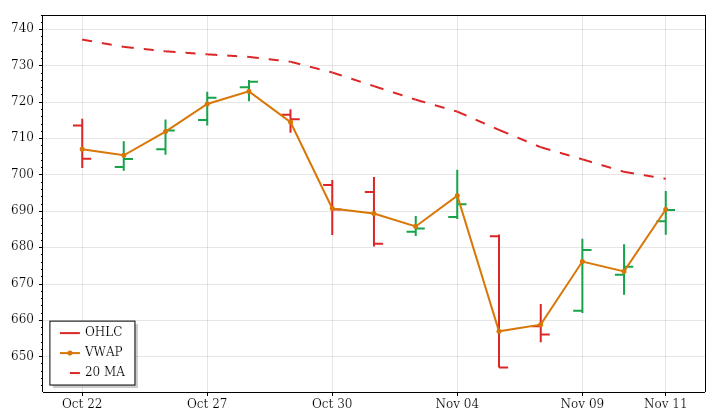
QQQ · D:2026-11-11 NC% ▲ +2.31% OC% ▲ +0.45%
QQQ – Nasdaq 100 Technicals Summary
QQQ's completed November 11 daily session closed at 690.38, up 2.31% from the prior close and 0.45% from the open. The unfilled opening gap supplied most of the advance. A higher high and higher low carried price above the previous day's high, although the close was marginally below VWAP despite finishing in the first upper volatility-band zone.
The rebound leaves conflicting horizons. Price is above a falling near-term average, below a declining intermediate average and below a slightly rising far-term average. The prior 15-session price trend also remained downward. Daily range and volume were below average, contrasting with expanding ranges and increasing volume across the lookback. PSAR is in a long state, while the ATR-median signal remains downward. A next-session low below 647.05 would conditionally reverse PSAR, so the daily advance does not resolve the broader disagreement.
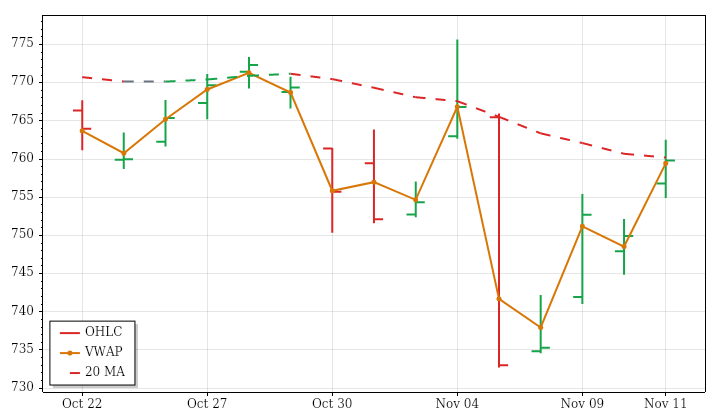
SPY · D:2026-11-11 NC% ▲ +1.32% OC% ▲ +0.40%
SPY – S&P 500 Technicals Summary
SPY's completed daily session on November 11 advanced to 759.81, gaining 1.32% from the prior close and 0.40% from the open. An unfilled opening gap accounted for much of the return. The session produced a higher high and higher low, finishing above the previous day's high and slightly above VWAP, with the close in the first upper volatility-band zone.
Price is above its falling near-term average but remains below a declining intermediate average, while the far-term average is rising beneath it. This places the rebound within an unresolved shorter-horizon correction rather than uniform trend alignment. The prior 15-session price trend was downward. Daily range and volume were below average despite lookback expansion and increasing volume. PSAR and the ATR-median signal remain downward; a next-session high above 767.6768 would trigger a conditional bullish PSAR reversal.
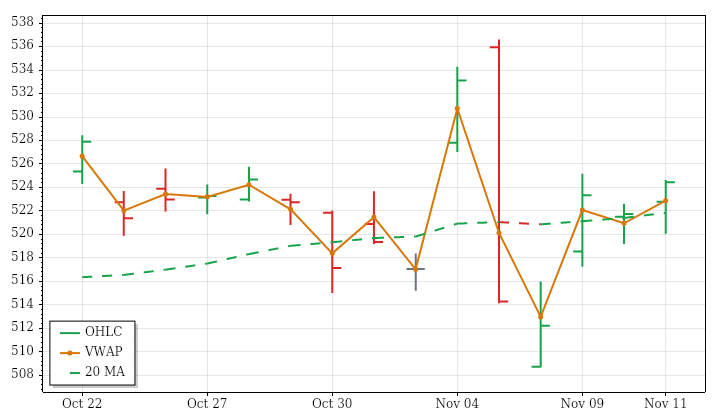
DIA · D:2026-11-11 NC% ▲ +0.52% OC% ▲ +0.32%
DIA – Dow Jones Technicals Summary
DIA's completed daily session on November 11 closed at 524.44, up 0.52% from the prior close and 0.32% from the open. Although the opening gap was filled and trading crossed both sides of the open, the session produced a higher high and higher low. The finish above the previous day's high, near the daily high and above VWAP gave the completed session a constructive tone.
That improvement has not fully aligned the trend structure. Price is above a falling near-term average, while intermediate- and far-term averages remain rising beneath it. The prior 15-session price trend was downward with very little net directional progress. Daily range and volume were below average, contrasting with expansion and increasing activity across that window. PSAR and the ATR-median signal remain downward; a next-session high above 529.0283 would trigger a conditional bullish PSAR reversal.
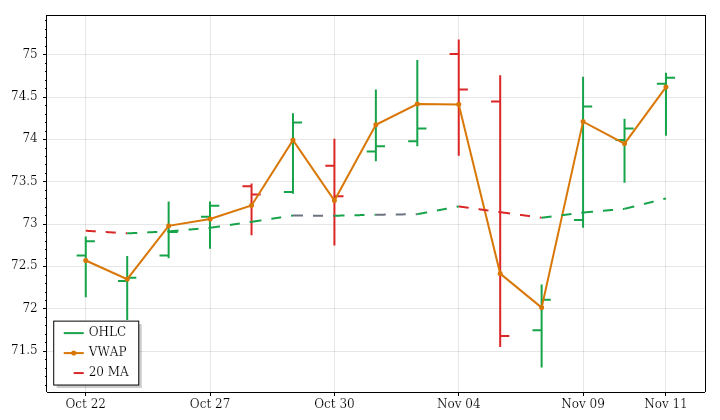
IJH · D:2026-11-11 NC% ▲ +0.81% OC% ▲ +0.09%
IJH – Mid Cap Technicals Summary
IJH's completed daily session on November 11 closed at 74.73, gaining 0.81% against the prior close but only 0.09% from the open. Most of the net gain therefore came through the opening gap. That gap was filled during two-sided trading, yet price recovered to finish near the daily high, above the previous day's high and above VWAP.
Near- and far-term averages are rising beneath price, while the intermediate average is still falling despite price being above it. The prior 15-session upward price trend was inefficient, indicating a choppy advance rather than sustained directional movement. Daily range was well below average and volume slightly below average, contrasting with lookback range expansion and increasing volume. The ATR-median measure crossed bullish on this bar and PSAR is in a long state; a next-session low below 71.31 would conditionally reverse PSAR downward.
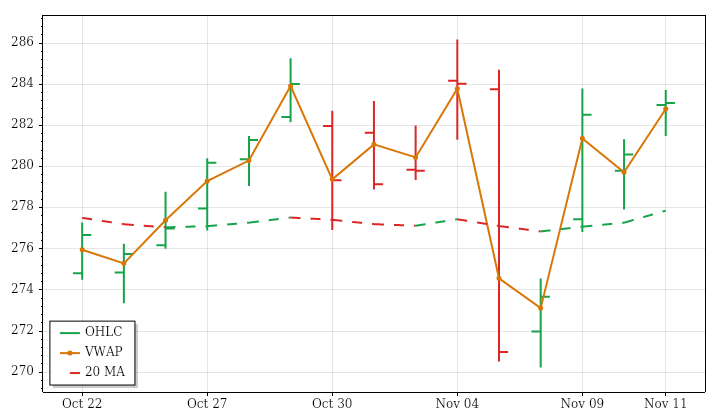
IWM · D:2026-11-11 NC% ▲ +0.89% OC% ▲ +0.04%
IWM – Small Cap Technicals Summary
IWM's completed November 11 daily session closed at 283.09, up 0.89% from the prior close but just 0.04% from the open. The gain was overwhelmingly an opening-gap move, with the gap remaining unfilled. A higher high and higher low accompanied a close above the previous day's high and slightly above VWAP, but almost unchanged from the opening price.
Near-term averages are rising beneath price, while the intermediate average is falling below it and the far-term average is falling above it. Thus, daily strength and the modest prior 15-session advance do not establish agreement across horizons. Range was roughly half its average and volume was below average, despite expanding ranges and increasing volume over the lookback. The ATR-median measure crossed bullish, but PSAR remains downward. A next-session high above 283.72 would conditionally trigger its bullish reversal.
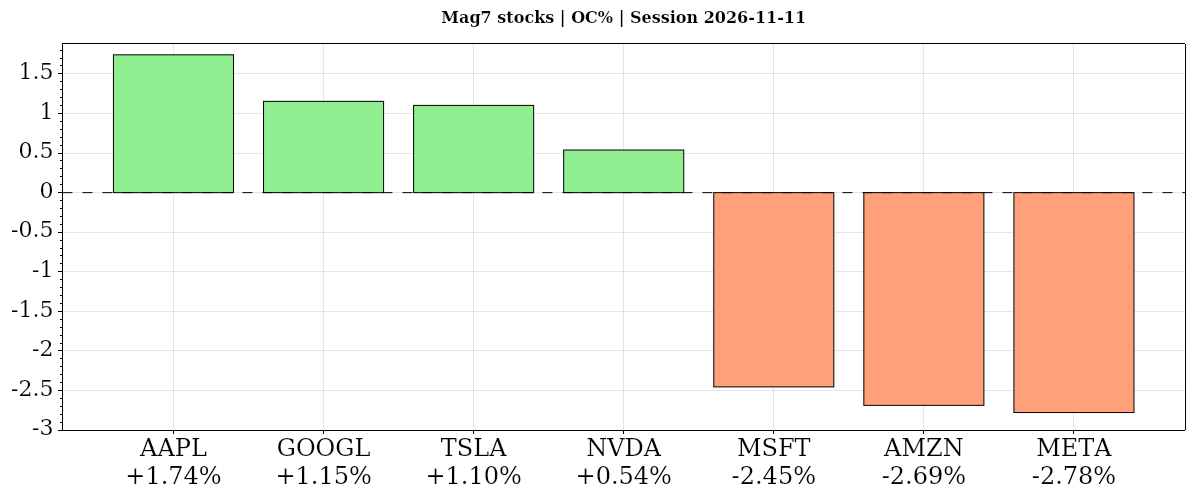
| Instrument | Bias | Date | DNC% | DOC% | O | H | L | C | VWAP | Vol |
|---|---|---|---|---|---|---|---|---|---|---|
| ▲ AAPL | ▲ ▲ ▲ | 2026-11-11 | ▲ +2.04% | ▲ +1.74% | 349.55 | 355.91 | 349.32 | 355.63 | ▲ 354.43 | 33,474,353 |
| ▲ GOOGL | ▲ ▲ ▲ | 2026-11-11 | ▲ +2.11% | ▲ +1.15% | 290.11 | 295.74 | 289.48 | 293.45 | ▲ 292.81 | 25,054,537 |
| ▲ TSLA | ▲ ▲ ▼ | 2026-11-11 | ▲ +2.91% | ▲ +1.10% | 386.58 | 395.43 | 386.35 | 390.84 | ▼ 391.62 | 27,444,493 |
| ▲ NVDA | ▲ ▲ ▼ | 2026-11-11 | ▲ +2.87% | ▲ +0.54% | 172.80 | 177.54 | 170.77 | 173.73 | ▼ 174.65 | 268,247,609 |
| ▼ MSFT | ▼ ▼ ▼ | 2026-11-11 | ▼ -2.26% | ▼ -2.45% | 534.24 | 534.76 | 518.45 | 521.12 | ▼ 522.57 | 28,589,275 |
| ▼ AMZN | ▼ ▼ ▼ | 2026-11-11 | ▼ -1.74% | ▼ -2.69% | 273.52 | 274.87 | 265.62 | 266.17 | ▼ 267.37 | 37,183,485 |
| ▼ META | ▼ ▼ ▼ | 2026-11-11 | ▼ -1.97% | ▼ -2.78% | 646.74 | 648.45 | 627.97 | 628.77 | ▼ 637.12 | 15,269,062 |
| AVG/Sum | — | — | +0.57% | -0.48% | — | — | — | — | — | 435,262,814 |
Mag7 Stocks
Mixed: average DOC% -0.48% from the open versus DNC% +0.57% versus the prior close. Apple led from the open while Meta lagged; Tesla led versus the prior close while Microsoft lagged. Apple’s moving-average uptrends aligned, whereas Nvidia gained despite downtrends across horizons and a below-VWAP close.
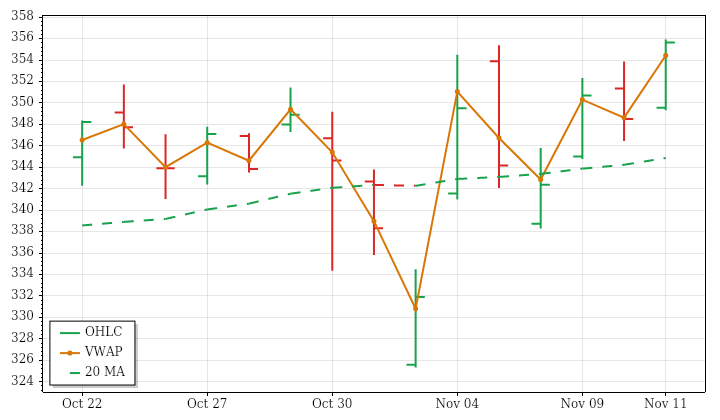
AAPL · D:2026-11-11 NC% ▲ +2.04% OC% ▲ +1.74%
AAPL – Apple Technicals Summary
AAPL's completed daily session on November 11 closed at 355.63, gaining 2.04% from the prior close and 1.74% from the open. The opening gap remained unfilled, and a higher high and higher low culminated in a close above the previous day's high and near the session high. Finishing above session VWAP reinforced the positive daily action, with price also just below its 52-week high.
Near-, intermediate- and far-term averages are rising with price above each, giving the advance broad trend alignment. That contrasts with the slightly declining, inefficient price path over the prior 15 sessions. The day's below-average range and volume also differed from expanding ranges and increasing volume across that lookback. PSAR remains in an upward state; only a next-session low below 336.703 would trigger its bearish reversal.
Apple News and Fundamentals
Apple announced on November 10 that it will permanently close its Apple Support Community forum, a longstanding service where customers exchange product questions and answers. The company also reported record quarterly sales, with strong iPhone demand and high-margin services supporting its business. Rising memory-chip prices were reported as a threat to profitability.
GOOGL · D:2026-11-11 NC% ▲ +2.11% OC% ▲ +1.15%
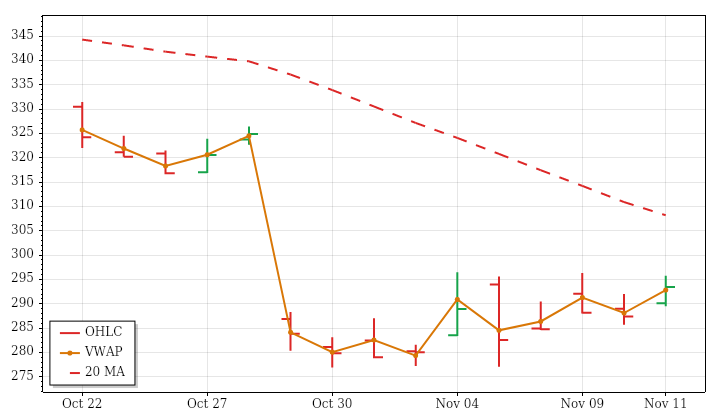
GOOGL – Alphabet Technicals Summary
GOOGL's completed daily session on November 11 rose to 293.45, gaining 2.11% versus the prior close and 1.15% from the open. Its opening gap remained unfilled, and the session established a higher high and higher low before closing above the previous day's high. A finish above VWAP supported the daily rebound, though trading remained range-bound within the supplied session classification.
The rebound conflicts with the established lookback weakness. Price has moved above its near-term average, but that average is still falling, while intermediate- and far-term averages remain declining above price. The prior 15-session price trend was also distinctly downward. Range and volume were below average, unlike the expanding ranges and increasing volume across that window. PSAR is upward while the ATR-median signal remains downward; a next-session low below 278.8125 would conditionally reverse PSAR.
TSLA · D:2026-11-11 NC% ▲ +2.91% OC% ▲ +1.10%
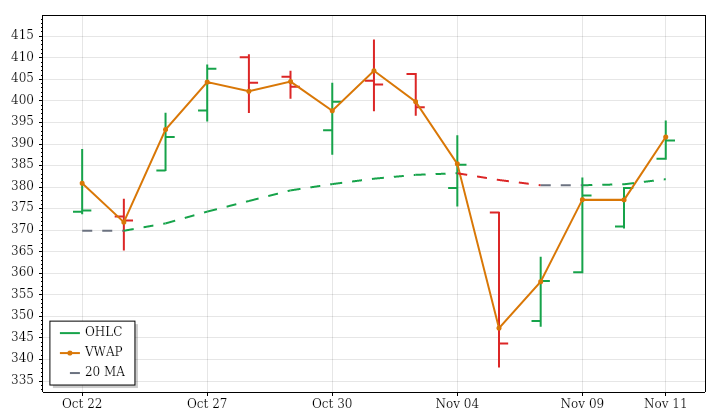
TSLA – Tesla Technicals Summary
TSLA's completed daily session on November 11 closed at 390.84, up 2.91% from the prior close and 1.10% from the open. The opening gap remained unfilled, and a higher high and higher low led to a close above the previous day's high. Price finished in the first upper volatility-band zone but below session VWAP, leaving a less uniformly strong daily picture.
Near- and intermediate-term averages are rising beneath price. The far-term average is still falling despite price being above it, while the prior 15-session price trend was downward and highly inefficient. The latest advance thus agrees with shorter moving-average trends but not every measure. Daily range was well below average despite lookback expansion, and subdued volume matched declining lookback activity. PSAR is long while the ATR-median signal remains downward; a next-session low below 338.15 would conditionally reverse PSAR.
Tesla News and Fundamentals
Elon Musk said Tesla will extend Cybertruck production through the end of summer 2027 because of an order backlog, revising an earlier plan to end production around mid-2027. Finland also approved Tesla’s Assisted Driving system, marking a regulatory development for the company’s driver-assistance software.
NVDA · D:2026-11-11 NC% ▲ +2.87% OC% ▲ +0.54%
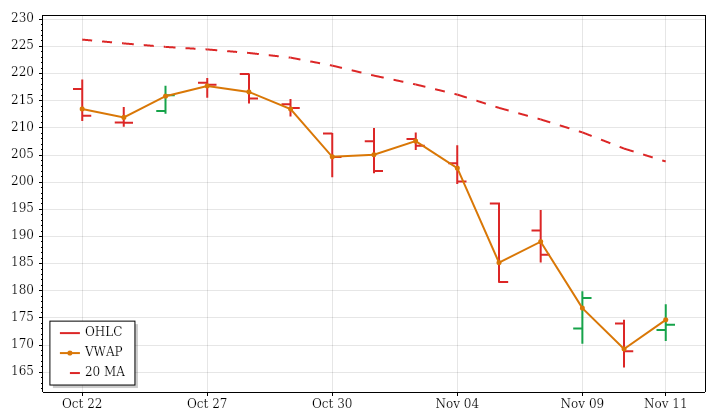
NVDA – Nvidia Technicals Summary
NVDA's completed daily session on November 11 closed at 173.73, rising 2.87% versus the prior close but only 0.54% from the open. Much of the advance came from an opening gap that remained unfilled. The session made a higher high and higher low, yet closed inside the previous day's range and below VWAP, tempering the positive headline return.
Near-, intermediate- and far-term averages all remain falling above price. The advance therefore runs counter to both the aligned trend structure and the downward price trend across the prior 15 sessions. Daily range was nearly average despite expanding lookback ranges, while volume reached about 158% of average, consistent with increasing activity across that window. PSAR and the ATR-median signal remain downward. A next-session high above 189.6549 would trigger a conditional bullish PSAR reversal, not a signal already established by this rebound.
Nvidia News and Fundamentals
Nvidia shares fell 8% following a Wall Street Journal report that its board was preparing to oust CEO Jensen Huang. The New York Times separately reported an alleged second extramarital relationship, involving an Nvidia employee. Nvidia partner Megaspeed is also at the center of a U.S. national-security investigation concerning its alleged role in facilitating billions of dollars of restricted Nvidia chips to China.
MSFT · D:2026-11-11 NC% ▼ -2.26% OC% ▼ -2.45%
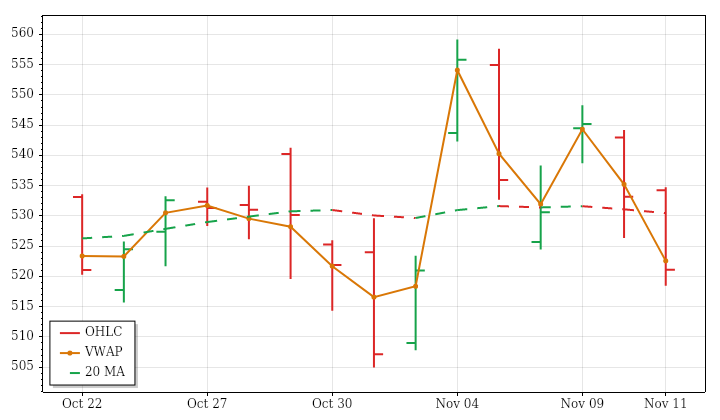
MSFT – Microsoft Technicals Summary
MSFT's completed November 11 daily session closed at 521.125, losing 2.26% from the prior close and 2.45% from the open after its small opening gap higher was filled. A lower high and lower low led to a finish below the previous day's low, near the daily low and below VWAP. This was the second consecutive large-range bar.
Price is now below rising near- and intermediate-term averages, creating mixed positioning at both horizons, while the far-term uptrend remains intact beneath price. The prior 15-session price trend was upward but had almost no directional efficiency, highlighting substantial movement with little net progress. Above-average daily range and slightly above-average volume aligned with lookback expansion and increasing activity. PSAR and the ATR-median signal remain upward despite the weak session; a next-session low below 517.2188 would conditionally trigger a bearish PSAR reversal.
Microsoft News and Fundamentals
Microsoft is pushing back against a tentative U.S. ban on Chinese data-center technology. Separately, Anthropic released Claude Sheets and Claude Whiteboards in beta on November 10, introducing competing productivity software. Microsoft 365 accounted for around one-third of Microsoft’s fiscal 2026 revenue.
AMZN · D:2026-11-11 NC% ▼ -1.74% OC% ▼ -2.69%
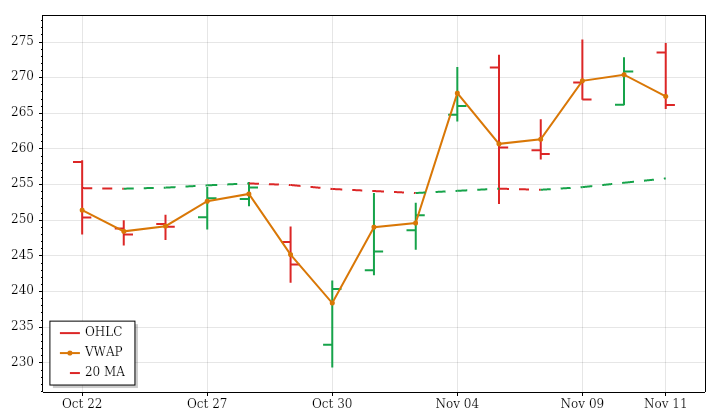
AMZN – Amazon Technicals Summary
AMZN's completed November 11 daily session reversed an opening gap higher, closing at 266.17. The loss was 1.74% against the prior close but a larger 2.69% from the open. An outside bar ended near its low and below session VWAP, although the close remained inside the previous day's range. This was a weak finish rather than a confirmed breakdown of the broader trend structure.
Price remains above rising near- and far-term averages. The intermediate picture is less consistent because price is above an average that is still falling. The latest decline also contrasts with the prior 15-session upward price trend, whose low directional efficiency indicates considerable back-and-forth movement. Range exceeded average in line with lookback expansion, but volume was below average despite its rising lookback trend. A next-session low below 257.2964 would conditionally reverse PSAR downward.
Amazon News and Fundamentals
On November 10, a U.S. district judge certified a class action alleging Amazon collected and stored biometric data through Amazon Photos without the notice and informed written consent required under Illinois law. Separately, Amazon’s AI infrastructure buildout has pushed free cash flow negative. The company continues to expect approximately $220 billion in cash capital expenditures for 2026, indicating continued cash-flow pressure through year-end.
META · D:2026-11-11 NC% ▼ -1.97% OC% ▼ -2.78%
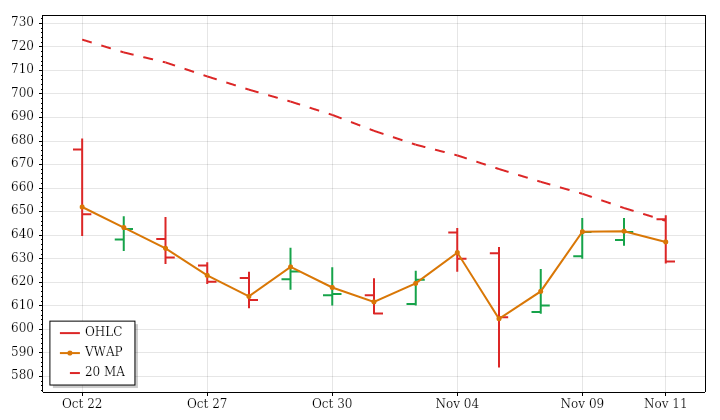
META – Meta Platforms Technicals Summary
META's completed daily session on November 11 reversed an opening gap higher and closed at 628.77. It fell 1.97% against the prior close and 2.78% from the open. The outside bar finished below the previous day's low, near its own low and beneath session VWAP, making the completed day's action weaker than the positive opening suggested.
The intermediate trend remains downward. Near-term positioning is mixed because price is above a falling average, while the far-term picture is also mixed because price is below a rising average. The session decline agrees with the downward price trend across the prior 15 sessions. Its range was essentially average, interrupting lookback contraction, while weak volume accompanied an already declining volume trend. PSAR remains upward and the ATR-median measure crossed bullish; a next-session low below 593.1214 would conditionally reverse PSAR downward.
Meta News and Fundamentals
Meta said on November 11 that longtime infrastructure head and engineering co-head Santosh Janardhan will leave in early 2027. Former AWS senior vice president David Brown will succeed him, leading Meta’s infrastructure efforts and serving as chief technology officer of the Meta Compute initiative, which is spearheaded by Dina Powell McCormick and Daniel Gross.
| Instrument | Bias | Date | DNC% | DOC% | O | H | L | C | VWAP | Vol |
|---|---|---|---|---|---|---|---|---|---|---|
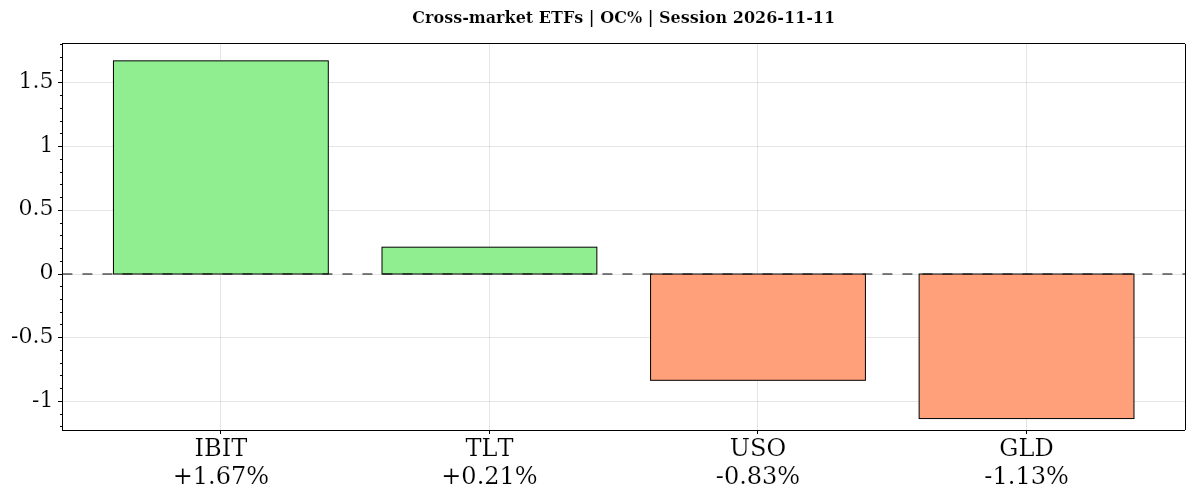
| ▲ IBIT | ▲ ▲ ▲ | 2026-11-11 | ▲ +1.34% | ▲ +1.67% | 41.55 | 42.28 | 41.45 | 42.24 | ▲ 41.98 | 41,710,498 |
| ▲ TLT | ▲ ▲ ▲ | 2026-11-11 | ▲ +0.05% | ▲ +0.21% | 80.75 | 80.96 | 80.47 | 80.92 | ▲ 80.81 | 26,411,758 |
| ▼ USO | ▲ ▼ ▼ | 2026-11-11 | ▲ +0.01% | ▼ -0.83% | 142.66 | 145.16 | 141.11 | 141.47 | ▼ 142.60 | 3,115,463 |
| ▼ GLD | ▼ ▼ ▼ | 2026-11-11 | ▼ -1.13% | ▼ -1.13% | 369.36 | 369.38 | 364.89 | 365.17 | ▼ 366.43 | 5,754,003 |
| AVG/Sum | — | — | +0.07% | -0.02% | — | — | — | — | — | 76,991,722 |
Cross-Market ETFs
Mixed: average DOC% -0.02% from the open versus DNC% +0.07% versus the prior close. Bitcoin led both comparisons; gold fell against rising equities, consistent with aligned moving-average downtrends. Bonds edged higher, while oil declined from the open but finished nearly unchanged versus the prior close.
IBIT · D:2026-11-11 NC% ▲ +1.34% OC% ▲ +1.67%
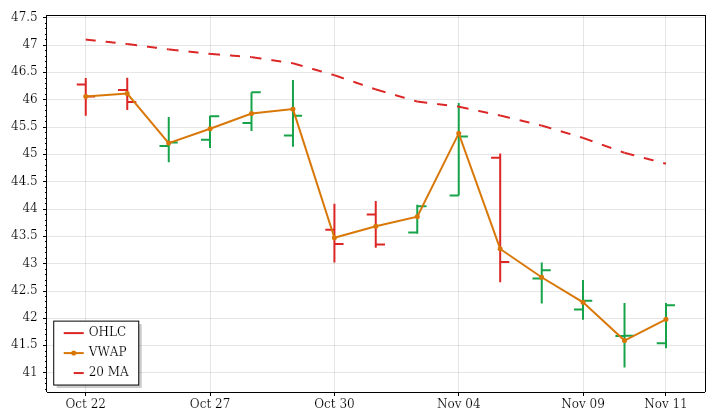
IBIT – Bitcoin Technicals Summary
IBIT's completed November 11 daily session recovered from an opening gap lower to close at 42.24. The gain was 1.34% from the prior close and 1.67% from the open. Price finished near the session high and above VWAP, but the entire daily bar remained inside the previous day's range. The recovery therefore improved the daily finish without extending beyond that earlier range.
Near- and intermediate-term averages remain falling above price, consistent with the downward price trend across the prior 15 sessions. The far-term average is still rising beneath price, leaving shorter-horizon weakness within a stronger long-term structure. Daily range was below average, while volume was close to average; both were softer than the expanding-range and increasing-volume lookback trends. PSAR and the ATR-median signal remain downward. A next-session high above 43.4104 would trigger a conditional bullish PSAR reversal.
TLT · D:2026-11-11 NC% ▲ +0.05% OC% ▲ +0.21%
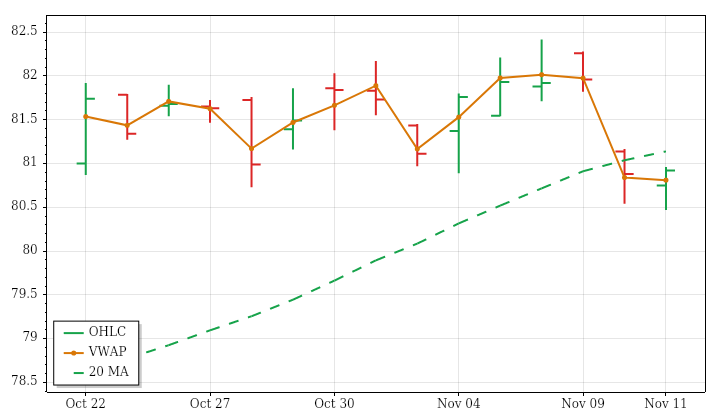
TLT – Long-Term Treasury Bonds Technicals Summary
TLT's completed November 11 daily session closed at 80.92, barely higher by 0.05% versus the prior close but up 0.21% from the open. The opening gap lower was filled, and price ended near the daily high and above VWAP. However, the session still formed a lower high and lower low and closed inside the previous day's range.
The intermediate average is rising beneath price, consistent with the modest upward price trend over the prior 15 sessions. Near-term positioning is mixed because price remains below a rising average, while the far-term average continues falling above it. The latest recovery therefore does not align all horizons. Below-average range and volume matched contracting ranges and declining activity across the lookback. PSAR is downward despite an upward ATR-median signal; a next-session high above 82.3178 would conditionally trigger a bullish PSAR reversal.
USO · D:2026-11-11 NC% ▲ +0.01% OC% ▼ -0.83%
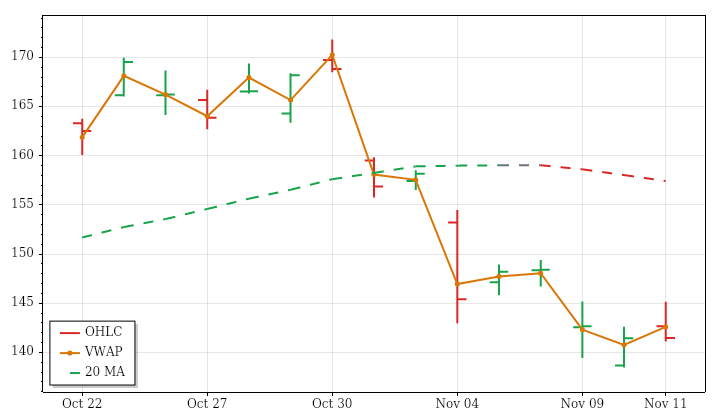
USO – Oil Technicals Summary
USO's completed November 11 daily session closed at 141.47, effectively unchanged with a 0.01% gain from the prior close but down 0.83% from the open. Its opening gap higher was filled during two-sided trading. Although the day formed a higher high and higher low, price finished inside the previous day's range, near the session low and below VWAP.
The near-term average remains falling above price, consistent with the downward price trend across the prior 15 sessions. Intermediate positioning is mixed because price is below a rising average, while the far-term average continues rising beneath it. This leaves shorter-term weakness within a stronger long-term structure. Daily range was slightly below average and volume substantially below average, unlike lookback range expansion and increasing activity. Both technical signals remain downward; a next-session high above 154.4966 would conditionally trigger a bullish PSAR reversal.
Oil News and Fundamentals
Oil resumed declines in early Asian trading as prospects for a Middle East resolution reduced the geopolitical risk premium, following an earlier rebound supported by tight U.S. distillate inventories and supply risks. OPEC’s monthly report showed Saudi Arabia raised October production to its highest level since February, before the Iran war disrupted regional supplies. A U.S. crude-inventory report due November 12 is an upcoming catalyst.
GLD · D:2026-11-11 NC% ▼ -1.13% OC% ▼ -1.13%
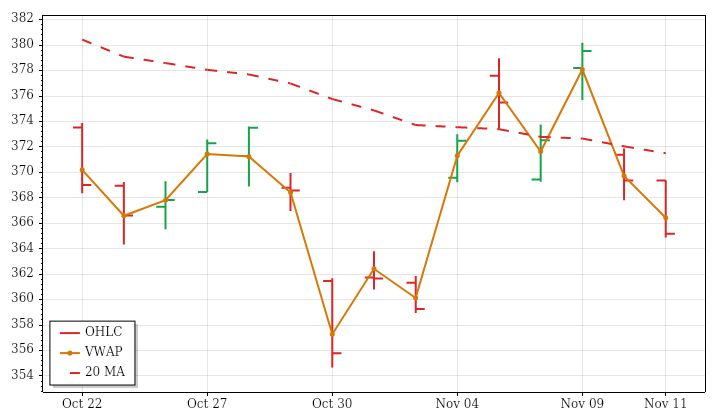
GLD – Gold Technicals Summary
GLD's completed November 11 daily session closed at 365.17, down 1.13% both from the prior close and from the unchanged opening price. A lower high and lower low ended with price below the previous day's low, near the session low and beneath VWAP. The close in the first lower volatility-band zone added to the weak daily configuration.
Near-, intermediate- and far-term averages are all falling above price, so the latest decline aligns with the broader structure. The slight upward price trend across the prior 15 sessions therefore represents a conflicting lookback move rather than an established broader recovery. Daily range was modestly above average despite lookback contraction, while subdued volume matched the declining volume trend. PSAR still retains an upward state, but the close is near its reversal threshold: a next-session low below 364.89 would trigger a bearish change.
Gold News and Fundamentals
Gold fell below $4,000 an ounce on November 11 as a stronger dollar and expectations of further Federal Reserve rate increases pressured bullion following November 10’s hotter-than-expected inflation report. Rising U.S. real yields also weighed on prices, with weakness continuing in early Asian trading. Separately, DBS research reported that central banks are assessing Asian financial hubs as locations for storing gold reserves.
Glossary: Instrument — ticker symbol; hover for the instrument or company name; Date — session date. DNC% — prior-session close to this session’s close; DOC% — daily session open-to-close percentage change. O — open; H — high; L — low; C — close, all for the table’s daily or weekly session; VWAP — volume-weighted average price; its arrow shows whether the close is above or below VWAP. Vol — period trading volume.
Bias — three directional readings, in order: DNC%, DOC%, then VWAP. ▲ positive/above; ▼ negative/below; — neutral or unavailable. Matching arrows show alignment; opposing arrows show mixed conditions. AVG/Sum — simple average of percentage changes and sum of reported volumes.
Futures Session Fib Grid Analysis – Snapshot
Session Fib Grids normalise market positioning as percentages, making direction and alignment comparable across different asset types.
Latest available snapshot for each instrument; Time(CT) shows the individual update date and time.
| Instrument | Bias | Time(CT) | YSFG | MSFG | WSFG | RSFG | SFG | TSI |
|---|---|---|---|---|---|---|---|---|
| ▼ ES | ▲ ▼ ▲ ▼ ▼ ▼ | 2026-11-12 07:52:44 | ▲ +43 | ▼ -11 | ▲ +85 | ▼ -13 | ▼ -9 | ▼ -70 |
| ▼ NQ | ▲ ▼ ▲ ▼ ▼ ▼ | 2026-11-12 07:52:42 | ▲ +34 | ▼ -18 | ▲ +69 | ▼ -26 | ▼ -6 | ▼ -78 |
| ▲ YM | ▲ ▲ ▲ ▲ ▼ ▼ | 2026-11-12 07:52:42 | ▲ +33 | ▲ +20 | ▲ +61 | ▲ +1 | ▼ -17 | ▼ -70 |
| ▼ EMD | ▲ ▲ ▲ ▼ ▼ ▼ | 2026-11-12 07:52:45 | ▲ +42 | ▲ +33 | ▲ +93 | ▼ -15 | ▼ -15 | ▼ -110 |
| ▼ RTY | ▲ ▲ ▲ ▼ ▼ ▼ | 2026-11-12 07:52:41 | ▲ +40 | ▲ +7 | ▲ +78 | ▼ -20 | ▼ -15 | ▼ -94 |
| ▼ FDAX | ▲ ▲ ▲ ▼ ▼ ▼ | 2026-11-12 07:52:36 | ▲ +51 | ▲ +75 | ▲ +125 | ▼ -33 | ▼ -18 | ▼ -81 |
| ▼ NKD | ▲ ▼ ▲ ▼ ▼ ▼ | 2026-11-12 07:52:22 | ▲ +121 | ▼ -23 | ▲ +55 | ▼ -32 | ▼ -3 | ▼ -56 |
| Instrument | Bias | Time(CT) | YSFG | MSFG | WSFG | RSFG | SFG | TSI |
|---|---|---|---|---|---|---|---|---|
| — BTC | ▼ ▼ ▼ ― ▼ ▼ | 2026-11-12 07:52:40 | ▼ -66 | ▼ -37 | ▼ -63 | — 0 | ▼ -13 | ▼ -112 |
| ▼ GC | ▼ ▲ ▼ ▼ ▼ ▼ | 2026-11-12 07:52:42 | ▼ -167 | ▲ +1 | ▼ -86 | ▼ -39 | ▼ -52 | ▼ -348 |
| ▼ CL | ▲ ▼ ▼ ▼ ▲ ▲ | 2026-11-12 07:52:42 | ▲ +146 | ▼ -89 | ▼ -41 | ▼ -3 | ▲ +25 | ▲ +42 |
| ▼ 6E | ▼ ▼ ▼ ▼ ▼ ▼ | 2026-11-12 07:52:44 | ▼ -66 | ▼ -32 | ▼ -54 | ▼ -6 | ▼ -10 | ▼ -68 |
| ▲ ZB | ▼ ▼ ▼ ▲ ▼ ▼ | 2026-11-12 07:51:40 | ▼ -36 | ▼ -19 | ▼ -67 | ▲ +15 | ▼ -31 | ▼ -45 |
Glossary: YSFG — yearly; MSFG — monthly; WSFG — weekly; RSFG — regular trading hours (RTH); SFG — the current session, including pre-market or other sessions. TSI indicates trend strength and power.
Bias shows trend alignment across these six readings. The arrows follow the column order: YSFG, MSFG, WSFG, RSFG, SFG and TSI. Matching arrows show alignment; opposing arrows show mixed conditions.
Futures Higher Time Frame Analysis
Summary of the current state of US Indices Futures based on higher time-frame (HTF) technical analysis as of: 2026-11-12 07:50 -06:00 CT.
US Indices Futures
- ES YSFG above F0%, MSFG below F0%, WSFG rising, above 5/10-day benchmarks, resistance 7671.50–7692, swing support 7322.25, weekly DTrend.
- NQ YSFG above F0%, rebound reaches MSFG area, below 20–200-day benchmarks, resistance 28699.50–28804.25, retracement pivot 27034.50, weekly support 26363.50.
- YM YSFG/MSFG above F0%, above rising 5–55/200-day benchmarks, balance 52412–52419, resistance 52788/53631, weekly reversal threshold 53377, support 50859.
- EMD YSFG/MSFG/WSFG above F0%, reclaimed 5–55/200-day benchmarks, daily HiLo DTrend, resistance 3750.3–3771.4, weekly reversal threshold 3773.1, support 3560.7.
- RTY YSFG bullish, MSFG/WSFG above F0%, above 5/10/20-day benchmarks, resistance 2850.5–2888.7, weekly reversal threshold 2906.0, support 2714.2.
- FDAX above MSFG range and all rising daily benchmarks, daily UTrend, resistance 27084, daily reversal pivot 26140, weekly reversal pivot 25152.
Overall State
- Short-Term: Bullish
- Intermediate-Term: Neutral
- Long-Term: Bullish
Conclusion
Daily rebounds are directionally aligned across the instruments, while weekly corrective pivot structures persist outside FDAX. ES and NQ retain bearish intermediate daily structures beneath overhead benchmarks; YM and EMD show broader benchmark recovery, while RTY remains in intermediate repair. FDAX leads in trend alignment, with all daily benchmarks rising and price above them. Yearly structures remain broadly bullish, although NQ’s daily long-term rating is neutral. Nearby pivot and benchmark resistance remains distinct from established swing-low support, with elevated volatility accompanying the recoveries.
Note: Intra-day counter-trend pullbacks or retracements may occur, HTF is context for informational usage and market structure. Glossary: Session Fib Grids periods of YSFG:’Yearly’, MSFG:’Monthly’, WSFG:’Weekly’
For full details visit: AlphaWebTrader Technicals
SPY Daily View
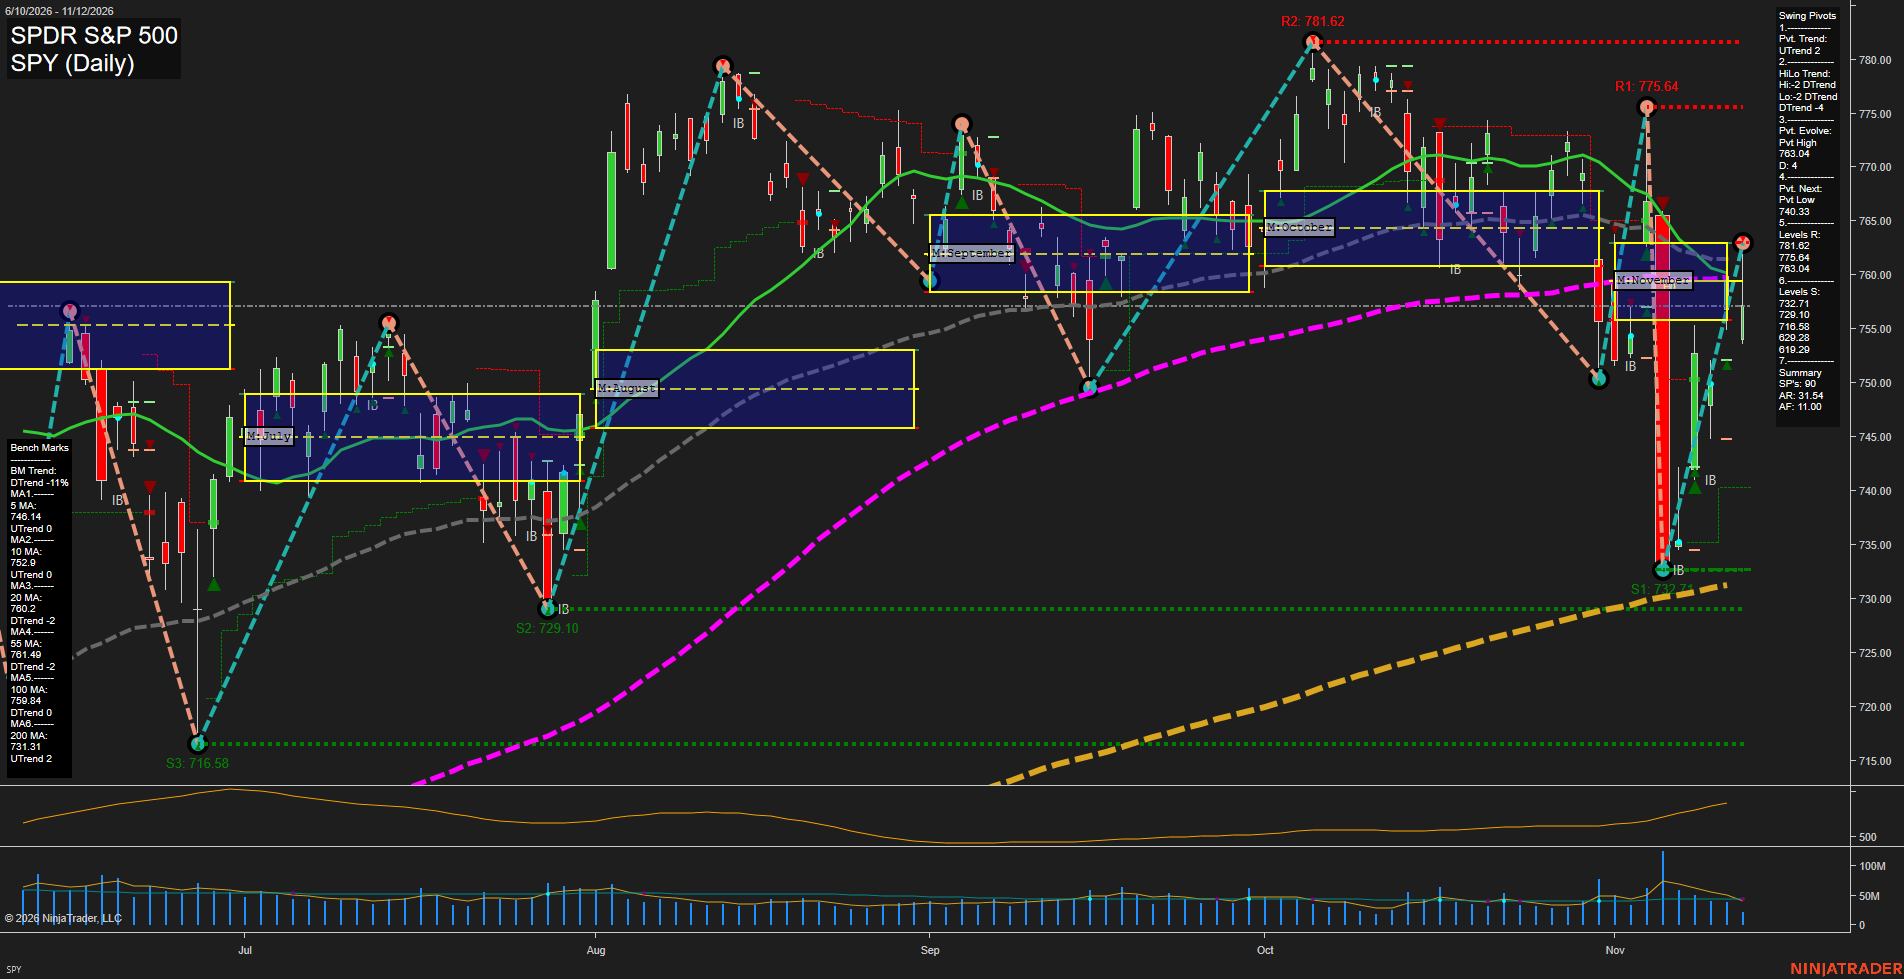
View charts on: AlphaWebTrader HTF Charts
ES Daily View
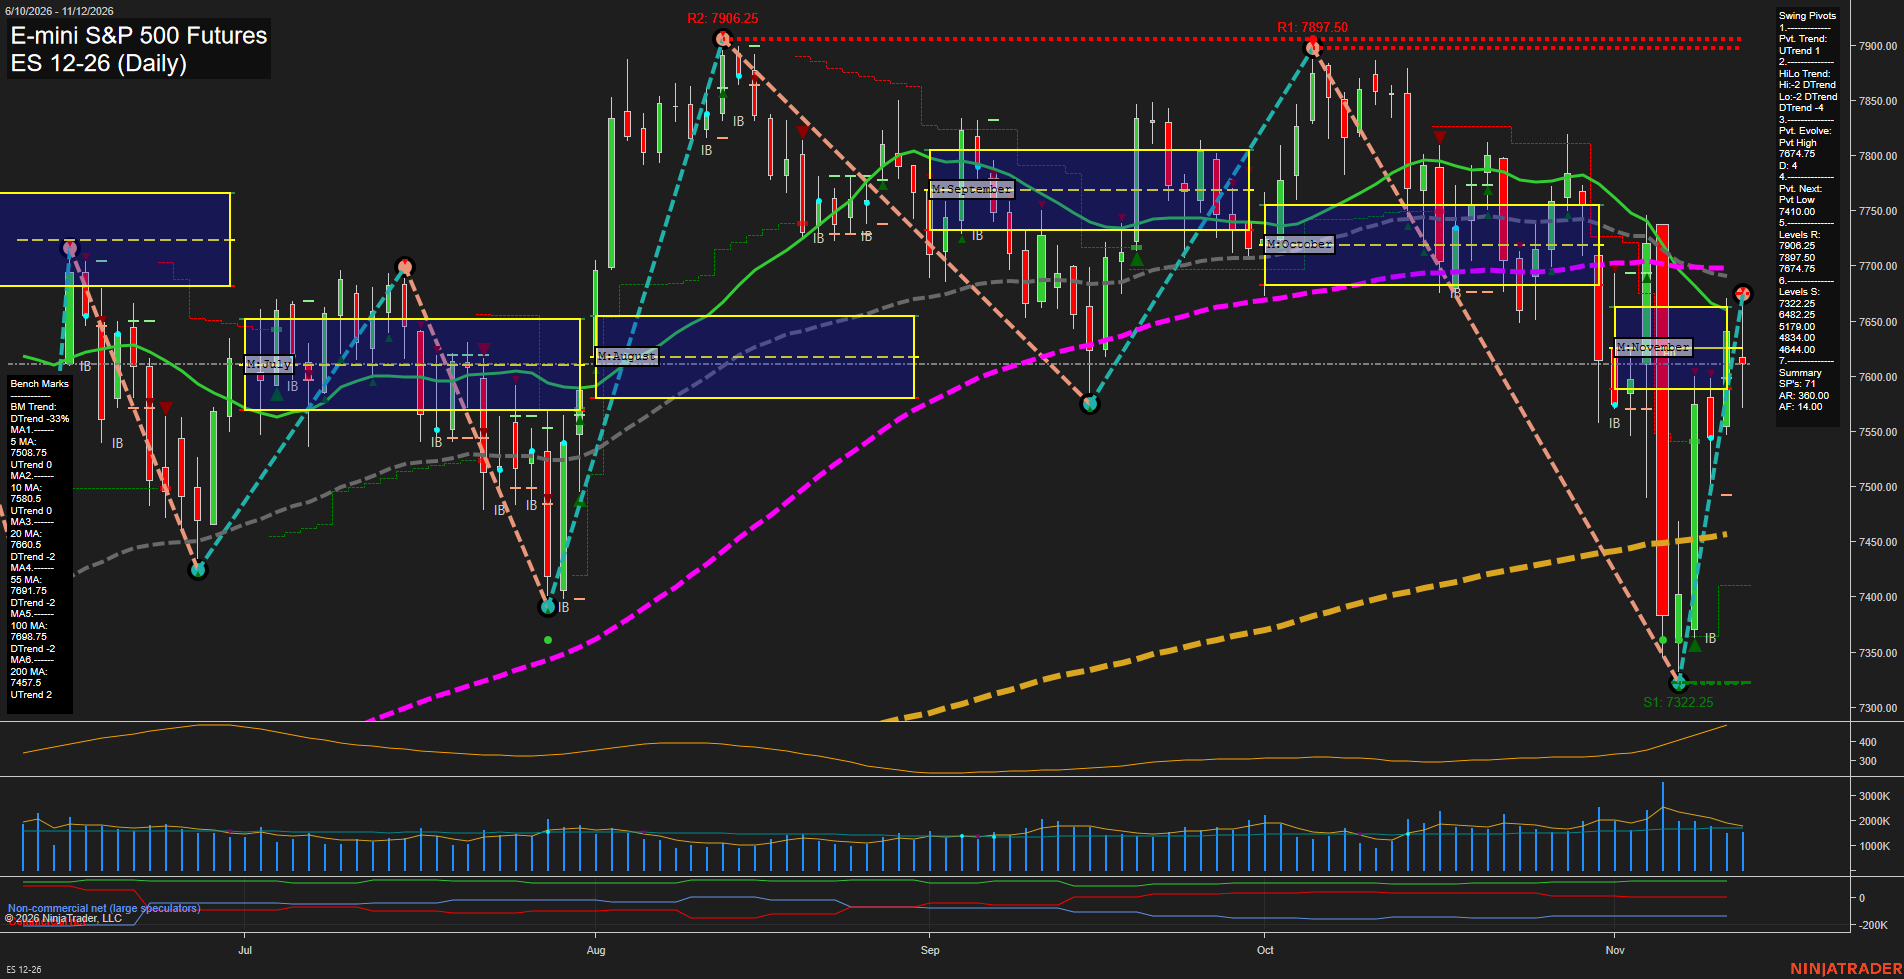
Overall Rating
- Short-Term: Bullish
- Intermediate-Term: Bearish
- Long-Term: Bullish.
Key Insights Summary
The daily chart shows a fast V-shaped recovery from the 7322.25 swing-low area, with price recovering above the rising 5-day and 10-day benchmarks and the weekly fib grid maintaining an upward bias. Short-term pivot structure is positive, although the developing pivot high at 7671.50 and the clustered 20-day, 55-day, and 100-day averages near 7680-7692 define a nearby intermediate-term overhead supply zone. The broader intermediate structure remains corrective: the monthly grid, HiLo pivot trend, and intermediate moving averages remain down. Long-term structure remains constructive because price is above the rising 200-day average and the annual fib-grid bias remains positive. Elevated ATR and the large recent daily ranges reflect a volatile rebound phase rather than a settled trend continuation.
View charts on: AlphaWebTrader HTF Charts
QQQ Daily View
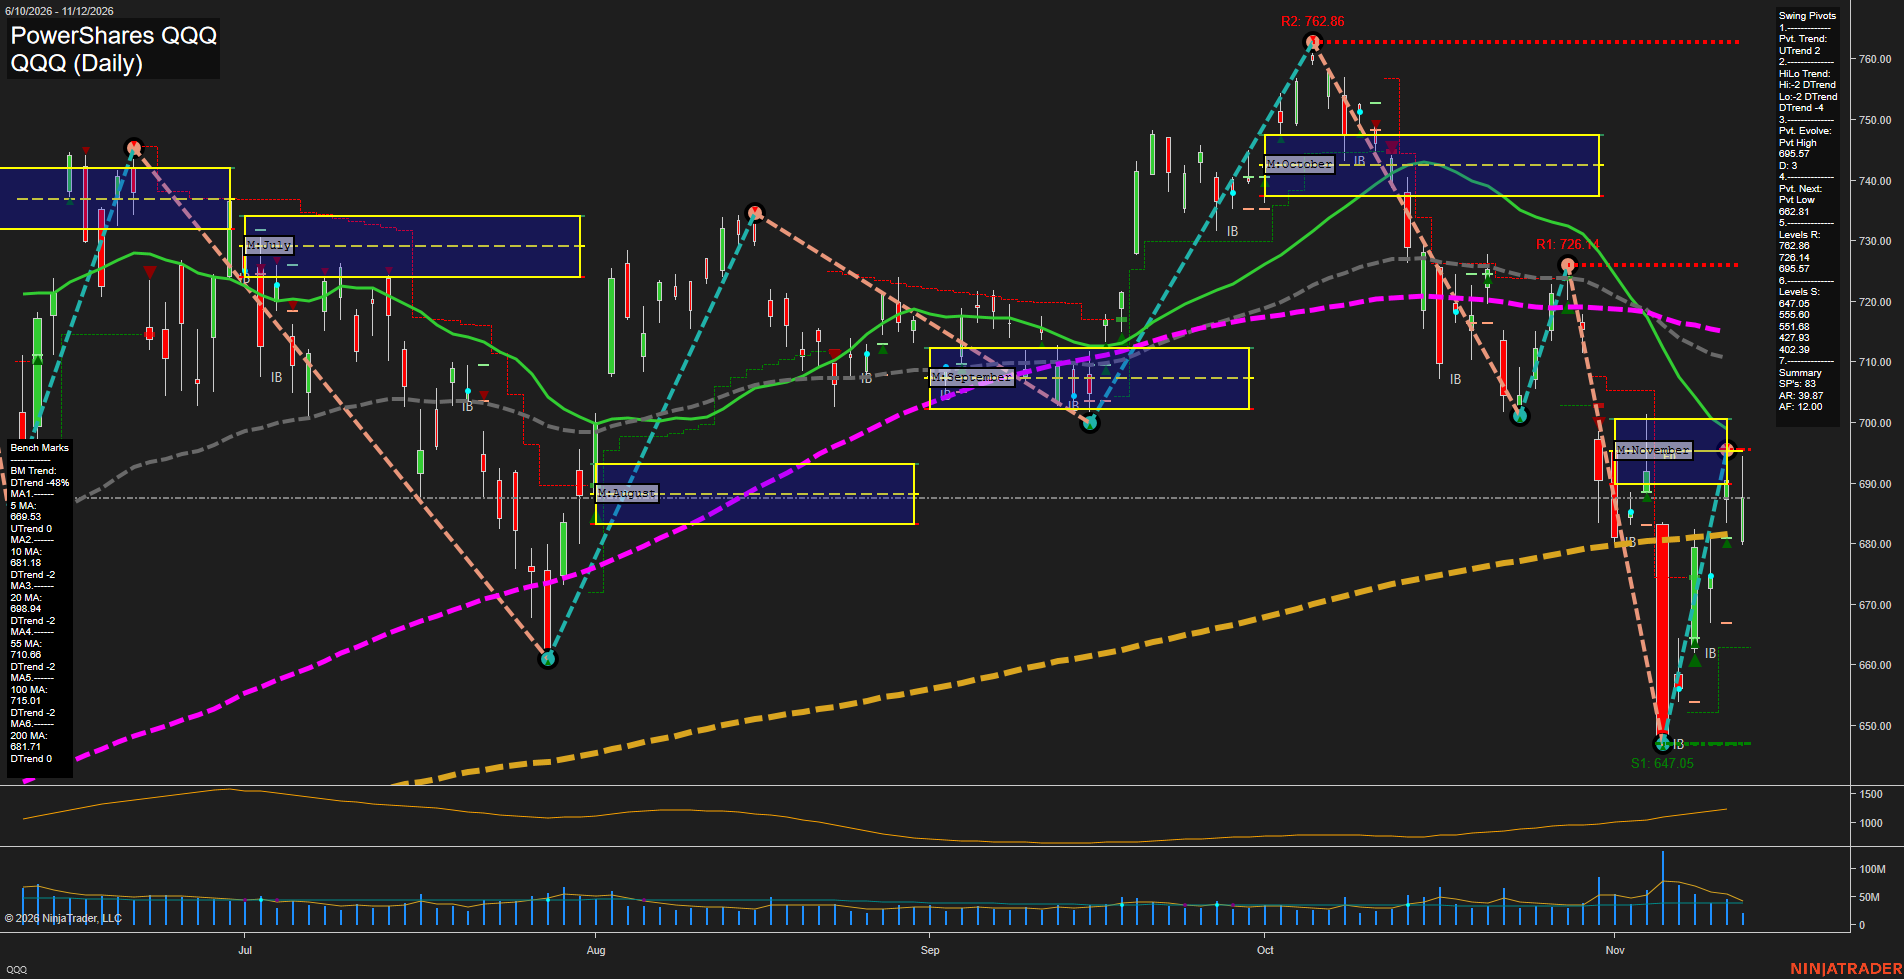
Overall Rating
- Short-Term: Bullish
- Intermediate-Term: Bearish
- Long-Term: Neutral.
Key Insights Summary
QQQ reflects a sharp, high-volatility V-recovery from the 647.05 swing-low area, with the current 695.57 pivot high testing the upper portion of November’s NTZ. From a futures swing-trader perspective, short-term momentum is constructive as price is above the 5-day average and the 200-day benchmark, but the broader daily structure remains counter-trend because price is still beneath declining 20-, 55-, and 100-day averages. The immediate pivot sequence is bullish, while the intermediate HiLo trend remains bearish; 695.57 is the near-term pivot resistance, followed by 726.14, while 682.81 and 647.05 define the principal downside swing references. Elevated ATR and volume following the early-November selloff characterize an active, fast-moving recovery phase rather than a settled intermediate-term uptrend.
View charts on: AlphaWebTrader HTF Charts
NQ Daily View
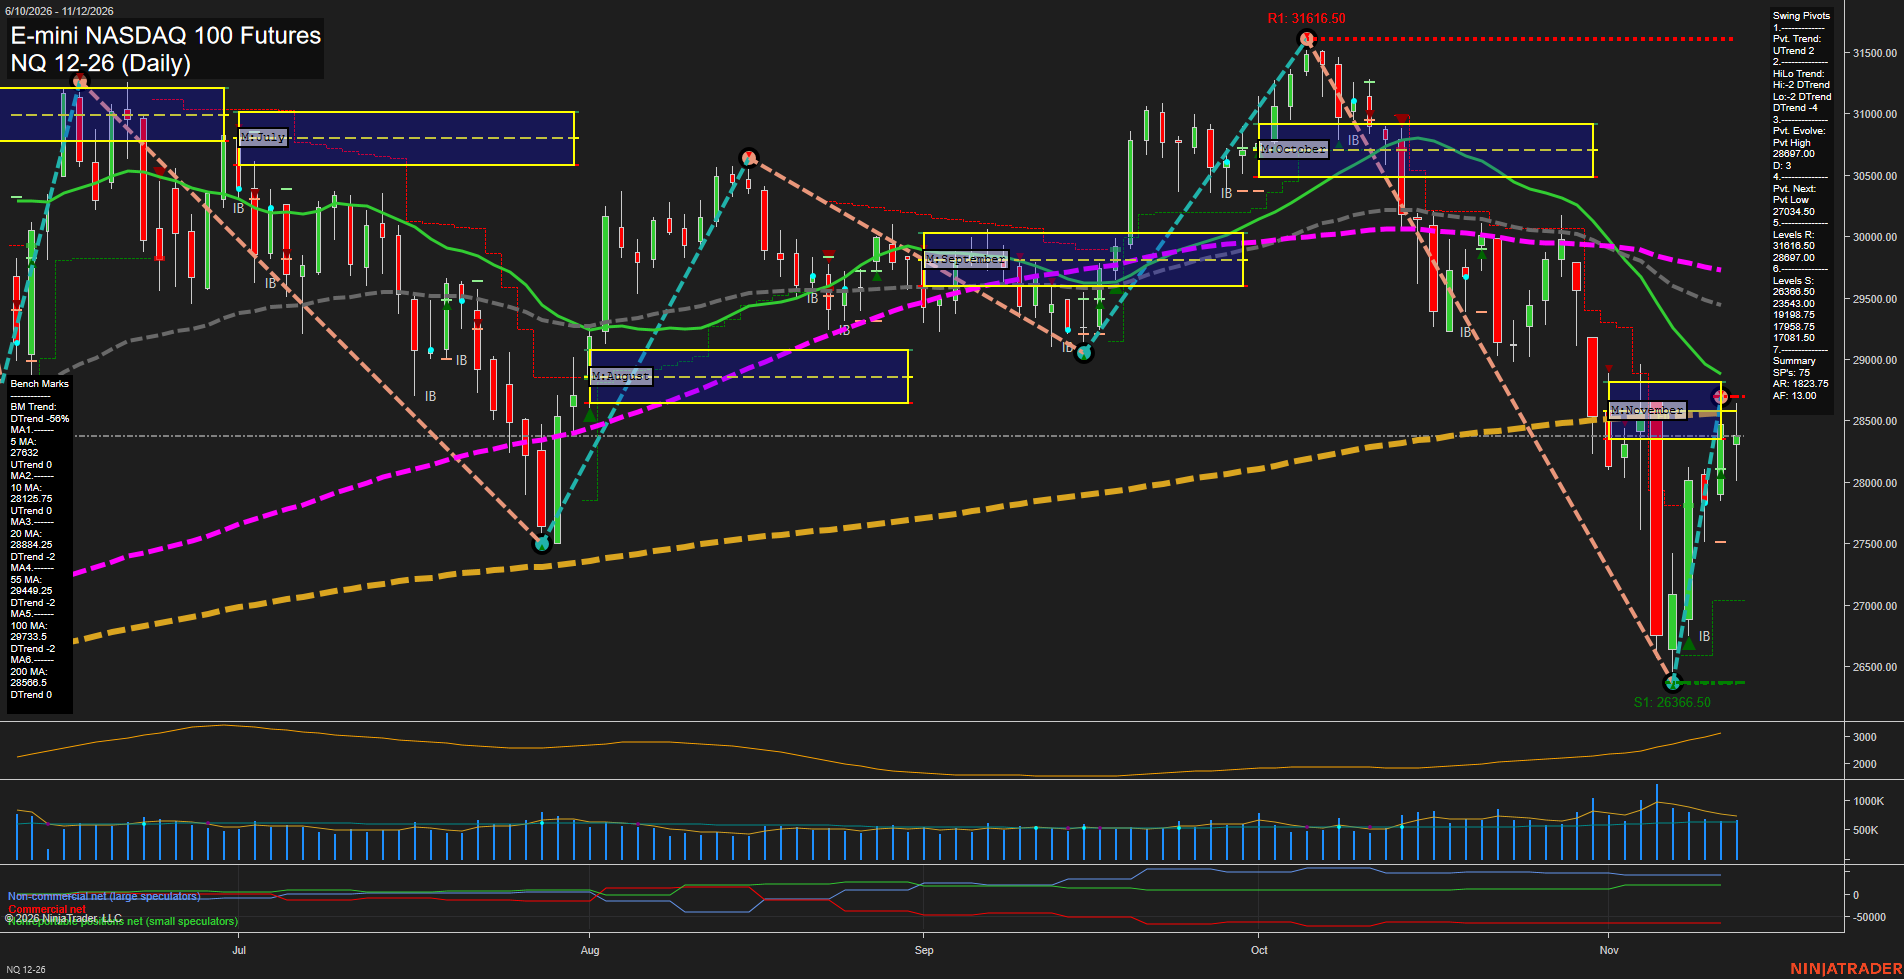
Overall Rating
- Short-Term: Bullish
- Intermediate-Term: Bearish
- Long-Term: Neutral.
Key Insights Summary
Price has produced a sharp V-recovery from the 26366.50 swing-low support zone, restoring the short-term pivot structure and lifting price above the rising 5-day average. The rebound has reached the November grid area but remains beneath the declining 20-, 55-, 100-, and 200-day benchmarks, preserving a broader intermediate-term corrective structure. The 28699.50 evolving pivot high and the 28804.25 20-day average define the nearby overhead rejection zone, while 27034.50 is the pivotal retracement level beneath the current recovery. Volatility remains elevated following the November selloff and rebound, consistent with wide daily rotation and fast momentum conditions.
View charts on: AlphaWebTrader HTF Charts
USO Daily View
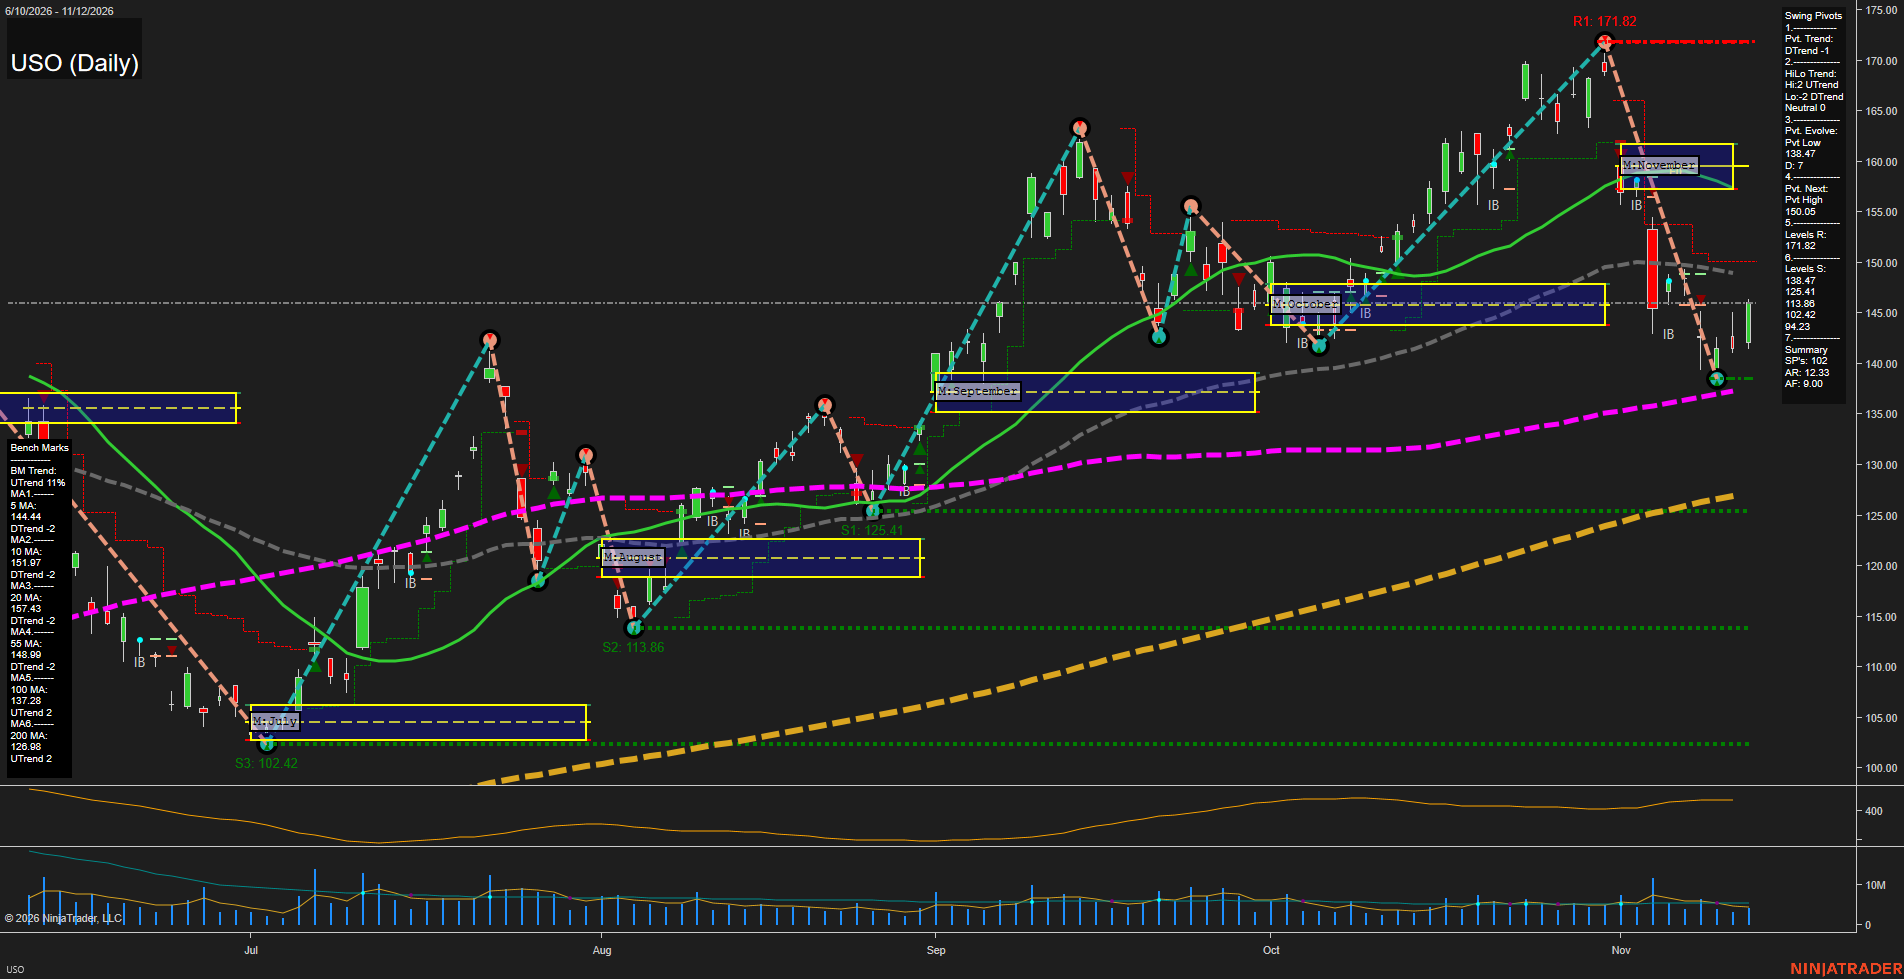
Overall Rating
- Short-Term: Bearish
- Intermediate-Term: Bearish
- Long-Term: Bullish.
Key Insights Summary
USO has undergone a fast, high-volatility liquidation from the late-October 171.82 pivot high into the current 138.47 pivot-low area. The short-term pivot trend, weekly/monthly grid positioning, and 5-, 10-, 20-, and 55-day benchmarks are aligned lower, defining a strong countertrend decline beneath the November NTZ. The intermediate pivot structure remains UTrend, while price remains marginally above the rising 100-day average and well above the rising 200-day average, preserving the broader 2026 advance. The current low is a key inflection zone; 138.47 is immediate structural support, while 150.05 is the next pivot-reversal reference and the 149.27 to 158.00 benchmark cluster represents overhead supply.
View charts on: AlphaWebTrader HTF Charts
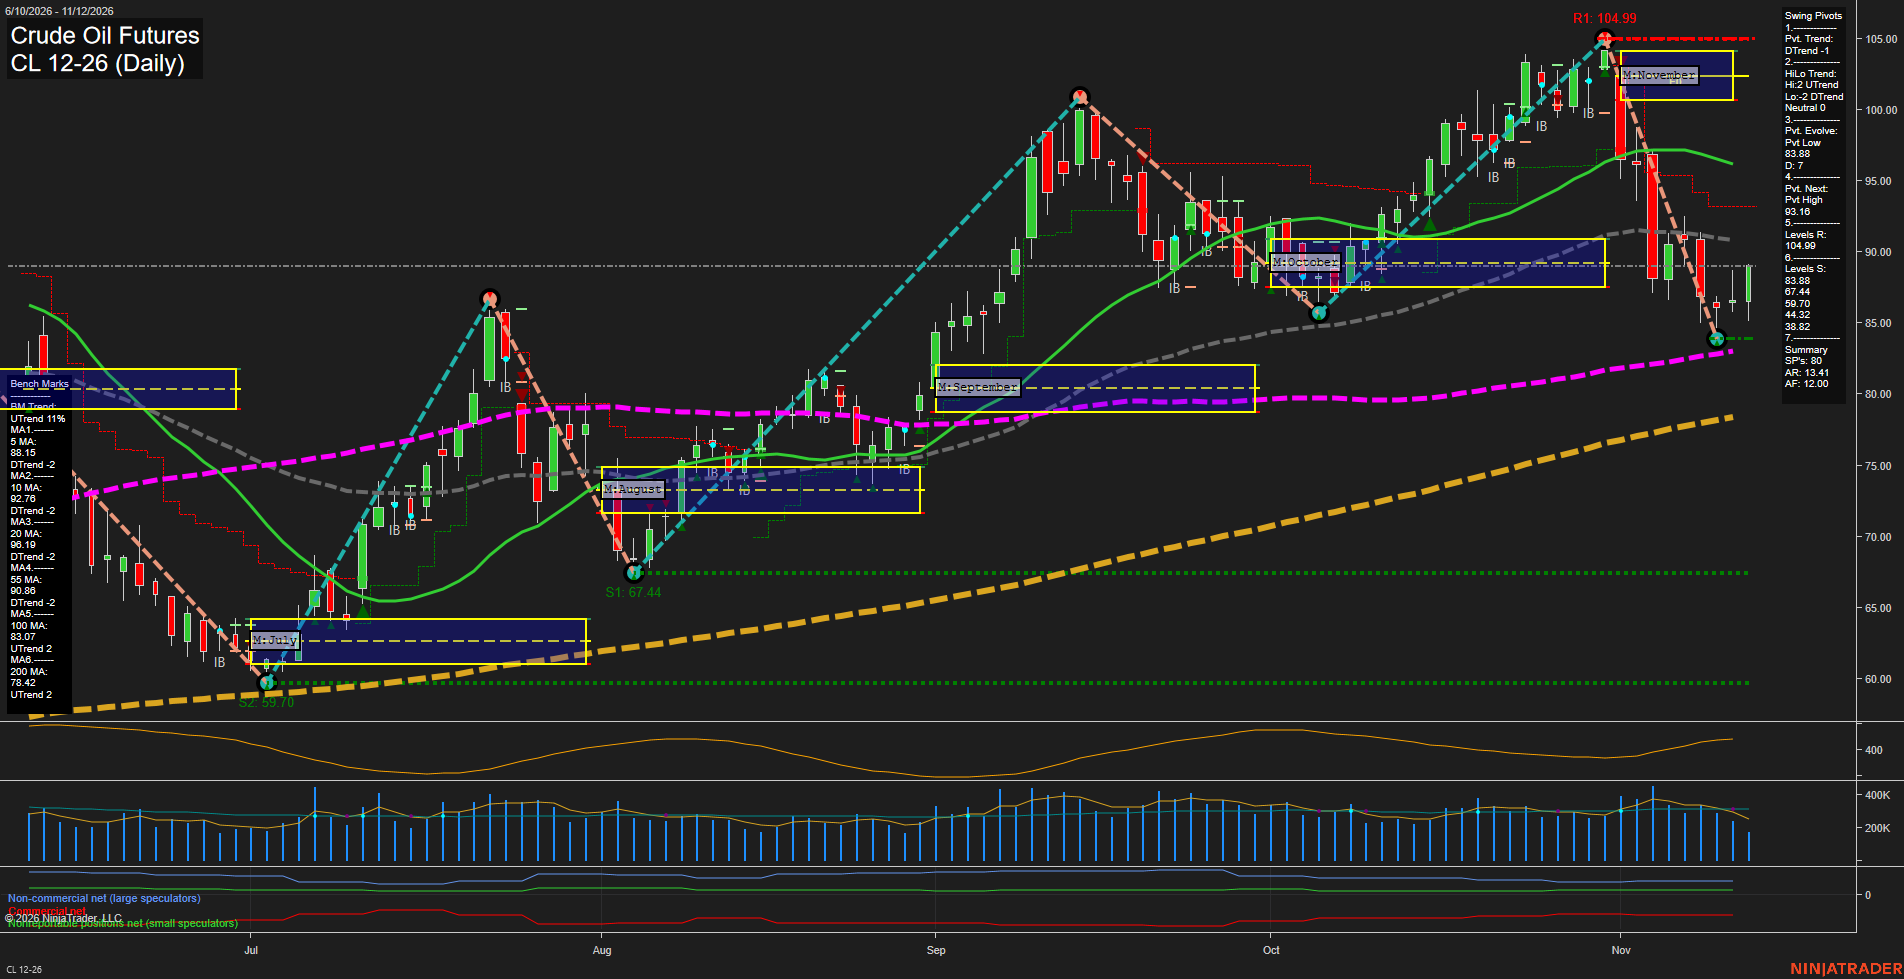
CL Daily View
Overall Rating
- Short-Term: Bearish
- Intermediate-Term: Bearish
- Long-Term: Bullish.
Key Insights Summary
Price remains in a sharp short-term retracement from the early-November high near 105, with the current price below the weekly and monthly Fib-grid balance areas and below the 5-, 10-, 20-, and 55-day benchmarks. The active pivot sequence is a DTrend, although the broader HiLo structure remains UTrend and price is still above rising 100- and 200-day benchmarks. The 83.88 pivot low is the immediate structural support, while 90.76 to 93.16 forms the nearest rebound and pivot-reversal zone. The decline has compressed toward small daily bars near support, indicating slower downside momentum after a high-volatility selloff.
View charts on: AlphaWebTrader HTF Charts
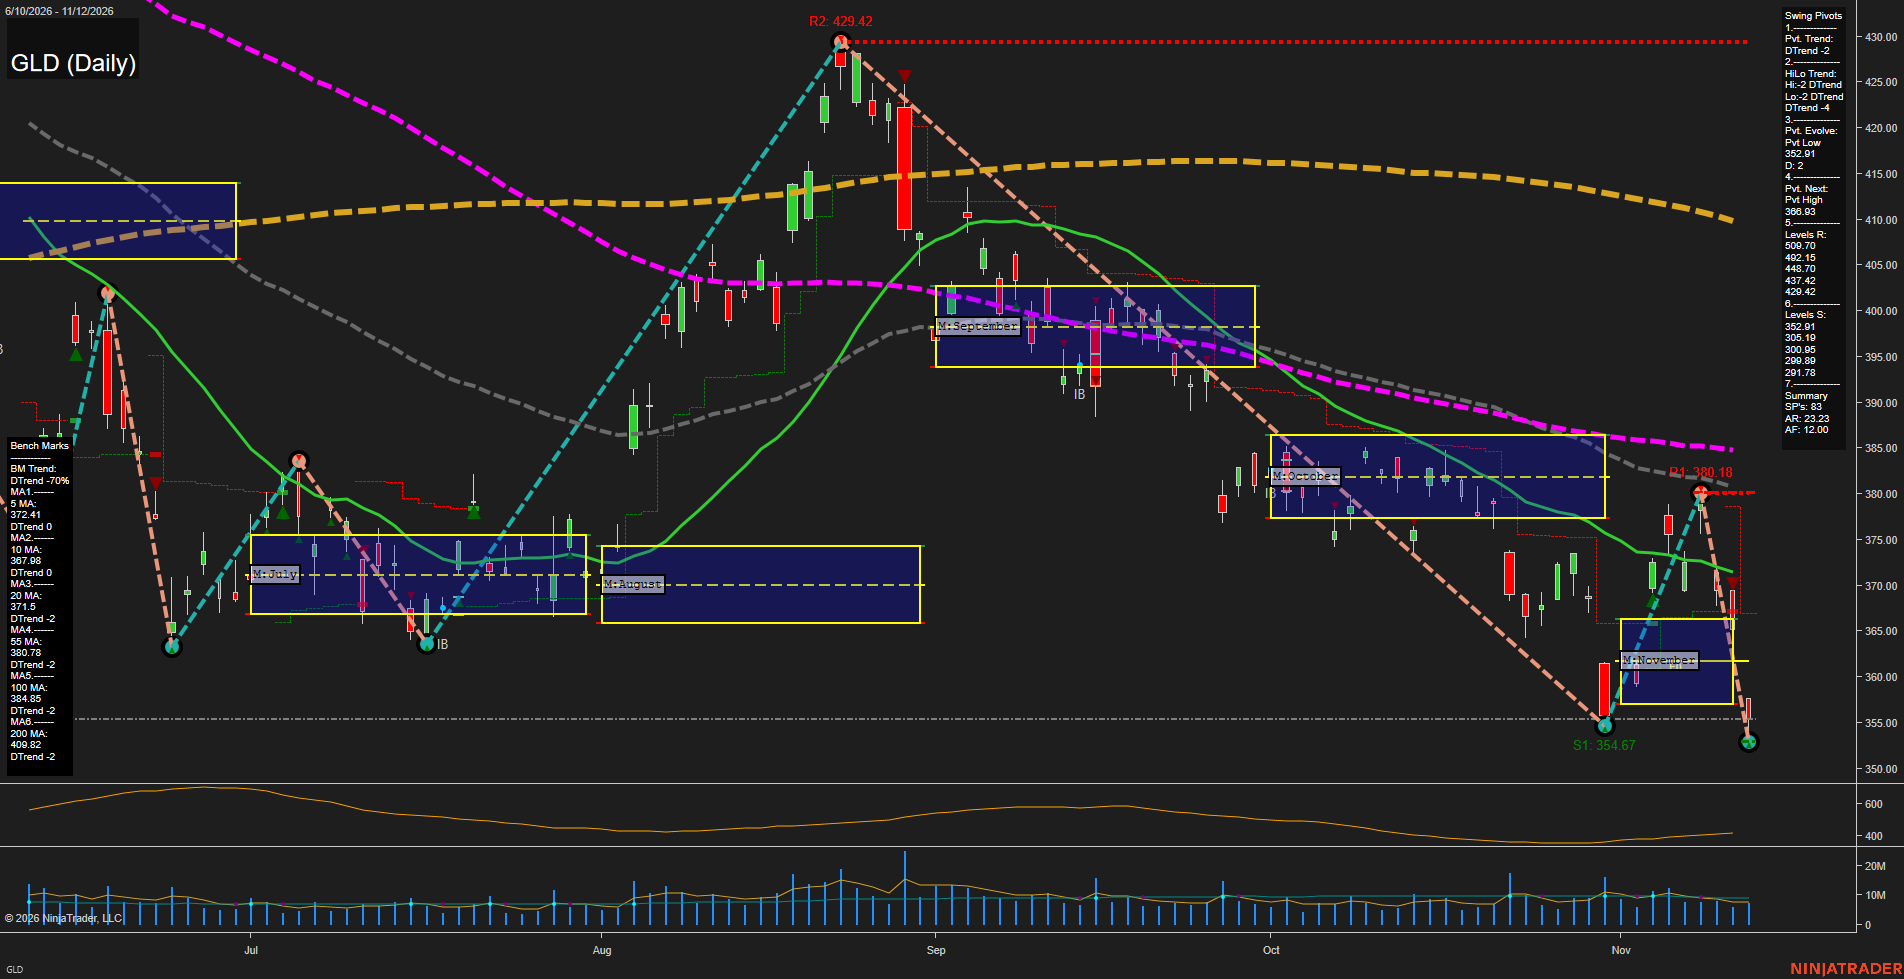
GLD Daily View
Overall Rating
- Short-Term: Bearish
- Intermediate-Term: Bearish
- Long-Term: Bearish.
Key Insights Summary
GLD remains in a broad futures-style bearish swing structure, with price below every listed benchmark and both pivot trend measures in DTrend. The rebound from the 354.67 swing low failed beneath the 378.55 next-pivot threshold and reversed sharply back to 364.89, producing fast downside momentum and large daily bars. November price is marginally above its monthly NTZ, but this localized positioning contrasts with the dominant lower-high and lower-low structure. The 364.89 pivot-low area is the immediate structural reference, while 354.67 remains the prior major downside swing extreme; upside structure remains capped by 372.02, 373.88, and 378.55.
View charts on: AlphaWebTrader HTF Charts
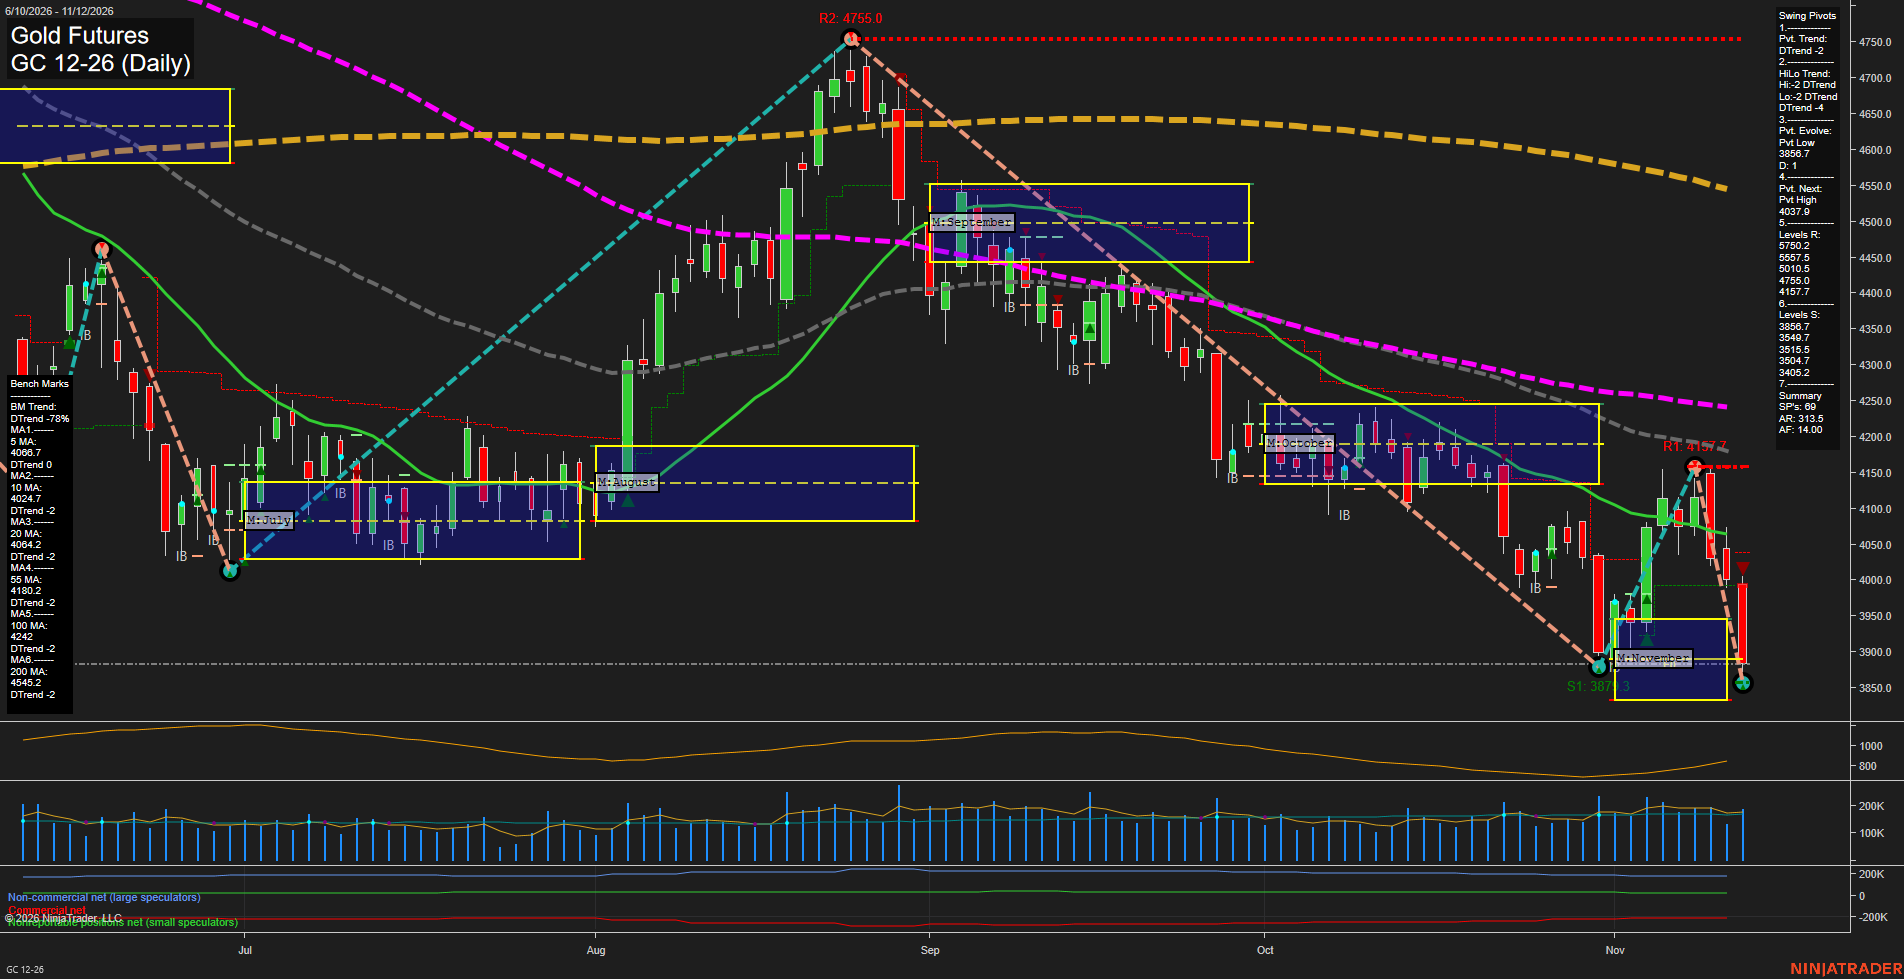
GC Daily View
Overall Rating
- Short-Term: Bearish
- Intermediate-Term: Bearish
- Long-Term: Bearish.
Key Insights Summary
GC remains in a broad bearish swing structure, with price below every daily benchmark and the pivot summaries confirming both short-term and intermediate-term DTrend conditions. The rebound from the 3879 area failed beneath the 4108.1 pivot threshold and the 4157.7 resistance level, producing a lower-high rejection and renewed downside momentum. Price is now near the active 3929.5 pivot-low support, while the monthly grid remains marginally positive and reflects a counter-trend recovery zone inside the larger downtrend. Elevated ATR and firm volume activity characterize a volatile decline rather than a low-volatility consolidation.
View charts on: AlphaWebTrader HTF Charts
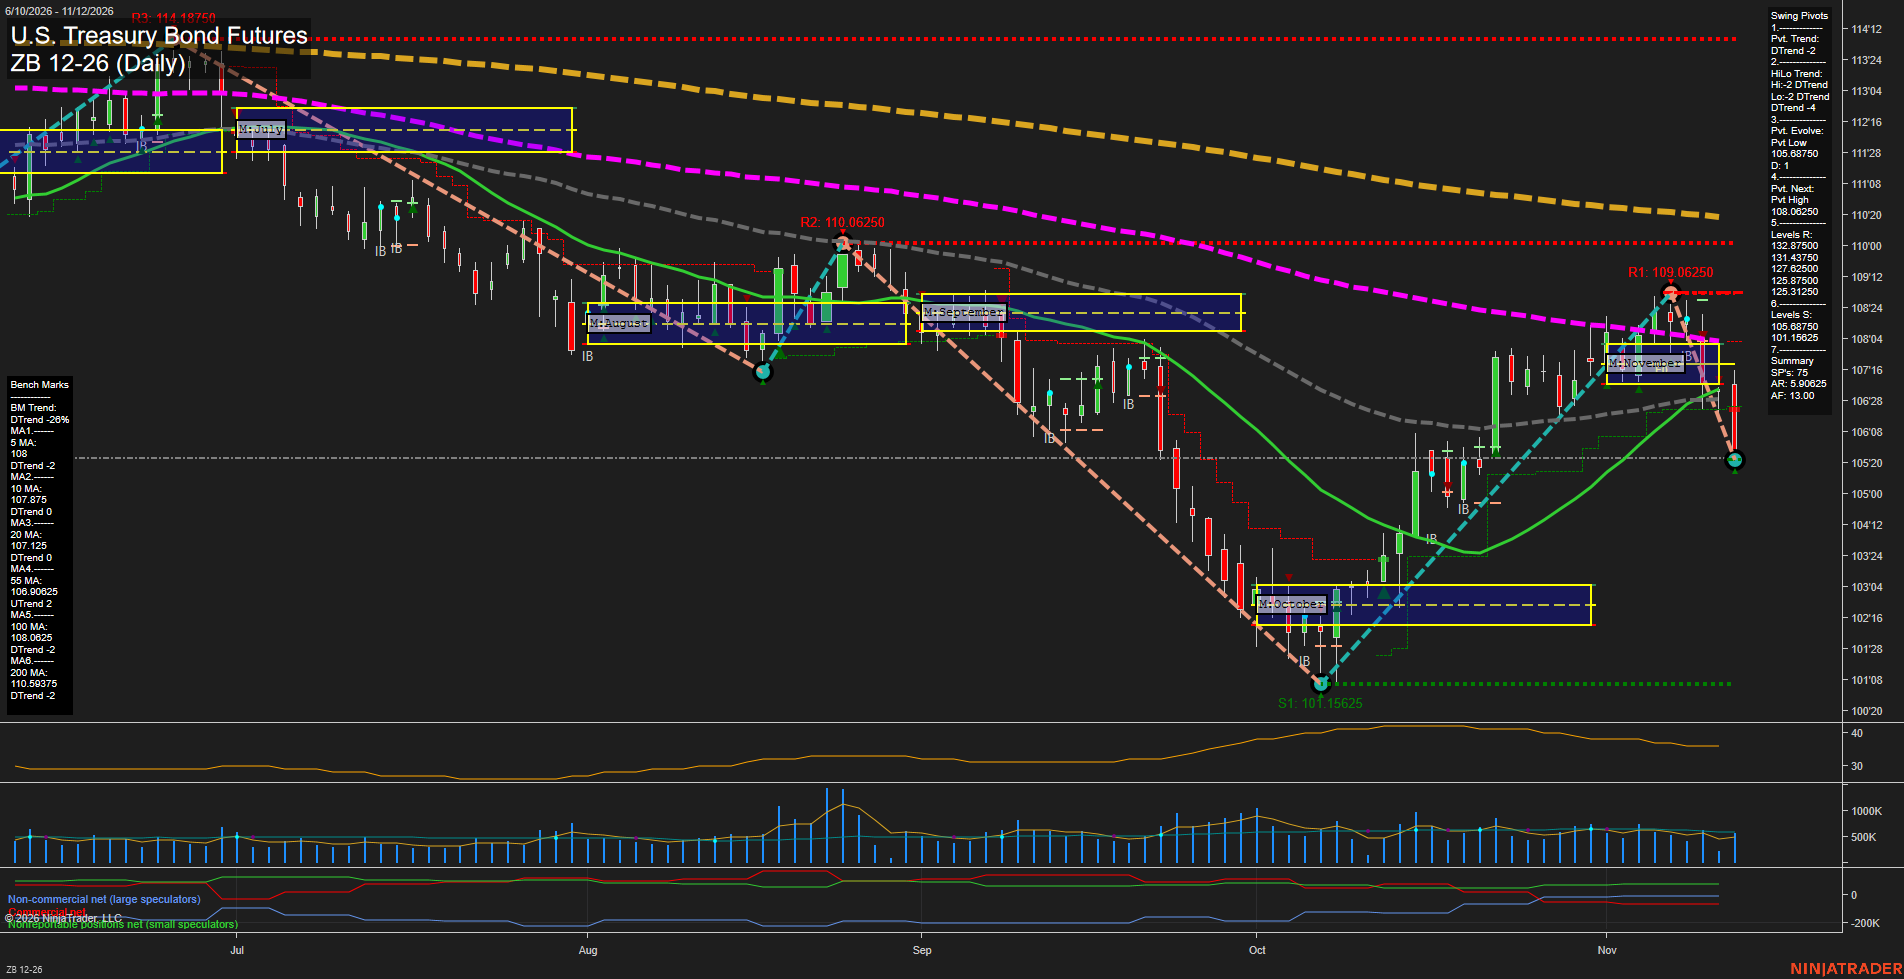
ZB Daily View
Overall Rating
- Short-Term: Bearish
- Intermediate-Term: Bearish
- Long-Term: Bearish.
Key Insights Summary
ZB has shifted from the October recovery into a sharp November reversal, with a large downside bar driving price below the weekly and monthly F0% areas. The short-term pivot structure is in DTrend, while the intermediate HiLo structure also remains DTrend. Price is below the 5-, 10-, 20-, 100-, and 200-day benchmarks; the rising 55-day average near 106.90825 has been lost, reinforcing the renewed downside impulse. The 106.40625 support area has been breached, leaving the October swing low near 101.15625 as the next major lower support reference. A recovery through the 108.78125 next-pivot threshold would be required to establish a new short-term pivot high, but the current chart remains characterized by lower-high resistance, accelerating momentum, and broad bearish alignment across the weekly, monthly, and yearly Fib grids.
View charts on: AlphaWebTrader HTF Charts
Sentiment Summary: Coverage was 50% negative versus 21% positive, led by reports on November 11 that Nvidia’s board was considering removing Jensen Huang; shares fell about 8% after hours, and Nasdaq-100 futures remained lower early November 12. China chip-export scrutiny and renewed Fed rate-hike concerns added pressure, while the main counterweight was Wednesday’s AI-stock rebound following CoreWeave’s strong results released late November 10, alongside gains in rival chipmakers AMD and Broadcom after hours.
Conclusion: The premarket context shows Nasdaq underperformance and semiconductor divergence, with Nvidia’s leadership decision unresolved and its November 17 earnings report still ahead.