Tech futures rebound into resistance as daily trends stay weak; no events remain today. Tomorrow: 08:30 ET claims, 13:00 ET Treasury bond auction.
Fundamentals: Wednesday's Nasdaq futures rose 1.8% after CoreWeave results revived AI confidence, while hot inflation tempered the rebound. No events remain on today's supplied calendar. Tomorrow, Thursday, brings claims at 08:30, housing data at 10:00, bill auctions at 11:30 and 13:00, a $25B 30-year bond auction at 13:00 and the budget statement at 14:00 ET, plus Fed speeches. Friday's PPI follows at 08:30 ET.
Technicals: S&P 500 and Nasdaq futures enter the coming NYSE session with bullish near-term recoveries testing resistance, while their daily medium trends remain bearish. Dow futures are consolidating after a volatile rebound, and midcap and small-cap futures face nearby resistance with mixed medium structures. DAX futures retain bullish alignment across timeframes but sit near major resistance after a sharp advance.
Pre-Market Trading 360° view Market Radar of: holidays, earnings, eco-news, market-news summary, news sentiment, prior session major ETFs, MAG7, Higher Time Frame Analysis Indices Futures Summary, and E-mini S&P500, Nasdaq 100, NYMEX Crude, Gold Futures Daily Chart analysis.
As of: November 11, 2026 07:16 CT
EcoNews Radar U.S. Events
| Date | Impact | Event, Prev, Forecast, Actual | Info |
|---|---|---|---|
| 2026-11-12 Thursday 08:30 | Medium | Initial Jobless Claims Prev: 189K Forecast: 195K Actual: — | Counts new applications for unemployment benefits, providing a timely gauge of layoffs that traders monitor for labor-market conditions and interest-rate expectations. |
| 2026-11-12 Thursday 09:00 | Medium | Fed's Hammack speech Prev: — Forecast: — Actual: — | Remarks may offer insight into the economic outlook and monetary-policy thinking, which traders monitor for implications for yields and equity valuations. |
| 2026-11-12 Thursday 10:00 | Medium | Fed's Barr speech Prev: — Forecast: — Actual: — | Remarks may address monetary policy, financial stability or banking conditions; traders monitor for signals relevant to interest rates and financial-sector sentiment. |
| 2026-11-12 Thursday 10:00 | Medium | Existing Home Sales Change (MoM) Prev: 1.5 Forecast: — Actual: — | Measures the monthly percentage change in completed sales of previously owned homes, helping traders assess housing demand and the economy’s sensitivity to borrowing costs. |
| 2026-11-12 Thursday 11:30 | Medium | Fed's Goolsbee speech Prev: — Forecast: — Actual: — | Comments may clarify views on inflation, employment and policy, helping traders assess the potential path of interest rates. |
| 2026-11-12 Thursday 11:30 | Medium | 4-Week Bill Auction · $115B Prev: 3.89% Forecast: — Actual: — | Reveals demand and clearing yields for short-term government funding; traders monitor money-market conditions and expectations for near-term policy rates. |
| 2026-11-12 Thursday 11:30 | Medium | 8-Week Bill Auction · $110B Prev: — Forecast: — Actual: — | Shows investor demand and funding costs at a short Treasury maturity, offering context on cash-market conditions and near-term interest-rate expectations. |
| 2026-11-12 Thursday 12:00 | Low | EIA Crude Oil Stocks Change Prev: -0.86M Forecast: -1.10M Actual: — | Tracks weekly changes in commercial crude inventories, helping traders assess petroleum supply-demand balances and potential implications for energy shares and inflation. |
| 2026-11-12 Thursday 13:00 | High | 30-Year Bond Auction · $25B Prev: 5.62% Forecast: — Actual: — | Tests demand for long-duration government debt; traders monitor clearing yields and bidding strength because long-term borrowing costs influence equity valuations. |
| 2026-11-12 Thursday 13:00 | Medium | 17-Week Bill Auction · $75B Prev: — Forecast: — Actual: — | Reveals demand for government debt maturing over an intermediate money-market horizon, helping traders assess funding conditions and expected short-term rates. |
| 2026-11-12 Thursday 13:10 | Medium | Fed's Daly speech Prev: — Forecast: — Actual: — | Remarks may illuminate the balance of inflation and employment risks, informing traders’ interpretation of the policy outlook and equity discount rates. |
| 2026-11-12 Thursday 13:30 | Medium | Fed's Schmid speech Prev: — Forecast: — Actual: — | Comments may provide perspective on economic conditions and monetary policy; traders watch for implications for rate expectations and risk sentiment. |
| 2026-11-12 Thursday 14:00 | Medium | Monthly Budget Statement Prev: -27.0B Forecast: -298.6B Actual: — | Reports federal receipts, spending and the resulting fiscal balance, helping traders assess borrowing needs and the broader Treasury supply backdrop. |
| 2026-11-12 Thursday 18:30 | Medium | Fed's Williams speech Prev: — Forecast: — Actual: — | Remarks may provide insight into monetary-policy thinking and economic risks, which traders monitor for implications for yields and equity valuations. |
| 2026-11-13 Friday 08:30 | High | Producer Price Index ex Food & Energy (MoM) Prev: 0.70% Forecast: 0.30% Actual: — | Measures monthly changes in producer selling prices excluding food and energy, helping traders assess underlying inflation pressures and potential policy implications. |
| 2026-11-13 Friday 08:30 | High | Producer Price Index (MoM) Prev: 1.30% Forecast: 0.40% Actual: — | Tracks monthly changes in prices received by domestic producers, offering a timely view of pipeline inflation that can influence rate expectations and corporate-margin assessments. |
| 2026-11-13 Friday 08:30 | Medium | Producer Price Index (YoY) Prev: 6.3% Forecast: 6.6% Actual: — | Measures annual changes in producer selling prices, helping traders evaluate the broader inflation trend and its implications for monetary policy. |
| 2026-11-13 Friday 08:30 | High | Producer Price Index ex Food & Energy (YoY) Prev: 5.0% Forecast: 5.0% Actual: — | Tracks annual producer-price changes excluding food and energy, providing a gauge of underlying inflation persistence relevant to interest-rate expectations and equity valuations. |
| 2026-11-13 Friday 10:50 | Medium | Fed's Bowman speech Prev: — Forecast: — Actual: — | Remarks may address policy, the economic outlook or banking issues; traders monitor for information relevant to interest rates and financial conditions. |
| 2026-11-13 Friday 12:00 | Medium | Fed's Daly speech Prev: — Forecast: — Actual: — | Comments may offer further perspective on inflation, employment and policy, helping traders interpret the outlook for borrowing costs and equity valuations. |
| 2026-11-13 Friday 19:00 | Medium | Fed's Jefferson speech Prev: — Forecast: — Actual: — | Remarks may clarify views on economic risks and monetary policy, which traders monitor for potential implications for yields and equity-market sentiment. |
Summary: The calendar centers on U.S. inflation signals, monetary-policy commentary and Treasury financing, alongside labor, housing and energy indicators.
Conclusion: Producer-price releases are concentrated on Friday morning, while the long-duration Treasury auction falls on Thursday.
NYSE Session Open Gap Radar
Session gaps compare the predicted opening price with the prior session’s close to predict the upcoming session’s opening gap pattern.
| Instrument | Gap | Prior Close | Predicted Open | Gap % |
|---|---|---|---|---|
| QQQ | ▲ OGU | 674.76 | 687.81 | ▲ +1.93% |
| SPY | ▲ OGU | 749.92 | 757.00 | ▲ +0.94% |
| IWM | ▲ OGU | 280.58 | 283.14 | ▲ +0.91% |
| USO | ▲ OGU | 141.45 | 142.73 | ▲ +0.90% |
| IJH | ▲ OGU | 74.13 | 74.80 | ▲ +0.90% |
| GLD | ▼ IGU | 369.36 | 370.52 | ▲ +0.31% |
| DIA | ▲ OGU | 521.73 | 523.26 | ▲ +0.29% |
| TLT | ▲ IGD | 80.88 | 80.76 | ▼ -0.14% |
Before the session opens, the table shows the predicted opening price and gap. Once the session opens, it uses the recorded opening price.
Glossary: IGU — Inside Gap Up: above the prior close, within the prior session’s range. IGD — Inside Gap Down: below the prior close, within that range. OGU — Outside Gap Up: above the prior session’s high. OGD — Outside Gap Down: below the prior session’s low.
As of: 2026-11-11 07:16 CT. Predicted gaps are best estimates as of publication and may change before the regular-session open, particularly when the session is still some time away.
Market News Summary:
AI-led gains lifted U.S. index futures ahead of Wednesday’s session, while hot inflation and renewed Fed tightening concerns tempered the rebound.
Primary Drivers & Risks:
- Primary Driver: CoreWeave earnings revive AI spending confidence
- Primary Risk: Hot inflation fuels further Fed tightening concerns
Tone:
A technology-led relief rebound faces persistent inflation and financing concerns.
Market News Sentiment
Sentiment Bias shows the balance of positive and negative news coverage sampled from 2026-11-10 08:27 to 2026-11-11 07:40 ET, covering stocks, energy and gold.
▼ Market news
- Bias
- ▼ -21.81%
- Articles
- 243
- Positive
- ▲ 16.87%
- Neutral
- — 44.44%
- Negative
- ▼ 38.68%
▼ GLD / Gold
- Bias
- ▼ -28.57%
- Articles
- 14
- Positive
- ▲ 28.57%
- Neutral
- — 14.29%
- Negative
- ▼ 57.14%
Sentiment Summary: Gold coverage was predominantly negative (57% versus 29% positive), as hotter-than-expected U.S. CPI on November 10 reinforced expectations for a December Fed rate increase, including a possible half-point hike; reports linked gold’s decline to rising Treasury yields and a stronger dollar. Gold rebounded in early Asian trading on November 11, while continued central-bank buying, including China’s two-year accumulation streak, provided a counterweight to inflation-driven selling. The recovery remained exposed to higher yields, with the November 13 U.S. producer-price report still ahead.
Conclusion: For indices futures day traders, this coverage highlights inflation-sensitive rate expectations rather than a broad safe-haven bid.
— USO / Oil
- Bias
- — 0.00%
- Articles
- 17
- Positive
- ▲ 29.41%
- Neutral
- — 41.18%
- Negative
- ▼ 29.41%
Sentiment Summary: Oil coverage was balanced at 29% positive and 29% negative, with 41% neutral: crude fell to its lowest since August on November 10 amid hopes of ending the Iran war, then rebounded overnight into November 11 as Hormuz shipping attacks and stalled negotiations renewed supply concerns. October CPI, reported November 10, rose 0.4% headline and 0.3% core month over month, reinforcing reported December rate-hike concerns; the counterweight was falling fuel costs, with average U.S. gasoline below $4 on November 10.
Conclusion: For index futures, the central context is persistent inflation pressure alongside an unstable retreat in energy prices.
Glossary: Sentiment Bias = (positive articles − negative articles) ÷ total articles × 100. It ranges from −100% negative to +100% positive. A reading near zero indicates little directional bias. Neutral articles reduce the score’s strength. ▲ positive; ▼ negative; — balanced. These readings describe news coverage, not market-price direction.
Market Technical Analysis
Analysis of VIX volatility, prior-session major ETFs and mega-cap tech stocks, and real-time futures snapshots and higher-time-frame analysis.
VIX — Market Fear Gauge Daily
| Level | Open | High | MaxVix | Low | MinVix | DNC% | DOC% | VR | MaxVR | MinVR |
|---|---|---|---|---|---|---|---|---|---|---|
| 19.46 | 21.33 | 21.43 | 28.36 | 19.29 | 16.21 | -2.31% | -8.77% | -6.27 | 56.57 | -0.20 |
VIX fell 8.77% from the session's opening level. VIX fell 2.31% versus the previous session close. Expected volatility eased from the period open. VIX is 26.7% up the recent 15-session range (16.21–28.36), in the 20–30% band.
VR: ATN Volatility Ratio (VR): -6.27 – SPY and VIX moved in the same direction. VR is below the minimum of its preceding 15-session VR range (-0.20 to 56.57). VR fell 12.25 points from the previous session, a moderate shift relative to that range.
Range lookback: preceding 15 completed sessions.
Major ETFs and Mega Cap Tech Stocks
- In an early premarket snapshot, Nasdaq 100 futures gained about 500 points, or 1.8%, while S&P 500 futures rose 0.7% and Dow futures added 0.2%.
- CoreWeave’s stronger-than-anticipated third-quarter results helped restore confidence in AI spending after an inflation-driven selloff.
- Nvidia rose approximately 2.48%, AMD gained more than 5%, and Intel advanced over 4% in indicative early trading.
- Nvidia opened an investigation into its CEO’s relationship with a person described in the reports as having alleged Chinese intelligence ties, following an approximately 4% share decline in the session after the news.
- China Renaissance upgraded Apple to Buy from Hold and assigned a $425 price target.
- Anthropic began its IPO roadshow with a $70–$78 price range and a targeted fully diluted valuation of up to $1.4 trillion.
- Separate coverage described investors moving toward low-volatility stocks amid recent AI-share declines and persistently high bond yields.
Oil / Energy:
- European natural gas prices climbed above €85 per megawatt-hour as accelerating storage withdrawals raised supply concerns.
Fed / Financials:
- October CPI increased 0.4%, exceeding the 0.3% consensus estimate.
- Goldman Sachs revised its interest-rate forecast to include additional Fed tightening after Tuesday’s inflation report.
- Sterling declined against a firmer dollar as markets priced in a more hawkish Fed.
- Market commentary identified rising debt financing for AI expansion and associated credit-market strain as risks to the sector.
Macro / Other:
- October retail spending totaled $561.7 billion on a seasonally adjusted basis, increasing 0.2% month over month and 3.6% year over year.
- A core retail spending gauge rose 0.3% month over month and 3.4% year over year to $454.2 billion.
Conclusion:
CoreWeave’s results and renewed confidence in AI spending powered the index-futures rebound, with Nasdaq 100 contracts leading. Above-consensus CPI and Goldman’s revised Fed outlook remained the principal counterweights.
Nvidia’s investigation and debt-financing concerns added company-specific and sector-level risks. Higher European gas prices and modest monthly retail-spending growth formed additional macroeconomic cross-currents.
ETF, Mag7, and Cross-Market ETF prior day Insights
Overall Tone
On November 10, 2026, daily risk tone was uneven: index ETFs broadly gained from the open but remained below prior closes, while mega-cap participation was weaker.
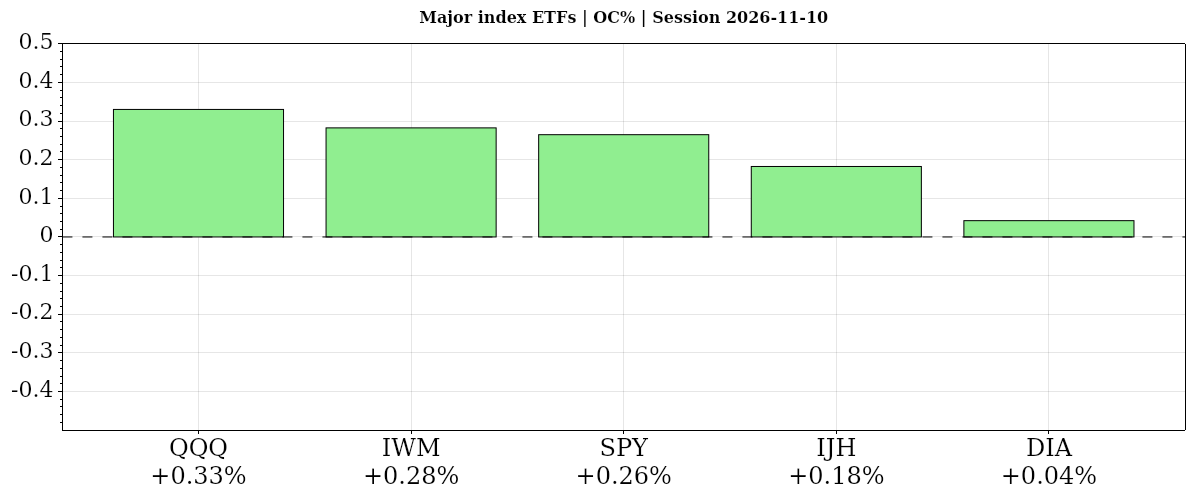
| Instrument | Bias | Date | DNC% | DOC% | O | H | L | C | VWAP | Vol |
|---|---|---|---|---|---|---|---|---|---|---|
| ▲ QQQ | ▼ ▲ ▲ | 2026-11-10 | ▼ -0.68% | ▲ +0.33% | 672.54 | 680.95 | 667.05 | 674.76 | ▲ 673.47 | 36,917,393 |
| ▲ IWM | ▼ ▲ ▲ | 2026-11-10 | ▼ -0.68% | ▲ +0.28% | 279.79 | 281.33 | 277.91 | 280.58 | ▲ 279.72 | 21,430,514 |
| ▲ SPY | ▼ ▲ ▲ | 2026-11-10 | ▼ -0.37% | ▲ +0.26% | 747.94 | 752.14 | 744.86 | 749.92 | ▲ 748.54 | 39,536,113 |
| ▲ IJH | ▼ ▲ ▲ | 2026-11-10 | ▼ -0.35% | ▲ +0.18% | 74.00 | 74.25 | 73.49 | 74.13 | ▲ 73.95 | 7,045,662 |
| ▲ DIA | ▼ ▲ ▲ | 2026-11-10 | ▼ -0.31% | ▲ +0.04% | 521.51 | 522.60 | 519.19 | 521.73 | ▲ 520.95 | 3,060,088 |
| AVG/Sum | — | — | -0.48% | +0.22% | — | — | — | — | — | 107,989,770 |
Index ETFs
Mixed: average DOC% +0.22% from the open; DNC% -0.48% versus the prior close. All five gained from the open, led by QQQ, with DIA near-flat; all declined versus the prior close, with DIA most resilient and QQQ and IWM weakest. QQQ’s near- and intermediate-term downtrends persisted.
QQQ · D:2026-11-10 NC% ▼ -0.68% OC% ▲ +0.33%
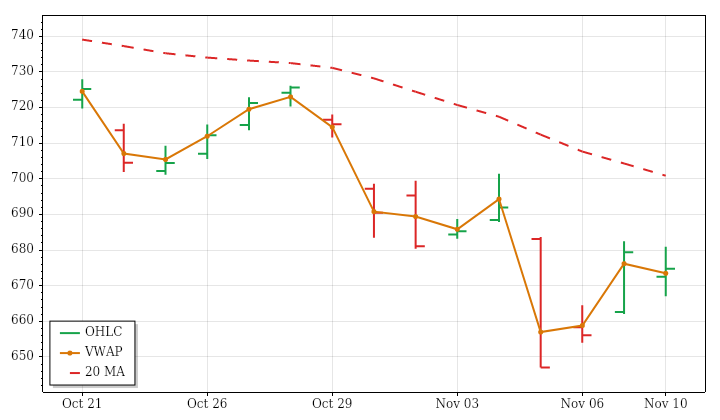
QQQ – Nasdaq 100 Technicals Summary
QQQ ended the completed November 10 daily session at 674.76, down 0.68% from the prior close but up 0.33% from the open. The opening gap lower was filled during trading, although the recovery did not hold above the prior close. A finish above session VWAP showed intraday improvement, while the inside bar kept the session contained within the previous day's range.
Near- and intermediate-term averages remained falling above price, consistent with the declining 15-session price trend. The far-term average was still rising slightly, but price stood below it, creating a mixed longer-term picture rather than a clean upward alignment. Latest range was modestly above average, consistent with lookback expansion, while volume was only about 70% of average despite an increasing trend. Bearish PSAR and ATR-median states persisted; a next-session high above 684.9278 would conditionally reverse PSAR upward.
Nasdaq 100 News and Fundamentals
The Nasdaq-100 surged, with chip stocks driving gains even as Nvidia, its second-largest holding, declined amid an investigation involving its CEO.
IWM · D:2026-11-10 NC% ▼ -0.68% OC% ▲ +0.28%
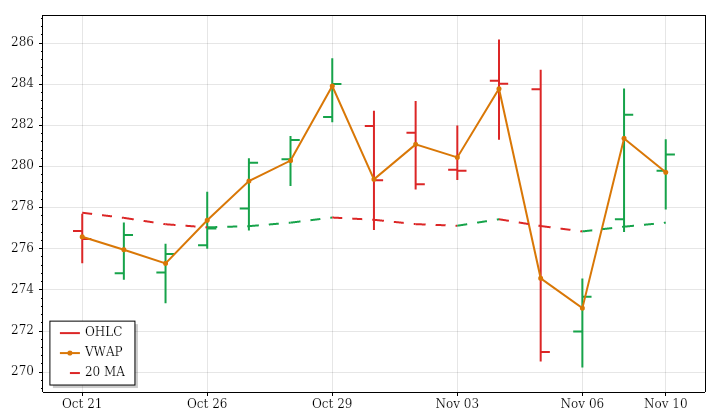
IWM – Small Cap Technicals Summary
IWM's completed November 10 daily session closed at 280.58, down 0.68% versus the prior close but up 0.28% from the open. The opening gap lower remained unfilled, so the intraday recovery did not translate into a positive daily return. An inside bar contained the price action within the prior day's range, and the finish above session VWAP and near the high showed relative strength after the weak opening.
That recovery fit the rising near-term average beneath price, but the intermediate average was still falling and the far-term average remained above price with a slight downward direction. The setup therefore retained shorter-term strength within a weaker longer-term structure. Latest range and volume were below average, contrasting with expanding ranges and increasing lookback volume. Bearish PSAR and ATR-median states added conflict; a next-session high above 283.79 would conditionally reverse PSAR upward.
SPY · D:2026-11-10 NC% ▼ -0.37% OC% ▲ +0.26%
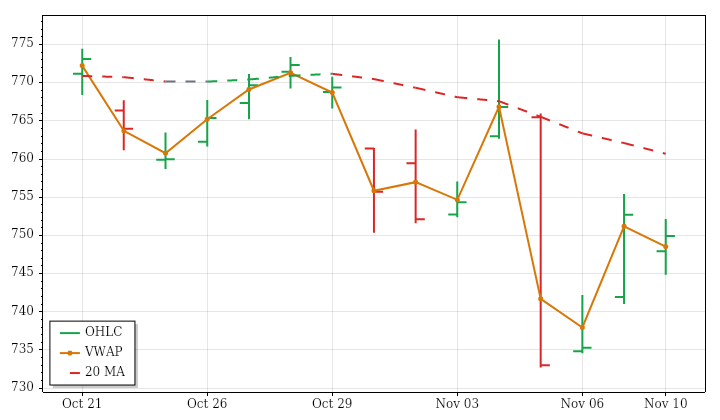
SPY – S&P 500 Technicals Summary
SPY's completed November 10 daily session closed at 749.92, down 0.37% versus the prior close but up 0.26% from the open. The opening gap lower remained unfilled. Trading stayed within the prior day's range, and the close above session VWAP reflected an intraday recovery without erasing the daily loss or establishing a break from the contained session structure.
Price remained beneath falling near- and intermediate-term averages, matching the declining 15-session price trend. The far-term average continued rising below price, so the main conflict was shorter- and intermediate-term weakness within a still-rising longer-term structure. The session range and volume were both below average, unlike the expanding ranges and increasing volume across the lookback. Bearish PSAR and ATR-median states remained consistent with the shorter-term weakness. A next-session high above 769.5171 would conditionally reverse PSAR upward.
S&P 500 News and Fundamentals
The S&P 500 declined 2.68% from its October close through November 6, marking its third-weakest start to November since 1950. The index had also declined over the preceding month but remained short of correction territory.
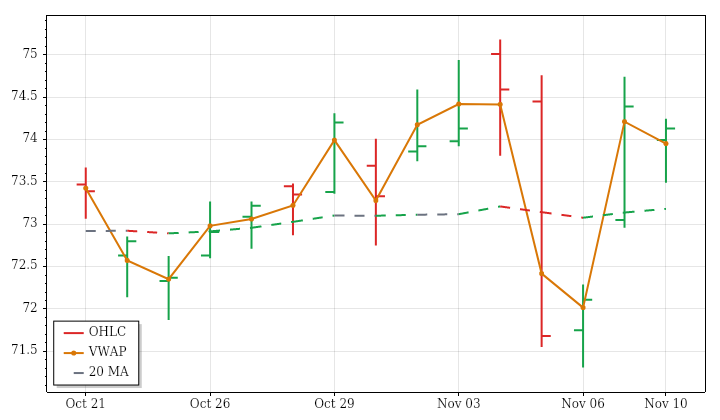
IJH · D:2026-11-10 NC% ▼ -0.35% OC% ▲ +0.18%
IJH – Mid Cap Technicals Summary
IJH ended the completed November 10 daily session at 74.13, down 0.35% from the prior close despite gaining 0.18% from the open. The opening gap lower was not filled. Trading remained inside the previous day's range, while the close above VWAP and near the session high indicated an intraday recovery that stopped short of restoring the prior closing level.
The near-term average was rising beneath price, and the far-term average also remained slightly below the close with a shallow upward direction. The intermediate average, however, was still falling despite price holding above it. That mixed alignment was compounded by a bearish ATR-median crossover and a downward PSAR state. Latest-session range and volume were below average, unlike the expanding ranges and increasing volume of the preceding 15 sessions. A next-session high above 74.74 would conditionally reverse PSAR upward.
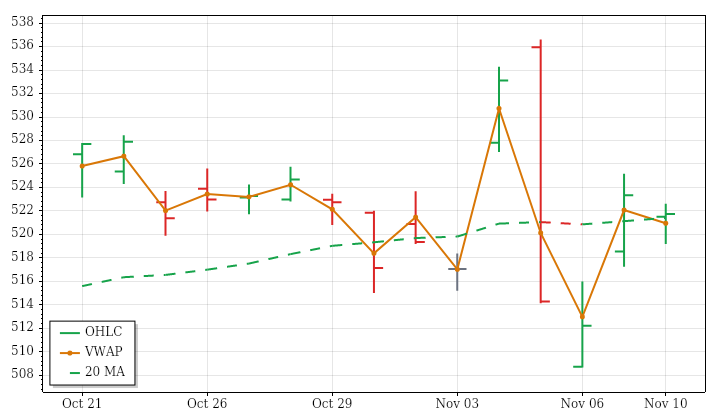
DIA · D:2026-11-10 NC% ▼ -0.31% OC% ▲ +0.04%
DIA – Dow Jones Technicals Summary
DIA ended the completed November 10 daily session at 521.73, down 0.31% from the prior close but up 0.04% from the open. The opening gap lower remained unfilled, explaining why a nearly flat open-to-close result still registered a daily loss. Trading stayed inside the previous day's range, and the finish above session VWAP and near the session high showed an intraday recovery without reclaiming the prior close.
The broader structure remained uneven. Price was above a falling near-term average, while intermediate- and far-term averages were rising beneath it. That longer-term alignment contrasted with the declining 15-session price trend and bearish shorter-term technical states. The latest range was only about 56% of average, with below-average volume, despite expanding ranges and increasing volume over the lookback. A next-session high above 531.2914 would conditionally reverse the downward PSAR state.
| Instrument | Bias | Date | DNC% | DOC% | O | H | L | C | VWAP | Vol |
|---|---|---|---|---|---|---|---|---|---|---|
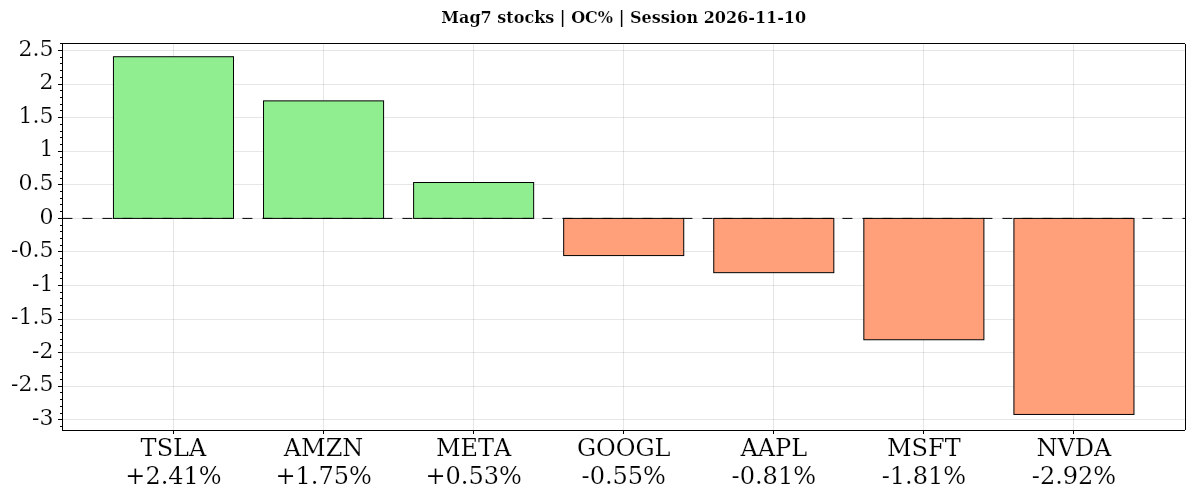
| ▲ TSLA | ▲ ▲ ▲ | 2026-11-10 | ▲ +0.46% | ▲ +2.41% | 370.85 | 380.00 | 370.40 | 379.78 | ▲ 377.04 | 23,965,494 |
| ▲ AMZN | ▲ ▲ ▲ | 2026-11-10 | ▲ +1.48% | ▲ +1.75% | 266.21 | 272.88 | 266.14 | 270.87 | ▲ 270.42 | 38,132,604 |
| ▲ META | ▲ ▲ ▼ | 2026-11-10 | ▲ 0.00% | ▲ +0.53% | 637.98 | 647.27 | 635.50 | 641.39 | ▼ 641.69 | 12,770,035 |
| ▼ GOOGL | ▼ ▼ ▼ | 2026-11-10 | ▼ -0.27% | ▼ -0.55% | 288.98 | 292.02 | 285.68 | 287.38 | ▼ 288.10 | 28,296,530 |
| ▼ AAPL | ▼ ▼ ▼ | 2026-11-10 | ▼ -0.62% | ▼ -0.81% | 351.35 | 353.87 | 346.46 | 348.51 | ▼ 348.63 | 28,261,340 |
| ▼ MSFT | ▼ ▼ ▼ | 2026-11-10 | ▼ -2.20% | ▼ -1.81% | 542.98 | 544.19 | 526.37 | 533.16 | ▼ 535.23 | 25,940,779 |
| ▼ NVDA | ▼ ▼ ▼ | 2026-11-10 | ▼ -5.47% | ▼ -2.92% | 173.97 | 174.69 | 165.89 | 168.89 | ▼ 169.29 | 422,598,531 |
| AVG/Sum | — | — | -0.95% | -0.20% | — | — | — | — | — | 579,965,313 |
Mag7 Stocks
Negative confluence: average DOC% -0.20% from the open; DNC% -0.95% versus the prior close. Three of seven gained from the open, led by Tesla, while Nvidia lagged; Amazon led versus the prior close, Meta was flat, and Nvidia fell 5.47%. Nvidia’s decline accompanied above-average volume and aligned near- and intermediate-term downtrends.
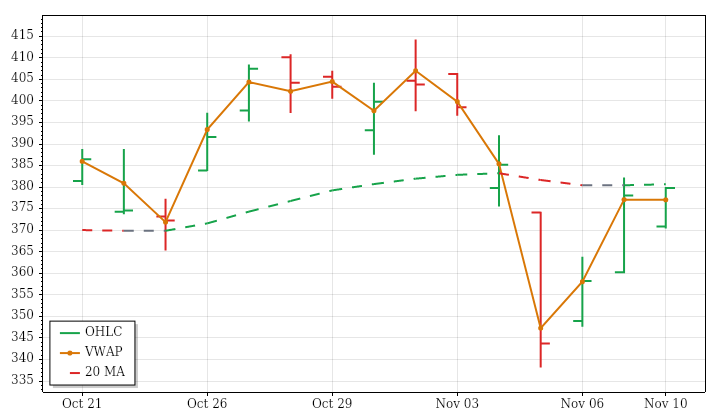
TSLA · D:2026-11-10 NC% ▲ +0.46% OC% ▲ +2.41%
TSLA – Tesla Technicals Summary
TSLA's completed November 10 daily session recovered from an opening gap lower to close at 379.78. The gain was 0.46% versus the prior close, substantially smaller than the 2.41% advance from the open. The gap was filled, and the finish above VWAP and near the session high showed a strong intraday recovery. However, the inside bar kept that rebound within the previous day's range.
Price remained above rising near- and intermediate-term averages, while the far-term average was falling beneath it. This supported shorter-term strength without full longer-term alignment, and the preceding 15 sessions still showed a declining price trend with considerable back-and-forth movement. Latest range and volume were well below average, contrary to their expanding and increasing lookback trends. Bearish PSAR and ATR-median states also conflicted with the recovery. A next-session high above 390.8392 would conditionally reverse PSAR upward.
Tesla News and Fundamentals
Tesla’s October retail sales in China fell to their lowest level since 2022.
AMZN · D:2026-11-10 NC% ▲ +1.48% OC% ▲ +1.75%
AMZN – Amazon Technicals Summary
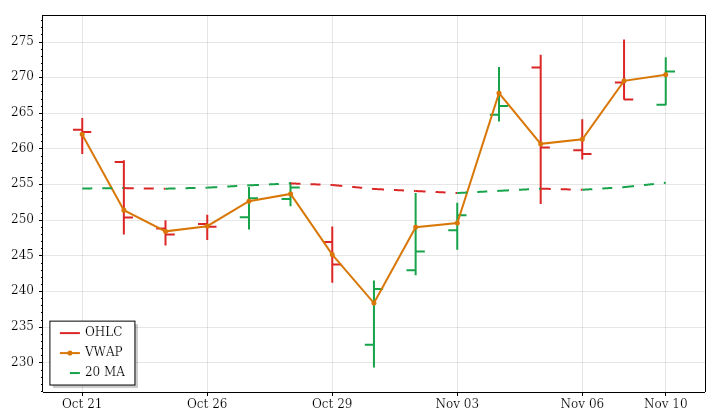
AMZN's completed November 10 daily session recovered from an opening gap lower to close at 270.87. The gain was 1.48% against the prior close, compared with 1.75% from the open. The gap was filled and the close finished above session VWAP, but a lower high and lower low, together with a finish inside the previous day's range, kept the advance within a mixed daily structure.
The recovery left price above its near- and intermediate-term averages, although both averages were still falling. That conflict distinguishes the latest strength from a fully aligned uptrend; the far-term average remained rising beneath price. The preceding 15 sessions also showed considerable back-and-forth movement despite a positive price trend. Latest-session range and volume were below average, unlike their expanding and increasing lookback trends. A next-session low below 252.7855 would conditionally reverse the upward PSAR state.
Amazon News and Fundamentals
Amazon’s Ring unveiled a flying indoor security drone and a patrolling robot for businesses. The $250 Ring Drone Cam can investigate suspicious activity room to room and capture nighttime footage. AWS revenue grew 39.3% last quarter, its fastest pace in nearly five years, with backlog reaching $578 billion. Amazon’s roughly $220 billion spending plan accompanies that expansion, while heavy capital expenditures are weighing on cash generation.
META · D:2026-11-10 NC% ▲ 0.00% OC% ▲ +0.53%
META – Meta Platforms Technicals Summary
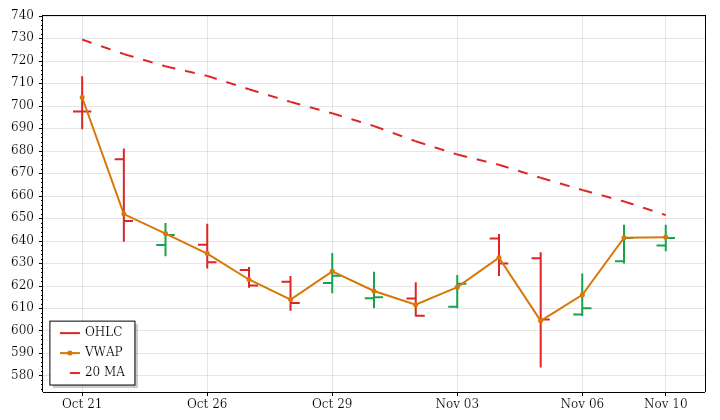
META's completed November 10 daily session ended at 641.39, virtually unchanged from the prior close but up 0.53% from the open. The opening gap lower was filled, and the session recorded a higher high and higher low. Nevertheless, the close stayed inside the previous day's range and slightly below session VWAP, limiting the evidence for a decisive improvement despite the open-to-close recovery.
Price was above its falling near-term average but below its falling intermediate average, while the far-term average remained rising beneath it. This uneven alignment placed the latest rebound against a declining 15-session price trend rather than a unified upward structure. Both range and volume were subdued; volume was less than half its average, consistent with the decreasing lookback volume trend. The newly upward PSAR state contrasted with bearish ATR-median readings. A next-session low below 586.9738 would conditionally reverse PSAR downward.
Meta News and Fundamentals
Meta announced on Monday that its Muse AI agent is launching on Apple Watch and Android Wear OS. Users can interact with the assistant through voice calls, text messages or dictation directly from their smartwatch. Separately, a $9.89 billion legal charge weighed heavily on reported earnings despite strong advertising growth.
GOOGL · D:2026-11-10 NC% ▼ -0.27% OC% ▼ -0.55%
GOOGL – Alphabet Technicals Summary
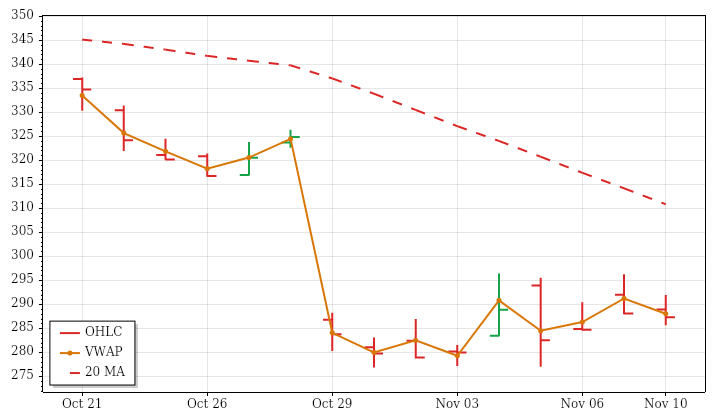
GOOGL closed its completed November 10 daily session at 287.38, down 0.27% from the prior close and 0.55% from the open. An opening gap higher was filled, and the session subsequently finished below both VWAP and the previous day's low. The lower high and lower low connected the modest latest-session loss with the more substantial decline evident across the preceding 15 sessions.
Price sat just above its near-term average, but that average was falling sharply, leaving the near-term picture mixed rather than upwardly aligned. Intermediate- and far-term averages remained falling well above price, reinforcing the broader weakness. The latest range and volume were below average, despite expanding ranges and increasing volume over the lookback. A newly upward PSAR state offered a conflicting shorter-term reading, not confirmation of a trend change; a next-session low below 277.8905 would conditionally reverse that state.
AAPL · D:2026-11-10 NC% ▼ -0.62% OC% ▼ -0.81%
AAPL – Apple Technicals Summary
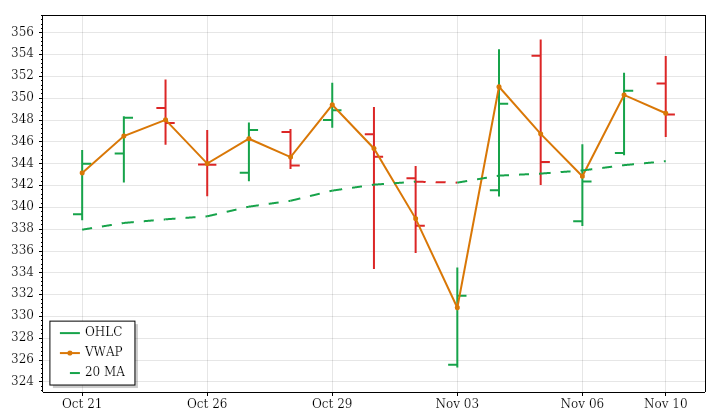
AAPL's completed daily session on November 10 closed at 348.51, down 0.62% from the prior close and 0.81% from the open. The small opening gap higher was filled, and trading crossed both sides of the open before finishing slightly below session VWAP. Although the session produced a higher high and higher low, the close remained inside the prior day's range, making the decline a setback rather than evidence of a broader trend reversal.
Price remained above rising near-, intermediate- and far-term averages, so the moving-average structure stayed aligned upward. The recent lookback nevertheless showed little directional progress relative to total movement. The latest range was roughly typical, while volume was only about 55% of average, contrasting with expanding ranges and increasing volume across the preceding 15 sessions. A next-session low below 334.5689 would conditionally reverse the upward PSAR state.
Apple News and Fundamentals
Apple is pursuing a capital-light AI strategy, using partnerships such as Google’s Gemini to enhance Siri without large infrastructure outlays. Reported operating cash flow is nearly $16 for every $1 of capital expenditure. Rising memory costs pose a margin risk.
MSFT · D:2026-11-10 NC% ▼ -2.20% OC% ▼ -1.81%
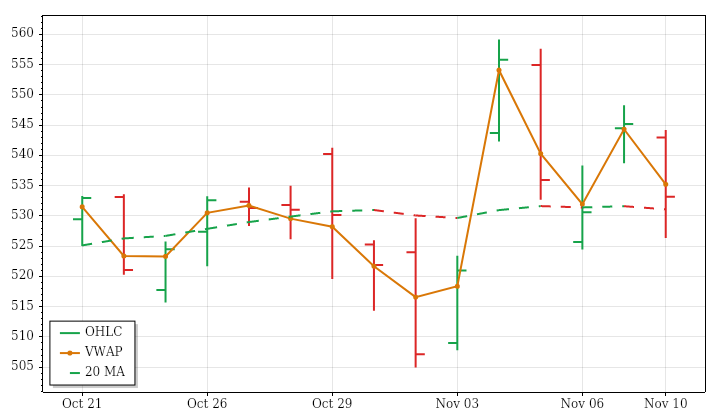
MSFT – Microsoft Technicals Summary
MSFT closed its completed November 10 daily session at 533.16, down 2.20% from the prior close and 1.81% from the open. The opening gap lower remained unfilled, and further selling produced a lower high, lower low and finish below the previous day's low. The close below session VWAP reinforced the session's weakness rather than suggesting that the daily loss was solely an opening-gap effect.
Price finished below its slightly falling near-term average, while intermediate- and far-term averages continued rising beneath it. The latest decline therefore reflected shorter-term weakness within an otherwise upward longer-term structure. Range was about 130% of average, consistent with expanding lookback ranges, but volume was slightly below average despite its increasing 15-session trend. Upward PSAR and ATR-median states remained in conflict with the latest price action. A next-session low below 515.0119 would conditionally reverse PSAR downward.
Microsoft News and Fundamentals
Microsoft and Ohio State University announced a five-year partnership on November 10 covering healthcare, research and education. The collaboration includes modernizing cloud and data infrastructure, applying AI to clinical and research work, and expanding AI skills and certifications. Microsoft also faces potential enterprise-software competition from Anthropic’s newly introduced workplace tools. A separate report highlighted Microsoft’s concerns about a possible U.S. ban on Chinese optical receivers.
NVDA · D:2026-11-10 NC% ▼ -5.47% OC% ▼ -2.92%
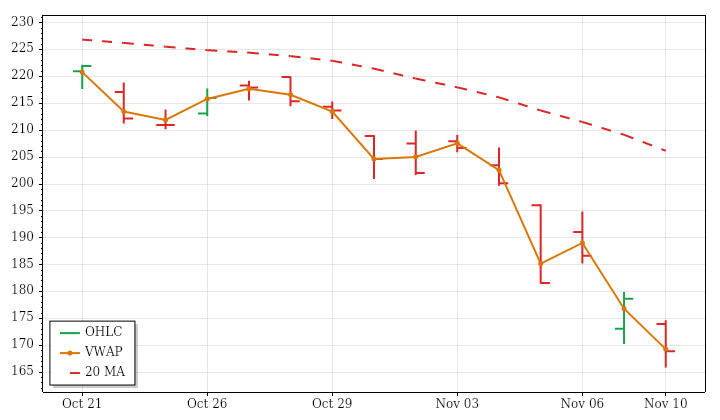
NVDA – Nvidia Technicals Summary
NVDA's completed November 10 daily session closed at 168.89, down 5.47% against the prior close and 2.92% from the open. An unfilled opening gap lower was followed by further losses, a lower high and lower low, and a finish below the previous day's low and session VWAP. This extended the declining lookback price trend rather than presenting an isolated gap-driven setback.
Near- and intermediate-term averages were falling above price. The far-term average was still edging upward, but price remained substantially below it, leaving that horizon mixed rather than bullishly aligned. The latest range was 132% of average, marking a fifth consecutive large-range session, while volume reached about 2.88 times average. Both supported the established lookback pattern of expanding ranges and increasing participation. Bearish technical states remained consistent with the weakness; a next-session high above 195.5961 would conditionally reverse PSAR upward.
Nvidia News and Fundamentals
Nvidia’s board launched an independent investigation into whether CEO Jensen Huang was targeted by a Chinese intelligence operation, with former prosecutor Joon Kim leading the inquiry. Huang held his regular executive meeting after admitting an extramarital affair. The Information alleged the relationship may have facilitated at least $7.5 billion in chip transfers to Chinese firms, including restricted chips; the allegations remain unproven and Reuters could not independently verify them. Shares closed November 10 at $168.80, down about 5.5%.
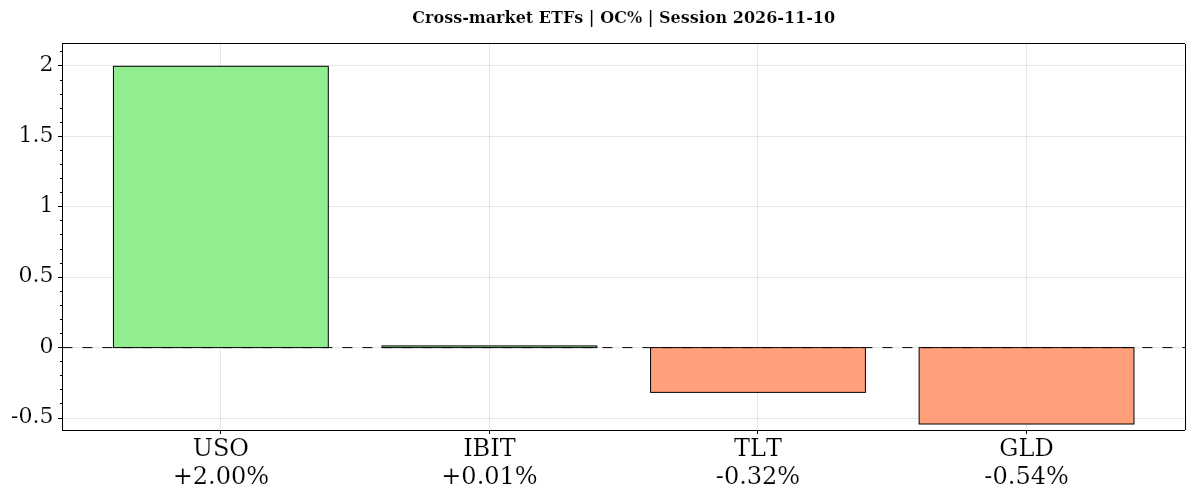
| Instrument | Bias | Date | DNC% | DOC% | O | H | L | C | VWAP | Vol |
|---|---|---|---|---|---|---|---|---|---|---|
| ▲ USO | ▼ ▲ ▲ | 2026-11-10 | ▼ -0.85% | ▲ +2.00% | 138.68 | 142.62 | 138.47 | 141.45 | ▲ 140.76 | 4,020,670 |
| ▲ IBIT | ▼ ▲ ▲ | 2026-11-10 | ▼ -1.51% | ▲ +0.01% | 41.67 | 42.28 | 41.10 | 41.68 | ▲ 41.59 | 39,111,125 |
| ▼ TLT | ▼ ▼ ▲ | 2026-11-10 | ▼ -1.32% | ▼ -0.32% | 81.14 | 81.17 | 80.54 | 80.88 | ▲ 80.84 | 39,058,043 |
| ▼ GLD | ▼ ▼ ▼ | 2026-11-10 | ▼ -2.68% | ▼ -0.54% | 371.38 | 371.88 | 367.80 | 369.36 | ▼ 369.72 | 7,882,214 |
| AVG/Sum | — | — | -1.59% | +0.29% | — | — | — | — | — | 90,072,052 |
Cross-Market ETFs
Mixed: average DOC% +0.29% from the open; DNC% -1.59% versus the prior close. Oil led from the open, bitcoin was near-flat, and gold and bonds declined; all four lost versus the prior close, offering no positive daily divergence from equities. Gold’s downtrends aligned across horizons despite oil’s rising longer-term structure.
USO · D:2026-11-10 NC% ▼ -0.85% OC% ▲ +2.00%
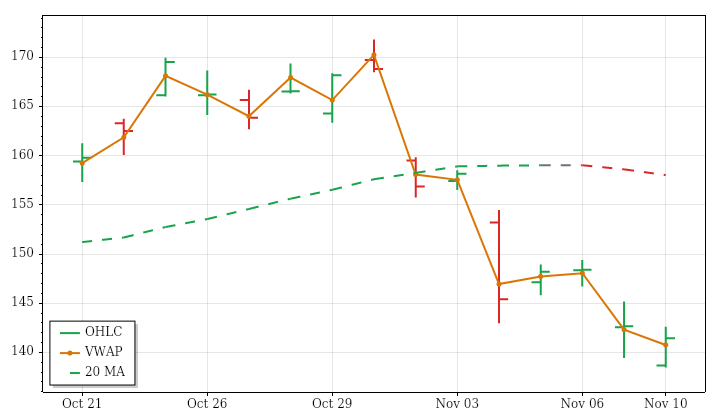
USO – Oil Technicals Summary
USO ended the completed November 10 daily session at 141.45, down 0.85% against the prior close despite gaining 2.00% from the open. The opening gap lower remained unfilled, explaining the difference between the daily loss and intraday advance. Price finished above session VWAP and inside the previous day's range, but the lower high and lower low preserved a weak day-to-day structure.
The close remained below a falling near-term average and below a rising intermediate average, while the far-term average continued rising beneath price. The result was shorter-term weakness within a stronger longer-term structure, with the intermediate horizon conflicted rather than fully downwardly aligned. Latest range was slightly below average and volume was subdued, unlike the modest expansion and volume increases across the preceding 15 sessions. Bearish technical states persisted; a next-session high above 158.5033 would conditionally reverse PSAR upward.
Oil News and Fundamentals
Oil fell to its lowest level since late August after President Donald Trump said the Iran war was “effectively over,” with benchmark prices briefly dropping below $90 a barrel. Prices subsequently rose in Asian trading as Middle East risks persisted. ANZ said U.S.-Iran negotiations remained deadlocked despite earlier hopes for an end to the conflict.
IBIT · D:2026-11-10 NC% ▼ -1.51% OC% ▲ +0.01%
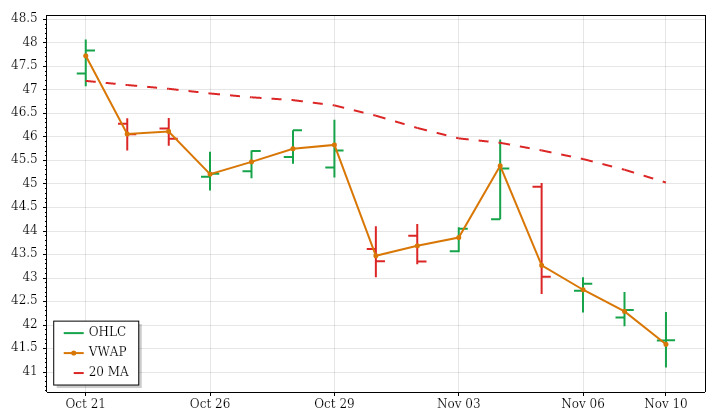
IBIT – Bitcoin Technicals Summary
IBIT's completed November 10 daily session finished at 41.68, down 1.51% against the prior close but essentially unchanged from the open. The loss was concentrated in an opening gap lower that remained unfilled. Trading crossed both sides of the open over an above-average range, then closed above session VWAP. That intraday stabilization did not undo the lower high, lower low or finish beneath the previous day's low.
Near- and intermediate-term averages were falling above price, matching the declining 15-session price trend and bearish technical states. The far-term average was still rising just beneath the close, leaving shorter-term weakness in conflict with the longer-term structure. Range reached about 119% of average, consistent with lookback expansion, while volume remained slightly below average despite its increasing trend. A next-session high above 43.988 would conditionally reverse the downward PSAR state.
TLT · D:2026-11-10 NC% ▼ -1.32% OC% ▼ -0.32%
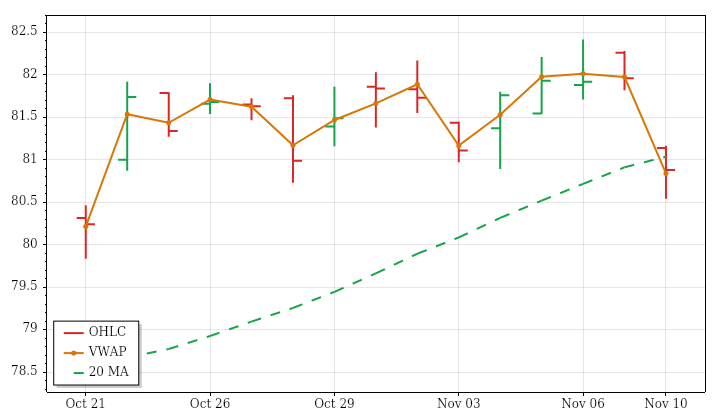
TLT – Long-Term Treasury Bonds Technicals Summary
TLT closed its completed November 10 daily session at 80.88, down 1.32% from the prior close and 0.32% from the open. Most of the daily loss arose from an opening gap lower that remained unfilled. A lower high, lower low and finish below the previous day's low weakened the daily structure, although the close sat slightly above session VWAP after trading on both sides of the open.
Price dropped below its rising near-term average but remained above the rising intermediate average. The far-term average was still falling above price, leaving the recent upward lookback trend in conflict with longer-term weakness. Latest range was near average, while volume was modestly above average, broadly consistent with the lookback's slight increases in range and participation. PSAR was in a short state despite an upward ATR-median reading; a next-session high above 82.415 would conditionally reverse PSAR upward.
GLD · D:2026-11-10 NC% ▼ -2.68% OC% ▼ -0.54%
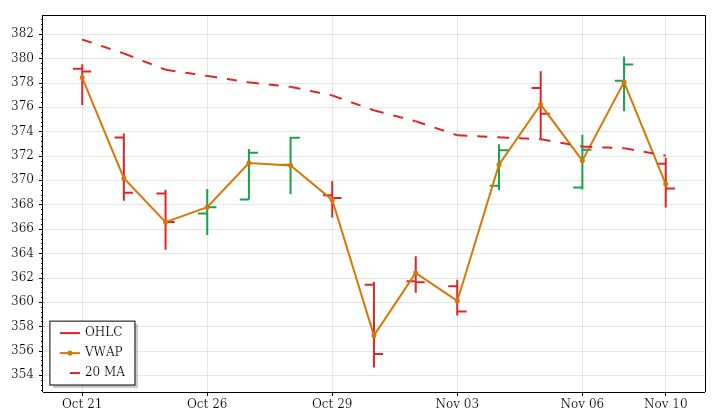
GLD – Gold Technicals Summary
GLD's completed November 10 daily session closed at 369.36, losing 2.68% versus the prior close but only 0.54% from the open. Most of the daily decline therefore came through the opening gap lower, which remained unfilled. Trading moved on both sides of the open, but the lower high, lower low and finish below the previous day's low maintained the weak price structure. The close also remained below session VWAP.
Near-, intermediate- and far-term averages were all falling above price, giving the broader setup consistent downward alignment. The latest decline fit that structure, although the 15-session window showed almost no net progress relative to its accumulated movement. Session range was close to average and volume was below average, contrasting with modestly expanding ranges and increasing lookback volume. The upward PSAR state conflicted with the averages; a next-session low below 363.3603 would conditionally reverse it.
Gold News and Fundamentals
Gold fell about 2% on November 10 after hotter-than-expected U.S. inflation raised expectations of a December Federal Reserve rate hike, with higher Treasury yields and a stronger dollar adding pressure. It later edged higher in early Asian trading. Central-bank purchases continued to support demand, with China increasing its gold reserves for two consecutive years. Federal Reserve economist Colin Weiss said European gold repatriations had little effect on those countries’ dollar reserve allocations.
Glossary: Instrument — ticker symbol; hover for the instrument or company name; Date — session date. DNC% — prior-session close to this session’s close; DOC% — daily session open-to-close percentage change. O — open; H — high; L — low; C — close, all for the table’s daily or weekly session; VWAP — volume-weighted average price; its arrow shows whether the close is above or below VWAP. Vol — period trading volume.
Bias — three directional readings, in order: DNC%, DOC%, then VWAP. ▲ positive/above; ▼ negative/below; — neutral or unavailable. Matching arrows show alignment; opposing arrows show mixed conditions. AVG/Sum — simple average of percentage changes and sum of reported volumes.
Futures Session Fib Grid Analysis – Snapshot
Session Fib Grids normalise market positioning as percentages, making direction and alignment comparable across different asset types.
Latest available snapshot for each instrument; Time(CT) shows the individual update date and time.
| Instrument | Bias | Time(CT) | YSFG | MSFG | WSFG | RSFG | SFG | TSI |
|---|---|---|---|---|---|---|---|---|
| ▲ ES | ▲ ▼ ▲ ▲ ▲ ▲ | 2026-11-11 07:18:48 | ▲ +45 | ▼ -3 | ▲ +93 | ▲ +65 | ▲ +6 | ▲ +182 |
| ▲ NQ | ▲ ▼ ▲ ▲ ▲ ▲ | 2026-11-11 07:18:49 | ▲ +40 | ▼ -8 | ▲ +79 | ▲ +78 | ▲ +4 | ▲ +158 |
| ▲ YM | ▲ ▲ ▲ ▲ ▲ ▲ | 2026-11-11 07:18:45 | ▲ +34 | ▲ +22 | ▲ +65 | ▲ +16 | ▲ +8 | ▲ +133 |
| ▲ EMD | ▲ ▲ ▲ ▲ ▲ ▲ | 2026-11-11 07:17:29 | ▲ +45 | ▲ +44 | ▲ +108 | ▲ +54 | ▲ +6 | ▲ +213 |
| ▲ RTY | ▲ ▲ ▲ ▲ ▲ ▲ | 2026-11-11 07:18:45 | ▲ +43 | ▲ +17 | ▲ +92 | ▲ +53 | ▲ +7 | ▲ +225 |
| ▼ FDAX | ▲ ▲ ▲ ▼ ▲ ▲ | 2026-11-11 07:18:48 | ▲ +45 | ▲ +59 | ▲ +103 | ▼ -6 | ▲ +7 | ▲ +25 |
| ▲ NKD | ▲ ▼ ▲ ▲ ▲ ▲ | 2026-11-11 07:18:18 | ▲ +136 | ▼ -8 | ▲ +75 | ▲ +65 | ▲ +6 | ▲ +157 |
| Instrument | Bias | Time(CT) | YSFG | MSFG | WSFG | RSFG | SFG | TSI |
|---|---|---|---|---|---|---|---|---|
| ▼ BTC | ▼ ▼ ▼ ▼ ▲ ▲ | 2026-11-11 07:17:58 | ▼ -61 | ▼ -28 | ▼ -38 | ▼ -14 | ▲ +1 | ▲ +15 |
| ▼ GC | ▼ ▲ ▼ ▼ ▲ ▼ | 2026-11-11 07:18:38 | ▼ -135 | ▲ +39 | ▼ -10 | ▼ -32 | ▲ +3 | ▼ -12 |
| ▲ CL | ▲ ▼ ▼ ▲ ▼ ▲ | 2026-11-11 07:18:48 | ▲ +147 | ▼ -88 | ▼ -38 | ▲ +58 | ▼ -5 | ▲ +29 |
| ▼ 6E | ▼ ▼ ▼ ▼ ▼ ▼ | 2026-11-11 07:18:49 | ▼ -63 | ▼ -15 | ▼ -20 | ▼ -135 | ▼ -13 | ▼ -251 |
| ▼ ZB | ▼ ▼ ▼ ▼ ▲ ▲ | 2026-11-11 07:08:23 | ▼ -34 | ▼ -12 | ▼ -53 | ▼ -128 | ▲ +6 | ▲ +9 |
Glossary: YSFG — yearly; MSFG — monthly; WSFG — weekly; RSFG — regular trading hours (RTH); SFG — the current session, including pre-market or other sessions. TSI indicates trend strength and power.
Bias shows trend alignment across these six readings. The arrows follow the column order: YSFG, MSFG, WSFG, RSFG, SFG and TSI. Matching arrows show alignment; opposing arrows show mixed conditions.
Futures Higher Time Frame Analysis
Summary of the current state of US Indices Futures based on higher time-frame (HTF) technical analysis as of: 2026-11-11 07:16 -06:00 CT.
US Indices Futures
- ES YSFG above F0%, MSFG below F0%, daily above WSFG center, weekly below short-term benchmarks, daily pivots upward, support 7322.25, resistance 7615.75/7906.25.
- NQ YSFG upward, MSFG below F0%, daily above WSFG F0%/NTZ, below declining 20–200-day benchmarks, daily pivots upward, support 26363.50–26366.50, resistance 28391–28397.50.
- YM YSFG/MSFG upward, daily WSFG upward, weekly above 55–200-period benchmarks, daily pivots upward, support 50859–50891, resistance 52783, weekly reversal threshold 53377.
- EMD YSFG/MSFG above F0%/NTZ, WSFG upward, daily above 55/200-day benchmarks, daily pivots upward, weekly pivots downward, support 3560.7, resistance 3742.6–3772.6.
- RTY YSFG/MSFG above F0%/NTZ, daily WSFG unspecified, above rising 5/10/20-day benchmarks, daily pivots upward, support 2714.2, resistance 2858.5–2862.2, weekly reversal threshold 2906.0.
- FDAX MSFG above F0%, WSFG 99%, recent weekly WSFG/MSFG short signals, above all benchmarks, daily pivots upward, resistance 26784–26847, support 25817/24925–24897.
Overall State
- Short-Term: Bullish
- Intermediate-Term: Neutral
- Long-Term: Bullish
Conclusion
Daily short-term pivots correlate upward across all six instruments following recent rebounds, while weekly pivots remain downward in ES, NQ, YM, EMD, and RTY. Intermediate structure remains mixed: ES and NQ MSFG readings remain below F0%, while YM, EMD, and RTY retain upward monthly structures. Weekly long-term ratings are uniformly bullish, supported by yearly grids and longer-term benchmarks where specified. FDAX leads in benchmark and pivot alignment, although recent weekly WSFG/MSFG short signals contrast with its upward structure. NQ lags on daily intermediate and long-term structure, remaining below declining 20–200-day benchmarks. Nearby resistance tests across the group distinguish the daily recovery from a synchronized intermediate-term reversal.
Note: Intra-day counter-trend pullbacks or retracements may occur, HTF is context for informational usage and market structure. Glossary: Session Fib Grids periods of YSFG:’Yearly’, MSFG:’Monthly’, WSFG:’Weekly’
For full details visit: AlphaWebTrader Technicals
SPY Daily View
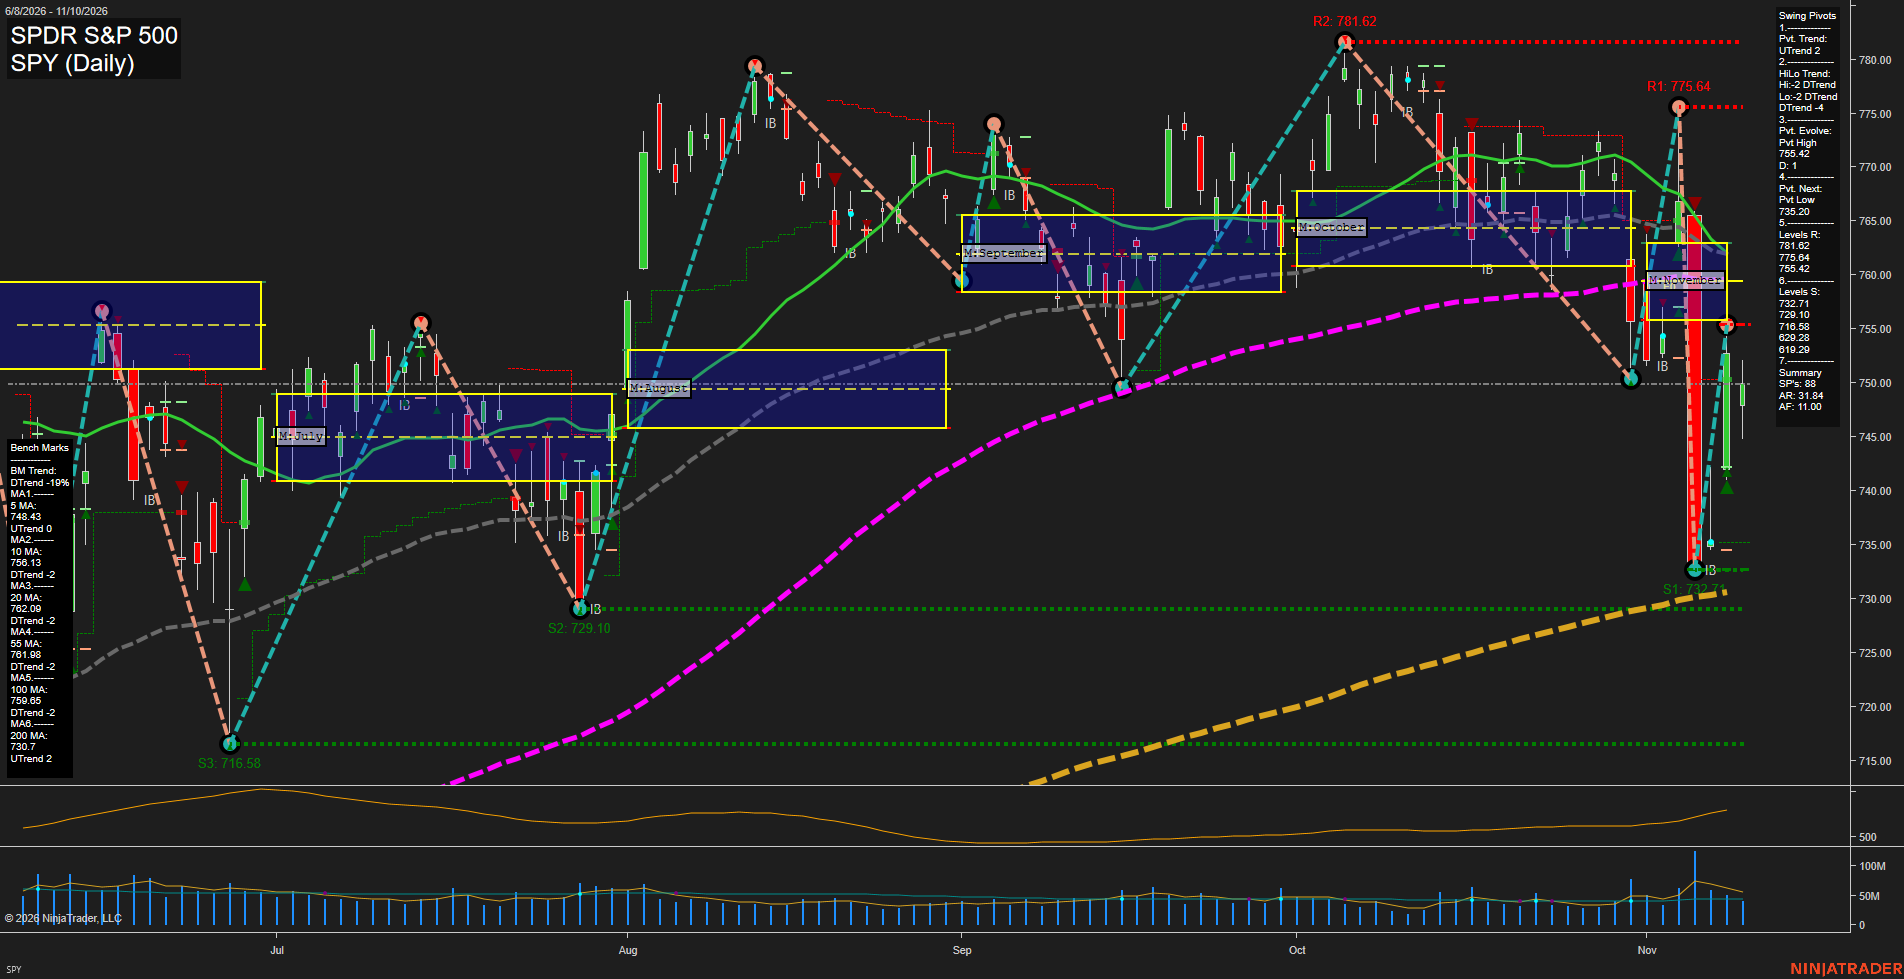
Overall Rating
- Short-Term: Neutral
- Intermediate-Term: Bearish
- Long-Term: Neutral.
Key Insights Summary
From a futures swing-trader perspective, the equivalent ES structure shows a sharp high-volatility selloff followed by a V-style rebound that remains below the 10, 20, 55, and 100-day benchmark cluster. The short-term pivot has turned upward, but the intermediate HiLo trend remains downward and price is below the November MSFG NTZ, preserving a counter-trend rebound character. The 755.42 area is the nearest pivot resistance, followed by the dense 761.98-762.49 moving-average zone; 732.71 and 729.10 define the principal downside pivot-support band. The broader trend is mixed because the 200-day benchmark remains rising, while the shorter intermediate and long-term averages are declining.
View charts on: AlphaWebTrader HTF Charts
ES Daily View
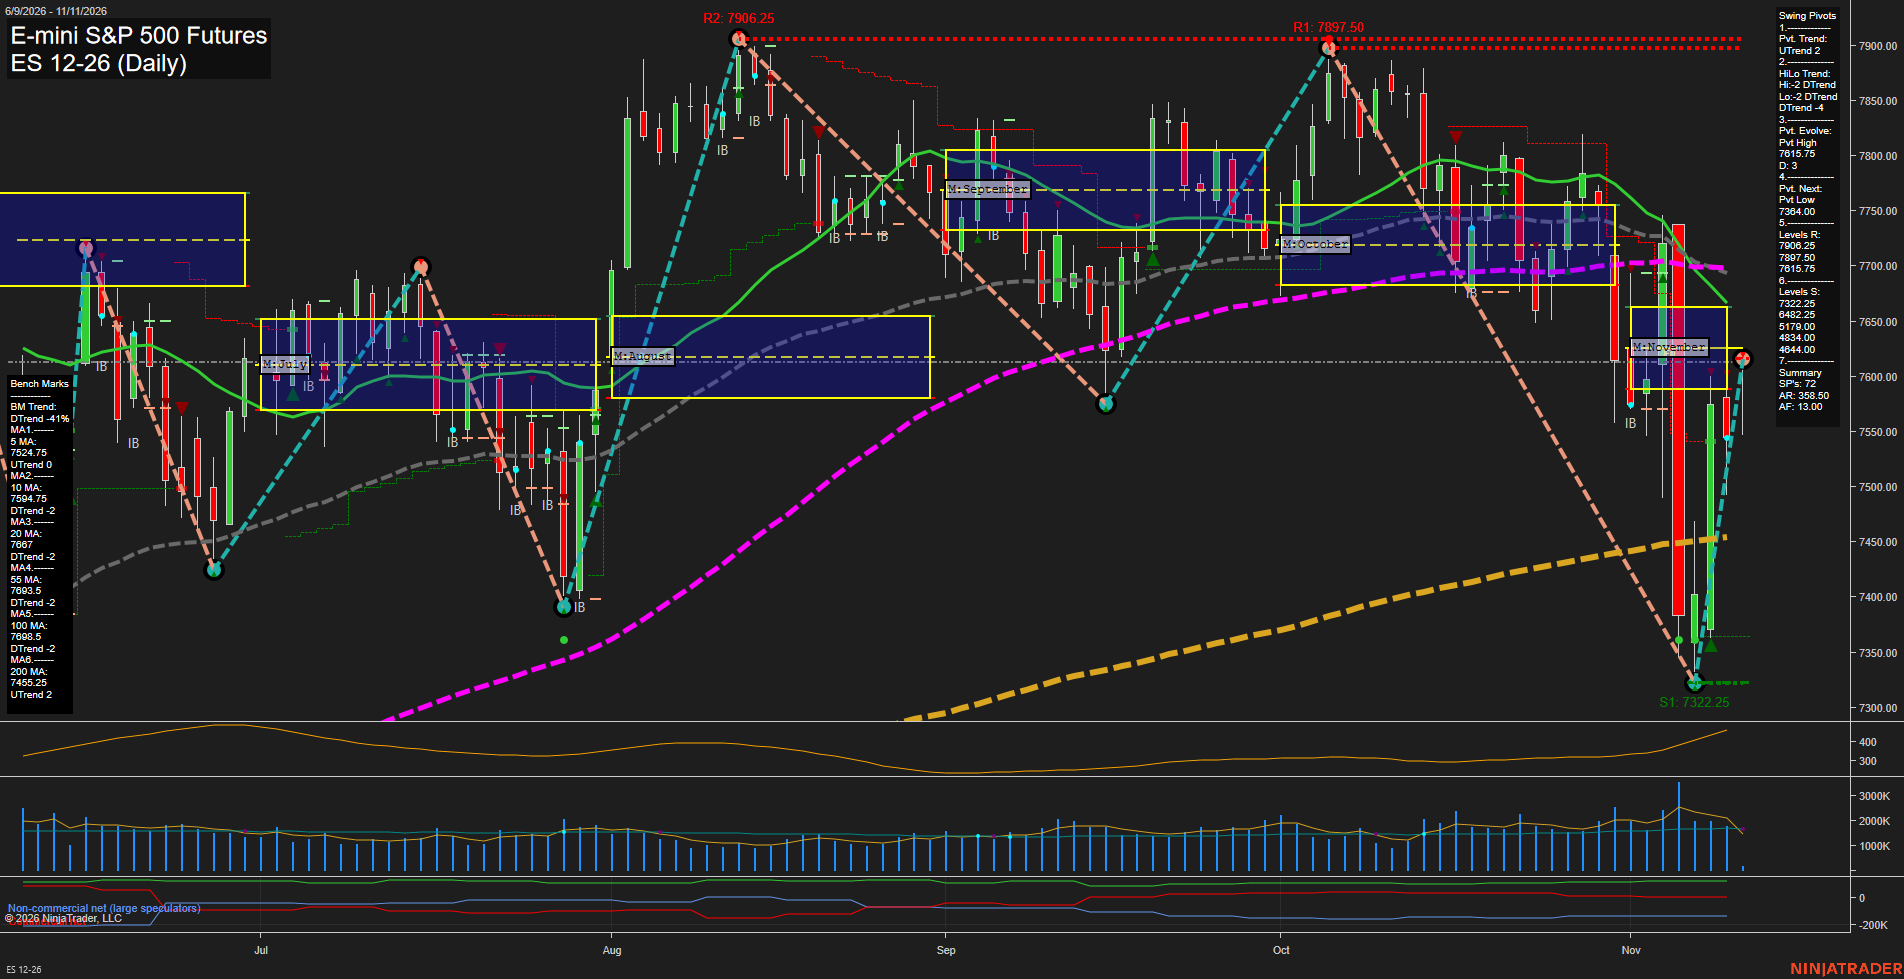
Overall Rating
- Short-Term: Bullish
- Intermediate-Term: Bearish
- Long-Term: Bullish.
Key Insights Summary
Price action reflects a fast V-style rebound from the 7322.25 swing-low area, restoring the short-term pivot trend to UTrend and lifting price above the weekly grid center. The rebound has reached the 7615.75 pivot-resistance area, while the declining 20-, 55-, and
View charts on: AlphaWebTrader HTF Charts
QQQ Daily View
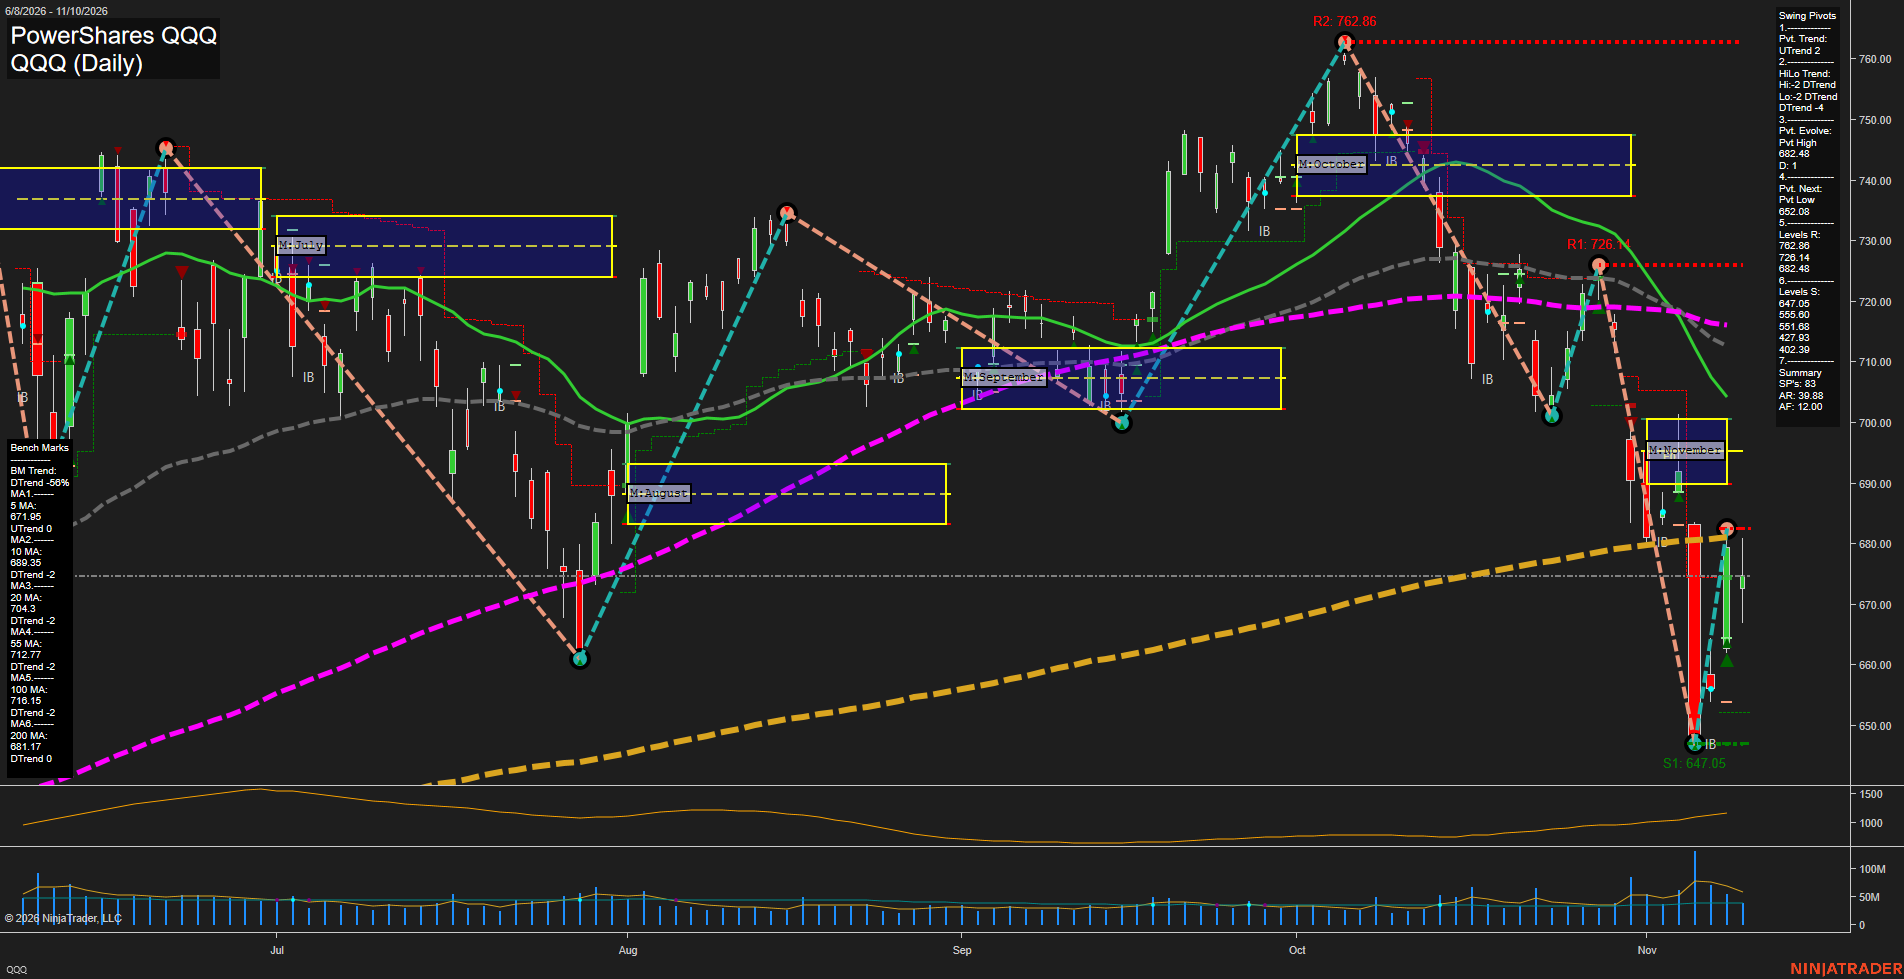
Overall Rating
- Short-Term: Neutral
- Intermediate-Term: Bearish
- Long-Term: Bearish.
Key Insights Summary
QQQ, a liquid NQ futures proxy, is in a high-volatility countertrend rebound after a sharp November selloff into the 647.05 swing-low area. The short-term pivot has turned upward, but price remains beneath the 10-, 20-, 55-, and 100-day benchmarks and below the November grid, preserving the intermediate and long-term lower-high/downtrend structure. The 682.48 pivot is the immediate overhead structural level, followed by 689.35 and the November NTZ area near 690-700; 655.60, 652.08, and 647.05 define the nearby downside swing structure. Large daily ranges and elevated ATR indicate an unstable, fast-momentum recovery rather than a confirmed broad trend reversal.
View charts on: AlphaWebTrader HTF Charts
NQ Daily View
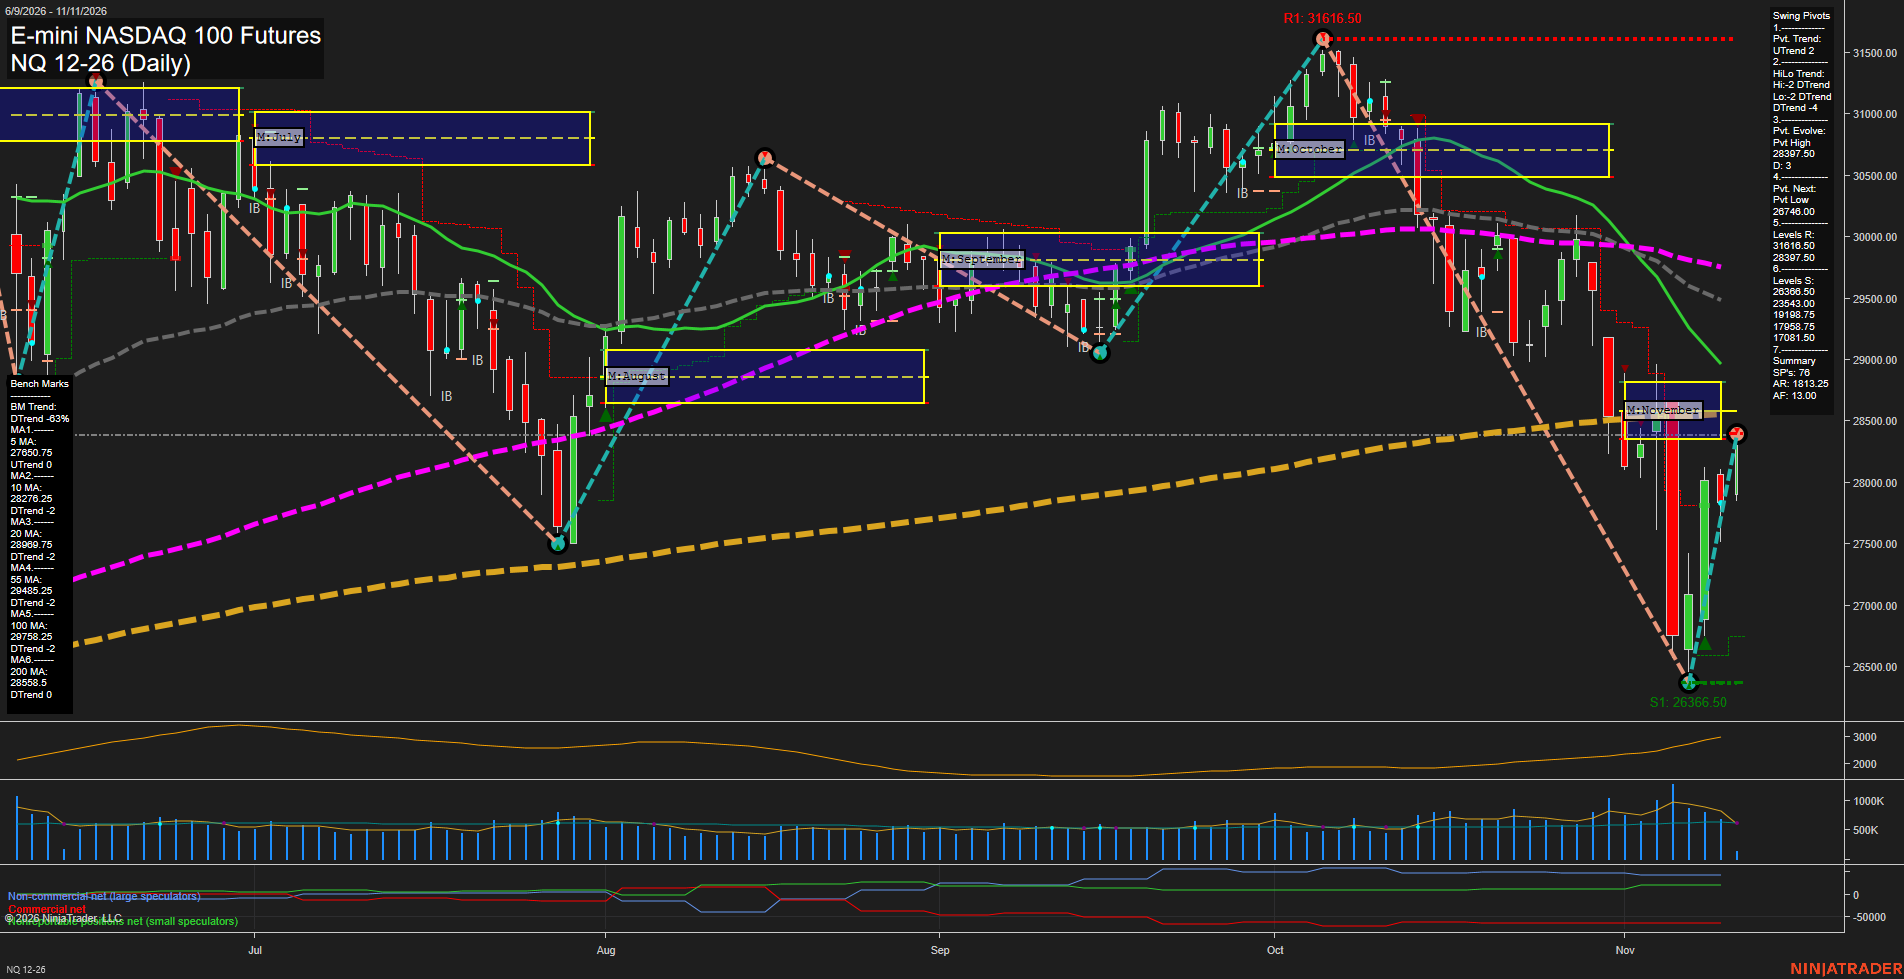
Overall Rating
- Short-Term: Bullish
- Intermediate-Term: Bearish
- Long-Term: Bearish.
Key Insights Summary
The daily chart shows a sharp V-style recovery from the 26366.50 swing-low support area, with fast upside momentum and price back above the weekly F0%/NTZ structure. Short-term pivot trend has turned upward, although the active pivot-high area near 28391.00 to 28397.50 is being tested. The rebound remains counter-trend on the intermediate and long-term structure: November MSFG is below F0%, the HiLo pivot trend remains down, and price is below the declining 20-, 55-, 100-, and 200-day benchmarks. The recent high-volume selloff and elevated ATR indicate a volatile swing environment, while 28558.50 to 28990.75 defines the nearby moving-average resistance band above the current recovery.
View charts on: AlphaWebTrader HTF Charts
USO Daily View
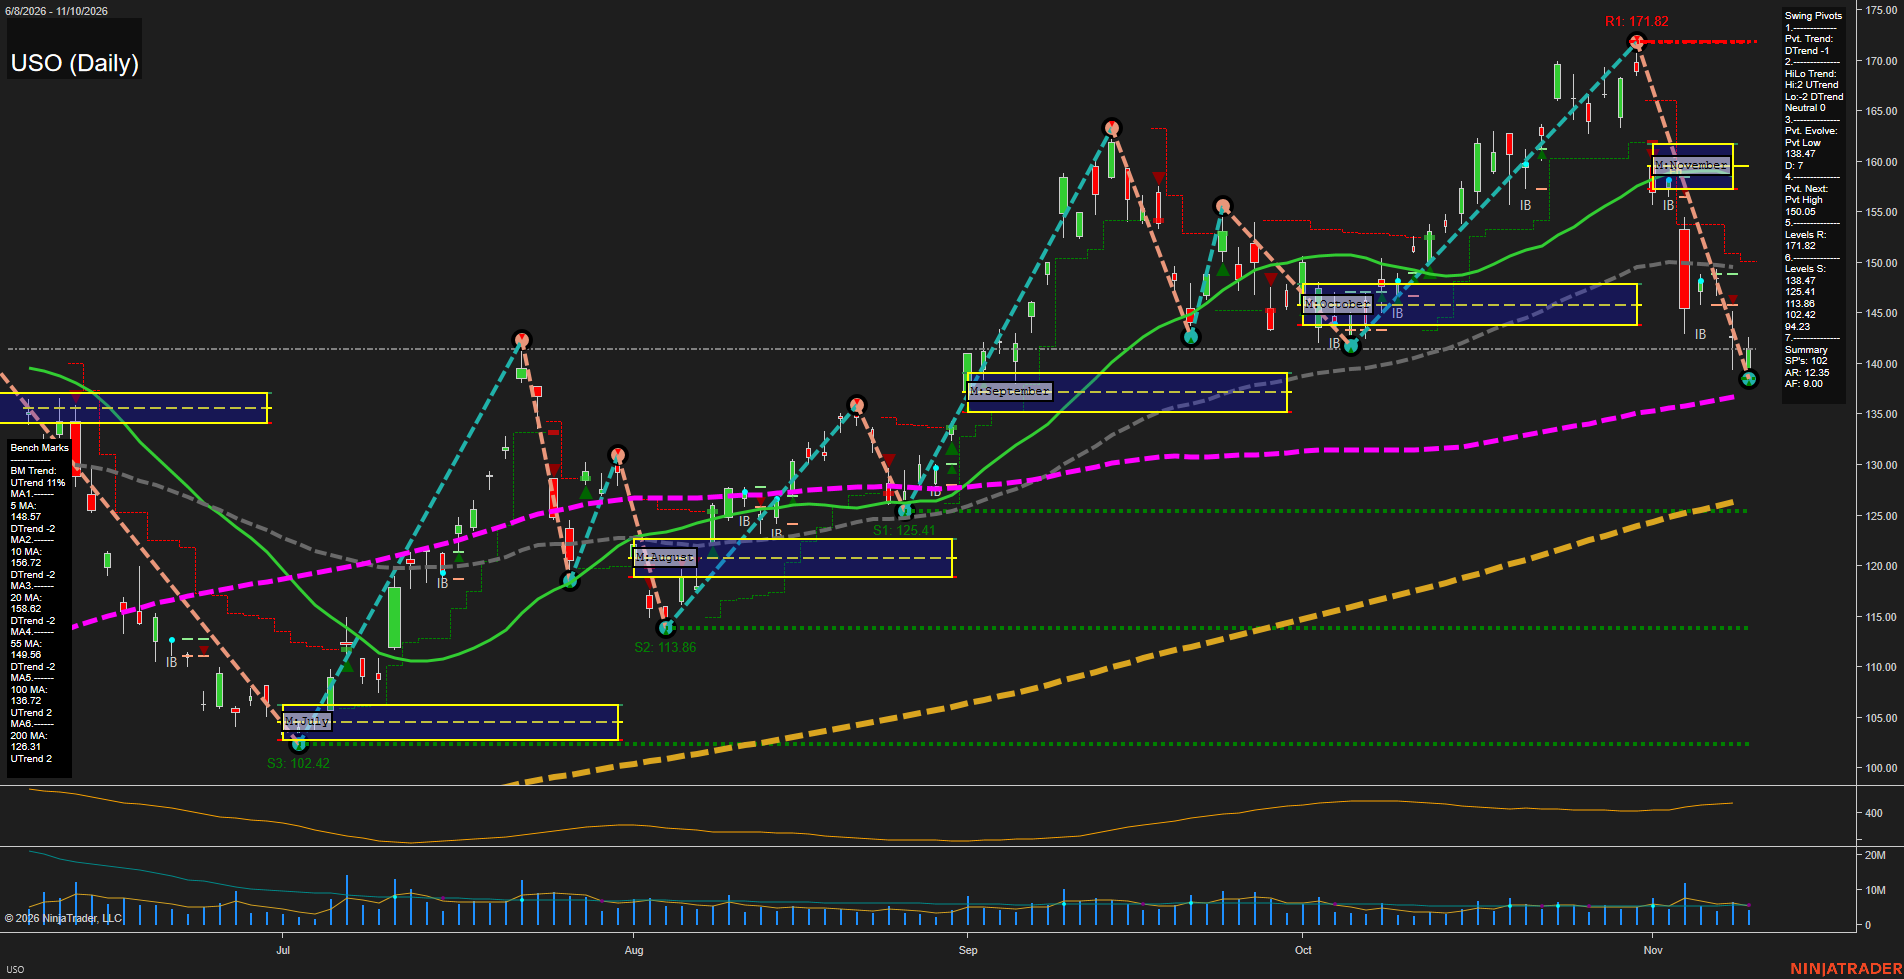
Overall Rating
- Short-Term: Bearish
- Intermediate-Term: Bearish
- Long-Term: Bullish.
Key Insights Summary
USO has undergone a fast downside swing from the 171.82 pivot high, breaking beneath the November MSFG NTZ and falling below the 5, 10, 20, and 55-day benchmarks. The short-term pivot structure is in DTrend, with the current 138.47 pivot low defining the immediate downside reference while 150.05 marks the reversal threshold for a new pivot high. Intermediate structure has shifted lower following rejection from the 160-172 area, although the longer-term trend remains constructive because price is still above rising 100-day and 200-day benchmarks. The decline has brought price close to the 100-day average, creating a technically important transition area between the bearish swing correction and the broader long-term uptrend.
View charts on: AlphaWebTrader HTF Charts
CL Daily View
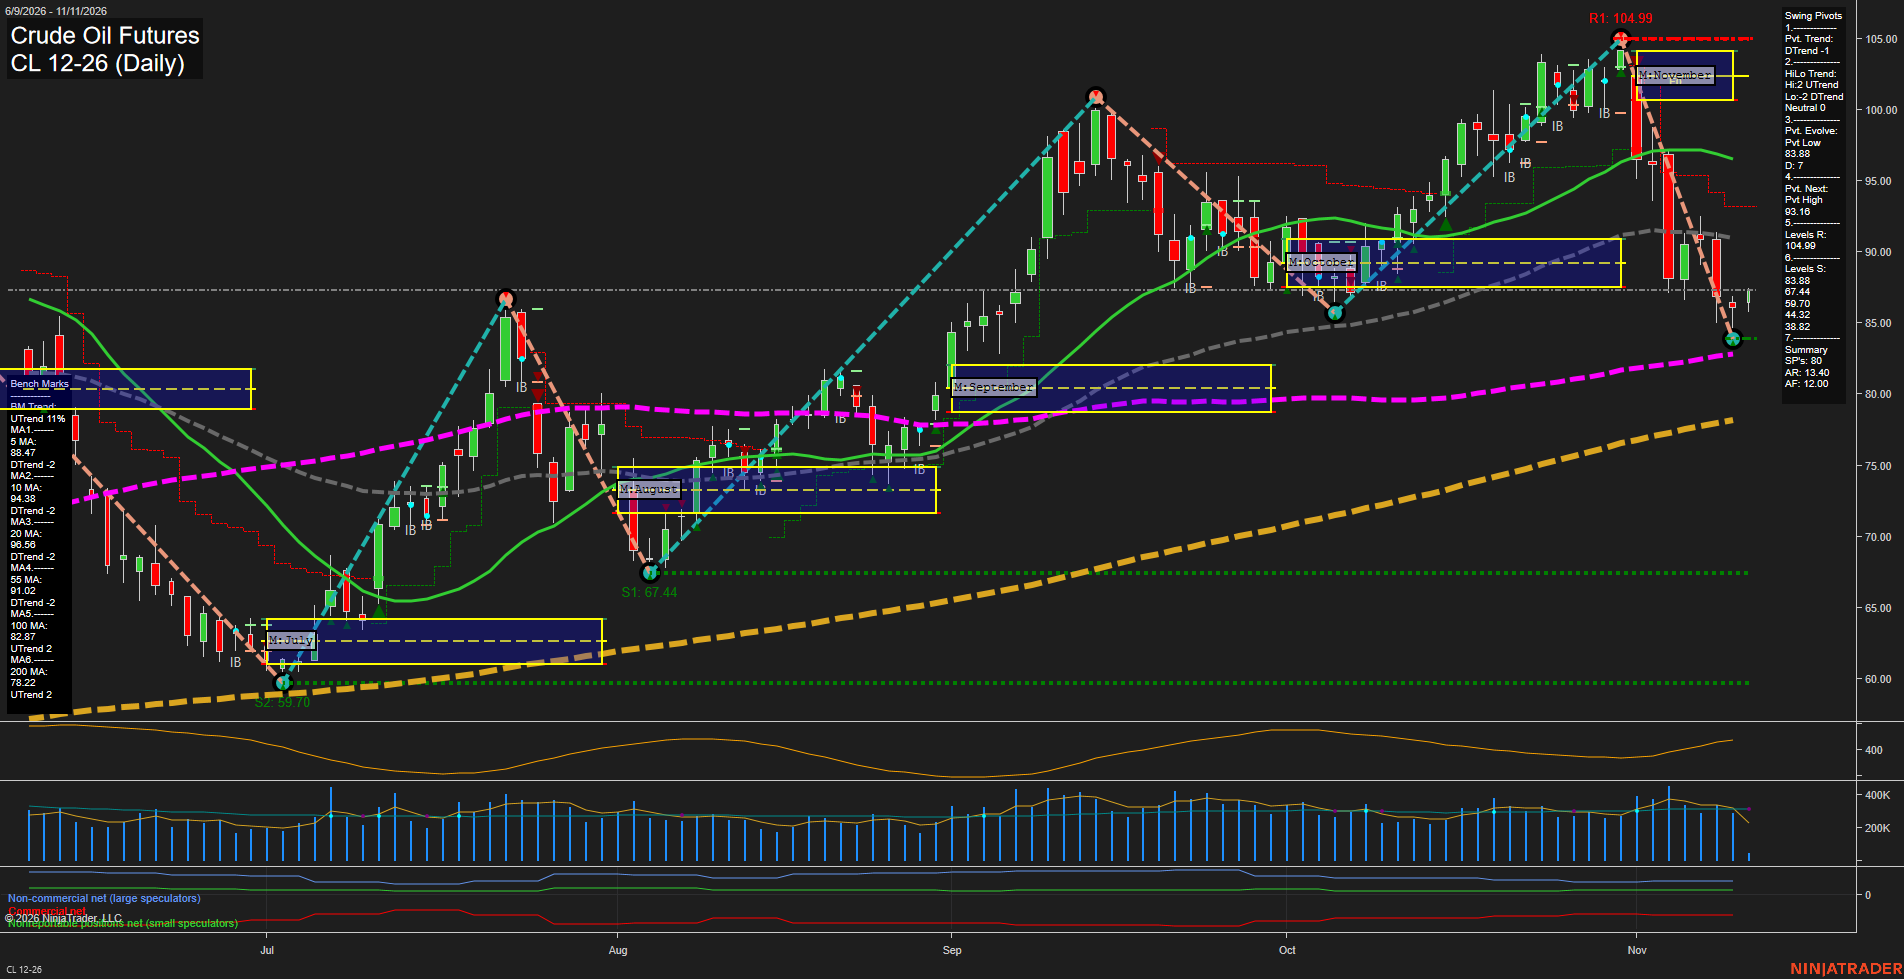
Overall Rating
- Short-Term: Bearish
- Intermediate-Term: Bearish
- Long-Term: Bullish.
Key Insights Summary
Crude oil is in a fast short-term selloff following rejection from the 104.99 swing-high resistance area. Price is below the weekly and monthly Fib-grid centers and beneath the 5-, 10-, 20-, and 55-day benchmarks, confirming downside momentum and a lower-high corrective phase. The 83.88 pivot low is the immediate structural reference, while 93.16 defines the reversal threshold for the current short-term pivot sequence. Despite the acute correction, the 100- and 200-day averages remain rising and price remains above the annual Fib-grid center, preserving the broader long-term uptrend structure.
View charts on: AlphaWebTrader HTF Charts
GLD Daily View
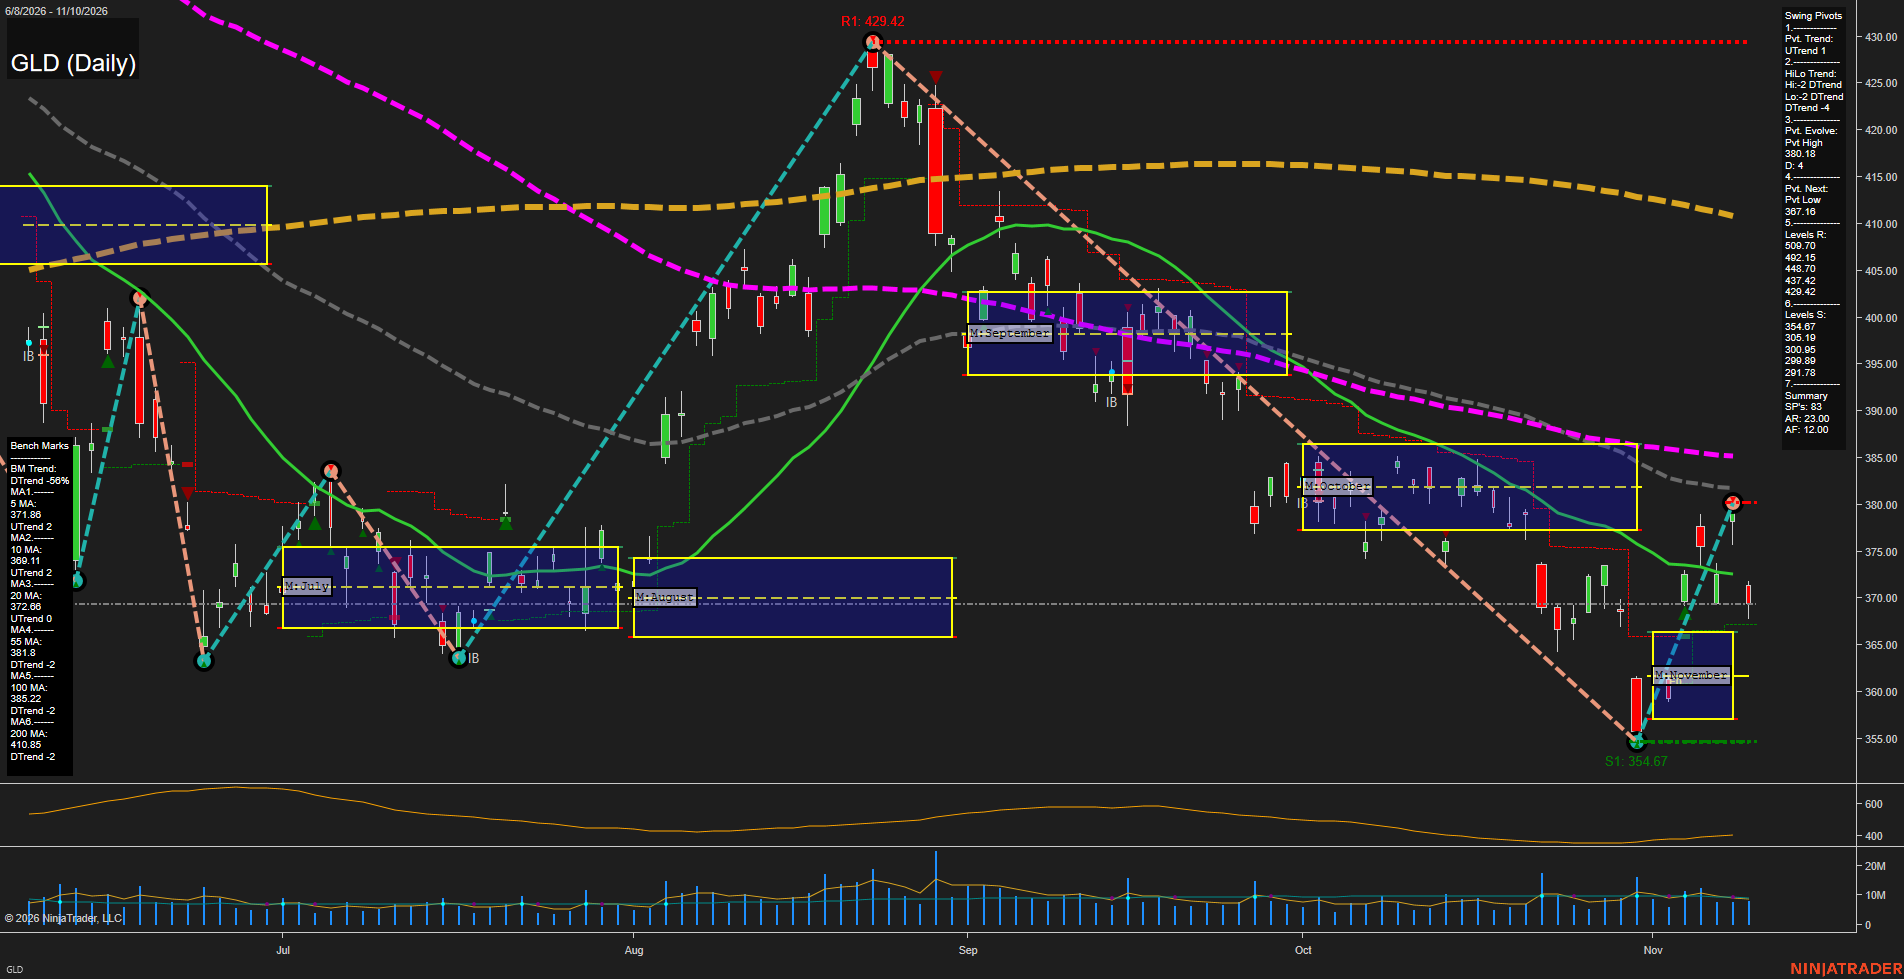
Overall Rating
- Short-Term: Neutral
- Intermediate-Term: Bearish
- Long-Term: Bearish.
Key Insights Summary
GLD, as a liquid proxy for gold futures swing conditions, is holding a short-term pivot uptrend after the 354.67 low and rebound toward 380.18. The latest small red bar reflects a pullback from that rebound, with 367.16 defining the nearby pivot-reversal reference. Price remains above the November monthly NTZ, but is below the 5-day and 20-day benchmark area near 371.88-372.68 and well beneath declining 55-, 100-, and 200-day averages. The broader structure remains a countertrend recovery within an intermediate and long-term downtrend, characterized by lower highs from the August peak and overhead resistance near 380.18, 381.30, and 389.37. Volatility remains elevated, consistent with wide gold-futures style daily rotations and choppy retracement conditions.
View charts on: AlphaWebTrader HTF Charts
GC Daily View
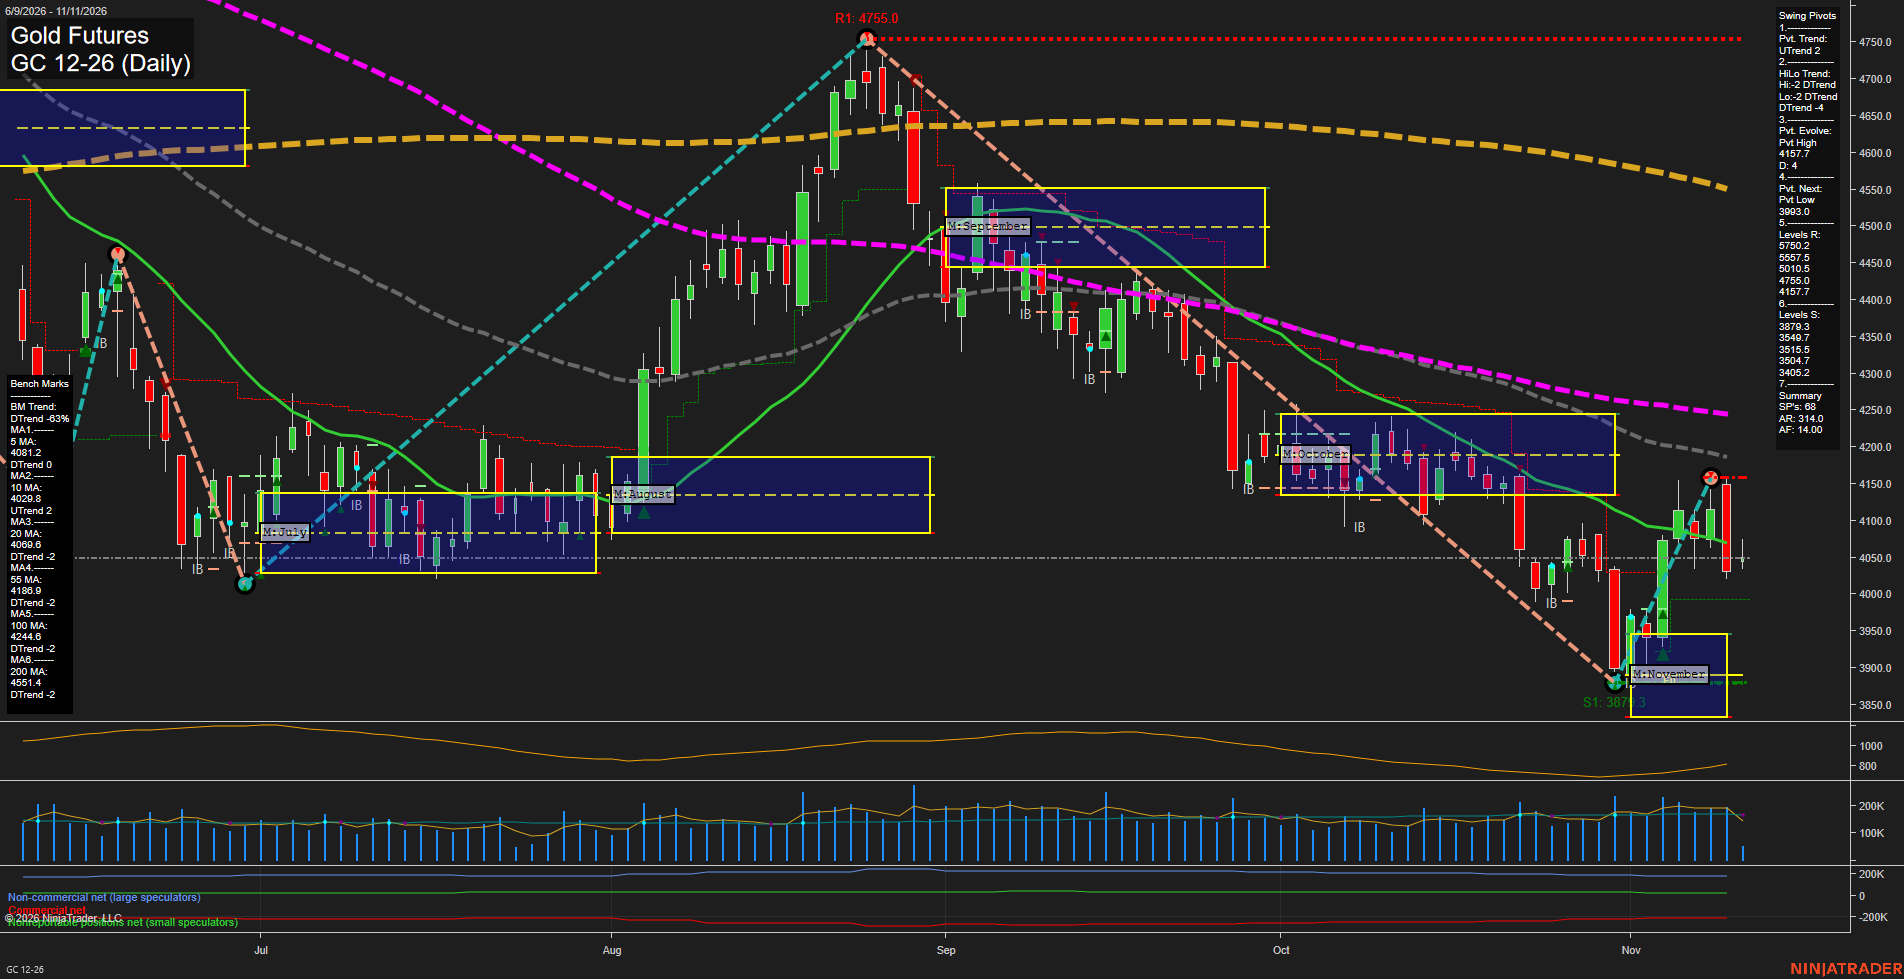
Overall Rating
- Short-Term: Bearish
- Intermediate-Term: Bearish
- Long-Term: Bearish.
Key Insights Summary
Price is in a sharp, volatile countertrend recovery from the 3879.3 swing low, but the latest large red bar rejected the 4156.7 pivot-high area and returned below the declining 5-day and 20-day benchmarks. The short-term pivot structure remains UTrend while above 3993.0, yet the intermediate HiLo trend, 20-day/55-day benchmarks, and active short-term signals retain a broader bearish tone. The monthly grid remains positive above its F0% region, contrasting with the bearish weekly and yearly grid positioning. The dominant swing structure remains a sequence of lower highs beneath 4755.0, with 4157.7 as nearby pivot resistance and 3879.3 as major visible support.
View charts on: AlphaWebTrader HTF Charts
ZB Daily View
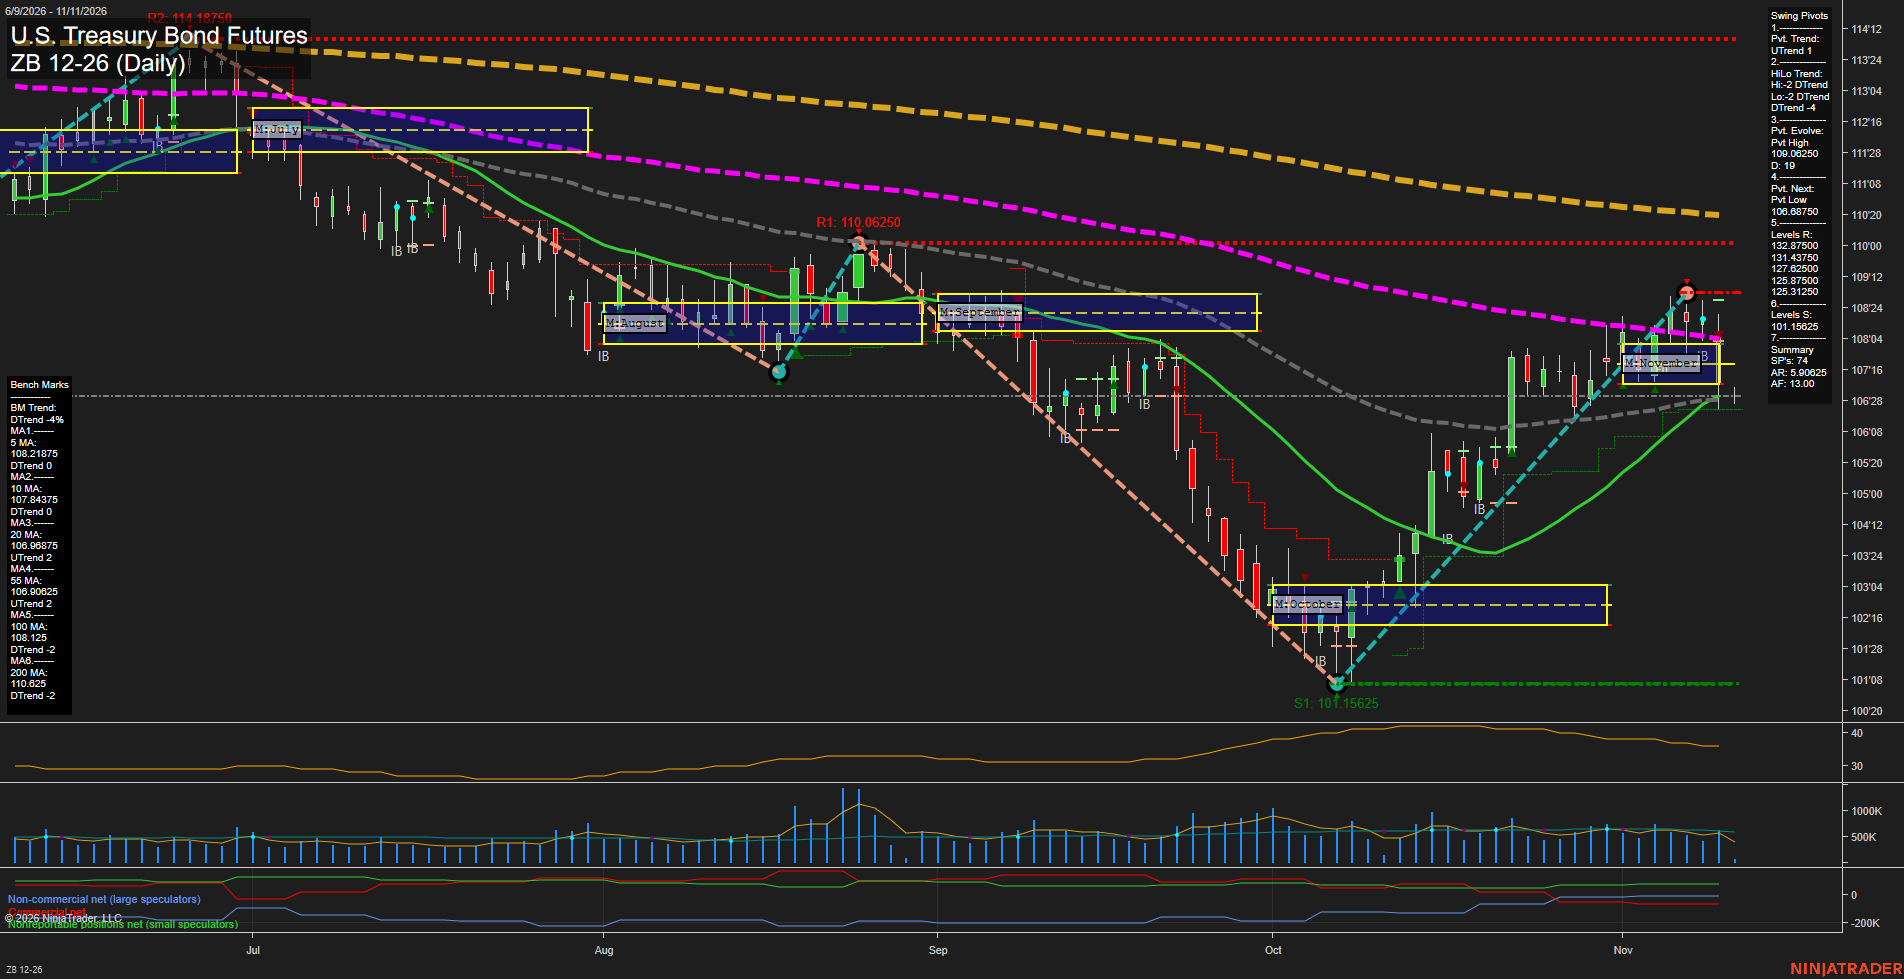
Overall Rating
- Short-Term: Neutral
- Intermediate-Term: Bearish
- Long-Term: Bearish.
Key Insights Summary
Price is consolidating near the 20-day and 55-day benchmarks following the sharp October-to-November recovery from the 101.15625 swing low. The short-term pivot structure remains in UTrend, but the latest 109.06250 pivot high and the nearby 106.68750 pivot-low threshold define a narrow retracement range with slow momentum and small daily bars. Weekly and monthly Fib-grid readings remain below their F0% references, while price is also below the declining 5-day, 10-day, 100-day, and 200-day averages. This creates a countertrend recovery within a broader bearish intermediate- and long-term structure, characterized by overhead moving-average congestion near 108.12500-110.12500 and major pivot resistance at 125.31250 and above.
View charts on: AlphaWebTrader HTF Charts
Sentiment Summary: Neutral coverage led at 44%, but negative articles outweighed positive 39% to 17%, reflecting October CPI released November 10 rising 0.4% versus 0.3% expected, stronger Fed tightening expectations, and Nvidia governance and export-control concerns. Reports linked Tuesday’s equity declines and rising Treasury yields to inflation and rate concerns, alongside rotation toward defensive sectors. The main counterweight was November 11’s premarket AI rebound following better-than-expected CoreWeave results: an early snapshot showed Nasdaq 100 futures up 1.8%, versus 0.7% for S&P 500 and 0.2% for Dow contracts.
Conclusion: Premarket leadership remained concentrated in technology rather than evenly distributed across major indexes.