U.S. futures are mixed Tuesday ahead of ADP at 8:15 ET, CPI at 8:30 ET and a $42B 10-year auction at 13:00 ET; Nasdaq's medium trend remains bearish.
Fundamentals: Mixed U.S. futures frame Tuesday's agenda: ADP employment at 8:15 ET, CPI at 8:30 ET and a $42B 10-year Treasury auction at 13:00 ET. Fed speeches follow from Bowman at 15:30 ET and Paulson at 18:30 ET, with API oil inventories at 16:30 ET. Dow and S&P 500 futures rose while Nasdaq futures slipped amid renewed semiconductor pressure and Nvidia governance scrutiny. Lower energy prices supported equities as Trump's Iran comments eased escalation concerns.
Technicals: Stock index futures show sharp, volatile rebounds ahead of Tuesday's open, with S&P 500 and Nasdaq futures still facing bearish medium trends and overhead resistance. Dow and midcap futures retain bullish daily ratings across all horizons, while small caps show a positive near-term recovery but mixed longer-term conditions. DAX futures remain broadly bullish as they test the 26784–26847 resistance band.
Pre-Market Trading 360° view Market Radar of: holidays, earnings, eco-news, market-news summary, news sentiment, prior session major ETFs, MAG7, Higher Time Frame Analysis Indices Futures Summary, and E-mini S&P500, Nasdaq 100, NYMEX Crude, Gold Futures Daily Chart analysis.
As of: November 10, 2026 07:16 CT
EcoNews Radar U.S. Events
| Date | Impact | Event, Prev, Forecast, Actual | Info |
|---|---|---|---|
| 2026-11-10 Tuesday 04:00 | Medium | Fed's Waller speech Prev: — Forecast: — Actual: — | Remarks may clarify the monetary-policy outlook and assessment of economic conditions; index futures traders monitor implications for interest-rate expectations and equity valuations. |
| 2026-11-10 Tuesday 08:15 | Medium | ADP Employment Change 4-week average Prev: 17K Forecast: — Actual: — | Tracks average private-sector employment changes over a rolling period, helping traders assess labor demand and its implications for growth and monetary policy. |
| 2026-11-10 Tuesday 08:30 | High | Consumer Price Index ex Food & Energy (MoM) Prev: 0.30% Forecast: 0.20% Actual: — | Measures monthly consumer price changes excluding food and energy, offering a gauge of underlying inflation that can influence rate expectations and equity valuations. |
| 2026-11-10 Tuesday 08:30 | High | Consumer Price Index (MoM) Prev: 0.60% Forecast: 0.30% Actual: — | Measures monthly changes in overall consumer prices, helping traders assess inflation pressures, household purchasing power and the outlook for interest rates. |
| 2026-11-10 Tuesday 13:00 | High | 10-Year Note Auction · $42B Prev: 5.3% Forecast: — Actual: — | Reveals demand and financing costs for intermediate-term government debt; traders monitor auction yields and bidding strength for signals affecting benchmark rates and equity valuations. |
| 2026-11-10 Tuesday 15:30 | Medium | Fed's Bowman speech Prev: — Forecast: — Actual: — | Comments may illuminate views on inflation, employment and monetary policy; traders watch for implications for the expected interest-rate path. |
| 2026-11-10 Tuesday 16:30 | Low | API Weekly Crude Oil Stock Prev: -5.27M Forecast: — Actual: — | Provides an industry estimate of weekly changes in crude inventories; traders monitor supply-demand signals relevant to oil prices, energy shares and inflation expectations. |
| 2026-11-10 Tuesday 18:30 | Medium | Fed's Paulson speech Prev: — Forecast: — Actual: — | Remarks may provide perspective on economic conditions and monetary policy; traders monitor any implications for interest-rate expectations and broader market sentiment. |
| 2026-11-12 Thursday 08:30 | Medium | Initial Jobless Claims Prev: 189K Forecast: 195K Actual: — | Counts new applications for unemployment benefits, providing a timely gauge of layoffs that informs expectations for economic growth and monetary policy. |
| 2026-11-12 Thursday 09:00 | Medium | Fed's Hammack speech Prev: — Forecast: — Actual: — | Remarks may clarify views on economic conditions and the policy outlook; traders watch for signals relevant to interest rates and equity discount rates. |
| 2026-11-12 Thursday 10:00 | Medium | Fed's Barr speech Prev: — Forecast: — Actual: — | Comments may address monetary policy, banking or financial stability; traders monitor potential implications for rate expectations, credit conditions and financial-sector shares. |
| 2026-11-12 Thursday 10:00 | Medium | Existing Home Sales Change (MoM) Prev: 1.5 Forecast: — Actual: — | Measures the monthly change in completed sales of previously owned homes, helping traders assess housing demand, interest-rate sensitivity and broader economic momentum. |
| 2026-11-12 Thursday 11:30 | Medium | Fed's Goolsbee speech Prev: — Forecast: — Actual: — | Remarks may offer insight into the balance between inflation and employment risks; traders monitor implications for monetary-policy expectations. |
| 2026-11-12 Thursday 11:30 | Medium | 4-Week Bill Auction Prev: 3.89% Forecast: — Actual: — | Reveals demand and borrowing costs for very short-term government debt, offering insight into cash-market conditions and near-term interest-rate expectations. |
| 2026-11-12 Thursday 11:30 | Medium | 17-Week Bill Auction Prev: — Forecast: — Actual: — | Shows demand and financing costs for short-term government debt; traders monitor bidding strength and yields for signals about liquidity and expected policy rates. |
| 2026-11-12 Thursday 11:30 | Medium | 8-Week Bill Auction Prev: — Forecast: — Actual: — | Provides a read on short-term government funding costs and investor demand, helping traders assess money-market conditions and near-term rate pricing. |
| 2026-11-12 Thursday 12:00 | Low | EIA Crude Oil Stocks Change Prev: -0.86M Forecast: — Actual: — | Reports weekly changes in commercial crude inventories, helping traders assess petroleum supply-demand conditions and potential implications for energy shares and inflation expectations. |
| 2026-11-12 Thursday 13:00 | High | 30-Year Bond Auction · $25B Prev: 5.62% Forecast: — Actual: — | Reveals investor demand and borrowing costs at the long end of the Treasury curve; traders monitor implications for long-term yields and rate-sensitive equity valuations. |
| 2026-11-12 Thursday 13:10 | Medium | Fed's Daly speech Prev: — Forecast: — Actual: — | Comments may clarify the assessment of inflation, employment and policy restraint; traders monitor implications for expected interest rates. |
| 2026-11-12 Thursday 14:00 | Medium | Monthly Budget Statement Prev: -27.0B Forecast: -286.3B Actual: — | Reports federal receipts, spending and the resulting fiscal balance; traders monitor borrowing implications, Treasury supply and the broader fiscal backdrop. |
| 2026-11-12 Thursday 18:30 | Medium | Fed's Williams speech Prev: — Forecast: — Actual: — | Remarks may provide insight into monetary-policy priorities and economic risks; traders watch for implications for rate expectations and financial conditions. |
| 2026-11-13 Friday 08:30 | High | Producer Price Index ex Food & Energy (MoM) Prev: 0.70% Forecast: 0.30% Actual: — | Measures monthly changes in producer selling prices excluding food and energy, helping traders assess underlying price pressures, business margins and monetary-policy implications. |
| 2026-11-13 Friday 08:30 | High | Producer Price Index (MoM) Prev: 1.30% Forecast: 0.40% Actual: — | Measures monthly changes in prices received by domestic producers, providing signals about upstream inflation pressures and potential effects on corporate margins. |
| 2026-11-13 Friday 08:30 | Medium | Producer Price Index (YoY) Prev: 6.3% Forecast: 6.6% Actual: — | Tracks annual changes in prices received by domestic producers, helping traders assess the broader inflation trend and implications for costs and interest rates. |
| 2026-11-13 Friday 08:30 | High | Producer Price Index ex Food & Energy (YoY) Prev: 5.0% Forecast: 5.0% Actual: — | Tracks annual producer price changes excluding food and energy, offering perspective on persistent inflation pressures relevant to corporate profitability and policy expectations. |
| 2026-11-13 Friday 10:50 | Medium | Fed's Bowman speech Prev: — Forecast: — Actual: — | Remarks may update views on the economic outlook and monetary policy; traders monitor whether the message changes expectations for interest rates. |
| 2026-11-13 Friday 12:00 | Medium | Fed's Daly speech Prev: — Forecast: — Actual: — | Comments may provide perspective on inflation progress and labor-market conditions; traders watch for implications for the expected policy path. |
| 2026-11-13 Friday 19:00 | Medium | Fed's Jefferson speech Prev: — Forecast: — Actual: — | Remarks may clarify the economic outlook and monetary-policy considerations; traders monitor potential implications for rate expectations and equity valuations. |
Summary: The calendar centers on U.S. inflation and monetary-policy expectations, alongside indicators of growth, government financing and energy supply.
Conclusion: Consumer and producer inflation releases and longer-dated Treasury auctions account for the supplied high-impact events.
NYSE Session Open Gap Radar
Session gaps compare the predicted opening price with the prior session’s close to predict the upcoming session’s opening gap pattern.
| Instrument | Gap | Prior Close | Predicted Open | Gap % |
|---|---|---|---|---|
| DIA | ▼ IGU | 523.33 | 525.00 | ▲ +0.32% |
| IJH | ▼ IGU | 74.39 | 74.52 | ▲ +0.17% |
| SPY | ▲ IGD | 752.69 | 752.32 | ▼ -0.05% |
| IWM | ▲ IGD | 282.51 | 282.27 | ▼ -0.09% |
| TLT | ▲ IGD | 81.96 | 81.85 | ▼ -0.13% |
| QQQ | ▲ IGD | 679.35 | 675.08 | ▼ -0.63% |
| GLD | ▼ OGD | 379.53 | 373.43 | ▼ -1.61% |
| USO | ▼ OGD | 142.66 | 138.87 | ▼ -2.66% |
Before the session opens, the table shows the predicted opening price and gap. Once the session opens, it uses the recorded opening price.
Glossary: IGU — Inside Gap Up: above the prior close, within the prior session’s range. IGD — Inside Gap Down: below the prior close, within that range. OGU — Outside Gap Up: above the prior session’s high. OGD — Outside Gap Down: below the prior session’s low.
As of: 2026-11-10 07:16 CT. Predicted gaps are best estimates as of publication and may change before the regular-session open, particularly when the session is still some time away.
Market News Summary:
U.S. index futures were mixed ahead of inflation data, with falling energy prices supporting equities while Nvidia faced governance scrutiny.
Primary Drivers & Risks:
- Primary Driver: Lower energy prices supporting equity rebound
- Primary Risk: Inflation release and Nvidia governance scrutiny
Tone:
Mixed and cautious, with Nasdaq futures trailing Dow and S&P 500 contracts.
Data, Market and System
Geopolitical:
- President Trump signaled that additional strikes on Iran were unnecessary, easing escalation concerns.
- Recent Ukrainian attacks reduced Russia’s oil processing capacity by 30%, according to the supplied report.
- Trump expressed support for Huang, while separate reports described congressional demands for answers about Nvidia’s China ties.
Oil / Energy:
- Brent crude and European natural gas prices fell following Trump’s comments on Iran.
- The reported loss of Russian oil processing capacity contrasted with the decline in energy prices.
Fed / Financials:
- Investors awaited a key U.S. inflation report following Wall Street’s rebound.
- A Fed official raised the prospect of a half-percentage-point interest-rate increase.
Macro / Other:
- The NFIB small-business optimism index slipped 0.1 point to 97.8 in October, remaining just below its 53-year average.
Conclusion:
Lower energy prices supported the equity rebound, while U.S. futures showed divergent performance ahead of inflation data. The reported prospect of a half-percentage-point rate increase added monetary-policy context to the release.
Nvidia’s governance scrutiny and renewed semiconductor pressure contrasted with strong cloud-business results. Iran de-escalation headlines accompanied falling energy prices, while damage to Russian oil processing capacity provided a separate supply-side cross-current.
Market News Sentiment
Sentiment Bias shows the balance of positive and negative news coverage sampled from 2026-11-09 08:19 to 2026-11-10 07:33 ET, covering stocks, energy and gold.
▼ Market news
- Bias
- ▼ -13.91%
- Articles
- 266
- Positive
- ▲ 25.56%
- Neutral
- — 34.96%
- Negative
- ▼ 39.47%
▲ GLD / Gold
- Bias
- ▲ +45.45%
- Articles
- 11
- Positive
- ▲ 54.55%
- Neutral
- — 36.36%
- Negative
- ▼ 9.09%
Sentiment Summary: Gold coverage leaned positive (55% positive, 9% negative), with November 9 gains attributed to a weaker dollar and falling crude as hopes for U.S.-Iran diplomacy improved; equities also rebounded, with gold lagging the Nasdaq 100. Central-bank buying supported the post-election gold rebound, but elevated real yields and Fed rate expectations remained counterweights. By early November 10, gold had edged lower ahead of upcoming U.S. inflation data, with October CPI consensus at 0.3% month over month and core CPI at 0.2%.
Conclusion: Inflation and rate expectations remain the central cross-market risk following Monday’s equity and precious-metals gains.
▼ USO / Oil
- Bias
- ▼ -22.86%
- Articles
- 35
- Positive
- ▲ 20.00%
- Neutral
- — 37.14%
- Negative
- ▼ 42.86%
Sentiment Summary: Oil coverage leaned negative (43% negative versus 20% positive), as Trump’s November 8 comments easing expectations of further Iran strikes and October’s OPEC output recovery pressured crude through November 10; Brent fell below $90 for the first time since August. Lower energy prices nevertheless supported Monday’s equity rebound and Tuesday’s gains in S&P 500 and Dow futures, distinguishing oil weakness from broader equity sentiment. Persistent Hormuz shipping risks and reports of reduced Russian refining capacity counterbalanced the easing supply concerns.
Conclusion: Upcoming U.S. CPI remained the key inflation catalyst for an equity recovery following last week’s technology selloff.
Glossary: Sentiment Bias = (positive articles − negative articles) ÷ total articles × 100. It ranges from −100% negative to +100% positive. A reading near zero indicates little directional bias. Neutral articles reduce the score’s strength. ▲ positive; ▼ negative; — balanced. These readings describe news coverage, not market-price direction.
Market Technical Analysis
Analysis of VIX volatility, prior-session major ETFs and mega-cap tech stocks, and real-time futures snapshots and higher-time-frame analysis.
VIX — Market Fear Gauge Daily
| Level | Open | High | MaxVix | Low | MinVix | DNC% | DOC% | VR | MaxVR | MinVR |
|---|---|---|---|---|---|---|---|---|---|---|
| 19.89 | 23.37 | 23.37 | 28.36 | 19.64 | 16.21 | -14.27% | -14.89% | 6.03 | 56.57 | -0.20 |
VIX fell 14.89% from the session's opening level. VIX fell 14.27% versus the previous session close. Expected volatility eased from the period open. VIX is 30.3% up the recent 15-session range (16.21–28.36), in the 30–40% band.
VR: ATN Volatility Ratio (VR): 6.03 – Stocks rose while expected volatility eased. VR is in the lower part of its preceding 15-session VR range (-0.20 to 56.57), in the 10–20% band. VR fell 50.54 points from the previous session, a large shift relative to that range.
Range lookback: preceding 15 completed sessions.
Major ETFs and Mega Cap Tech Stocks
- Dow futures rose 172 points, or 0.33%, and S&P 500 futures gained 0.17%, while Nasdaq 100 futures declined 0.26% ahead of the inflation report.
- The Nasdaq 100 recorded its strongest session since March on Monday despite Nvidia’s decline, with chip stocks contributing to the rebound.
- Subsequent coverage reported renewed pressure on semiconductor stocks following Monday’s rally.
- Nvidia faced a shareholder lawsuit alleging undisclosed ties between Jensen Huang and a suspected Chinese spy, alongside reported board and government scrutiny.
- Citi and Wells Fargo lowered Nvidia price targets Tuesday morning after Monday’s share-price decline.
- Google Cloud’s operating margin increased from 23.7% to 36.2% over a year as quarterly revenue exceeded $30 billion.
- European equities approached a record high as technology shares and banks advanced alongside declining energy prices.
ETF, Mag7, and Cross-Market ETF prior day Insights
Overall Tone
The November 9, 2026 daily session showed broad risk appetite from the open, though cross-market participation was uneven and several longer-term trends remained weak.
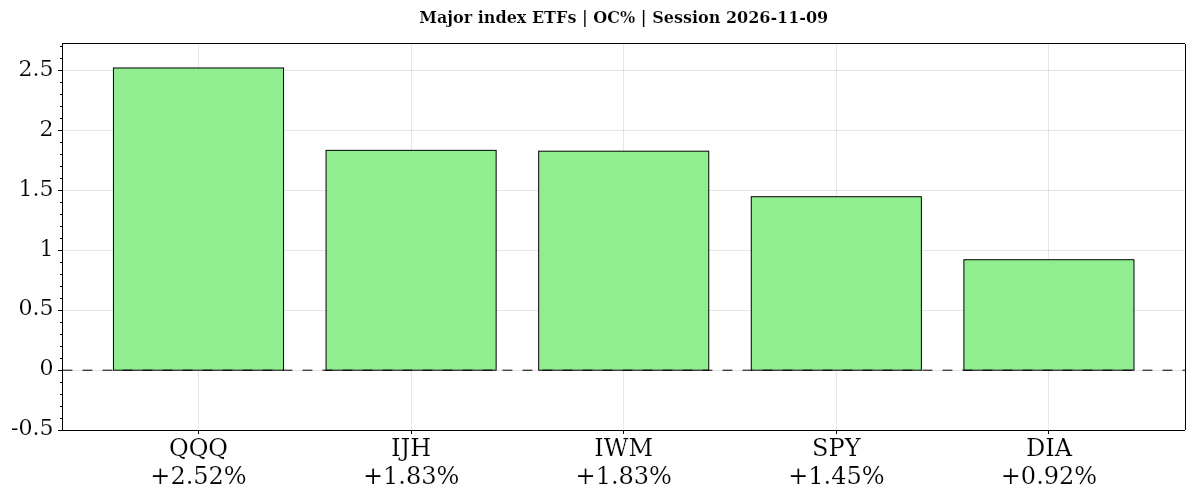
| Instrument | Bias | Date | DNC% | DOC% | O | H | L | C | VWAP | Vol |
|---|---|---|---|---|---|---|---|---|---|---|
| ▲ QQQ | ▲ ▲ ▲ | 2026-11-09 | ▲ +3.54% | ▲ +2.52% | 662.64 | 682.48 | 662.02 | 679.35 | ▲ 676.17 | 55,071,712 |
| ▲ IJH | ▲ ▲ ▲ | 2026-11-09 | ▲ +3.16% | ▲ +1.83% | 73.05 | 74.74 | 72.96 | 74.39 | ▲ 74.21 | 13,899,036 |
| ▲ IWM | ▲ ▲ ▲ | 2026-11-09 | ▲ +3.23% | ▲ +1.83% | 277.44 | 283.79 | 276.81 | 282.51 | ▲ 281.37 | 28,270,436 |
| ▲ SPY | ▲ ▲ ▲ | 2026-11-09 | ▲ +2.37% | ▲ +1.45% | 741.95 | 755.42 | 741.02 | 752.69 | ▲ 751.20 | 48,779,293 |
| ▲ DIA | ▲ ▲ ▲ | 2026-11-09 | ▲ +2.17% | ▲ +0.92% | 518.55 | 525.17 | 517.24 | 523.33 | ▲ 522.07 | 3,411,227 |
| AVG/Sum | — | — | +2.89% | +1.71% | — | — | — | — | — | 149,431,704 |
Index ETFs
Positive confluence: average DOC% +1.71% from the open and DNC% +2.89% versus the prior close. All five index ETFs gained on both comparisons; QQQ led from the open and versus the prior close, small- and mid-caps followed, and DIA lagged. QQQ’s near- and intermediate-term averages still declined, while small- and mid-cap gains had above-average volume.
QQQ · D:2026-11-09 NC% ▲ +3.54% OC% ▲ +2.52%
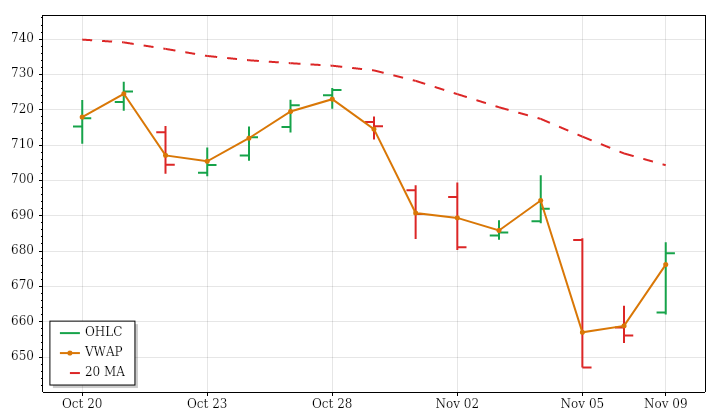
QQQ – Nasdaq 100 Technicals Summary
QQQ’s completed November 9 daily session closed at 679.35, gaining 3.54% versus the prior close and 2.52% from the open. The upward opening gap remained unfilled, while a higher high and higher low led to a finish above the previous day’s high. Closing above VWAP reinforced the strength of the completed session rather than merely reflecting the opening gap.
The rally nevertheless left price slightly below its falling near-term average and beneath a declining intermediate average. The far-term horizon was mixed, with price below an average that was still rising. Thus the advance opposed, rather than erased, the declining 15-session price trend. Range expanded to roughly 169% of average, while volume was modestly above average, matching the lookback’s expansion and increasing activity. PSAR and ATR-median remained bearish. A next-session high above 691.6121 would conditionally reverse PSAR bullish.
IJH · D:2026-11-09 NC% ▲ +3.16% OC% ▲ +1.83%
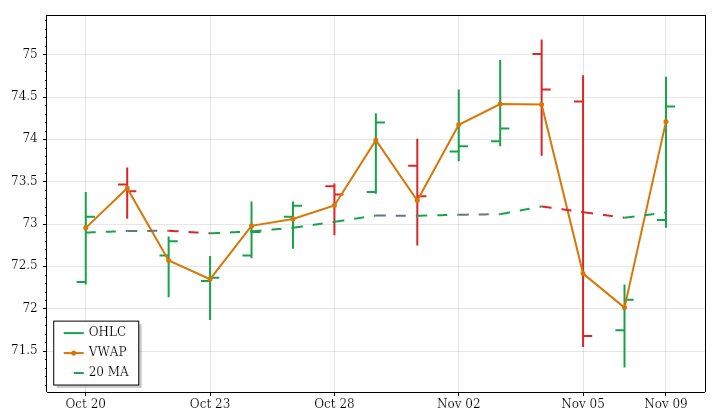
IJH – Mid Cap Technicals Summary
IJH’s completed daily session on November 9 advanced 3.16% from the prior close to 74.39, including a 1.83% gain from the open. Its upward opening gap remained unfilled, and the higher high and higher low ended with a close above the previous day’s high and session VWAP. The finish also reached the first upper volatility-band zone.
Near- and far-term averages were rising beneath price, but the intermediate average was still falling, leaving that horizon mixed. The 15-session price trend was slightly positive but extremely inefficient, indicating substantial back-and-forth movement rather than persistent progress. This session stood out: range and volume were each about 176% of average, reinforcing their rising lookback trends. ATR-median remained bullish, whereas PSAR stayed bearish. A next-session high above 74.74 would trigger a bullish PSAR reversal; the strong daily gain alone had not done so.
IWM · D:2026-11-09 NC% ▲ +3.23% OC% ▲ +1.83%
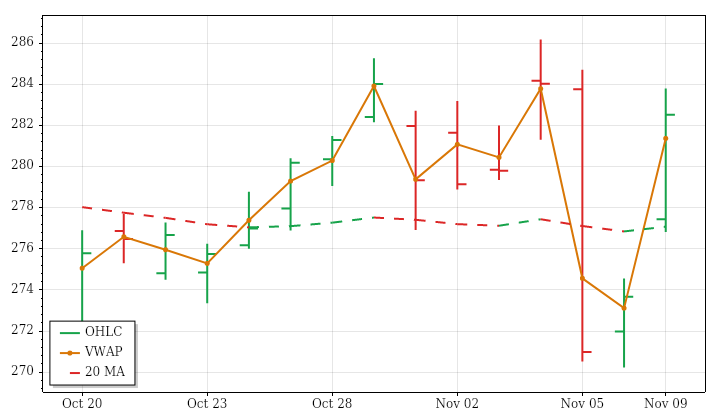
IWM – Small Cap Technicals Summary
IWM’s completed November 9 daily session closed at 282.51, gaining 3.23% against the prior close and 1.83% from the open. An unfilled upward gap, higher high and higher low accompanied a finish above the previous day’s high. The close above VWAP supported the session’s positive tone despite movement on both sides of the open.
Near-term strength was established above a rising average, but the intermediate horizon remained mixed because its average was falling. Price also remained below a nearly flat, declining far-term average, so the rally did not resolve the longer-term conflict. The modestly rising 15-session price trend had shown limited directional efficiency. Range reached about 165% of average and volume was above average, consistent with their expanding lookback trends. PSAR and ATR-median remained bearish; a next-session high above 283.8587 would conditionally reverse PSAR bullish.
SPY · D:2026-11-09 NC% ▲ +2.37% OC% ▲ +1.45%
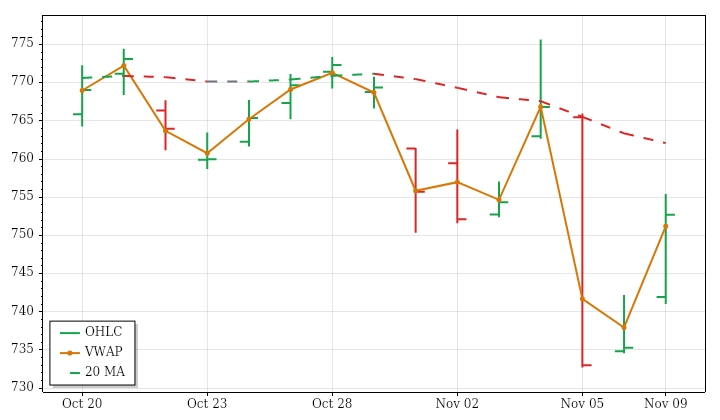
SPY – S&P 500 Technicals Summary
SPY’s completed daily session on November 9 gained 2.37% from the prior close to 752.69, including a 1.45% advance from the open. The upward opening gap stayed unfilled, and a higher high and higher low produced a close above the previous day’s high. The finish above session VWAP supported the positive daily action.
Price ended just above its falling near-term average, leaving that horizon mixed. The intermediate structure remained downward, while the far-term average continued rising beneath price. The daily rally therefore improved price position without resolving the conflict with the declining 15-session trend. Range was about 163% of average, consistent with ongoing expansion, but volume was essentially average despite its increasing lookback trend. Both PSAR and ATR-median remained bearish. A next-session high above 771.4543 would trigger a bullish PSAR reversal, not one confirmed by this advance.
S&P 500 News and Fundamentals
The S&P 500 surged at the opening on November 9 as buyers returned to technology shares. U.S. stocks added approximately $1 trillion in market value during the opening period of trading.
DIA · D:2026-11-09 NC% ▲ +2.17% OC% ▲ +0.92%
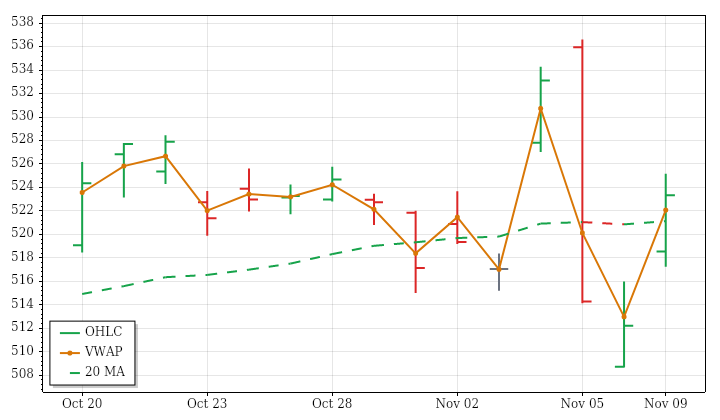
DIA – Dow Jones Technicals Summary
DIA’s completed daily session on November 9 finished at 523.33, up 2.17% from the prior close and 0.92% from the open. An unfilled upward opening gap and a close above the previous day’s high established a positive session, despite trading on both sides of the open. The finish above VWAP reinforced that daily strength.
The broader picture was less uniform. Price exceeded a slightly falling near-term average, while intermediate- and far-term averages remained rising. Those positions contrasted with the declining, inefficient 15-session price trend. Range expanded to roughly 137% of average, extending a sequence of large-range sessions, but volume was below average despite its rising lookback trend. Momentum signals also conflicted with the advance: ATR-median crossed bearish and PSAR remained bearish. A next-session high above 533.806 would trigger a bullish PSAR reversal.
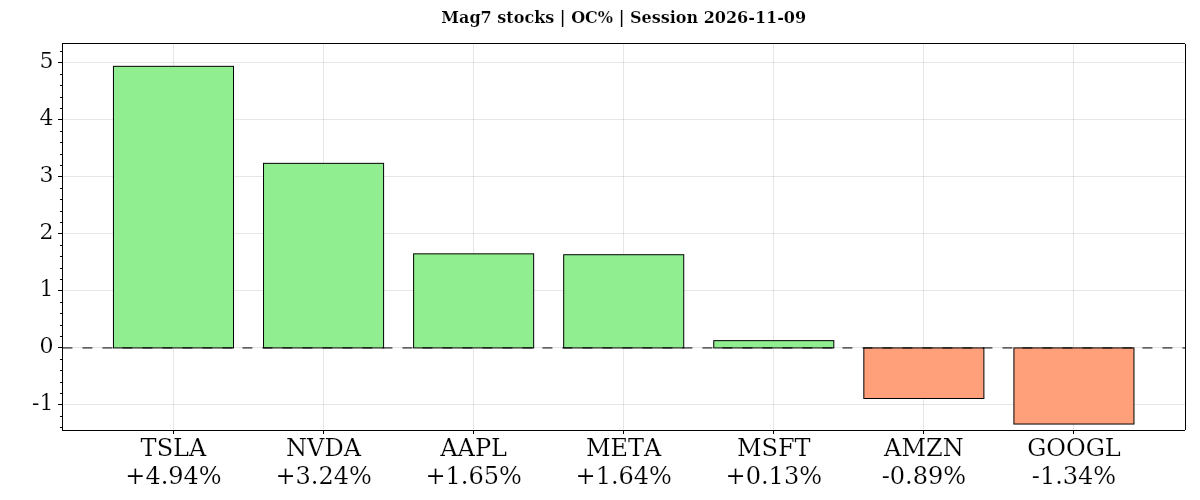
| Instrument | Bias | Date | DNC% | DOC% | O | H | L | C | VWAP | Vol |
|---|---|---|---|---|---|---|---|---|---|---|
| ▲ TSLA | ▲ ▲ ▲ | 2026-11-09 | ▲ +5.54% | ▲ +4.94% | 360.25 | 382.20 | 360.02 | 378.05 | ▲ 377.09 | 36,434,515 |
| ▲ NVDA | ▼ ▲ ▲ | 2026-11-09 | ▼ -4.27% | ▲ +3.24% | 173.06 | 179.92 | 170.24 | 178.67 | ▲ 176.81 | 456,496,884 |
| ▲ AAPL | ▲ ▲ ▲ | 2026-11-09 | ▲ +2.43% | ▲ +1.65% | 345.00 | 352.33 | 344.78 | 350.69 | ▲ 350.31 | 47,126,385 |
| ▲ META | ▲ ▲ ▼ | 2026-11-09 | ▲ +5.12% | ▲ +1.64% | 631.05 | 647.25 | 630.00 | 641.37 | ▼ 641.46 | 18,882,757 |
| ▲ MSFT | ▲ ▲ ▲ | 2026-11-09 | ▲ +2.75% | ▲ +0.13% | 544.49 | 548.28 | 538.70 | 545.18 | ▲ 544.33 | 25,325,616 |
| ▼ AMZN | ▲ ▼ ▼ | 2026-11-09 | ▲ +2.94% | ▼ -0.89% | 269.32 | 275.34 | 266.91 | 266.93 | ▼ 269.56 | 50,580,968 |
| ▼ GOOGL | ▲ ▼ ▼ | 2026-11-09 | ▲ +1.18% | ▼ -1.34% | 292.05 | 296.33 | 288.01 | 288.15 | ▼ 291.27 | 36,328,904 |
| AVG/Sum | — | — | +2.24% | +1.34% | — | — | — | — | — | 671,176,029 |
Mag7 Stocks
Positive confluence: average DOC% +1.34% from the open and DNC% +2.24% versus the prior close. Five of seven gained from the open: Tesla led, Alphabet lagged, and Amazon also slipped; six rose versus the prior close, led by Tesla, while Nvidia fell 4.27% despite gaining 3.24% from the open. Apple’s moving-average uptrends remained aligned.
TSLA · D:2026-11-09 NC% ▲ +5.54% OC% ▲ +4.94%
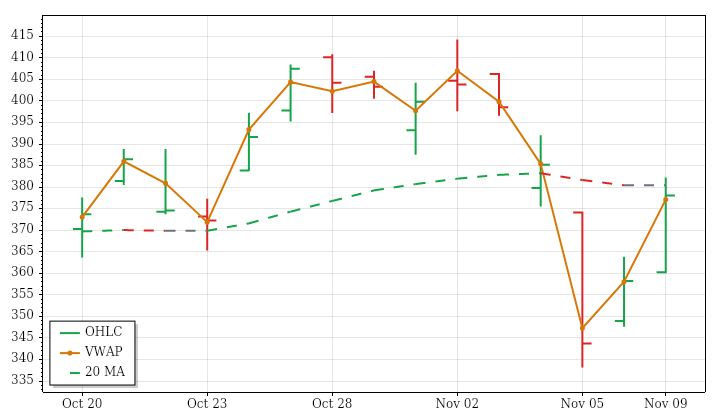
TSLA – Tesla Technicals Summary
TSLA’s completed daily session on November 9 closed at 378.05, up 5.54% versus the prior close and 4.94% from the open. Unlike a predominantly gap-driven gain, most of this advance developed during the session. The modest opening gap remained unfilled, and a higher high and higher low ended above the previous day’s high and slightly above VWAP.
Trend alignment remained incomplete. Price was just below a rising near-term average, above a rising intermediate average and above a falling far-term average. The 15-session price trend was slightly downward and highly inefficient, underscoring the choppy backdrop. Range approached one and a half times average, extending a sequence of large-range sessions, but volume was below average despite a rising lookback trend. PSAR and ATR-median remained bearish. A next-session high above 396.6936 would conditionally trigger a bullish PSAR reversal.
Tesla News and Fundamentals
Tesla expanded its robotaxi service to San Antonio, announcing availability beginning at 5 a.m. on November 9. Separately, Elon Musk said Cybertruck manufacturing would end next spring and that Tesla would return many customer deposits because its order backlog far exceeded the number of trucks it could build. Musk defended the decision to discontinue production while maintaining that demand exceeded available supply.
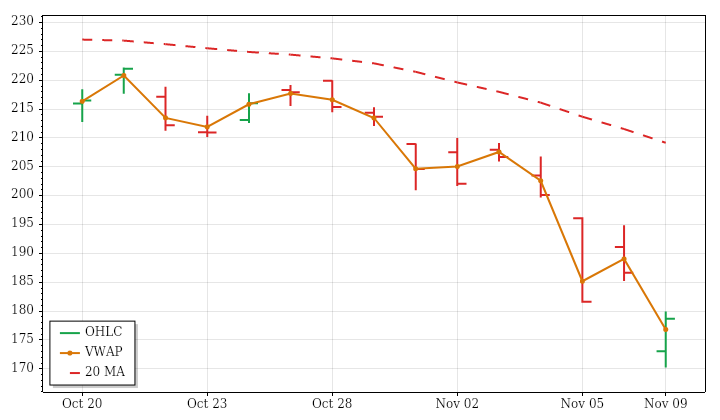
NVDA · D:2026-11-09 NC% ▼ -4.27% OC% ▲ +3.24%
NVDA – Nvidia Technicals Summary
NVDA’s completed daily session on November 9 finished at 178.67, losing 4.27% versus the prior close despite recovering 3.24% from the open. The sharp downward opening gap remained unfilled. Price closed near the session high and above VWAP, but still below the previous day’s low, separating a meaningful intraday rebound from an overall weak daily result.
Near- and intermediate-term downtrends remained aligned with the declining 15-session price trend. The far-term horizon was mixed: its average was still rising, but price remained well below it. Range was substantially above average and volume reached approximately 3.73 times average, reinforcing the lookback’s expanding ranges and increasing participation. This was also the fourth consecutive large-range session. PSAR and ATR-median remained bearish despite the recovery from the open. A next-session high above 203.0226 would conditionally trigger a bullish PSAR reversal.
Nvidia News and Fundamentals
Nvidia’s board initiated an independent investigation following allegations involving CEO Jensen Huang’s relationship with a suspected Chinese spy. On November 9, President Donald Trump said the FBI was investigating and that Huang told him he had not known the woman was a spy. A shareholder lawsuit alleged Nvidia failed to disclose related national-security risks that threatened its reputation and business prospects. The investigation also prompted questions about leadership succession.
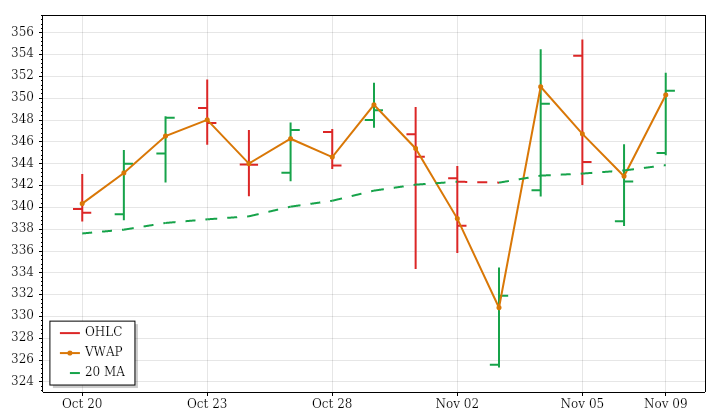
AAPL · D:2026-11-09 NC% ▲ +2.43% OC% ▲ +1.65%
AAPL – Apple Technicals Summary
AAPL’s completed daily session on November 9 closed at 350.69, gaining 2.43% from the prior close and 1.65% from the open. The opening gap remained unfilled, and a higher high and higher low culminated in a close above the previous day’s high. Finishing slightly above session VWAP supported the positive daily picture, although trading crossed both sides of the open.
Near-, intermediate- and far-term moving-average uptrends were aligned, contrasting with a slightly declining, highly choppy 15-session price trend. The day’s range was essentially average and volume modestly below average, rather than matching the lookback’s expanding ranges and increasing participation. A fresh bullish ATR-median crossover complemented the existing PSAR uptrend. That alignment remains conditional: a next-session low below 332.2565 would trigger a bearish PSAR reversal, not a signal already established by this session.
Apple News and Fundamentals
Apple reported revenue of $114.48 billion and earnings per share of $2.10, topping estimates as hardware and services delivered double-digit growth. Strong iPhone and Mac sales supported a record quarter, but rising memory costs and Siri AI expenses pressured margins. Its fiscal Q1 2027 guidance indicated further margin pressure and supply constraints.
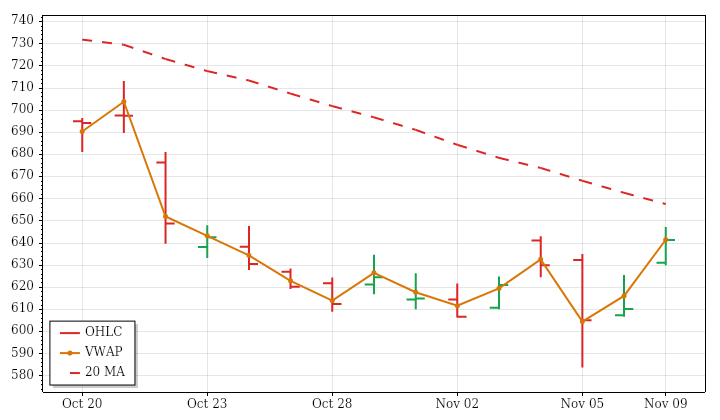
META · D:2026-11-09 NC% ▲ +5.12% OC% ▲ +1.64%
META – Meta Platforms Technicals Summary
META’s completed daily session on November 9 rose 5.12% versus the prior close to 641.37, with a smaller 1.64% gain from the open. The substantial upward opening gap remained unfilled, and price finished above the previous day’s high after making a higher high and higher low. However, the close was marginally below session VWAP, tempering the otherwise strong daily advance.
The rally placed price above a falling near-term average, leaving that horizon mixed rather than fully bullish. The intermediate structure remained downward, while the far-term average was rising beneath price. This fragmented alignment contrasted with the clear decline over the 15-session lookback. Range was below average despite an expanding range trend, and volume was roughly 70% of average alongside a declining volume trend. ATR-median remained bearish despite PSAR’s long state. A next-session low below 583.8 would conditionally reverse PSAR bearish.
Meta News and Fundamentals
Meta Superintelligence Lab released Muse Ember on November 9, describing it as its lightest and most cost-efficient AI model yet. The model targets agent tasks including tool calls, coding subtasks, routing, extraction and long-document parsing. Separately, Meta’s latest quarterly results showed negative free cash flow, with heavy AI spending raising concerns despite continued business growth.
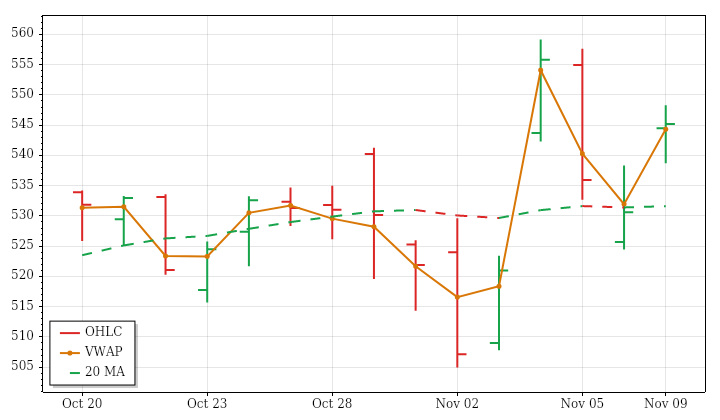
MSFT · D:2026-11-09 NC% ▲ +2.75% OC% ▲ +0.13%
MSFT – Microsoft Technicals Summary
MSFT’s completed November 9 daily session closed at 545.18, up 2.75% from the prior close but only 0.13% from the open. Almost all the net advance came through the unfilled upward opening gap. Trading crossed both sides of the open before finishing nearby, although the close remained above the previous day’s high and slightly above session VWAP.
Price stood above a falling near-term average, leaving that horizon mixed, while intermediate- and far-term uptrends remained aligned. The preceding 15 sessions had a slightly positive price trend but almost no directional efficiency, so the latest gain occurred against a choppy backdrop. Range was only about 71% of average and volume slightly below average, contrasting with expansion and increasing volume across the lookback. PSAR and ATR-median remained bullish. A next-session low below 512.6888 would trigger a bearish PSAR reversal.
Microsoft News and Fundamentals
Microsoft 365 Commercial Cloud reported 18% adjusted growth against 5% growth in paid seats. Microsoft’s Foundry customer count exceeded 120,000, while Microsoft IQ approached 60,000 customers. Its E7 bundle costs $99 monthly, with incremental revenue per user estimated at $9–$39 depending on existing licenses. Adoption of consumption-based AI services outside coding remained uncertain.
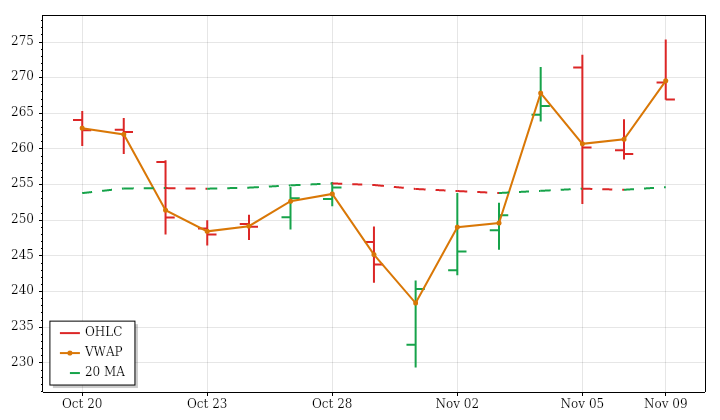
AMZN · D:2026-11-09 NC% ▲ +2.94% OC% ▼ -0.89%
AMZN – Amazon Technicals Summary
AMZN’s completed November 9 daily session gained 2.94% versus the prior close to finish at 266.93, but fell 0.89% from its opening price. The large upward gap remained unfilled and the close exceeded the previous day’s high. Nevertheless, the finish near the session low and below VWAP showed that the opening advance was partly surrendered during trading.
Price stood above the near- and intermediate-term averages, but both averages were still falling, leaving those horizons mixed rather than established uptrends. The far-term structure remained rising, while the 15-session price trend was modestly downward. An above-average range fit the lookback’s expansion, but below-average volume did not match its increasing volume trend. PSAR and ATR-median remained bullish; a next-session low below 247.1468 would conditionally reverse PSAR to bearish.
Amazon News and Fundamentals
Amazon’s AWS revenue rose 39% in Q3, fueled by AI demand. AWS reported a 39% operating margin and 56% year-over-year income growth, while Amazon’s operating cash flow increased 29% to $168 billion. Heavy capital spending and negative free cash flow remained concerns as the company invested to support cloud demand and its backlog.
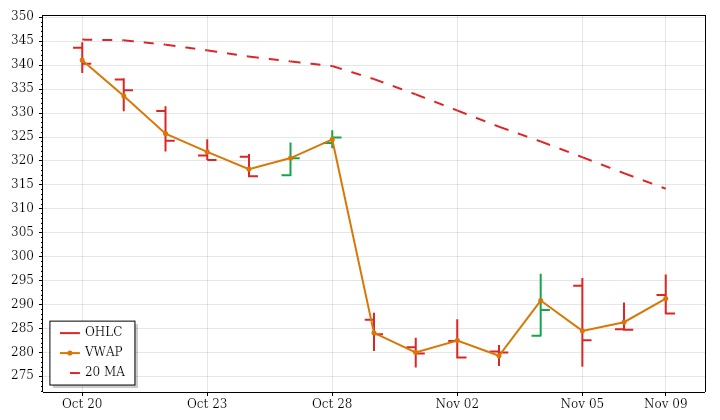
GOOGL · D:2026-11-09 NC% ▲ +1.18% OC% ▼ -1.34%
GOOGL – Alphabet Technicals Summary
GOOGL’s completed daily session on November 9 closed at 288.15, up 1.18% from the prior close but down 1.34% from the open. The upward opening gap remained unfilled, yet the close slipped back inside the prior day’s range and finished near the session low. Closing below VWAP further distinguished the positive prior-close return from the weaker intraday performance.
Price ended only marginally above its falling near-term average, leaving that horizon mixed. Intermediate- and far-term downtrends remained aligned with the pronounced decline across the preceding 15 sessions. The day’s above-average range matched the expanding-range backdrop, but below-average volume contrasted with the lookback’s increasing participation. PSAR was in a long state while ATR-median remained bearish, creating signal disagreement. A next-session low below 276.92 would trigger a bearish PSAR reversal rather than confirm one already in place.
| Instrument | Bias | Date | DNC% | DOC% | O | H | L | C | VWAP | Vol |
|---|---|---|---|---|---|---|---|---|---|---|
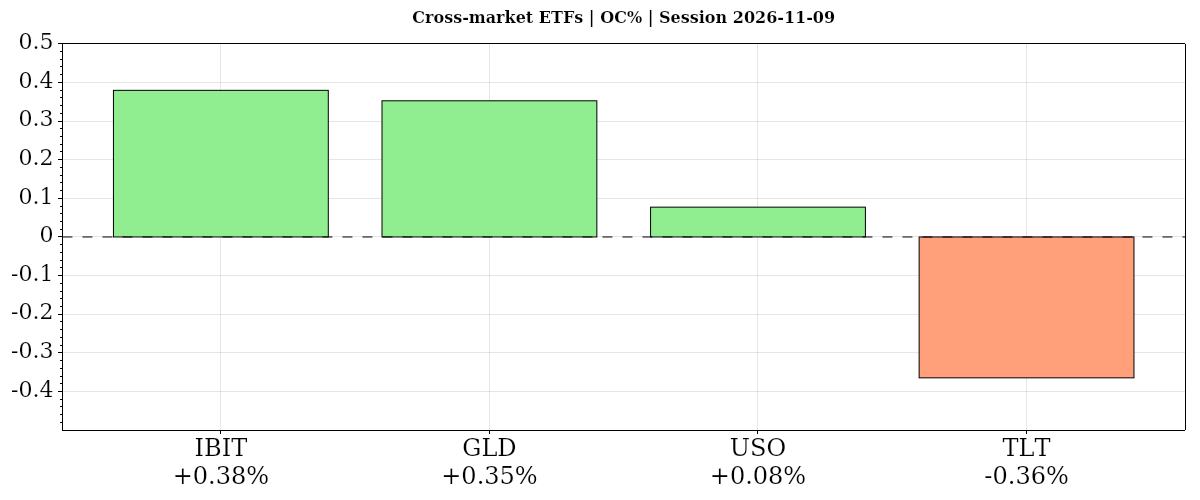
| ▲ IBIT | ▼ ▲ ▲ | 2026-11-09 | ▼ -1.31% | ▲ +0.38% | 42.16 | 42.70 | 41.98 | 42.32 | ▲ 42.29 | 31,004,228 |
| ▲ GLD | ▲ ▲ ▲ | 2026-11-09 | ▲ +1.88% | ▲ +0.35% | 378.20 | 380.18 | 375.68 | 379.53 | ▲ 378.08 | 7,348,480 |
| ▲ USO | ▼ ▲ ▲ | 2026-11-09 | ▼ -3.87% | ▲ +0.08% | 142.55 | 145.18 | 139.44 | 142.66 | ▲ 142.32 | 6,258,362 |
| ▼ TLT | ▲ ▼ ▼ | 2026-11-09 | ▲ +0.05% | ▼ -0.36% | 82.26 | 82.28 | 81.82 | 81.96 | ▼ 81.97 | 28,736,405 |
| AVG/Sum | — | — | -0.81% | +0.11% | — | — | — | — | — | 73,347,475 |
Cross-Market ETFs
Mixed: average DOC% +0.11% from the open and DNC% -0.81% versus the prior close. Bitcoin and gold gained from the open, oil was nearly flat, and bonds slipped. Versus the prior close, gold rose, bonds barely advanced, and bitcoin and oil fell, diverging from equities.
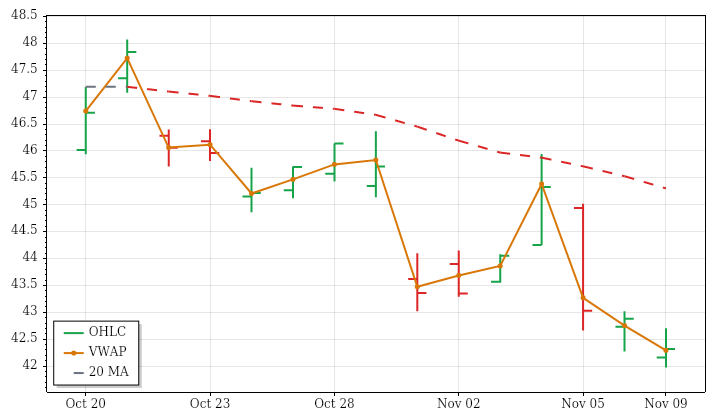
IBIT · D:2026-11-09 NC% ▼ -1.31% OC% ▲ +0.38%
IBIT – Bitcoin Technicals Summary
IBIT’s completed November 9 daily session finished at 42.32, down 1.31% versus the prior close despite gaining 0.38% from the open. The opening downward gap remained unfilled. Although the close recovered into the previous day’s range and finished slightly above VWAP, the lower high and lower low kept the daily structure weaker than that modest intraday rebound might suggest.
Near-term averages remained in a downtrend, consistent with the declining 15-session price trend. The intermediate horizon was mixed because price sat below a still-rising average, while the far-term uptrend remained intact. Both range and volume were substantially below average, diverging from the lookback’s expanding ranges and rising volume. PSAR and ATR-median remained bearish, so the session recovery did not establish a reversal. A next-session high above 44.71 would conditionally turn PSAR bullish.
GLD · D:2026-11-09 NC% ▲ +1.88% OC% ▲ +0.35%
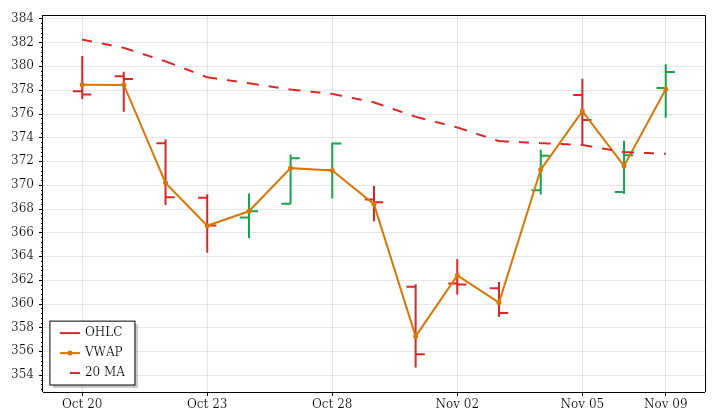
GLD – Gold Technicals Summary
GLD’s completed November 9 daily session closed at 379.53, rising 1.88% versus the prior close but only 0.35% from the open. Much of the gain therefore came through the unfilled upward opening gap. A higher high and higher low, a finish near the session high and a close above both VWAP and the prior day’s high supported the daily advance.
That strength did not establish broad trend alignment. Price was above falling near- and intermediate-term averages, leaving those horizons mixed, while the far-term structure remained downward. The latest advance also opposed the declining 15-session price trend. Range was moderately above average, consistent with ongoing expansion, but volume was about one-fifth below average despite increasing over the lookback. ATR-median crossed bullish alongside an existing PSAR uptrend; a next-session low below 360.3922 would conditionally reverse PSAR bearish.
Gold News and Fundamentals
Gold edged lower in early Asian trading as investors awaited key U.S. inflation data. ANZ Research said the metal had recently gained some momentum as lower oil prices and a rebound in equities boosted risk appetite.
USO · D:2026-11-09 NC% ▼ -3.87% OC% ▲ +0.08%
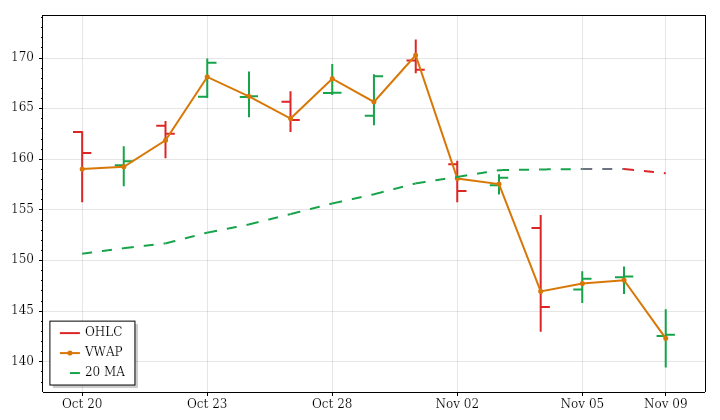
USO – Oil Technicals Summary
USO’s completed November 9 daily session closed at 142.66, down 3.87% versus the prior close but up just 0.08% from the open. The loss was therefore overwhelmingly associated with the unfilled downward opening gap. Trading crossed both sides of the open before finishing nearby and above VWAP, yet the close remained below the previous day’s low after a lower high and lower low.
The near-term downtrend agreed with the declining 15-session price trend. Intermediate conditions were mixed because price was below a rising average, while the far-term uptrend remained intact. The session’s above-average range ran against the lookback’s contracting ranges; moderately above-average volume aligned with increasing activity. Neither the marginal intraday gain nor the VWAP position resolved the broader weakness. PSAR and ATR-median remained bearish, with a next-session high above 162.0386 required to trigger a bullish PSAR reversal.
Oil News and Fundamentals
Brent crude settled at $92.57 a barrel on November 9 after its worst week since the start of Covid. Falling U.S. fuel inventories contrasted with recovering Middle Eastern crude exports and weakening demand expectations. Reports also cited peace-deal speculation and supply-glut concerns as pressures on WTI and Brent, alongside fresh attacks near energy infrastructure. The Iran war’s depletion of crude stockpiles prompted countries and companies to refill tanks and develop more accessible storage.
TLT · D:2026-11-09 NC% ▲ +0.05% OC% ▼ -0.36%
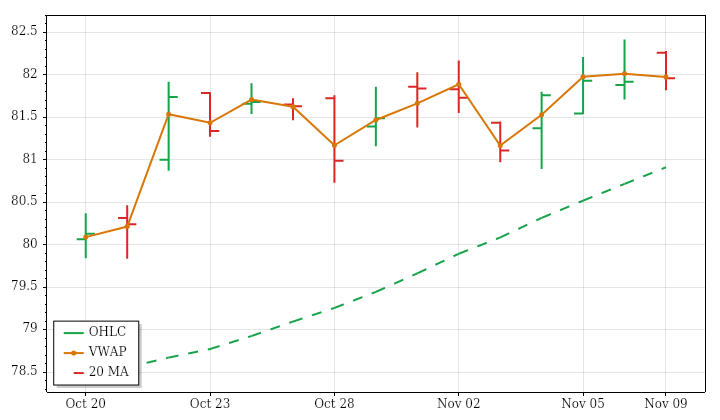
TLT – Long-Term Treasury Bonds Technicals Summary
TLT’s completed November 9 daily session finished at 81.96, essentially unchanged with a 0.05% gain versus the prior close but down 0.36% from the open. The opening upward gap was filled, and the entire session remained inside the previous day’s range. A close slightly below VWAP and below the open characterized a restrained daily retreat rather than renewed upward follow-through.
Near- and intermediate-term averages continued rising beneath price, consistent with the positive 15-session price trend. The far-term structure remained downward, however, with price below its falling average. The latest session therefore represented consolidation within shorter-term strength that still conflicted with the longer horizon. Range was about 71% of average and volume about 80%, unlike the lookback’s gradual range expansion and increasing activity. PSAR and ATR-median remained bullish; a next-session low below 81.1111 would conditionally reverse PSAR bearish.
Treasury Bonds News and Fundamentals
Japan’s yen-support interventions were reported to have been funded mainly by running off Treasury bills and other assets, rather than selling long-dated Treasuries. The analysis found no material impact on the long end of the Treasury market, with Federal Reserve policy and Treasury supply remaining the principal drivers.
Glossary: Instrument — ticker symbol; hover for the instrument or company name; Date — session date. DNC% — prior-session close to this session’s close; DOC% — daily session open-to-close percentage change. O — open; H — high; L — low; C — close, all for the table’s daily or weekly session; VWAP — volume-weighted average price; its arrow shows whether the close is above or below VWAP. Vol — period trading volume.
Bias — three directional readings, in order: DNC%, DOC%, then VWAP. ▲ positive/above; ▼ negative/below; — neutral or unavailable. Matching arrows show alignment; opposing arrows show mixed conditions. AVG/Sum — simple average of percentage changes and sum of reported volumes.
Futures Session Fib Grid Analysis – Snapshot
Session Fib Grids normalise market positioning as percentages, making direction and alignment comparable across different asset types.
Latest available snapshot for each instrument; Time(CT) shows the individual update date and time.
| Instrument | Bias | Time(CT) | YSFG | MSFG | WSFG | RSFG | SFG | TSI |
|---|---|---|---|---|---|---|---|---|
| ▲ ES | ▲ ▼ ▲ ▲ ▼ ▼ | 2026-11-10 07:18:51 | ▲ +40 | ▼ -20 | ▲ +74 | ▲ +68 | ▼ -9 | ▼ -60 |
| ▲ NQ | ▲ ▼ ▲ ▲ ▼ ▼ | 2026-11-10 07:18:54 | ▲ +27 | ▼ -28 | ▲ +51 | ▲ +61 | ▼ -8 | ▼ -82 |
| ▲ YM | ▲ ▲ ▲ ▲ ▼ ▼ | 2026-11-10 07:18:52 | ▲ +36 | ▲ +28 | ▲ +73 | ▲ +50 | ▼ -6 | ▼ -12 |
| ▲ EMD | ▲ ▲ ▲ ▲ ▼ ▼ | 2026-11-10 07:18:51 | ▲ +42 | ▲ +33 | ▲ +93 | ▲ +94 | ▼ -8 | ▼ -55 |
| ▲ RTY | ▲ ▲ ▲ ▲ ▼ ▼ | 2026-11-10 07:18:56 | ▲ +41 | ▲ +9 | ▲ +80 | ▲ +67 | ▼ -11 | ▼ -71 |
| ▲ FDAX | ▲ ▲ ▲ ▲ ▼ ▲ | 2026-11-10 07:18:41 | ▲ +46 | ▲ +60 | ▲ +105 | ▲ +11 | ▼ -4 | ▲ +35 |
| ▼ NKD | ▲ ▼ ▲ ▼ ▼ ▼ | 2026-11-10 07:18:35 | ▲ +111 | ▼ -33 | ▲ +37 | ▼ -40 | ▼ -5 | ▼ -121 |
| Instrument | Bias | Time(CT) | YSFG | MSFG | WSFG | RSFG | SFG | TSI |
|---|---|---|---|---|---|---|---|---|
| ▼ BTC | ▼ ▼ ▼ ▼ ▼ ▼ | 2026-11-10 07:18:16 | ▼ -60 | ▼ -26 | ▼ -33 | ▼ -18 | ▼ -7 | ▼ -71 |
| ▼ GC | ▼ ▲ ▲ ▼ ▼ ▼ | 2026-11-10 07:18:53 | ▼ -130 | ▲ +45 | ▲ +2 | ▼ -67 | ▼ -9 | ▼ -128 |
| ▼ CL | ▲ ▼ ▼ ▼ ― ▼ | 2026-11-10 07:18:51 | ▲ +140 | ▼ -93 | ▼ -58 | ▼ -44 | — 0 | ▼ -85 |
| ▲ 6E | ▼ ▲ ▲ ▲ ▼ ▼ | 2026-11-10 07:18:09 | ▼ -56 | ▲ +21 | ▲ +51 | ▲ +22 | ▼ -5 | ▼ -143 |
| ▼ ZB | ▼ ▲ ▼ ▼ ▼ ▼ | 2026-11-10 07:17:50 | ▼ -28 | ▲ +13 | ▼ -5 | ▼ -46 | ▼ -10 | ▼ -107 |
Glossary: YSFG — yearly; MSFG — monthly; WSFG — weekly; RSFG — regular trading hours (RTH); SFG — the current session, including pre-market or other sessions. TSI indicates trend strength and power.
Bias shows trend alignment across these six readings. The arrows follow the column order: YSFG, MSFG, WSFG, RSFG, SFG and TSI. Matching arrows show alignment; opposing arrows show mixed conditions.
Futures Higher Time Frame Analysis
Summary of the current state of US Indices Futures based on higher time-frame (HTF) technical analysis as of: 2026-11-10 07:16 -06:00 CT.
US Indices Futures
- ES YSFG/WSFG above centers, MSFG below center, daily pivots UTrend, declining intermediate benchmarks overhead, support 7322.25, resistance 7600.50–7616.00, weekly reversal 7683.25.
- NQ YSFG/WSFG above F0%, MSFG below F0%, daily pivots UTrend, declining intermediate benchmarks, support 26366.50–26368.50, resistance 28129.25–28552.50, weekly reversal 28789.00.
- YM all grids above centers, daily pivots UTrend, weekly pivots DTrend, rising long-term benchmarks, support 50859–51054, weekly reversal 53377, resistance 53631–55316.
- EMD all grids above centers, daily pivots UTrend, declining daily 55/100 benchmarks, support 3560.7, resistance 3742.2–3770.1, weekly reversal 3773.1, major resistance 3996.6.
- RTY all grids above F0%, daily pivots UTrend, weekly pivots DTrend, declining daily 55/100/200 benchmarks, support 2714.2, resistance 2862.2–2888.7, weekly reversal 2906.0.
- FDAX all grids above centers, daily pivot/HiLo UTrend, rising daily benchmarks, recent weekly WSFG/MSFG short signals, support 25895, daily reversal 25815, resistance 26721–26847.
Overall State
- Short-Term: Bullish
- Intermediate-Term: Neutral
- Long-Term: Bullish
Conclusion
Daily UTrend pivots align across all six instruments, while weekly pivots remain DTrend in ES, NQ, YM, EMD, and RTY. YSFG positioning sustains the broader bullish context, but intermediate alignment diverges: ES and NQ remain below MSFG centers and declining intermediate benchmarks, while YM, EMD, RTY, and FDAX hold above monthly references. FDAX leads in trend alignment, with daily pivot and HiLo UTrends; NQ lags beneath its 200-day benchmark. Recent FDAX weekly grid short signals contrast with its upward swing structure. Overhead pivots and resistance remain nearby across the daily recoveries, while established swing lows define structural support.
Note: Intra-day counter-trend pullbacks or retracements may occur, HTF is context for informational usage and market structure. Glossary: Session Fib Grids periods of YSFG:’Yearly’, MSFG:’Monthly’, WSFG:’Weekly’
For full details visit: AlphaWebTrader Technicals
SPY Daily View
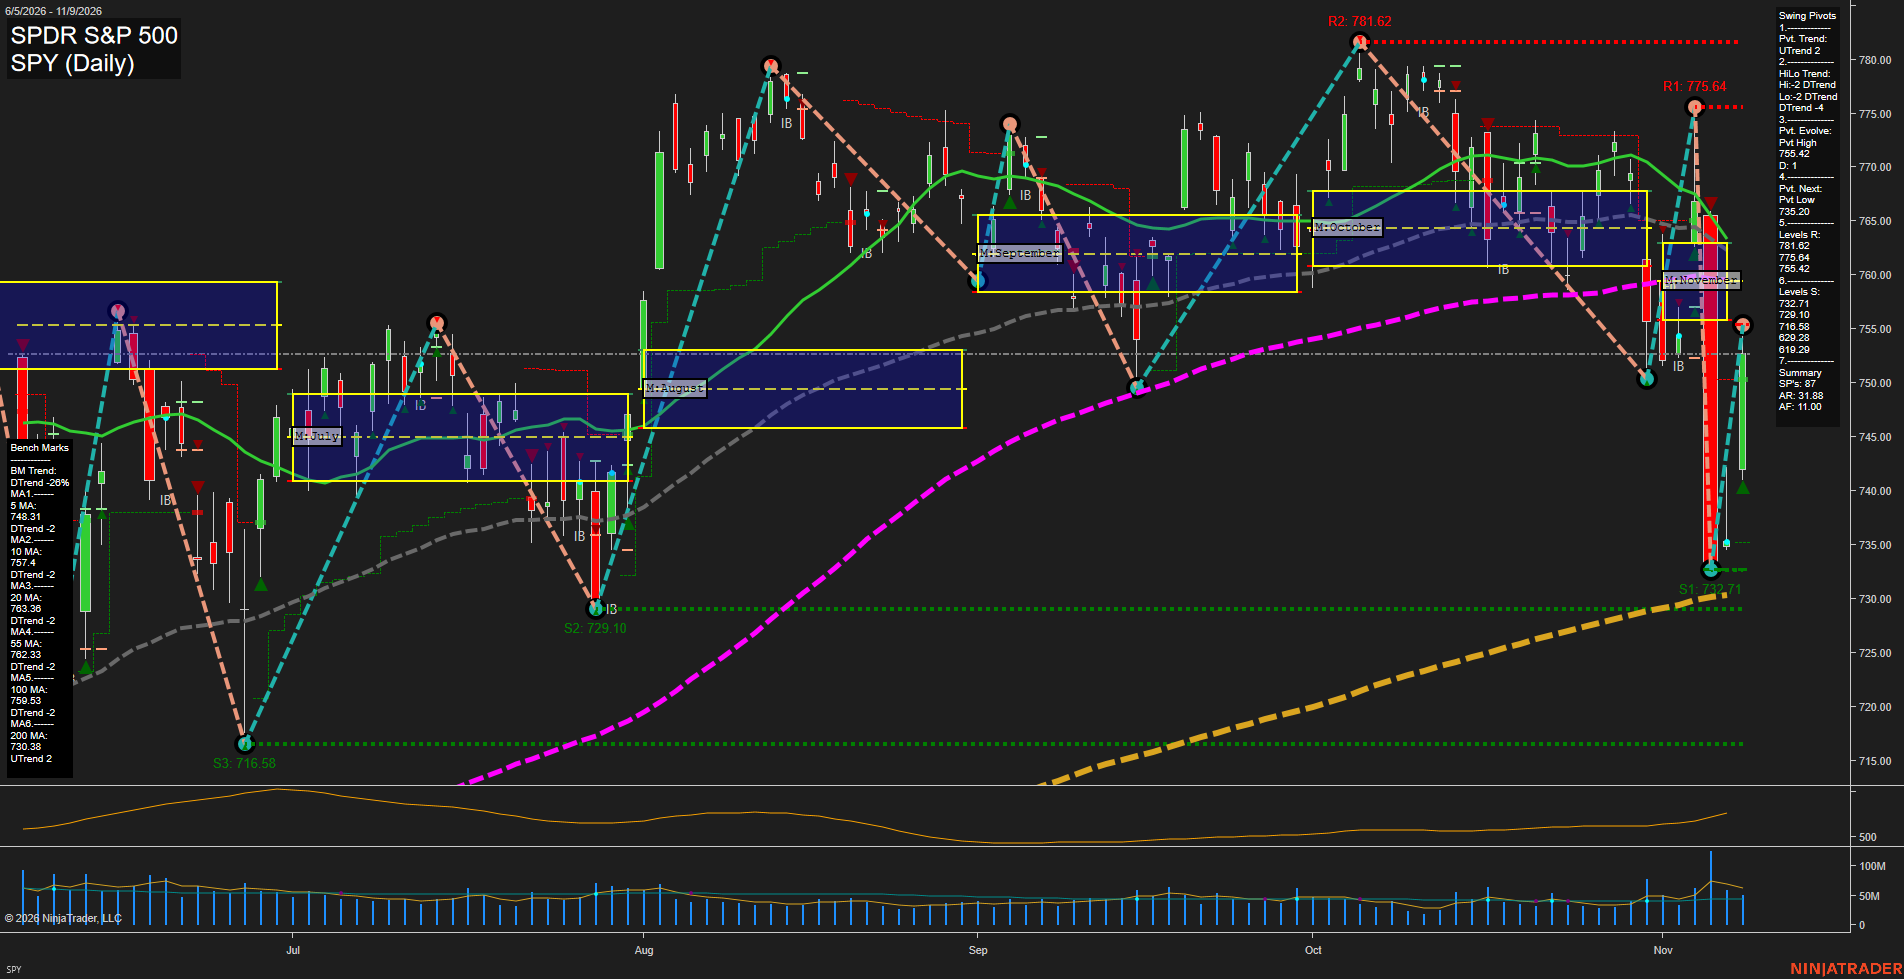
Overall Rating
- Short-Term: Neutral
- Intermediate-Term: Bearish
- Long-Term: Neutral.
Key Insights Summary
SPY shows a high-volatility V-recovery following a sharp November selloff, with price rebounding above the 5-day benchmark but remaining beneath the declining 10-, 20-, 55-, and 100-day averages. The short-term pivot has shifted to UTrend, yet the intermediate HiLo structure remains DTrend and the active pivot-high resistance at 755.42 is immediately overhead. From a futures swing perspective, the 755.42 to 763.38 area is the principal rebound and moving-average supply zone, while 732.71 to 729.10 remains the major downside support band. The elevated ATR confirms unusually wide daily ranges and fast momentum, while the rising 200-day average preserves the broader long-term support structure.
View charts on: AlphaWebTrader HTF Charts
ES Daily View
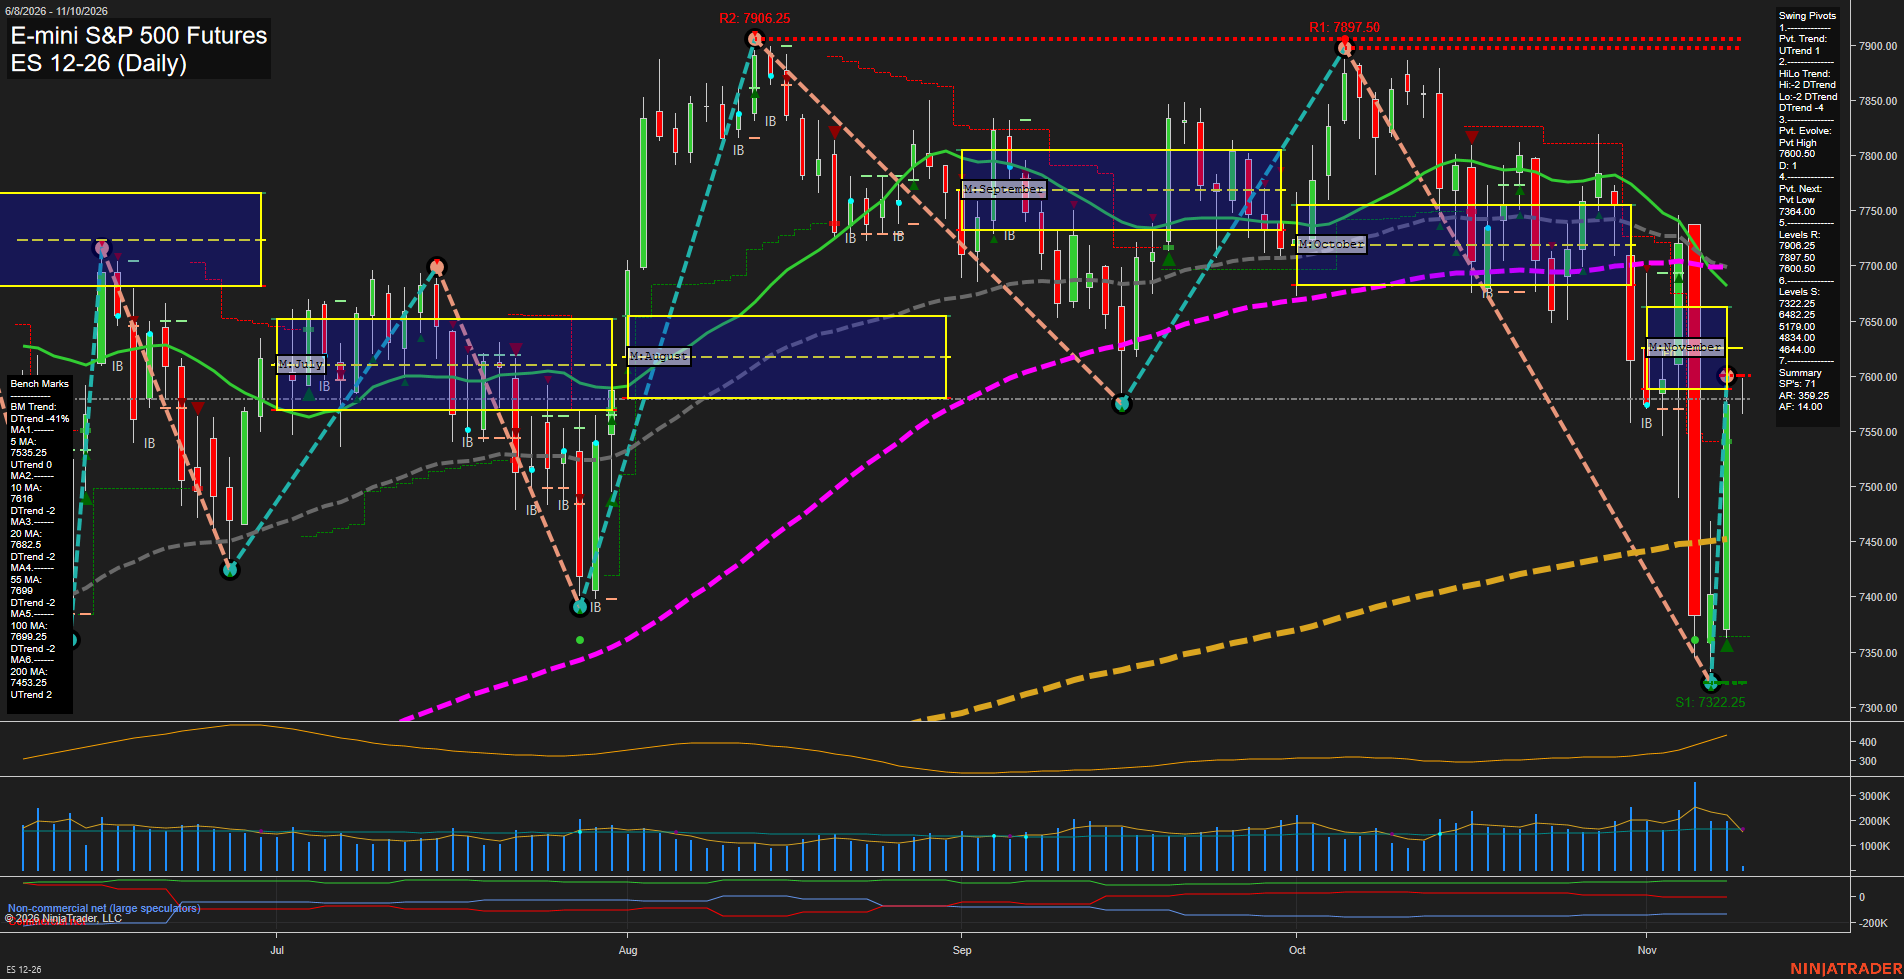
Overall Rating
- Short-Term: Bullish
- Intermediate-Term: Bearish
- Long-Term: Bullish.
Key Insights Summary
The daily chart reflects a high-volatility V-shaped rebound from the 7322.25 swing-low support area, producing fast upside momentum and restoring the short-term pivot trend to UTrend. Price is above the weekly Fib-grid center zone and the rising 5-day benchmark, while the 10-day average near 7616.00 and the evolving pivot-high level at 7600.50 define nearby short-term overhead structure. Intermediate structure remains counter-trend bearish: price is below the November MSFG center bias and beneath declining 20-, 55-, and 100-day benchmarks clustered from 7682.50 to 7699.25. The broader yearly Fib-grid bias and rising 200-day average remain constructive, framing the recent decline as a sharp retracement within a still-positive long-term structure. The 7600.50 area is the immediate pivot reference, followed by resistance near 7897.50-7906.25, while 7322.25 remains the major daily swing-support reference.
View charts on: AlphaWebTrader HTF Charts
QQQ Daily View
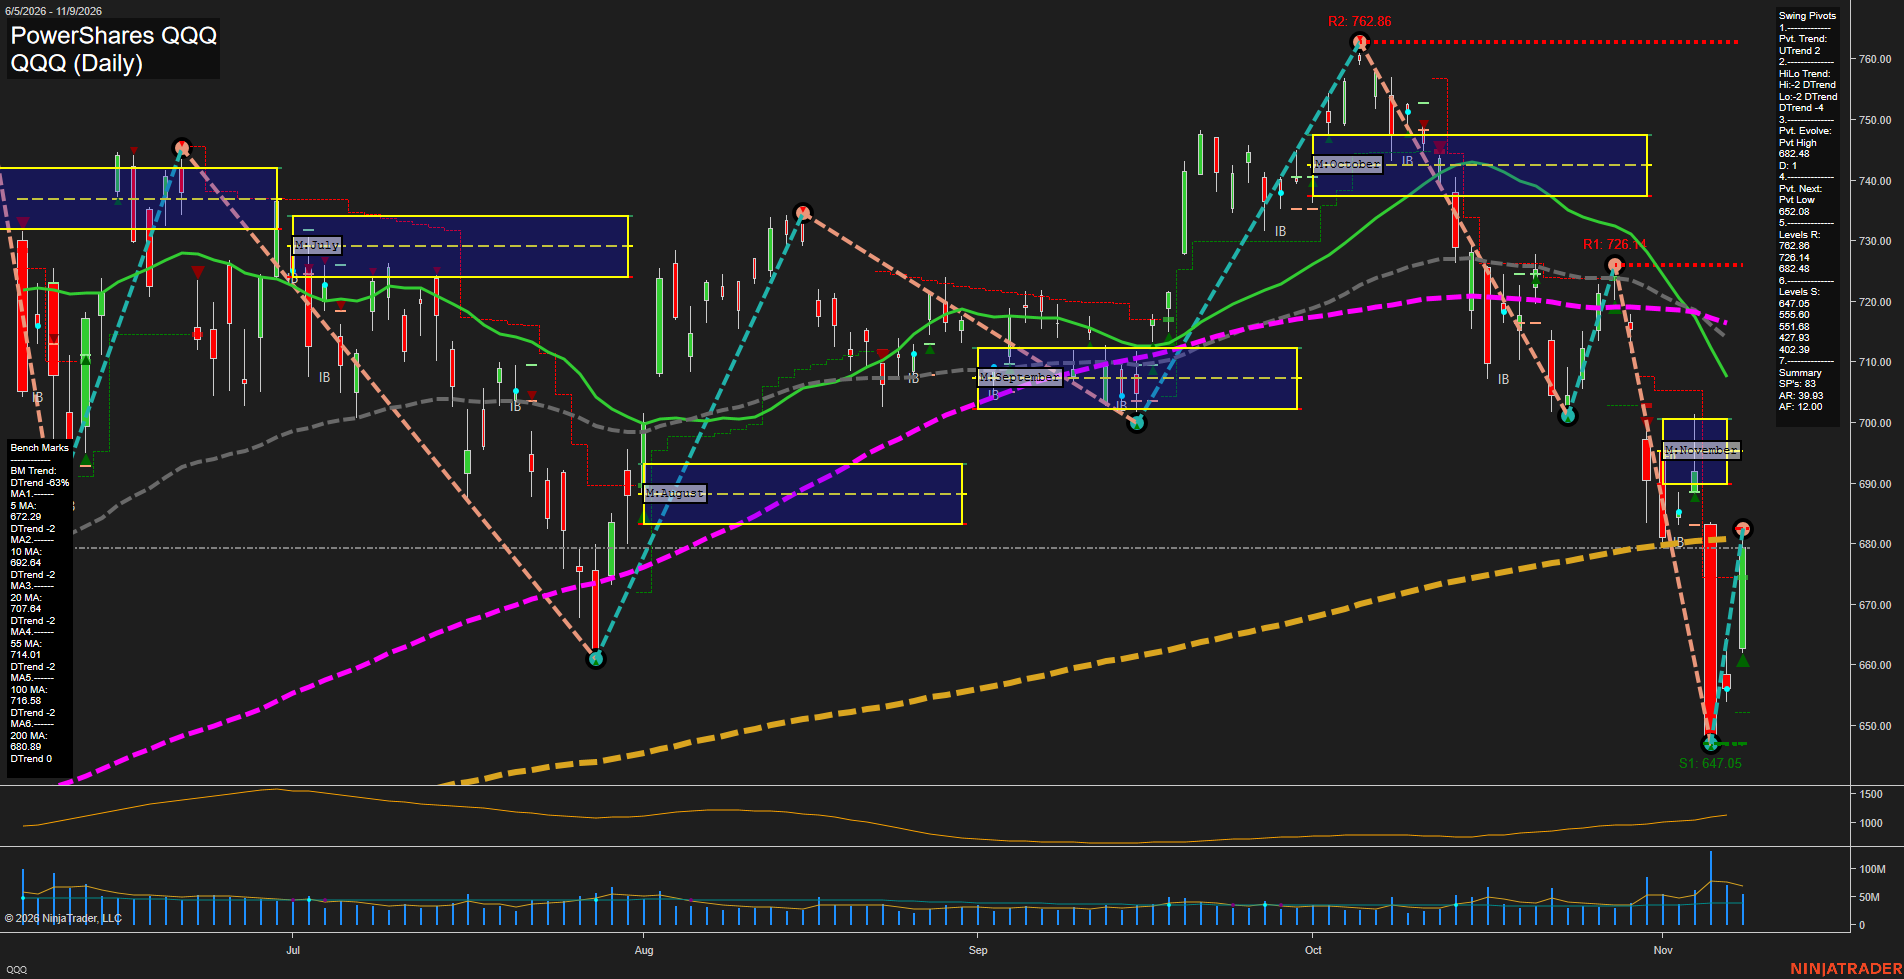
Overall Rating
- Short-Term: Bearish
- Intermediate-Term: Bearish
- Long-Term: Neutral.
Key Insights Summary
QQQ is exhibiting a high-volatility futures-style swing environment following a sharp washout into the 647.05 pivot-support area and a fast rebound toward 682.48. The short-term pivot designation has turned upward, but the broader HiLo structure remains in a downtrend, characterizing the bounce as a countertrend recovery within an intermediate bearish sequence of lower highs. Price remains below the declining 10-, 20-, 55-, and 100-day benchmarks, while the 200-day average near 680.89 is acting as the principal long-term balance reference. The 682.48 pivot is the immediate overhead decision level, with 726.14 the next major resistance; 647.05 remains the defining downside swing support. Elevated ATR and expanded volume reflect a repricing phase with wide daily ranges, rapid retracements, and unstable directional control.
View charts on: AlphaWebTrader HTF Charts
NQ Daily View
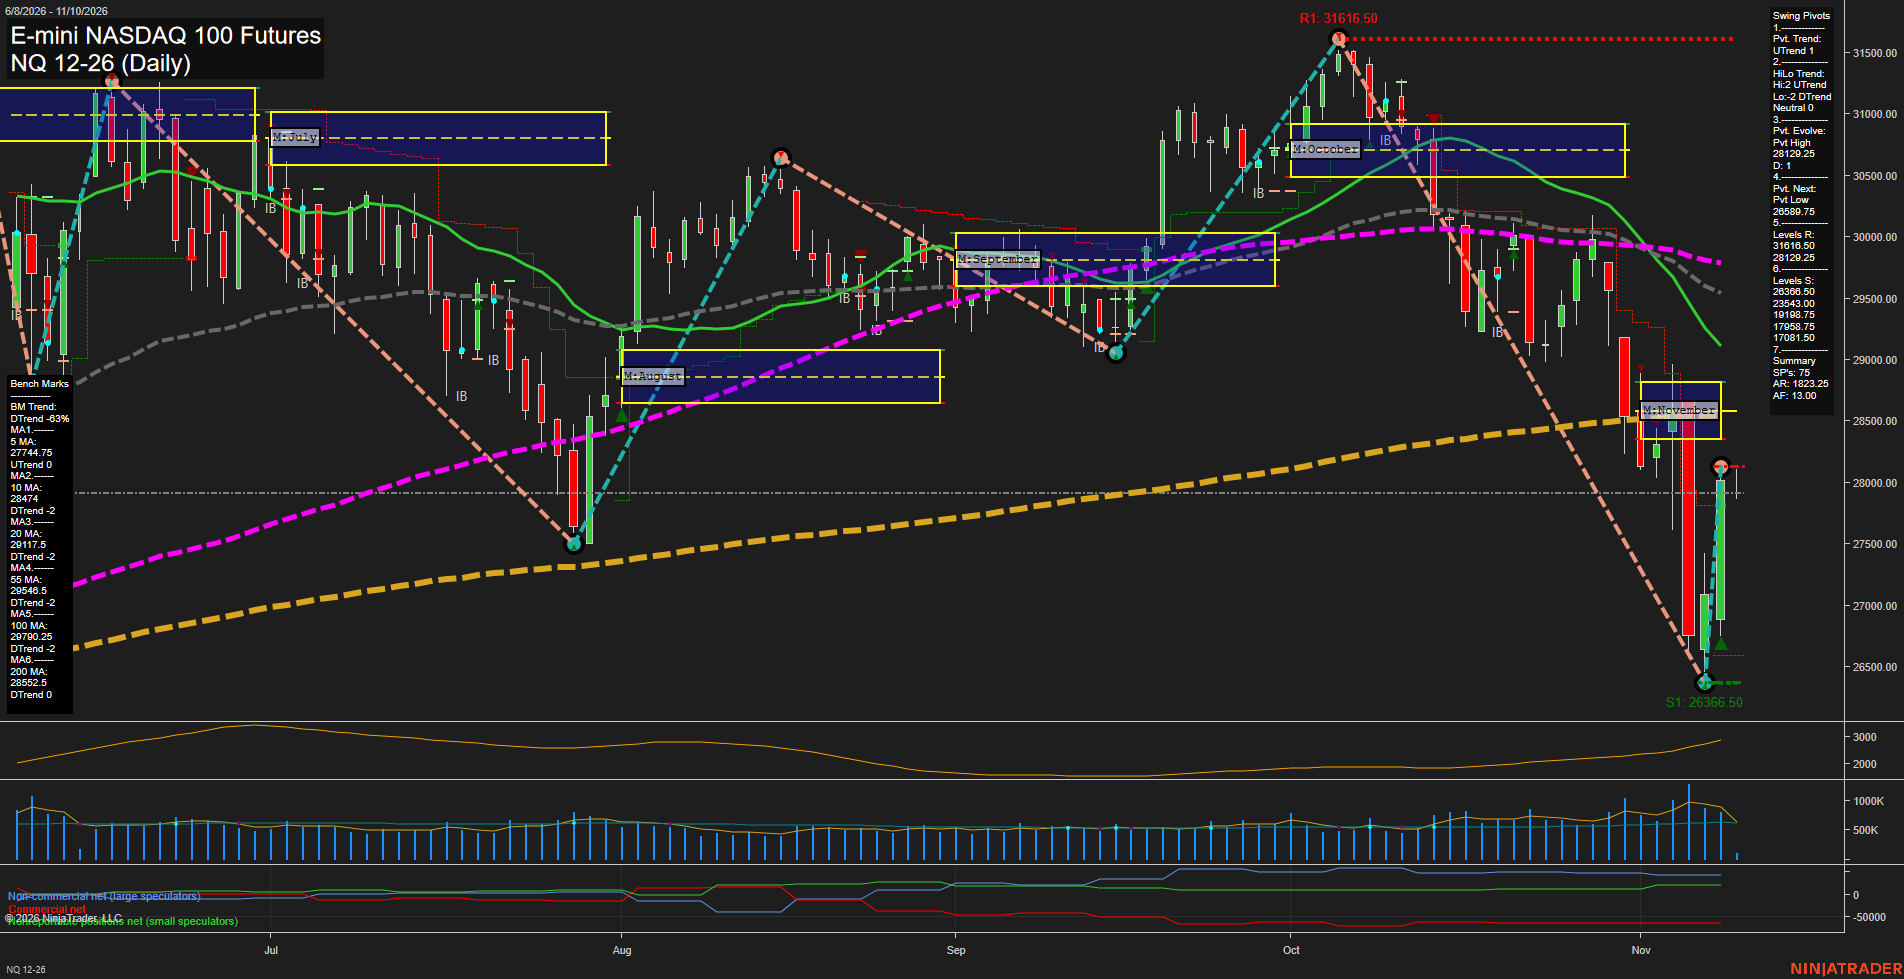
Overall Rating
- Short-Term: Neutral
- Intermediate-Term: Bearish
- Long-Term: Neutral.
Key Insights Summary
The daily structure shows a high-volatility V-recovery from the 26366.50 swing-low area, with large recent bars and fast upside momentum restoring the short-term pivot trend to UTrend. Price is above the weekly F0% reference and the rising 5-day benchmark, but remains below the declining 10-, 20-, 55-, and 100-day averages, leaving the rebound within a broader intermediate-term corrective structure. The 28129.25 pivot-high area and the 28552.50 200-day benchmark form nearby overhead technical references, while 26839.75 and 26366.50 remain the principal swing-support references. Monthly positioning remains below F0% and confirms a downtrend on the intermediate horizon, whereas the yearly grid remains positive and reflects an intact longer-cycle structure despite the current retracement.
View charts on: AlphaWebTrader HTF Charts
USO Daily View
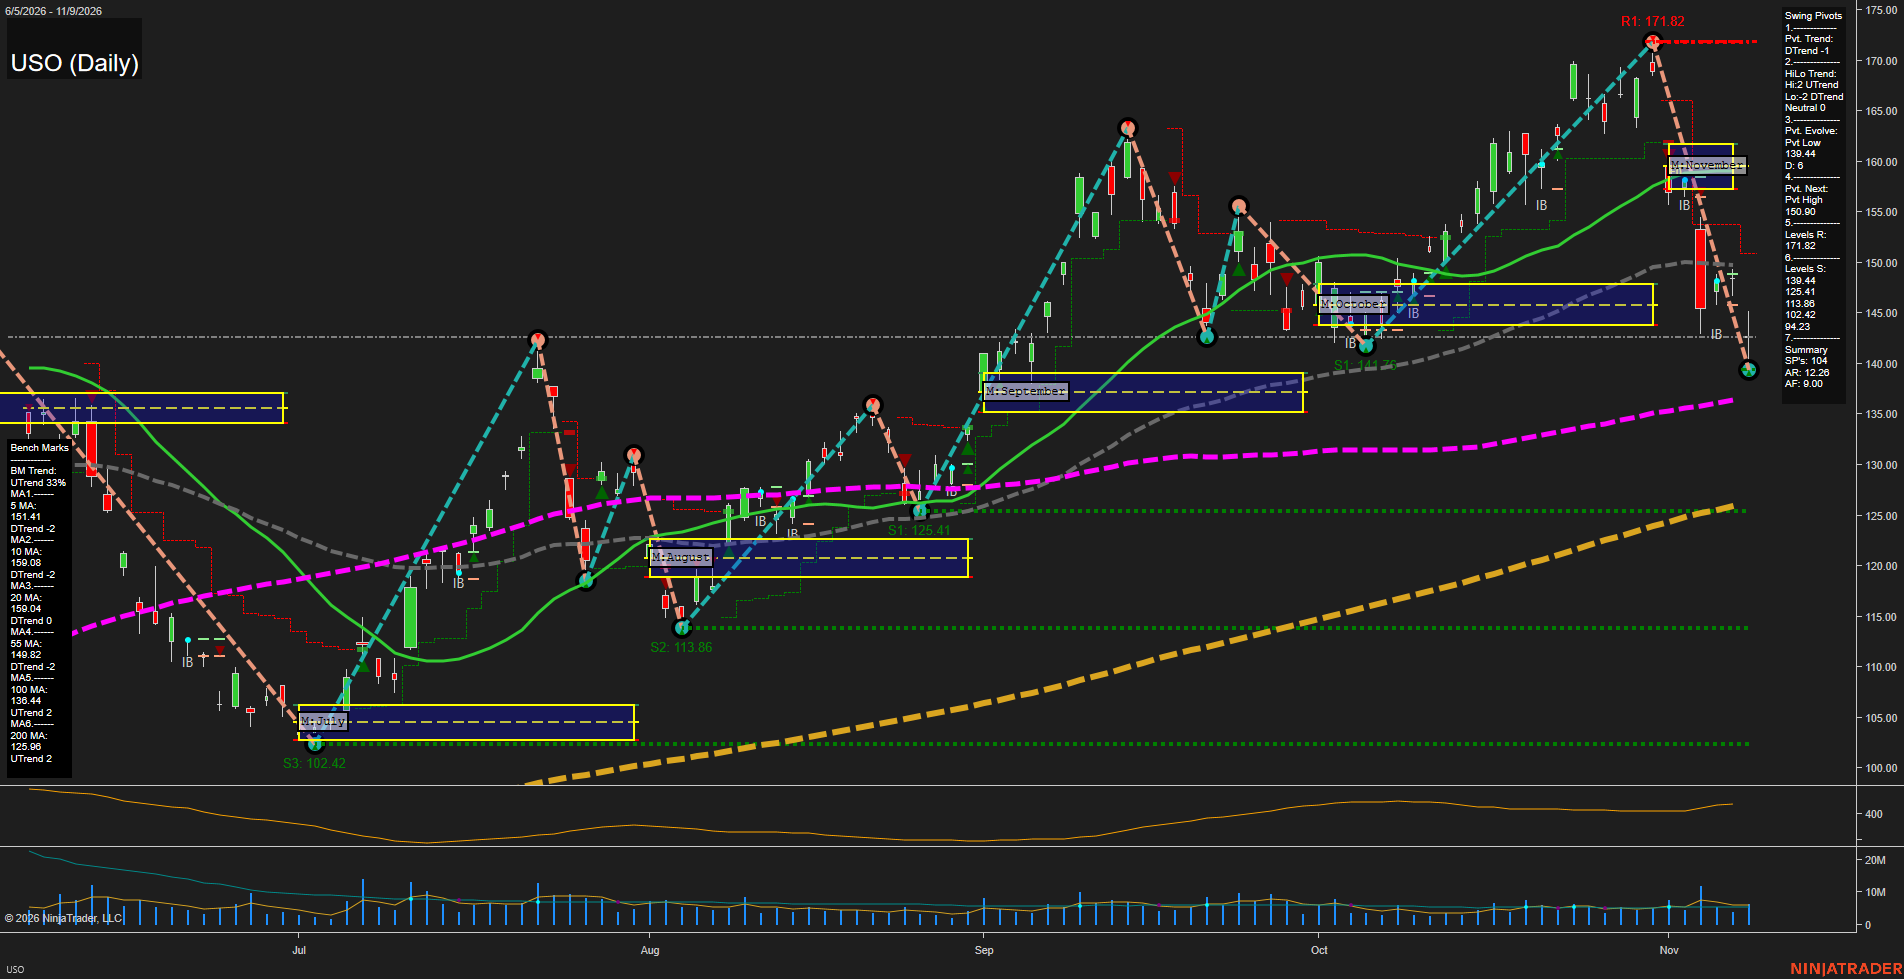
Overall Rating
- Short-Term: Bearish
- Intermediate-Term: Bearish
- Long-Term: Bullish.
Key Insights Summary
USO is in a fast, high-volatility corrective swing after rejecting from the 171.82 pivot high. The short-term pivot structure is bearish, with price below the 5, 10, 20, and marginally below the 55-day benchmarks. The rebound from 139.44 has produced a sharp countertrend bounce, but 150.90 is the defined pivot-reversal threshold and the clustered 151.41 to 159.08 moving-average zone remains overhead. From a futures swing perspective, the larger structure remains constructive because price is still above rising 100-day and 200-day benchmarks; however, the current daily cycle is a retracement phase within that broader long-term advance.
View charts on: AlphaWebTrader HTF Charts
CL Daily View
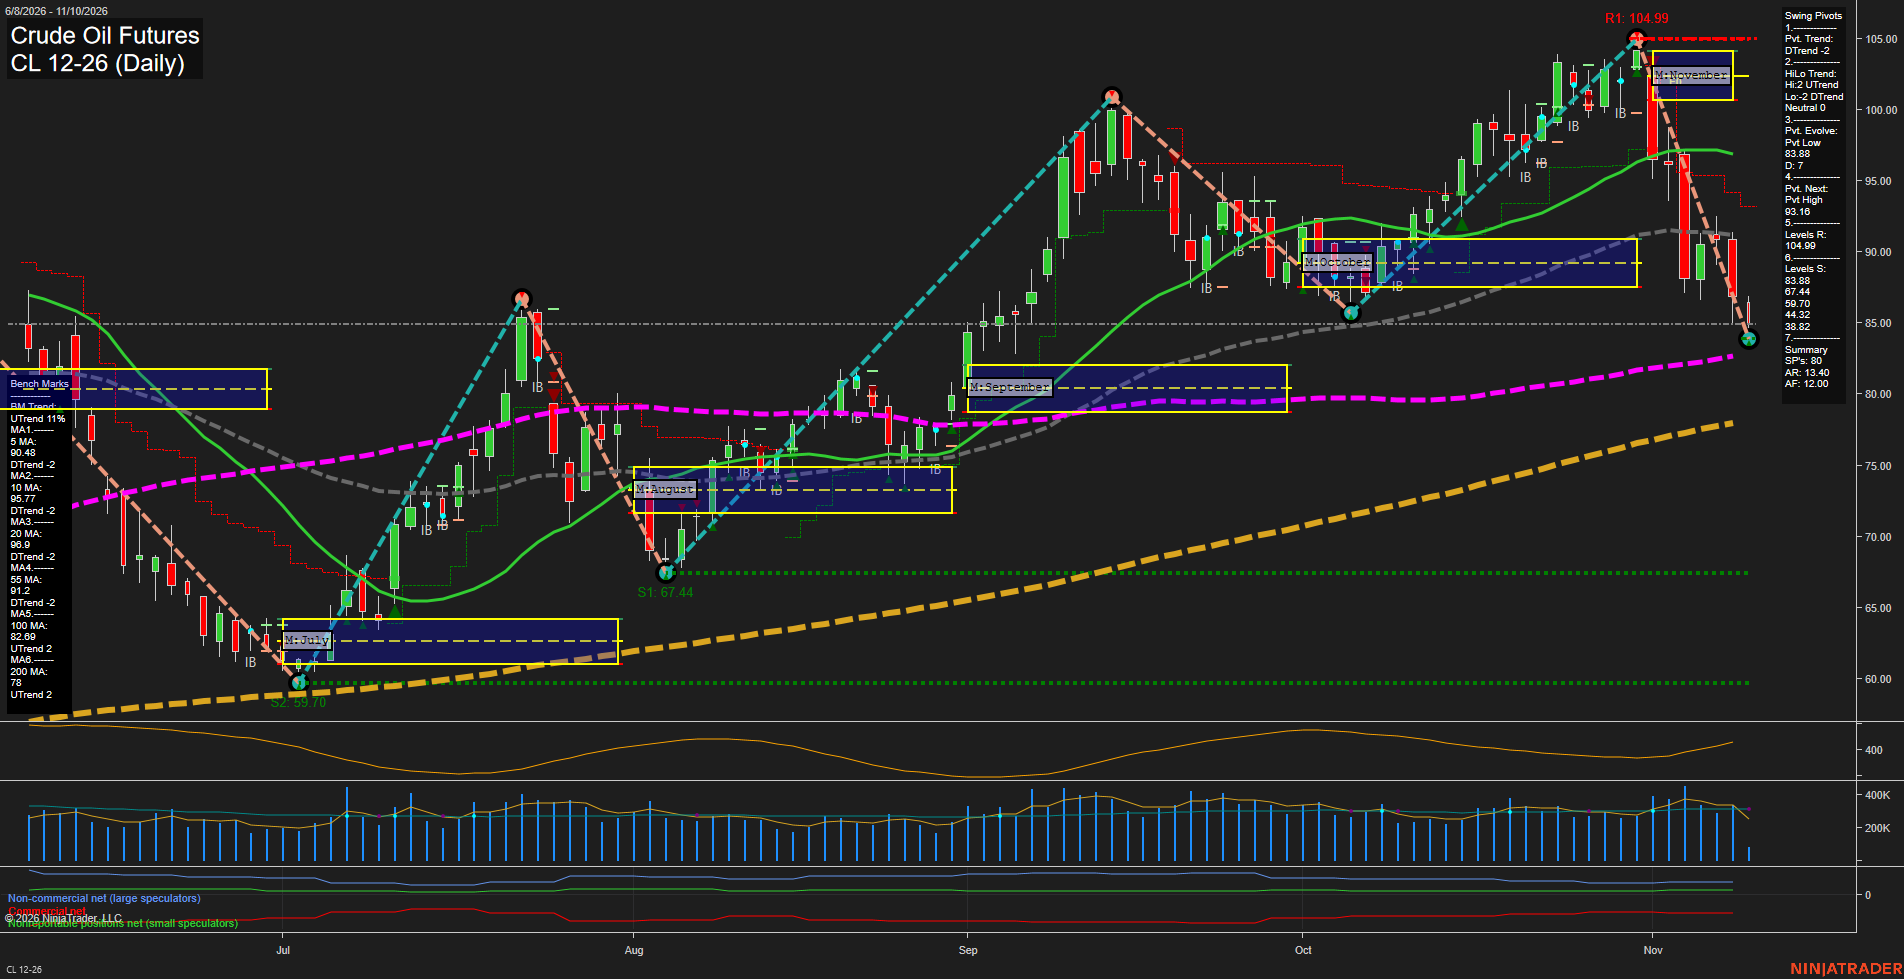
Overall Rating
- Short-Term: Bearish
- Intermediate-Term: Bearish
- Long-Term: Bullish.
Key Insights Summary
CL has shifted into a fast downside swing following rejection from the 104.99 pivot high. Price is below the weekly and monthly F0%/NTZ structures and below all short- and intermediate-term benchmarks, confirming broad bearish alignment. The 83.88 pivot-low area is the immediate swing reference, while 93.16 defines the reversal level required for a new short-term pivot high. Despite the sharp selloff, the annual grid and rising 100- and 200-day benchmarks preserve a constructive long-term structure; the current decline is a major countertrend retracement within that longer-term uptrend.
View charts on: AlphaWebTrader HTF Charts
GLD Daily View
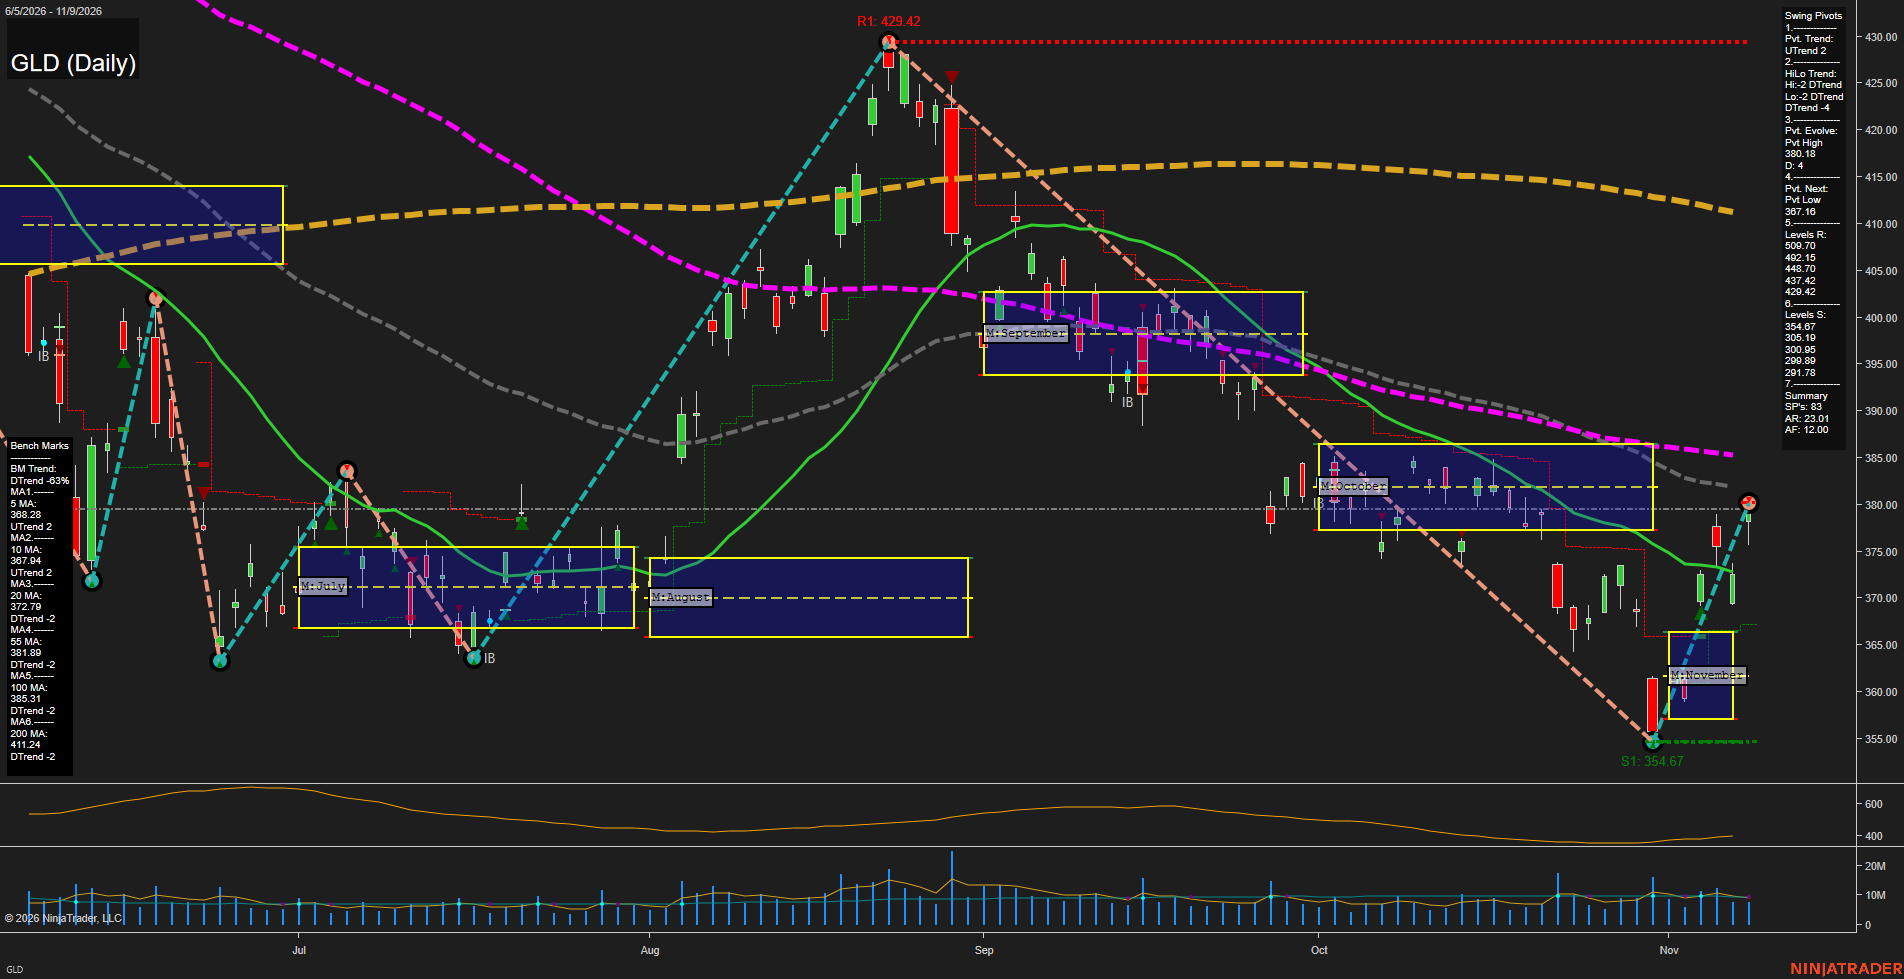
Overall Rating
- Short-Term: Bullish
- Intermediate-Term: Bearish
- Long-Term: Bearish.
Key Insights Summary
GLD shows a fast short-term rebound from the 354.67 swing low, with price reclaiming the 5-, 10-, and 20-day benchmarks and the November NTZ upper area. From a futures swing-trader perspective, this is a countertrend recovery inside a broader intermediate and long-term decline: the 55-, 100-, and 200-day averages remain downward sloping and overhead. The current 380.18 pivot high is the immediate decision area, while 367.16 is the reversal level for the developing short-term upswing. The recovery has a sharp V-shaped character and elevated ATR, whereas the larger structure still contains lower highs from the August peak and a declining major-trend backdrop.
View charts on: AlphaWebTrader HTF Charts
GC Daily View
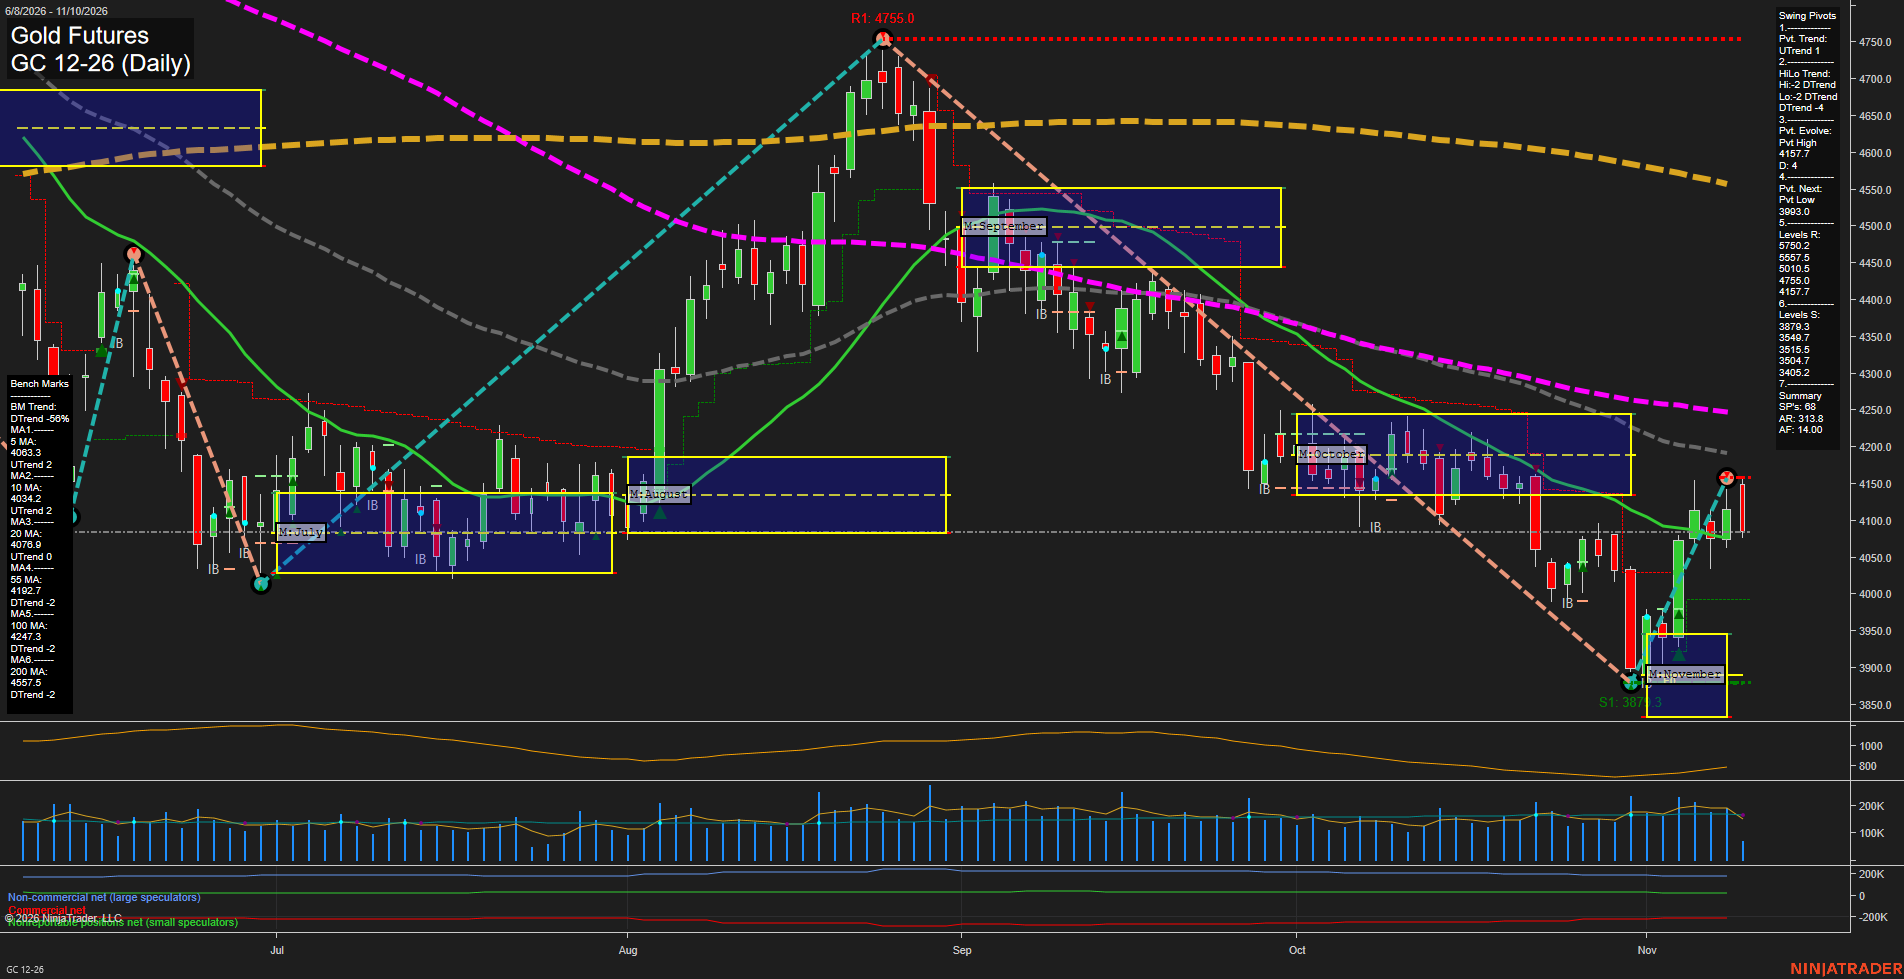
Overall Rating
- Short-Term: Bullish
- Intermediate-Term: Neutral
- Long-Term: Bearish.
Key Insights Summary
Price is holding above the rising 5-, 10-, and 20-day benchmarks following the sharp November rebound from the 3879.3 swing-low area, maintaining a short-term recovery structure. The latest rejection from 4157.7 marks the active pivot-high resistance and leaves the broader intermediate swing structure in a DTrend while price remains below the declining 55-, 100-, and 200-day averages. The November MSFG remains positive above its F0% area, but the yearly grid remains negative, defining the advance as a countertrend recovery within a weaker long-term structure. Medium daily bars and elevated ATR reflect active volatility, with 4157.7 as the nearby ceiling and 3903.0 to 3879.3 as the principal swing support zone.
View charts on: AlphaWebTrader HTF Charts
ZB Daily View
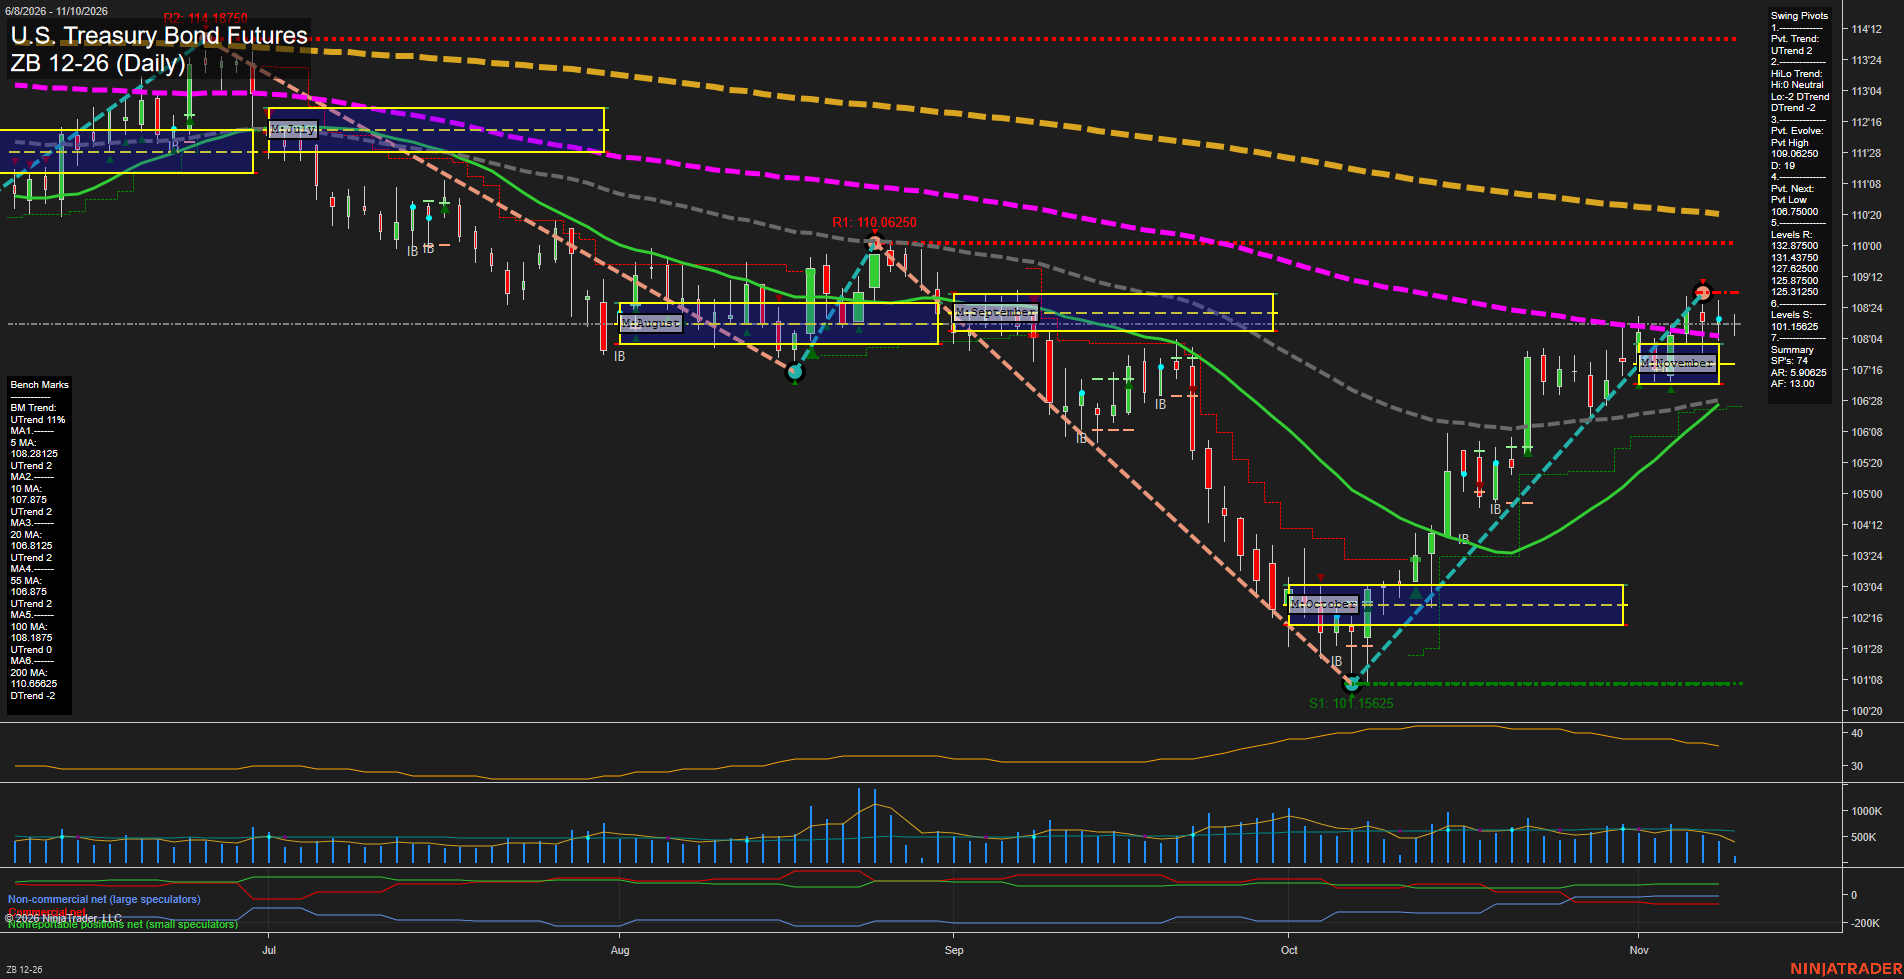
Overall Rating
- Short-Term: Bullish
- Intermediate-Term: Bullish
- Long-Term: Bearish.
Key Insights Summary
Price has staged a sharp V-recovery from the October 101.15625 pivot low, establishing higher lows and recovering above the 5-day, 10-day, 20-day, and 100-day benchmarks. The short-term pivot structure remains positive, although recent small daily bars beneath the 109.06250 pivot high reflect slowing momentum and consolidation following the rally. Monthly structure remains constructive above the November F0% area, while the yearly grid and declining 200-day benchmark retain a broader bearish backdrop. The chart depicts a countertrend recovery within the longer-term downtrend, with 108.87500 and 109.06250 defining nearby overhead technical pressure.
View charts on: AlphaWebTrader HTF Charts
Sentiment Summary: Negative coverage led at 39% versus 26% positive, centered on Nvidia’s CEO investigation, governance and China-related scrutiny, alongside AI-spending concerns; Nvidia fell 4.27% on November 9 despite a broad rally. October CPI remained due November 10 after Fed Governor Waller backed a December quarter-point hike and left a half-point increase conditional on inflation. The main counterweight was November 9’s broad rebound—10 of 11 S&P 500 sectors advanced and semiconductors gained 6.85%—while lower oil supported sentiment and Tuesday futures showed Dow and S&P gains against Nasdaq weakness.
Conclusion: The immediate index-futures context is divergent performance ahead of unreleased inflation data.