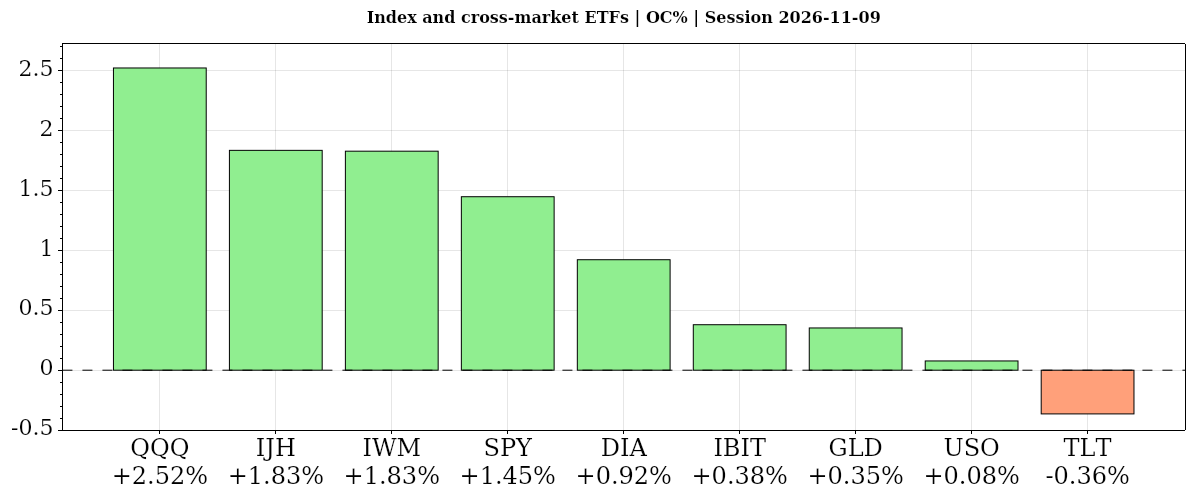
Monday’s Fed speeches and Treasury auctions accompanied stock and tech gains from the open; Nasdaq trends stayed bearish ahead of tomorrow’s CPI.
Fundamentals: Monday’s agenda featured Fed speeches, bill auctions at 11:30 a.m. ET and a $58 billion three-year note auction at 1 p.m. ET. Stocks and tech closed higher, alongside oil and gold, while bonds fell. Nvidia dropped about 5.5% amid a leadership investigation, contrasting with Alphabet’s advance and broader equity participation. Tomorrow’s October CPI report, Tuesday, November 10, is the next major macro catalyst as scrutiny of AI spending persists.
Technicals: Stocks rebounded in Monday’s completed session, with the Nasdaq-100 ETF rising 2.52% from the open and the S&P 500 ETF gaining 1.45%. Nasdaq near- and medium-term trends remained bearish. Nvidia rose 3.24% from its open but finished 4.27% below its prior close. Oil edged up 0.08% from the open while losing 3.87% versus its prior close. Gold gained 0.35% from the open; far-term Treasury bonds fell 0.36%, yet closed marginally above their prior close.
After Market Close daily snapshot: market news summary and sentiment, major ETFs, Magnificent 7 analysis, Indices Futures Higher Time Frame Analysis, and E-mini S&P500, Nasdaq 100, NYMEX Crude, Gold Futures Daily Chart analysis.
As of: November 9, 2026 06:15 CT
Earnings Radar Day Recap
Monitoring for earnings releases by the Magnificent 7, AI-tech-related firms, and major financial institutions.
| Date/Day | Impact | Company / Symbol | Time | EPS | Revenue | ||||
|---|---|---|---|---|---|---|---|---|---|
| 2026-11-09 – Monday | Medium | MARA Holdings (MARA) | After close |
|
|
For full details visit: Yahoo Earnings Calendar
EcoNews Radar U.S. Events Day Recap
| Date | Impact | Event, Prev, Forecast, Actual | Info |
|---|---|---|---|
| 2026-11-09 Monday 08:40 | Medium | Fed's Bowman speech Prev: — Forecast: — Actual: — | Remarks can clarify views on inflation, employment and monetary policy. Index futures traders monitor them for signals about the interest-rate outlook and equity valuations. |
| 2026-11-09 Monday 10:00 | Medium | Fed's Goolsbee speech Prev: — Forecast: — Actual: — | Commentary can reveal how a policymaker assesses economic conditions and policy trade-offs. Traders watch for implications for rate expectations and broader risk sentiment. |
| 2026-11-09 Monday 11:30 | Medium | 13-Week Bill Auction · $95B Prev: 4.04% Forecast: — Actual: 4.06% | The auction establishes short-term government borrowing costs and gauges demand for Treasury bills. Traders monitor funding conditions and the relationship between bill yields and policy-rate expectations. |
| 2026-11-09 Monday 11:30 | Medium | 26-Week Bill Auction · $82B Prev: 4.15% Forecast: — Actual: 4.145% | The auction gauges demand for government debt and borrowing costs over a longer bill horizon. Traders watch for signals about cash allocation and expected monetary policy. |
| 2026-11-09 Monday 12:15 | Medium | Fed's Barkin speech Prev: — Forecast: — Actual: — | Remarks provide insight into assessments of growth, inflation and the policy outlook. Traders monitor potential shifts in rate expectations that can influence equity discount rates. |
| 2026-11-09 Monday 13:00 | High | 3-Year Note Auction · $58B Prev: 4.932% Forecast: — Actual: 4.627% | The auction sets borrowing costs for intermediate-maturity government debt and tests investor demand. Traders watch the yield and bidding strength for implications for Treasury rates and equity valuations. |
| 2026-11-09 Monday 13:00 | Medium | 6-Week Bill Auction · $100B Prev: — Forecast: — Actual: — | The auction measures demand and borrowing costs at the shortest end of Treasury issuance. Traders monitor it for insight into cash-market conditions and near-term funding demand. |
Summary: The calendar centers on U.S. monetary-policy communication and Treasury financing rather than broad economic data releases.
Market News Summary:
Nvidia’s leadership investigation and AI spending concerns dominate technology headlines ahead of Tuesday’s inflation report.
Primary Drivers & Risks:
- Primary Driver: Nvidia weakness and AI investment scrutiny
- Primary Risk: CPI release and Nvidia leadership uncertainty
Tone:
Cautious on technology, with broader earnings strength providing a counterweight.
Data, Market and System
Geopolitical:
- Nvidia’s board, assisted by outside counsel, is investigating Huang’s relationship amid allegations that foreign intelligence targeted him.
- President Trump continued to defend Huang as reports of alleged Chinese intelligence involvement brought their relationship under scrutiny.
Fed / Financials:
- A heavy lineup of Federal Reserve speakers accompanies the October CPI release on Tuesday, November 10.
Macro / Other:
- Last week’s U.S. economic data exceeded expectations following Democrats’ congressional sweep.
- Ferguson beat earnings estimates, placed full-year sales growth at the top of its previous guidance, and raised its capital spending forecast to $375 million–$425 million.
Conclusion:
Nvidia’s decline and leadership investigation are the central company-specific pressures in the supplied coverage. Scrutiny of AI spending returns adds to weakness across technology and semiconductor shares.
Tuesday’s CPI release and Federal Reserve appearances form the next scheduled macro catalysts. Broader equity participation, Apple’s earnings beat, and Alphabet’s advance contrast with the pressure on AI-related stocks.
Market News Sentiment
Sentiment Bias shows the balance of positive and negative news coverage sampled from 2026-11-08 16:00 to 2026-11-09 15:49 ET, covering stocks, energy and gold.
▼ Market news
- Bias
- ▼ -11.74%
- Articles
- 230
- Positive
- ▲ 28.70%
- Neutral
- — 30.87%
- Negative
- ▼ 40.43%
▲ GLD / Gold
- Bias
- ▲ +90.00%
- Articles
- 10
- Positive
- ▲ 90.00%
- Neutral
- — 10.00%
- Negative
- — 0.00%
Sentiment Summary: Gold coverage was 90% positive and 10% neutral, reflecting Monday, November 9 gains reported alongside a softer dollar, falling crude and renewed hopes for a U.S.-Iran diplomatic resolution. The advance extended last week’s post-election rebound, while central-bank buying provided additional supportive context. The main counterweight was elevated real yields and Fed rate expectations, with analysts also flagging renewed oil-price pressure as a risk and gold facing resistance near $4,148–$4,150 ahead of Tuesday, November 10’s U.S. CPI report.
Conclusion: The immediate cross-market context centers on inflation and rates, rather than an unqualified positive signal from gold.
▼ USO / Oil
- Bias
- ▼ -5.26%
- Articles
- 19
- Positive
- ▲ 31.58%
- Neutral
- — 31.58%
- Negative
- ▼ 36.84%
Sentiment Summary: Oil coverage was mildly negative (37% negative, 32% positive, 32% neutral), as Sunday’s conditional comments from Trump downplaying fresh Iran strikes and recovering supply pressured crude into Monday, with oil falling more than 3%. Lower energy prices supported Monday’s equity rebound, with the Dow leading, while October OPEC output recovered to 90% of its pre-war rate. Tight U.S. fuel inventories, attacks near energy infrastructure and Rubio’s warning that Iran talks were not close to a breakthrough counterbalanced easing supply concerns.
Conclusion: Tuesday’s U.S. CPI release remains the key upcoming inflation catalyst after oil’s decline supported broader market sentiment.
Glossary: Sentiment Bias = (positive articles − negative articles) ÷ total articles × 100. It ranges from −100% negative to +100% positive. A reading near zero indicates little directional bias. Neutral articles reduce the score’s strength. ▲ positive; ▼ negative; — balanced. These readings describe news coverage, not market-price direction.
Market Technical Analysis
Analysis of VIX volatility, the completed session in major ETFs and mega-cap tech stocks, and futures snapshots and higher-time-frame analysis.
VIX — Market Fear Gauge Daily
| Level | Open | High | MaxVix | Low | MinVix | DNC% | DOC% | VR | MaxVR | MinVR |
|---|---|---|---|---|---|---|---|---|---|---|
| 19.89 | 23.37 | 23.37 | 28.36 | 19.64 | 16.21 | -14.27% | -14.89% | 6.03 | 56.57 | -0.20 |
VIX fell 14.89% from the session's opening level. VIX fell 14.27% versus the previous session close. Expected volatility eased from the period open. VIX is 30.3% up the recent 15-session range (16.21–28.36), in the 30–40% band.
VR: ATN Volatility Ratio (VR): 6.03 – Stocks rose while expected volatility eased. VR is in the lower part of its preceding 15-session VR range (-0.20 to 56.57), in the 10–20% band. VR fell 50.54 points from the previous session, a large shift relative to that range.
Range lookback: preceding 15 completed sessions.
Major ETFs and Mega Cap Tech Stocks
- Nvidia shares fell about 5.5% on Monday, extending their decline over the past month to more than 20% as its board investigated allegations involving CEO Jensen Huang.
- Nvidia has no publicly known succession plan, and its earnings release is scheduled for November 17.
- Last Thursday, the S&P 500 fell more than 4%, QQQ declined 6.5%, and SMH dropped 11% amid technology weakness.
- The VIX rose 11.5 points to a high of 28 last Thursday, while implied volatility across most other asset classes declined over the week.
- Alphabet shares rose Monday after Google introduced two additions to its eighth-generation AI chip portfolio.
- Meta’s shares slid following earnings that intensified concerns about AI spending, with free cash flow turning negative last quarter.
- Apple topped earnings estimates with revenue of $114.48 billion and earnings per share of $2.10, supported by double-digit hardware and services growth.
- Separate reporting described equity gains broadening beyond Big Tech as investors scrutinized returns on AI investment.
ETF, Mag7, and Cross-Market ETF Insights
Overall Tone
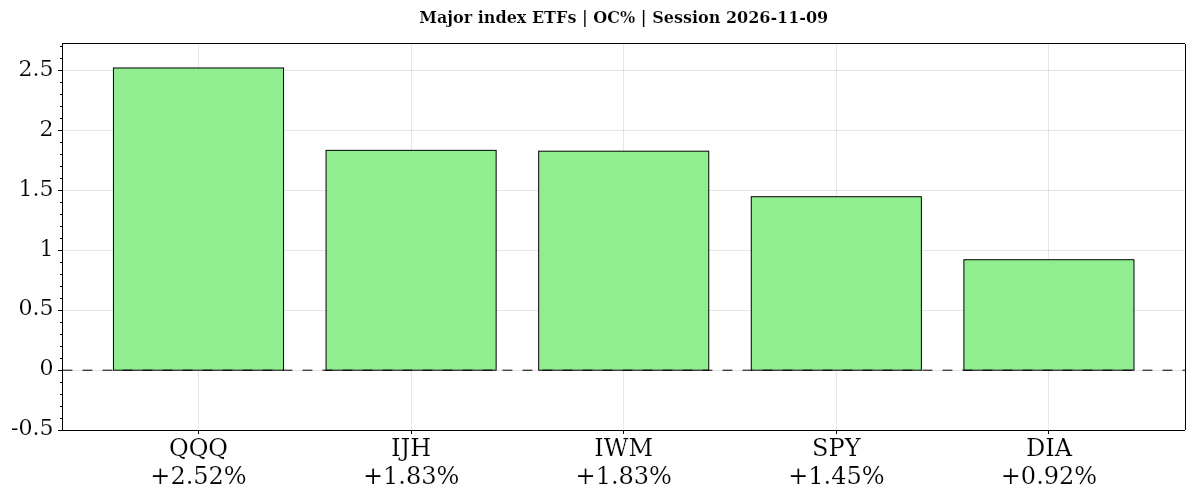
On 2026-11-09, broad gains from the open signalled a risk-on daily equity tone, although mega-cap participation was uneven.
| Instrument | Bias | Date | DNC% | DOC% | O | H | L | C | VWAP | Vol |
|---|---|---|---|---|---|---|---|---|---|---|
| ▲ QQQ | ▲ ▲ ▲ | 2026-11-09 | ▲ +3.54% | ▲ +2.52% | 662.64 | 682.48 | 662.02 | 679.35 | ▲ 676.17 | 55,071,712 |
| ▲ IJH | ▲ ▲ ▲ | 2026-11-09 | ▲ +3.16% | ▲ +1.83% | 73.05 | 74.74 | 72.96 | 74.39 | ▲ 74.21 | 13,899,036 |
| ▲ IWM | ▲ ▲ ▲ | 2026-11-09 | ▲ +3.23% | ▲ +1.83% | 277.44 | 283.79 | 276.81 | 282.51 | ▲ 281.37 | 28,270,436 |
| ▲ SPY | ▲ ▲ ▲ | 2026-11-09 | ▲ +2.37% | ▲ +1.45% | 741.95 | 755.42 | 741.02 | 752.69 | ▲ 751.20 | 48,779,293 |
| ▲ DIA | ▲ ▲ ▲ | 2026-11-09 | ▲ +2.17% | ▲ +0.92% | 518.55 | 525.17 | 517.24 | 523.33 | ▲ 522.07 | 3,411,227 |
| AVG/Sum | — | — | +2.89% | +1.71% | — | — | — | — | — | 149,431,704 |
Index ETFs
Positive confluence: average DOC% +1.71% from the open, DNC% +2.89% versus the prior close. All five index ETFs gained on both comparisons; QQQ led both, followed by small- and mid-caps, while DIA lagged. QQQ’s near- and intermediate-term downtrends persisted despite its advance; small- and mid-cap gains had above-average volume.
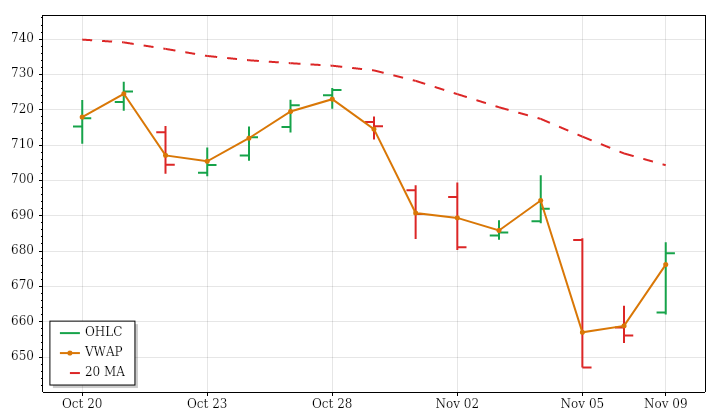
QQQ · D:2026-11-09 NC% ▲ +3.54% OC% ▲ +2.52%
QQQ – Nasdaq 100 Technicals Summary
QQQ’s completed November 9 daily session rose 3.54% from the prior close to 679.35, including a 2.52% gain from the open. The upward opening gap remained unfilled. A higher high and higher low, a breach of the preceding inside bar’s high and a finish above the previous day’s high and VWAP characterized a strong completed-session rebound.
The rally nevertheless stopped short of the falling near-term average, while price remains below its declining intermediate-term average. It also sits below a rising far-term average, leaving that horizon mixed. These positions contrast with the day’s strength and remain consistent with the downward prior 15-session price trend. Range reached about 169% of average with modestly above-average volume, matching expanding ranges and increasing participation across the lookback. PSAR and ATR-median remain bearish. A next-session high above 691.6121 would conditionally reverse PSAR upward.
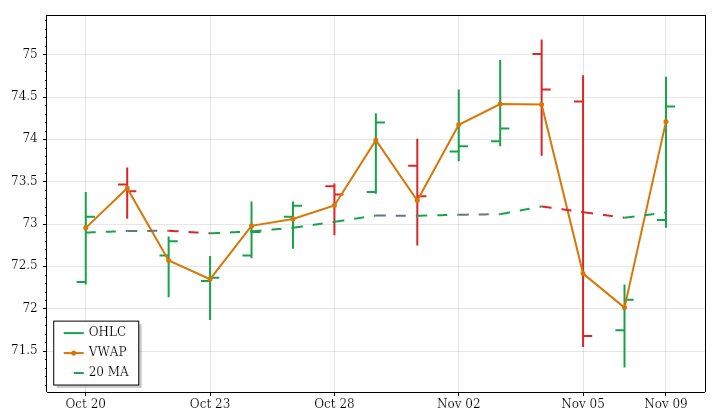
IJH · D:2026-11-09 NC% ▲ +3.16% OC% ▲ +1.83%
IJH – Mid Cap Technicals Summary
IJH’s completed November 9 daily session rose 3.16% from the prior close to 74.39, including a 1.83% advance from the open. Its upward opening gap remained unfilled, and a higher high and higher low led to a close above the previous day’s high and session VWAP. The close also reached the first upper volatility-band zone, reflecting the strength of the completed move.
Near- and far-term averages are rising beneath price, but the intermediate-term average is still falling, preventing full upward alignment. The prior 15-session price trend is slightly positive but highly choppy. Both the latest range and volume were roughly 176% of average, reinforcing the broader trends of expanding ranges and increasing participation. ATR-median remains positive, whereas PSAR remains bearish despite the rally. A next-session high above 74.74 would conditionally reverse PSAR upward rather than represent an already confirmed change.
IWM · D:2026-11-09 NC% ▲ +3.23% OC% ▲ +1.83%
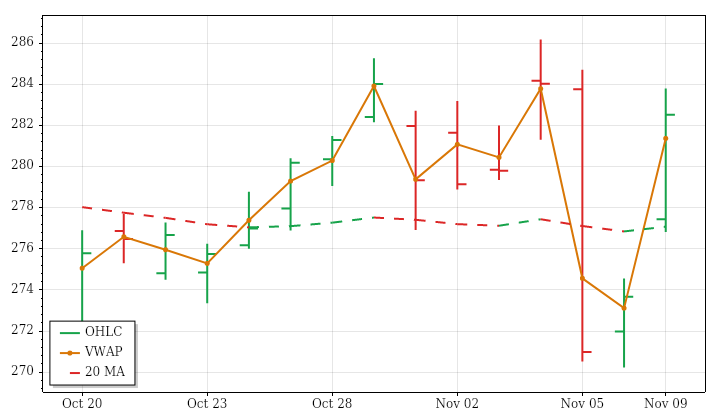
IWM – Small Cap Technicals Summary
IWM’s completed November 9 daily session advanced 3.23% from the prior close to 282.51 and gained 1.83% from the open. The upward opening gap stayed unfilled. Trading crossed both sides of the open, but a higher high and higher low culminated in a close above the previous day’s high and VWAP, establishing a strong daily rebound.
That strength aligns with the rising near-term average and slightly positive prior 15-session price trend. It does not resolve the wider conflict: price is above a falling intermediate-term average but remains below a marginally falling far-term average. The latest range expanded to about 165% of average, with above-average volume, consistent with expanding ranges and increasing participation across the lookback. PSAR remained bearish and ATR-median crossed bearish. A next-session high above 283.8587 would conditionally reverse PSAR upward; the broader structure is not yet uniformly bullish.
SPY · D:2026-11-09 NC% ▲ +2.37% OC% ▲ +1.45%
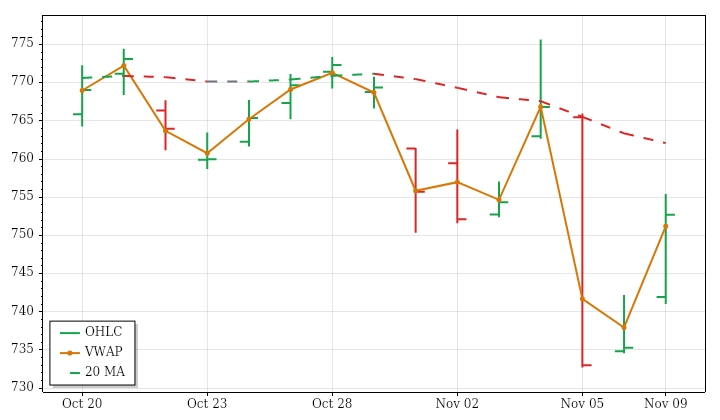
SPY – S&P 500 Technicals Summary
SPY’s completed November 9 daily session closed at 752.69, up 2.37% from the prior close and 1.45% from the open. Its upward opening gap remained unfilled. Price made a higher high and higher low, breached the preceding inside bar’s high and finished above the previous day’s high and VWAP, giving the completed session a positive directional result.
The close only slightly exceeded the still-falling near-term average, leaving that horizon mixed. Price remains below a declining intermediate-term average but above a rising far-term average, so the rebound has not produced uniform trend alignment. The prior 15-session price trend remains downward. The latest range was about 163% of average, but volume was essentially average despite increasing lookback participation. PSAR and ATR-median remain bearish. A next-session high above 771.4543 would conditionally reverse PSAR upward rather than confirm a reversal already in place.
S&P 500 News and Fundamentals
The S&P 500 rallied at the opening of trading on November 9 as buyers returned to technology shares. U.S. stocks added approximately $1 trillion in market value during the opening period.
DIA · D:2026-11-09 NC% ▲ +2.17% OC% ▲ +0.92%
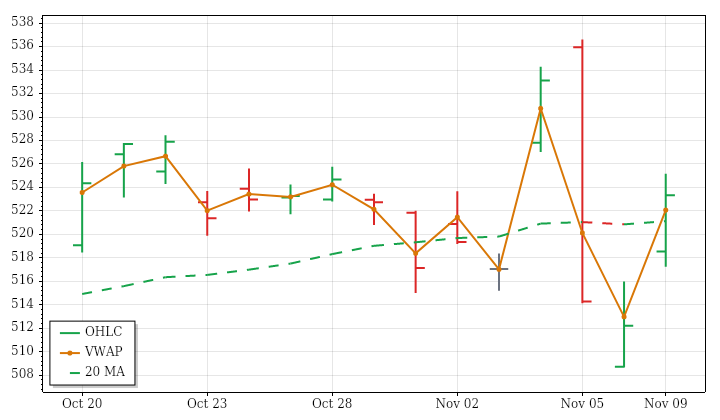
DIA – Dow Jones Technicals Summary
DIA’s completed November 9 daily session closed at 523.33, gaining 2.17% from the prior close and 0.92% from the open. An upward opening gap remained unfilled, and the session produced a higher high, higher low and close above the previous day’s high. The finish above VWAP added a positive intraday element despite trading on both sides of the open.
The advance placed price above a still slightly falling near-term average, while intermediate- and far-term averages remain rising beneath it. This leaves the near term mixed against a positive broader structure and a declining prior 15-session price trend. Range reached about 137% of average, the fourth consecutive large-range bar, but volume was below average despite increasing lookback volume. PSAR remained bearish and ATR-median crossed bearish, conflicting with the session gain. A next-session high above 533.806 would conditionally reverse PSAR upward.
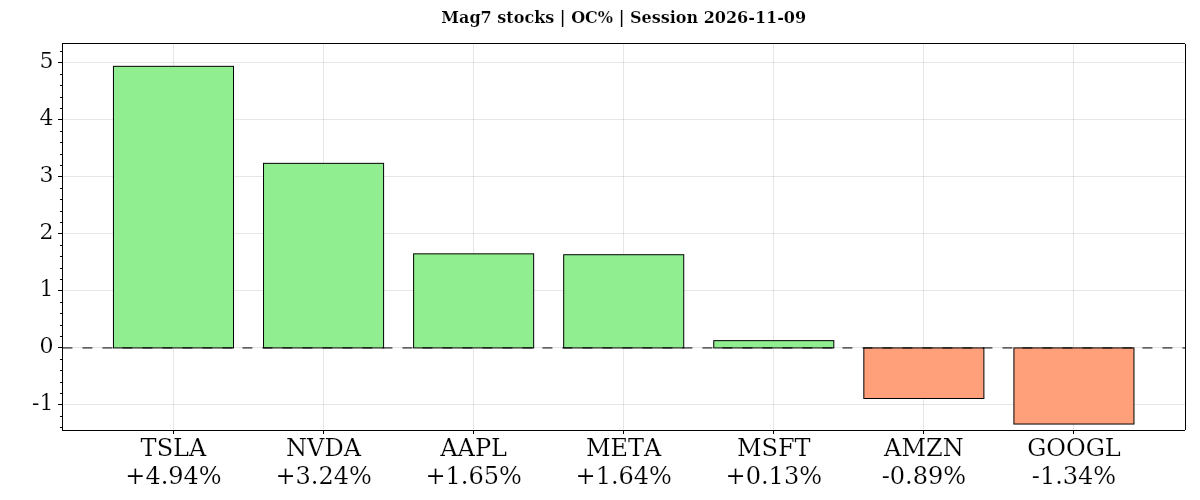
| Instrument | Bias | Date | DNC% | DOC% | O | H | L | C | VWAP | Vol |
|---|---|---|---|---|---|---|---|---|---|---|
| ▲ TSLA | ▲ ▲ ▲ | 2026-11-09 | ▲ +5.54% | ▲ +4.94% | 360.25 | 382.20 | 360.02 | 378.05 | ▲ 377.09 | 36,434,515 |
| ▲ NVDA | ▼ ▲ ▲ | 2026-11-09 | ▼ -4.27% | ▲ +3.24% | 173.06 | 179.92 | 170.24 | 178.67 | ▲ 176.81 | 456,496,884 |
| ▲ AAPL | ▲ ▲ ▲ | 2026-11-09 | ▲ +2.43% | ▲ +1.65% | 345.00 | 352.33 | 344.78 | 350.69 | ▲ 350.31 | 47,126,385 |
| ▲ META | ▲ ▲ ▼ | 2026-11-09 | ▲ +5.12% | ▲ +1.64% | 631.05 | 647.25 | 630.00 | 641.37 | ▼ 641.46 | 18,882,757 |
| ▲ MSFT | ▲ ▲ ▲ | 2026-11-09 | ▲ +2.75% | ▲ +0.13% | 544.49 | 548.28 | 538.70 | 545.18 | ▲ 544.33 | 25,325,616 |
| ▼ AMZN | ▲ ▼ ▼ | 2026-11-09 | ▲ +2.94% | ▼ -0.89% | 269.32 | 275.34 | 266.91 | 266.93 | ▼ 269.56 | 50,580,968 |
| ▼ GOOGL | ▲ ▼ ▼ | 2026-11-09 | ▲ +1.18% | ▼ -1.34% | 292.05 | 296.33 | 288.01 | 288.15 | ▼ 291.27 | 36,328,904 |
| AVG/Sum | — | — | +2.24% | +1.34% | — | — | — | — | — | 671,176,029 |
Mag7 Stocks
Positive confluence: average DOC% +1.34% from the open, DNC% +2.24% versus the prior close. TSLA led both comparisons; GOOGL lagged from the open, while NVDA fell 4.27% versus the prior close despite gaining 3.24% from the open on exceptional volume. AMZN and GOOGL rose versus the prior close despite open-to-close losses; AAPL’s moving-average uptrends remained aligned.
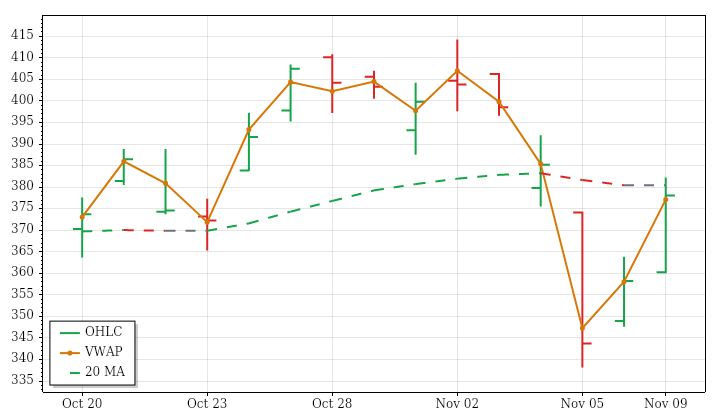
TSLA · D:2026-11-09 NC% ▲ +5.54% OC% ▲ +4.94%
TSLA – Tesla Technicals Summary
TSLA’s completed November 9 daily session advanced 5.54% from the prior close to 378.05, with a 4.94% rise from the open accounting for most of the gain. The small upward opening gap remained unfilled. Price made a higher high and higher low, breached the preceding inside bar’s high and closed above the previous day’s high and VWAP.
The rally left price just below a rising near-term average, above a rising intermediate-term average and above a falling far-term average. That combination remains mixed rather than uniformly upward, consistent with the nearly flat but choppy prior 15-session price trend. The latest range was about 149% of average, marking a fourth consecutive large-range bar, while volume was below average despite increasing lookback participation. PSAR and ATR-median remain bearish. A next-session high above 396.6936 would conditionally reverse PSAR upward.
Tesla News and Fundamentals
Tesla plans to end Cybertruck manufacturing next spring. Elon Musk said the order backlog far exceeds what the company can build before production ends, meaning Tesla will have to return many customer deposits. Separately, Tesla announced an expansion of its robotaxi service to San Antonio, with availability starting at 5 a.m., extending its Texas service footprint as it competes with Waymo.
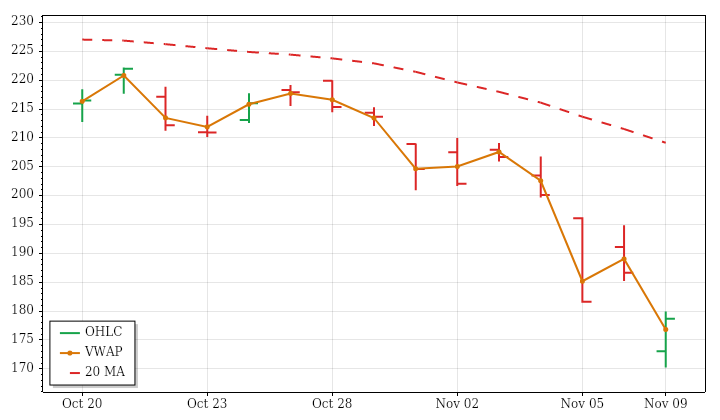
NVDA · D:2026-11-09 NC% ▼ -4.27% OC% ▲ +3.24%
NVDA – Nvidia Technicals Summary
NVDA’s completed November 9 daily session fell 4.27% from the prior close to 178.67 despite rallying 3.24% from the open. The severe downward opening gap remained unfilled. Price finished near the session high and above VWAP, but still below the previous day’s low after recording a lower high and lower low. The intraday recovery therefore did not erase the daily breakdown.
Near- and intermediate-term averages remain falling above price, aligned with the declining prior 15-session price trend. Price is also below the rising far-term average, leaving that horizon mixed. The latest range was about 152% of average, the fourth consecutive large-range bar, while volume surged to roughly 3.7 times average. Both exceeded already expanding range and increasing volume trends. PSAR and ATR-median remain bearish; a next-session high above 203.0226 would conditionally reverse PSAR upward.
Nvidia News and Fundamentals
Nvidia's board, assisted by outside counsel, is investigating allegations involving CEO Jensen Huang's relationship with a woman reportedly suspected of spying for China. Huang publicly confirmed an extramarital affair; the espionage allegations remain unproven. The investigation has raised leadership-continuity concerns because Nvidia has no publicly known succession plan. Shares fell about 5.5% on November 9. Revenue more than doubled to $96.2 billion in the quarter ended July 26; earnings are due November 17.
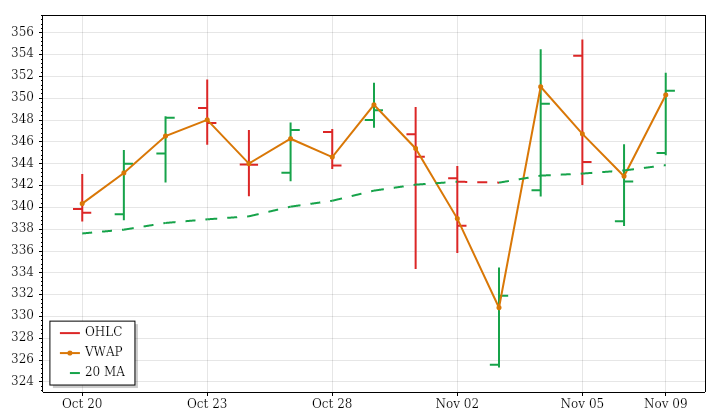
AAPL · D:2026-11-09 NC% ▲ +2.43% OC% ▲ +1.65%
AAPL – Apple Technicals Summary
AAPL’s completed November 9 daily session extended upward, closing at 350.69, up 2.43% from the prior close and 1.65% from the open. The opening gap remained unfilled, and a higher high and higher low culminated in a close above the previous day’s high. Finishing slightly above session VWAP reinforced the positive daily result, although trading crossed both sides of the open.
Near-, intermediate- and far-term averages are rising beneath price, giving the broader structure consistent upward alignment. That contrasts with the slightly declining, exceptionally choppy price path over the prior 15 sessions. The latest range was approximately average and volume modestly below average, despite expanding ranges and increasing volume across that lookback. The ATR-median measure crossed bullishly, while PSAR remained positive. A next-session low below 332.2565 would conditionally reverse PSAR bearish; that reversal has not occurred.
Apple News and Fundamentals
Apple reported revenue of $114.48 billion and earnings per share of $2.10, beating estimates as hardware and services delivered double-digit growth. Strong iPhone and Mac sales supported a record fourth quarter, while rising memory and Siri AI costs pressured margins. Commentary on first-quarter 2027 guidance pointed to further margin pressure and supply constraints. Apple Intelligence also registered with China's regulator for use on tablets and laptops.
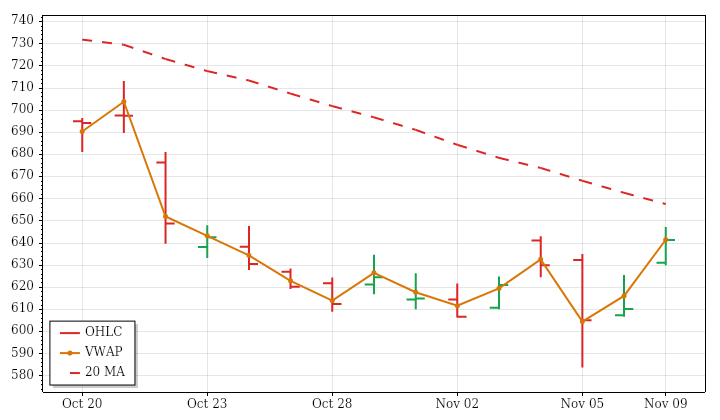
META · D:2026-11-09 NC% ▲ +5.12% OC% ▲ +1.64%
META – Meta Platforms Technicals Summary
META’s completed November 9 daily session closed at 641.37, up 5.12% from the prior close and 1.64% from the open. The substantial upward opening gap remained unfilled. Price formed a higher high and higher low, breached the preceding inside bar’s high and closed above the previous day’s high. Nevertheless, the finish was fractionally below session VWAP, tempering the otherwise positive daily action.
Price is above its falling near-term average, leaving that horizon mixed, and below its declining intermediate-term average. The far-term average remains rising beneath price, so the rebound sits between intermediate weakness and longer-term strength. The prior 15-session price trend remains clearly downward. Despite the large close-to-close gain, the session range was below average and volume only about 70% of average, consistent with declining lookback volume. ATR-median remains bearish. A next-session low below 583.8 would conditionally reverse PSAR’s long state.
Meta News and Fundamentals
Meta Superintelligence Lab released Muse Ember on November 9, describing it as its lightest and most cost-efficient AI model yet. The model is designed for complex reasoning and recurring agent tasks, including tool calls, coding subtasks, routing, extraction and long-document parsing. Meta's latest earnings also showed negative quarterly free cash flow, heightening concerns about its AI spending despite continued business growth.
MSFT · D:2026-11-09 NC% ▲ +2.75% OC% ▲ +0.13%
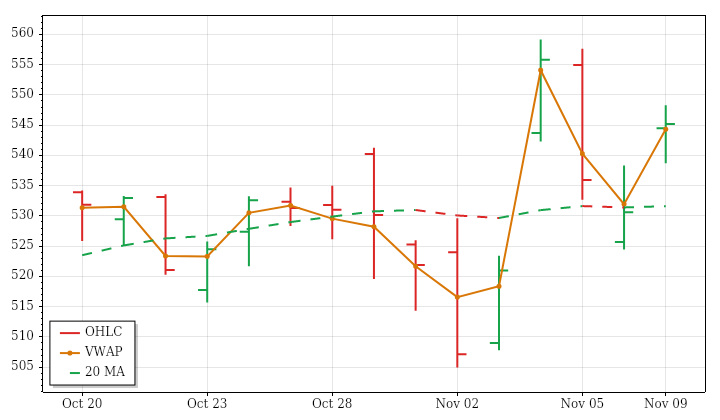
MSFT – Microsoft Technicals Summary
MSFT’s completed November 9 daily session gained 2.75% from the prior close to 545.18, but advanced just 0.13% from the open. The daily gain therefore came overwhelmingly from the upward opening gap, which remained unfilled. Price made a higher high and higher low and closed above the previous day’s high, while finishing close to its opening price and slightly above VWAP.
Price is above a falling near-term average, leaving that horizon mixed, whereas intermediate- and far-term averages are rising beneath it. The prior 15-session price trend is slightly positive but shows very little net progress relative to its fluctuations. The latest range was only about 71% of average and volume slightly below average, contrasting with expanding ranges and increasing volume over the lookback. PSAR and ATR-median remain positive. A next-session low below 512.6888 would conditionally reverse PSAR bearish.
AMZN · D:2026-11-09 NC% ▲ +2.94% OC% ▼ -0.89%
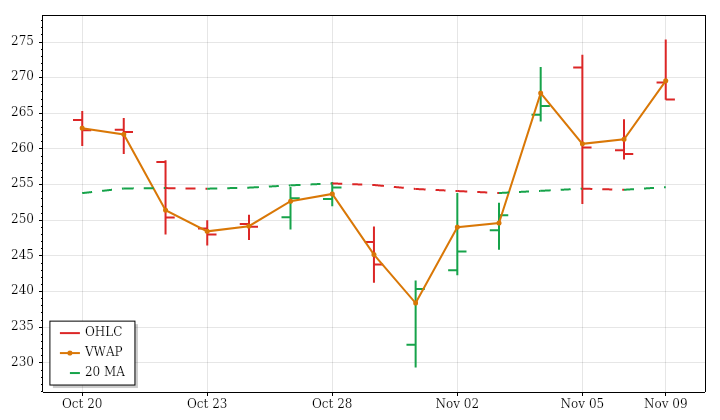
AMZN – Amazon Technicals Summary
AMZN’s completed November 9 daily session gained 2.94% from the prior close to finish at 266.93, but fell 0.89% from its opening price. The large upward opening gap therefore accounted for the daily gain and remained unfilled. Price established a higher high and higher low and closed above the previous day’s high, yet finished near the session low and below VWAP, showing that the opening strength faded during trading.
Price stands above both near- and intermediate-term averages, but those averages are still falling, leaving those horizons mixed rather than aligned upward. The far-term structure remains rising, while the prior 15-session price trend slopes lower. The latest range was moderately above average, but volume was slightly below average despite rising lookback participation. PSAR and ATR-median remain positive; a next-session low below 247.1468 would conditionally reverse PSAR bearish.
Amazon News and Fundamentals
Amazon Web Services revenue rose 39% in the third quarter, fueled by AI demand. AWS reported a 39% operating margin and 56% year-over-year operating income growth, while Amazon's operating cash flow increased 29% to $168 billion. Heavy capital spending and rising cloud competition remain risks. Management projected annual AWS growth above 40% in 2027 and 2028.
GOOGL · D:2026-11-09 NC% ▲ +1.18% OC% ▼ -1.34%
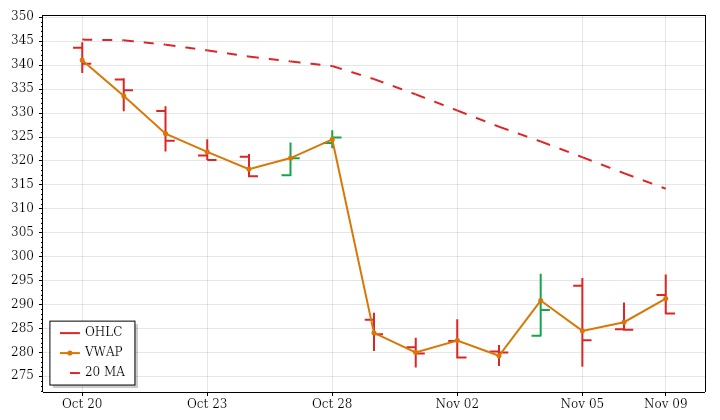
GOOGL – Alphabet Technicals Summary
GOOGL’s completed November 9 daily session finished at 288.15, up 1.18% from the prior close but down 1.34% from the open. An unfilled upward opening gap preserved the daily gain despite the intraday retreat. Although price made a higher high and higher low and breached the preceding inside bar’s high, it closed back within the previous day’s range, near its own session low and below VWAP.
The close barely exceeded the sharply falling near-term average, leaving that horizon mixed rather than establishing an uptrend. Intermediate- and far-term averages remain falling above price, consistent with the pronounced prior 15-session decline. The session range exceeded average while volume was below average, contrasting with increasing volume across the lookback. ATR-median remains bearish despite PSAR’s long state. A next-session low below 276.92 would conditionally reverse PSAR bearish, not confirm an already completed reversal.
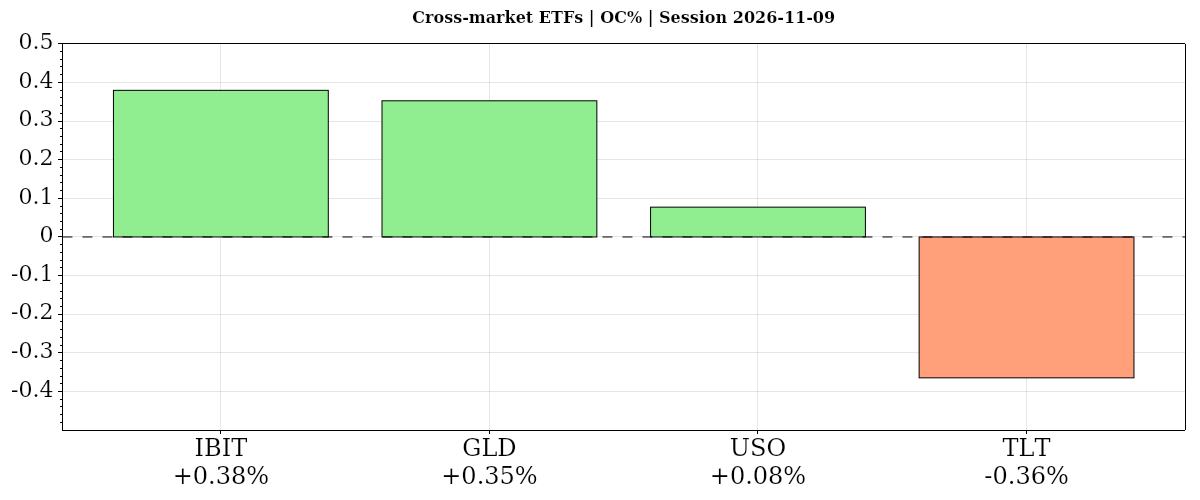
| Instrument | Bias | Date | DNC% | DOC% | O | H | L | C | VWAP | Vol |
|---|---|---|---|---|---|---|---|---|---|---|
| ▲ IBIT | ▼ ▲ ▲ | 2026-11-09 | ▼ -1.31% | ▲ +0.38% | 42.16 | 42.70 | 41.98 | 42.32 | ▲ 42.29 | 31,004,228 |
| ▲ GLD | ▲ ▲ ▲ | 2026-11-09 | ▲ +1.88% | ▲ +0.35% | 378.20 | 380.18 | 375.68 | 379.53 | ▲ 378.08 | 7,348,480 |
| ▲ USO | ▼ ▲ ▲ | 2026-11-09 | ▼ -3.87% | ▲ +0.08% | 142.55 | 145.18 | 139.44 | 142.66 | ▲ 142.32 | 6,258,362 |
| ▼ TLT | ▲ ▼ ▼ | 2026-11-09 | ▲ +0.05% | ▼ -0.36% | 82.26 | 82.28 | 81.82 | 81.96 | ▼ 81.97 | 28,736,405 |
| AVG/Sum | — | — | -0.81% | +0.11% | — | — | — | — | — | 73,347,475 |
Cross-Market ETFs
Mixed: average DOC% +0.11% from the open, DNC% -0.81% versus the prior close. Bitcoin led from the open, oil was near-flat and bonds slipped; versus the prior close, oil and bitcoin fell against rising equities, bonds barely gained and gold advanced. Gold’s longer-term structure remained falling.
IBIT · D:2026-11-09 NC% ▼ -1.31% OC% ▲ +0.38%
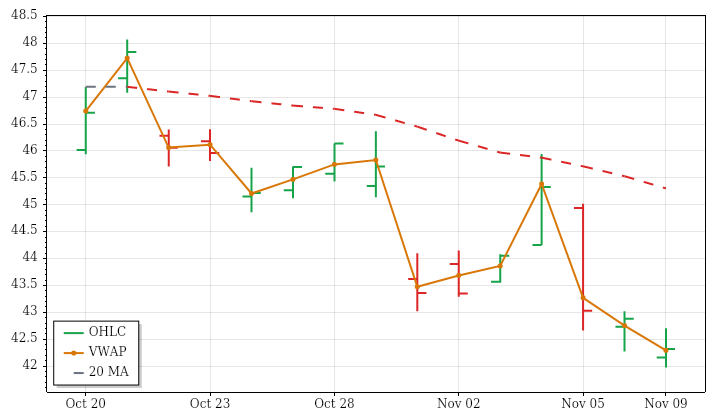
IBIT – Bitcoin Technicals Summary
IBIT’s completed November 9 daily session closed at 42.32, down 1.31% from the prior close despite recovering 0.38% from the open. The downward opening gap remained unfilled. Price recorded a lower high and lower low, but finished inside the previous day’s range and slightly above VWAP, indicating a modest intraday recovery rather than a reversal of the daily loss.
The near-term average is falling above price, consistent with the downward prior 15-session price trend. Price also remains below the rising intermediate-term average, creating a mixed middle horizon, while the far-term average continues rising beneath it. The latest range and volume were both substantially below average, unlike the expanding ranges and increasing volume of the lookback. PSAR and ATR-median remain bearish. A next-session high above 44.71 would conditionally reverse PSAR upward; the completed session did not establish that change.
GLD · D:2026-11-09 NC% ▲ +1.88% OC% ▲ +0.35%
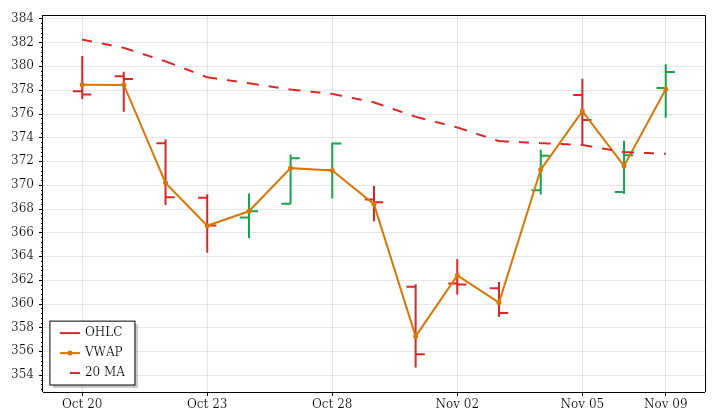
GLD – Gold Technicals Summary
GLD’s completed November 9 daily session rose 1.88% from the prior close to 379.53, with a smaller 0.35% gain from the open. Much of the advance came through an upward opening gap that remained unfilled. A higher high and higher low ended in a close above the previous day’s high, near the session high and above VWAP, giving the completed day a constructive finish.
The recovery has not aligned the moving-average structure upward. Price is above falling near- and intermediate-term averages, leaving both horizons mixed, and remains below a declining far-term average. The prior 15-session price trend also remains downward. The latest range was moderately above average, marking a third consecutive large-range bar, while volume was only about 80% of average despite increasing lookback volume. ATR-median crossed bullishly and PSAR remained positive; a next-session low below 360.3922 would conditionally reverse PSAR bearish.
USO · D:2026-11-09 NC% ▼ -3.87% OC% ▲ +0.08%
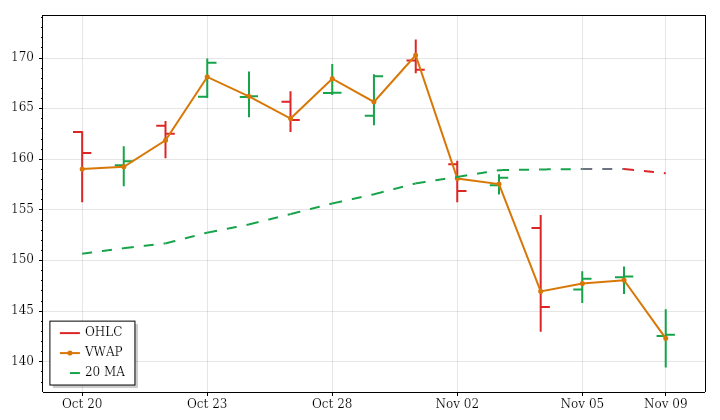
USO – Oil Technicals Summary
USO’s completed November 9 daily session fell 3.87% from the prior close to 142.66, despite a marginal 0.08% gain from the open. The loss came through a downward opening gap that remained unfilled. Price recorded a lower high and lower low and closed below the previous day’s low, although it finished near its opening price and modestly above VWAP after trading on both sides of the open.
The falling near-term average remains above price, aligned with the declining prior 15-session price trend. Price is also below a rising intermediate-term average, leaving that horizon mixed, while the far-term average remains rising beneath it. The latest range was about 130% of average despite contracting lookback ranges; above-average volume matched increasing participation. PSAR and ATR-median remain bearish. A next-session high above 162.0386 would conditionally reverse PSAR upward, not establish a reversal in the completed session.
Oil News and Fundamentals
OPEC oil production rose in October to 90% of its pre-war rate, according to a Reuters survey. Recovering Middle Eastern crude exports and weakening demand expectations contrasted with falling U.S. fuel inventories. The Iran war depleted crude stockpiles, prompting countries and companies to refill tanks and develop more accessible storage. WTI and Brent also faced pressure from peace-deal speculation and supply-glut concerns, alongside fresh attacks near key energy infrastructure.
TLT · D:2026-11-09 NC% ▲ +0.05% OC% ▼ -0.36%
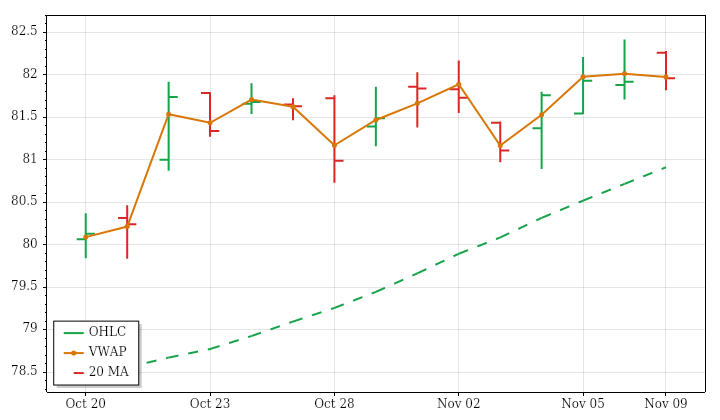
TLT – Long-Term Treasury Bonds Technicals Summary
TLT’s completed November 9 daily session ended at 81.96, almost unchanged from the prior close with a 0.05% gain, but down 0.36% from the open. The upward opening gap was filled. Trading stayed inside the previous day’s range and ended slightly below VWAP, making this a contained intraday retreat rather than an extension of the recent upward move.
Near- and intermediate-term averages remain rising beneath price, aligned with the positive prior 15-session price trend. The far-term average is still declining above price, however, so shorter-term strength continues within a weaker long-term structure. The latest range was about 71% of average and volume about 80%, contrasting with expanding ranges and increasing volume across the lookback. PSAR and ATR-median remain positive despite the session’s softness. A next-session low below 81.1111 would conditionally reverse PSAR bearish; no such reversal is established here.
Treasury Bonds News and Fundamentals
Japan's yen-defense operations were reportedly funded primarily through Treasury-bill runoff and other assets rather than sales of long-dated Treasuries. The analysis found no material impact from those interventions on the long end of the Treasury market and identified Federal Reserve policy and Treasury supply as the principal drivers of TLT's price action.
Glossary: Instrument — ticker symbol; hover for the instrument or company name; Date — session date. DNC% — prior-session close to this session’s close; DOC% — daily session open-to-close percentage change. O — open; H — high; L — low; C — close, all for the table’s daily or weekly session; VWAP — volume-weighted average price; its arrow shows whether the close is above or below VWAP. Vol — period trading volume.
Bias — three directional readings, in order: DNC%, DOC%, then VWAP. ▲ positive/above; ▼ negative/below; — neutral or unavailable. Matching arrows show alignment; opposing arrows show mixed conditions. AVG/Sum — simple average of percentage changes and sum of reported volumes.
Futures Session Fib Grid Analysis – Snapshot
Session Fib Grids normalise market positioning as percentages, making direction and alignment comparable across different asset types.
Latest available snapshot for each instrument; Time(CT) shows the individual update date and time.
| Instrument | Bias | Time(CT) | YSFG | MSFG | WSFG | RSFG | SFG | TSI |
|---|---|---|---|---|---|---|---|---|
| ▲ ES | ▲ ▼ ▲ ▲ ▲ ▲ | 2026-11-09 18:17:14 | ▲ +42 | ▼ -14 | ▲ +80 | ▲ +79 | ▲ +2 | ▲ +77 |
| ▲ NQ | ▲ ▼ ▲ ▲ ▲ ▲ | 2026-11-09 18:17:18 | ▲ +32 | ▼ -20 | ▲ +62 | ▲ +87 | ▲ +3 | ▲ +96 |
| ▲ YM | ▲ ▲ ▲ ▲ ― ▲ | 2026-11-09 18:17:14 | ▲ +35 | ▲ +24 | ▲ +67 | ▲ +42 | — 0 | ▲ +70 |
| ▲ EMD | ▲ ▲ ▲ ▲ ▲ ▲ | 2026-11-09 18:12:25 | ▲ +43 | ▲ +35 | ▲ +95 | ▲ +97 | ▲ +1 | ▲ +74 |
| ▲ RTY | ▲ ▲ ▲ ▲ ▲ ▲ | 2026-11-09 18:17:15 | ▲ +41 | ▲ +12 | ▲ +84 | ▲ +73 | ▲ +2 | ▲ +50 |
| ▲ FDAX | ▲ ▲ ▲ ▲ ▲ ▲ | 2026-11-09 18:17:06 | ▲ +42 | ▲ +49 | ▲ +90 | ▲ +156 | ▲ +3 | ▲ +83 |
| ▼ NKD | ▲ ▼ ▲ ▼ ▼ ▼ | 2026-11-09 18:17:10 | ▲ +119 | ▼ -25 | ▲ +49 | ▼ -14 | ▼ -14 | ▼ -22 |
| Instrument | Bias | Time(CT) | YSFG | MSFG | WSFG | RSFG | SFG | TSI |
|---|---|---|---|---|---|---|---|---|
| ▲ BTC | ▼ ▼ ▼ ▲ ▲ ▲ | 2026-11-09 18:09:42 | ▼ -56 | ▼ -17 | ▼ -13 | ▲ +33 | ▲ +8 | ▲ +118 |
| ▲ GC | ▼ ▲ ▲ ▲ ▼ ▼ | 2026-11-09 18:17:15 | ▼ -118 | ▲ +60 | ▲ +31 | ▲ +5 | ▼ -13 | ▼ -13 |
| ▼ CL | ▲ ▼ ▼ ▼ ▲ ▼ | 2026-11-09 18:17:07 | ▲ +145 | ▼ -84 | ▼ -43 | ▼ -10 | ▲ +2 | ▼ -34 |
| ▲ 6E | ▼ ▲ ▲ ▲ ▼ ▲ | 2026-11-09 18:15:35 | ▼ -55 | ▲ +24 | ▲ +57 | ▲ +32 | ▼ -8 | ▲ +33 |
| ▼ ZB | ▼ ▲ ▼ ▼ ― ▼ | 2026-11-09 18:11:36 | ▼ -28 | ▲ +14 | ▼ -4 | ▼ -43 | — 0 | ▼ -18 |
Glossary: YSFG — yearly; MSFG — monthly; WSFG — weekly; RSFG — regular trading hours (RTH); SFG — the current session, including pre-market or other sessions. TSI indicates trend strength and power.
Bias shows trend alignment across these six readings. The arrows follow the column order: YSFG, MSFG, WSFG, RSFG, SFG and TSI. Matching arrows show alignment; opposing arrows show mixed conditions.
Futures Higher Time Frame Analysis
Summary of the current state of US Indices Futures based on higher time-frame (HTF) technical analysis as of: 2026-11-09 16:00 -05:00 CT.
US Indices Futures
- ES YSFG above F0%, MSFG below F0%, WSFG above F0%, below daily benchmarks, pivots down, support 7322.25–7325.00, daily reversal 7540.75, weekly reversal 7683.25.
- NQ YSFG/WSFG above F0%, MSFG below F0%, below short/intermediate benchmarks, pivots down, support 26363.50–26368.50, daily reversal 27812.50, weekly reversal 28789.00.
- YM YSFG/MSFG rising, WSFG unspecified, below 5–100-day benchmarks, daily pivots down, support 50568–50891, daily reversal 52435, weekly reversal 53377.
- EMD YSFG above F0%, MSFG below F0%, above WSFG midpoint, below daily benchmarks, pivots down, support 3560.7, resistance 3696.9–3770.1.
- RTY YSFG/WSFG above F0%, MSFG below F0%, below daily benchmarks, pivots down, support 2714.2–2718.7, daily reversal 2813.7, resistance 2888.7.
- FDAX YSFG/MSFG/WSFG above F0%, above rising weekly benchmarks, pivots down, daily support 25695, weekly support 24925, daily reversal 26523, resistance 26784–26847.
Overall State
- Short-Term: Bearish
- Intermediate-Term: Bearish
- Long-Term: Bullish
Conclusion
Daily downside pivot sequences align across the instruments, while ES, NQ, EMD, and RTY share MSFG conditions below F0%. US daily benchmark weakness contrasts with rising longer-term weekly benchmarks and YSFG structures above F0%. YM retains rising weekly monthly-grid structure despite daily weakness; FDAX shows relative structural strength above its rising 20–200-day benchmarks. Recent declines remain countertrend to the broader weekly uptrends, with identified pivot lows defining support and pivot-reversal thresholds defining overhead structural references.
Note: Intra-day counter-trend pullbacks or retracements may occur, HTF is context for informational usage and market structure. Glossary: Session Fib Grids periods of YSFG:’Yearly’, MSFG:’Monthly’, WSFG:’Weekly’
For full details visit: AlphaWebTrader Technicals
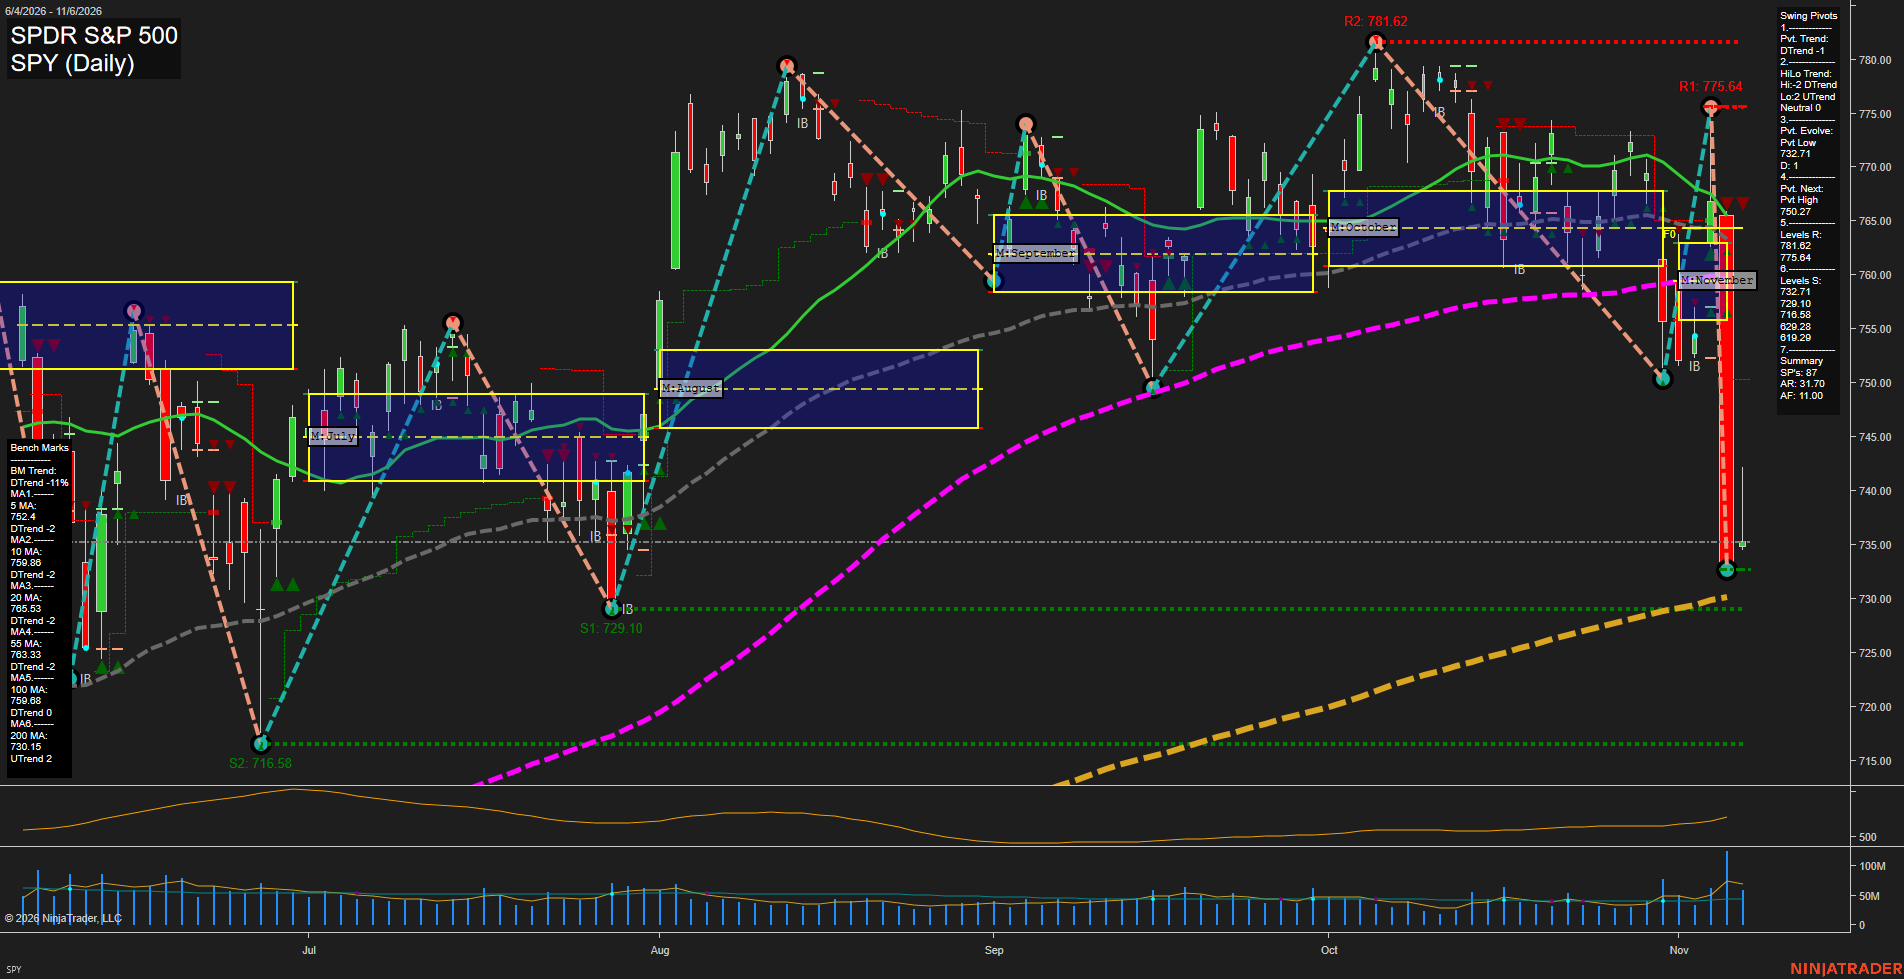
SPY Daily View
Overall Rating
- Short-Term: Bearish
- Intermediate-Term: Bearish
- Long-Term: Neutral.
Key Insights Summary
The futures swing structure is decisively risk-off in the short and intermediate time frames. A large-range selloff drove price below the November monthly grid, beneath the 5-, 10-, 20-, 55-, and 100-day benchmarks, while elevated volume and a 31.70 ATR reflect expanded daily range conditions. The decline reached the active 732.71 pivot-low area, immediately above secondary support at 729.10 and the larger 716.58 swing-support zone. The 200-day average remains marginally upward at 730.15, creating a long-term trend conflict: price is testing major-trend support while the nearer-term pivot and benchmark alignment remains bearish. Overhead, 750.27 is the first pivot-reversal reference, with the clustered moving-average zone near 752-766 representing substantial recovery resistance; 775.64 and 781.62 remain the larger swing-high resistance levels.
View charts on: AlphaWebTrader HTF Charts
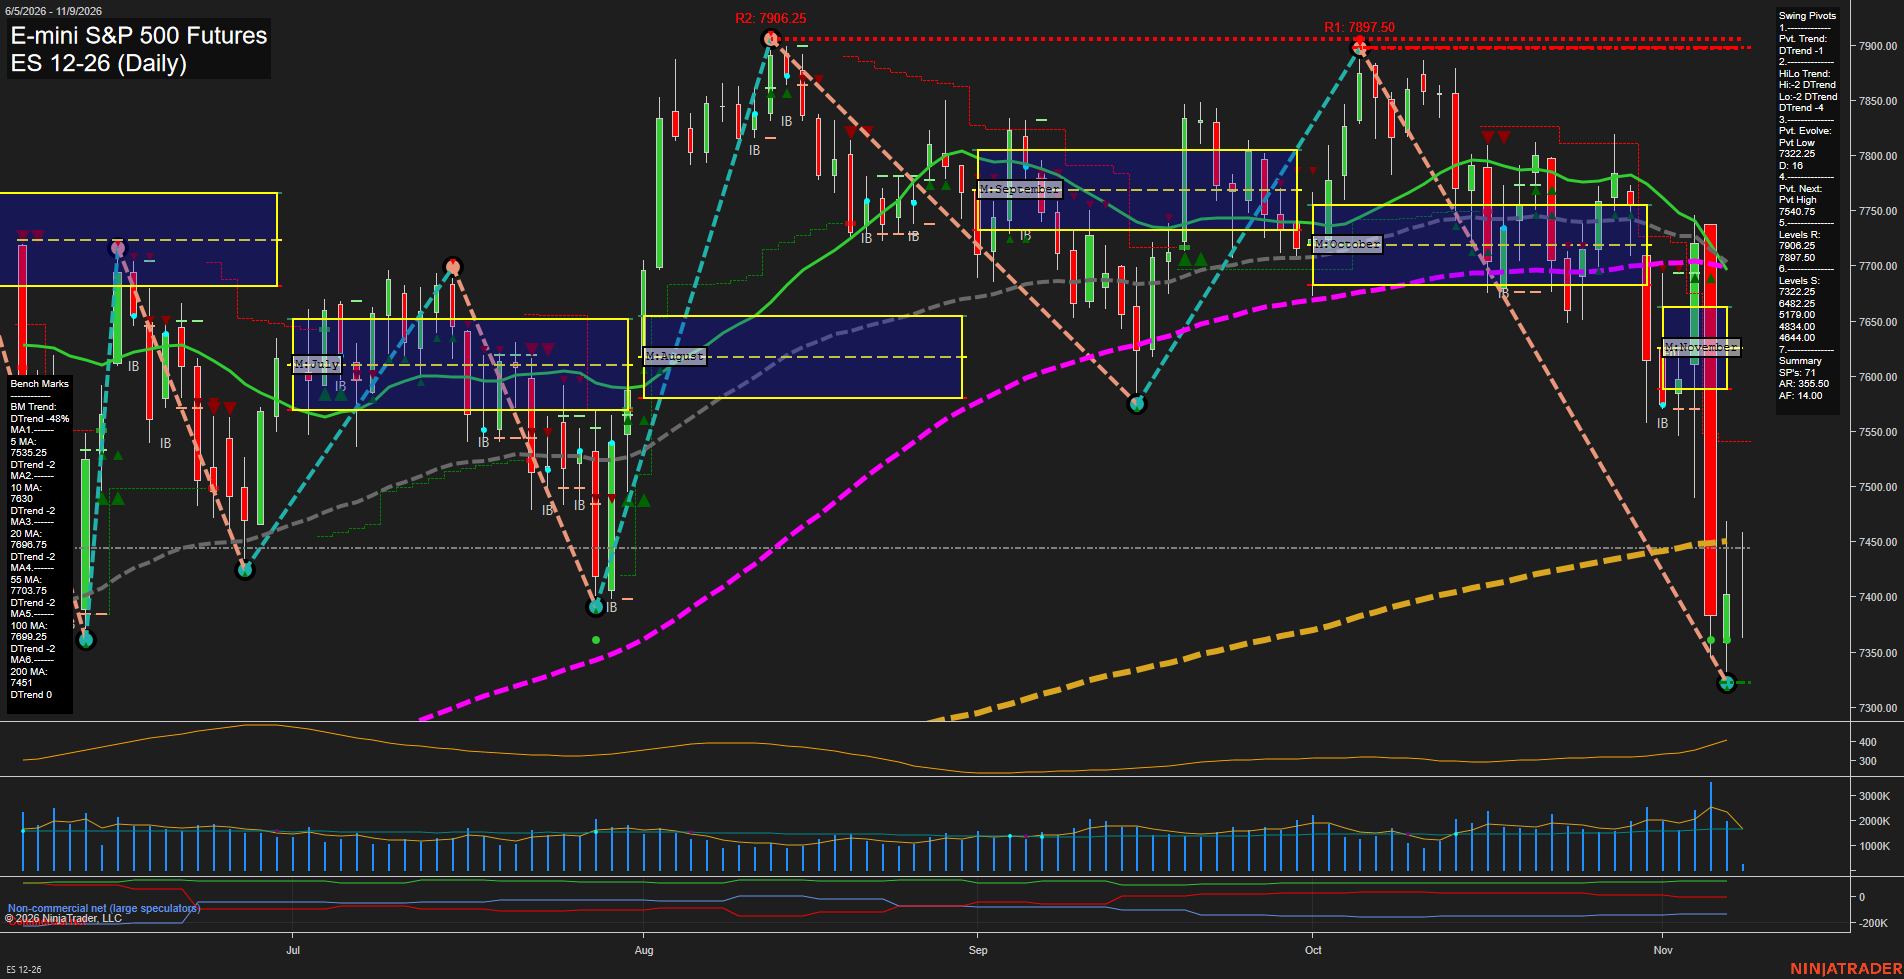
ES Daily View
Overall Rating
- Short-Term: Bearish
- Intermediate-Term: Bearish
- Long-Term: Bearish.
Key Insights Summary
Price has undergone a high-volatility breakdown from the October highs, with large daily ranges and a decisive move beneath every displayed daily benchmark. The short-term weekly grid remains above its F0% level, reflecting an oversold countertrend bounce attempt, while the monthly grid remains negative and confirms the intermediate downtrend. Both pivot structures are in DTrend, with 7325.00 defining the active pivot low and 7540.75 the first pivot-reversal threshold. The rebound remains structurally weak below the clustered 5-day through 100-day averages, while the 200-day average near 7451.00 is now an important overhead reference. Increased ATR and elevated volume reflect an active liquidation-driven price cycle rather than orderly consolidation.
View charts on: AlphaWebTrader HTF Charts
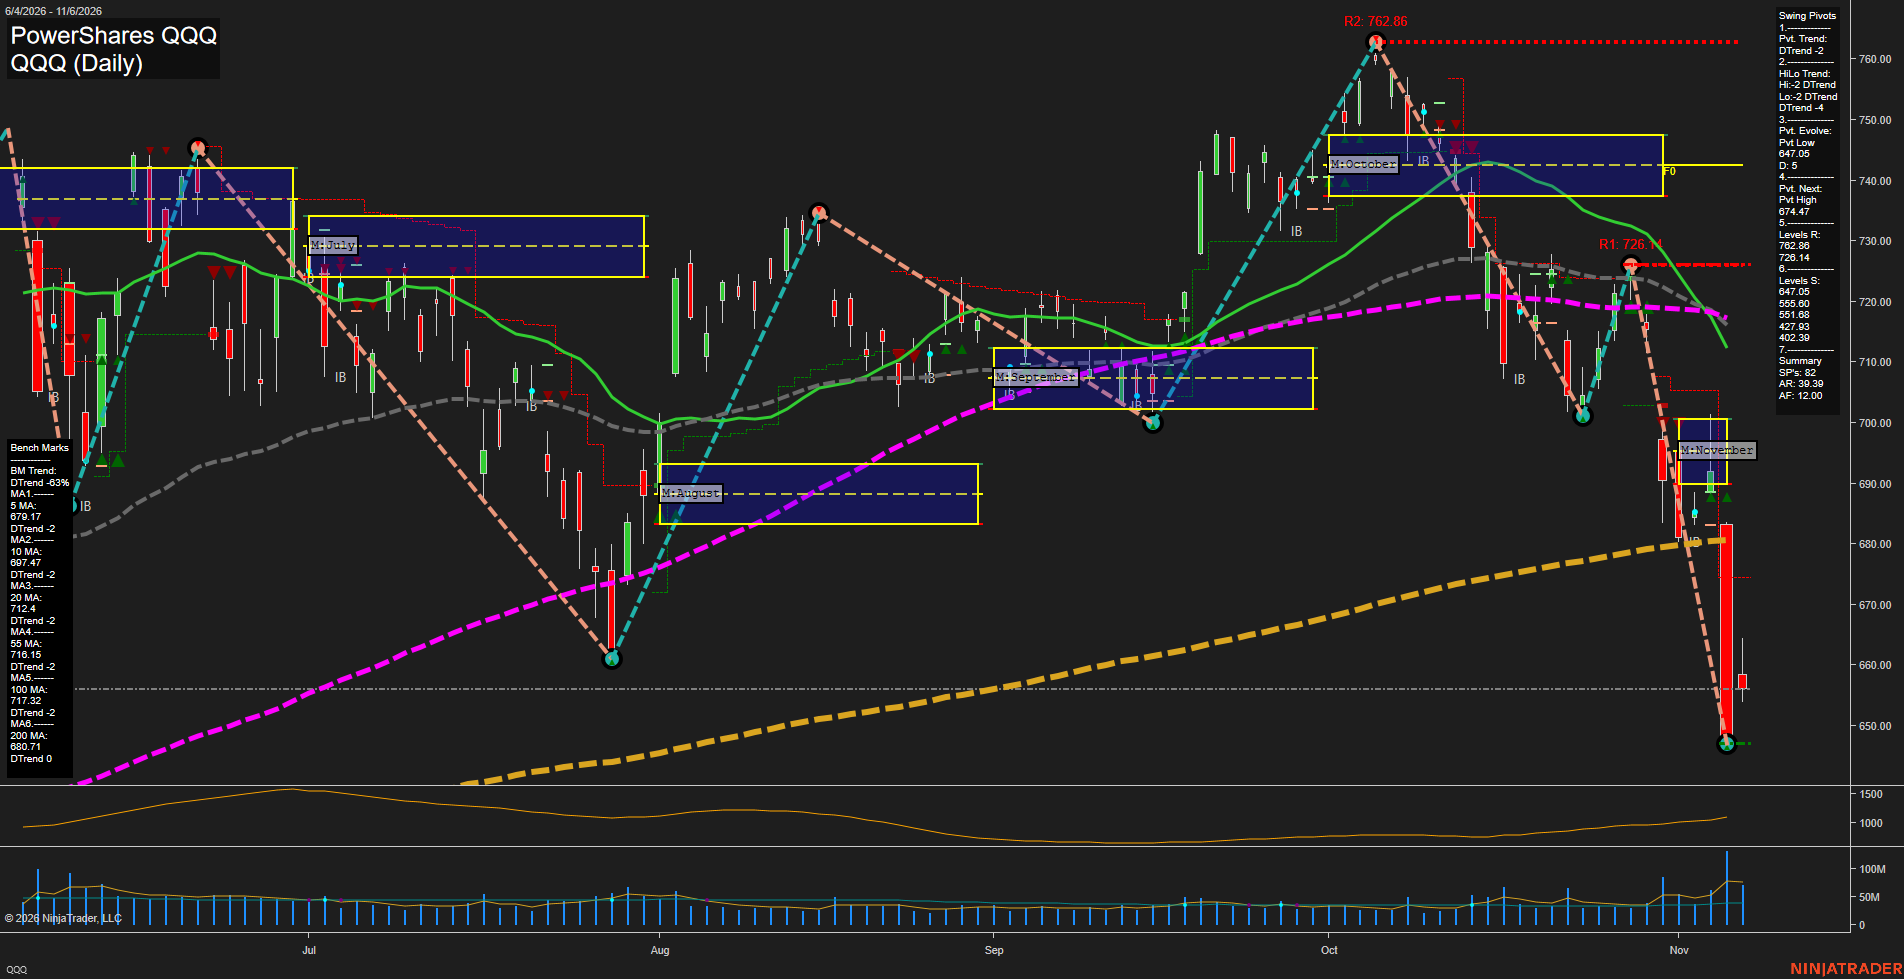
QQQ Daily View
Overall Rating
- Short-Term: Bearish
- Intermediate-Term: Bearish
- Long-Term: Bearish.
Key Insights Summary
The futures-swing structure is decisively bearish: a high-velocity selloff has driven price beneath every listed benchmark and below the November monthly grid. Both pivot measures remain in DTrend, with 647.05 defining the active pivot-low area and 674.47 the next pivot-high reversal reference. Large bars, elevated volatility, and expanding volume characterize a liquidation-style decline rather than orderly consolidation. The 680.71 200-day benchmark has shifted from major support to overhead reference, while 697.47 through 717.32 form a broad overhead moving-average supply band. The current action reflects lower highs and lower lows following the October peak, with the 647.05 pivot-low test central to the immediate price cycle.
View charts on: AlphaWebTrader HTF Charts
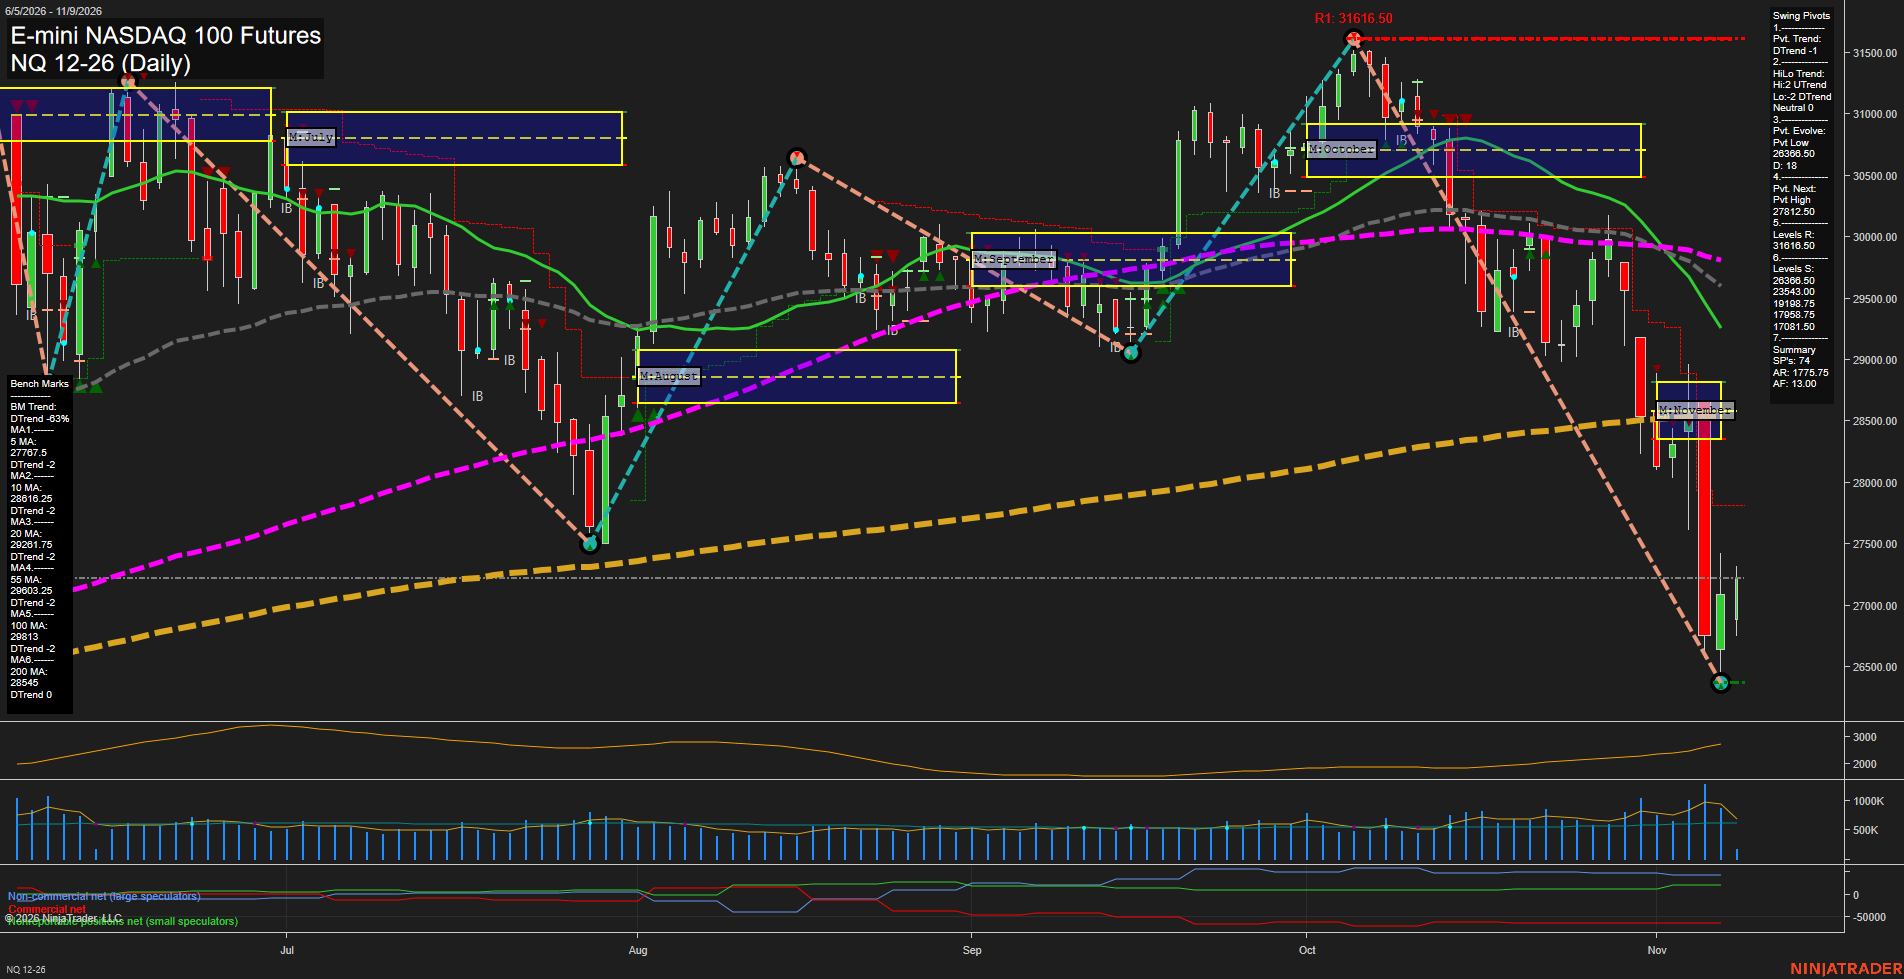
NQ Daily View
Overall Rating
- Short-Term: Bearish
- Intermediate-Term: Bearish
- Long-Term: Neutral.
Key Insights Summary
NQ is in a high-volatility countertrend bounce following a sharp liquidation from the October peak near 31,616.50 into the 26,368.50 pivot low. The weekly Fib structure is positive and price is above its weekly F0% area, but daily swing structure remains in a DTrend and price is below every short- and intermediate-term benchmark. The rebound remains beneath the 5-day average at 27,767.50 and the next pivot threshold at 27,812.50, while the monthly Fib grid remains negative. The broader yearly grid is still positive, creating a long-term neutral backdrop versus decisive short- and intermediate-term downside momentum.
View charts on: AlphaWebTrader HTF Charts
USO Daily View
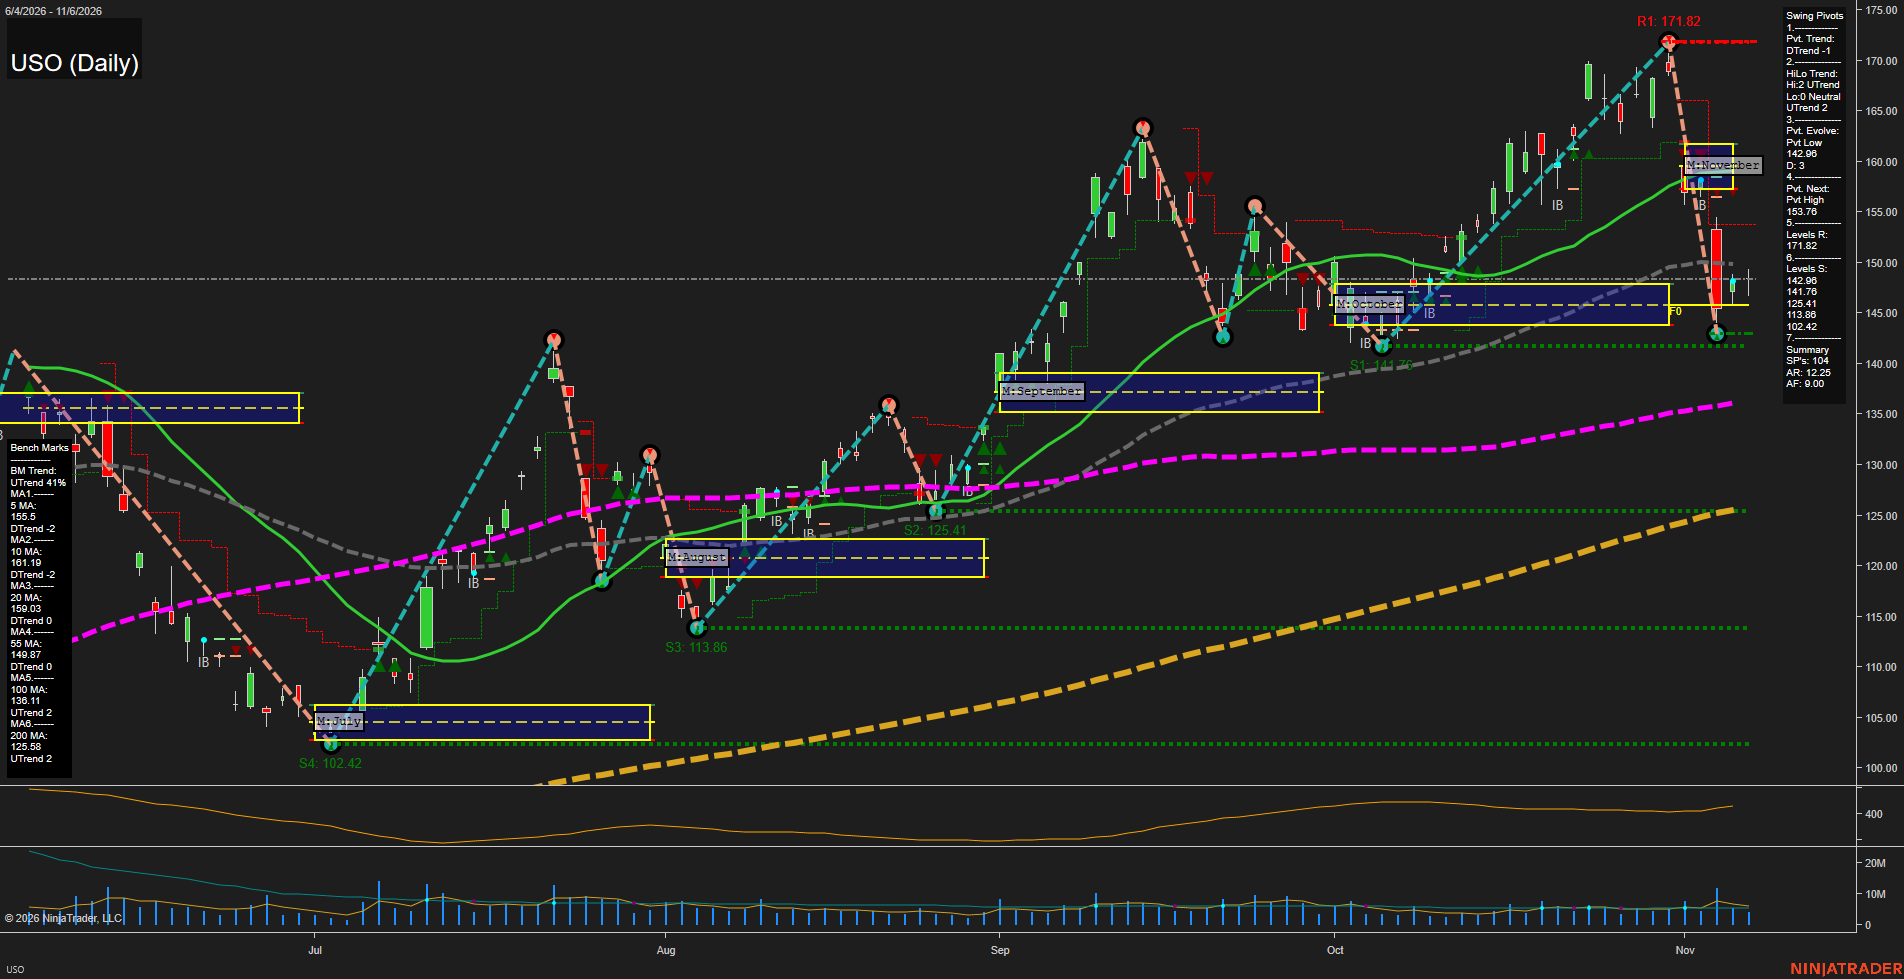
Overall Rating
- Short-Term: Bearish
- Intermediate-Term: Neutral
- Long-Term: Bullish.
Key Insights Summary
USO reflects a sharp, high-momentum futures-style liquidation from the 171.82 pivot high into the 142.98 pivot low, followed by a modest rebound toward 148.20. The short-term pivot structure remains bearish, with price below the falling 5-, 10-, and 20-day benchmarks, while 153.76 is the defined pivot-reversal threshold. Intermediate structure is mixed: the higher-order HiLo trend remains up and price is holding above the rising 55-day average, but the November grid position is neutral after the rapid retracement. Long-term structure remains constructive above the rising 100- and 200-day averages; however, the recent decline has created a volatile countertrend phase rather than a smooth continuation. The 141.76 support area is the immediate structural reference, while 153.76 and then 171.82 define the overhead recovery and prior swing-high zones.
View charts on: AlphaWebTrader HTF Charts
CL Daily View
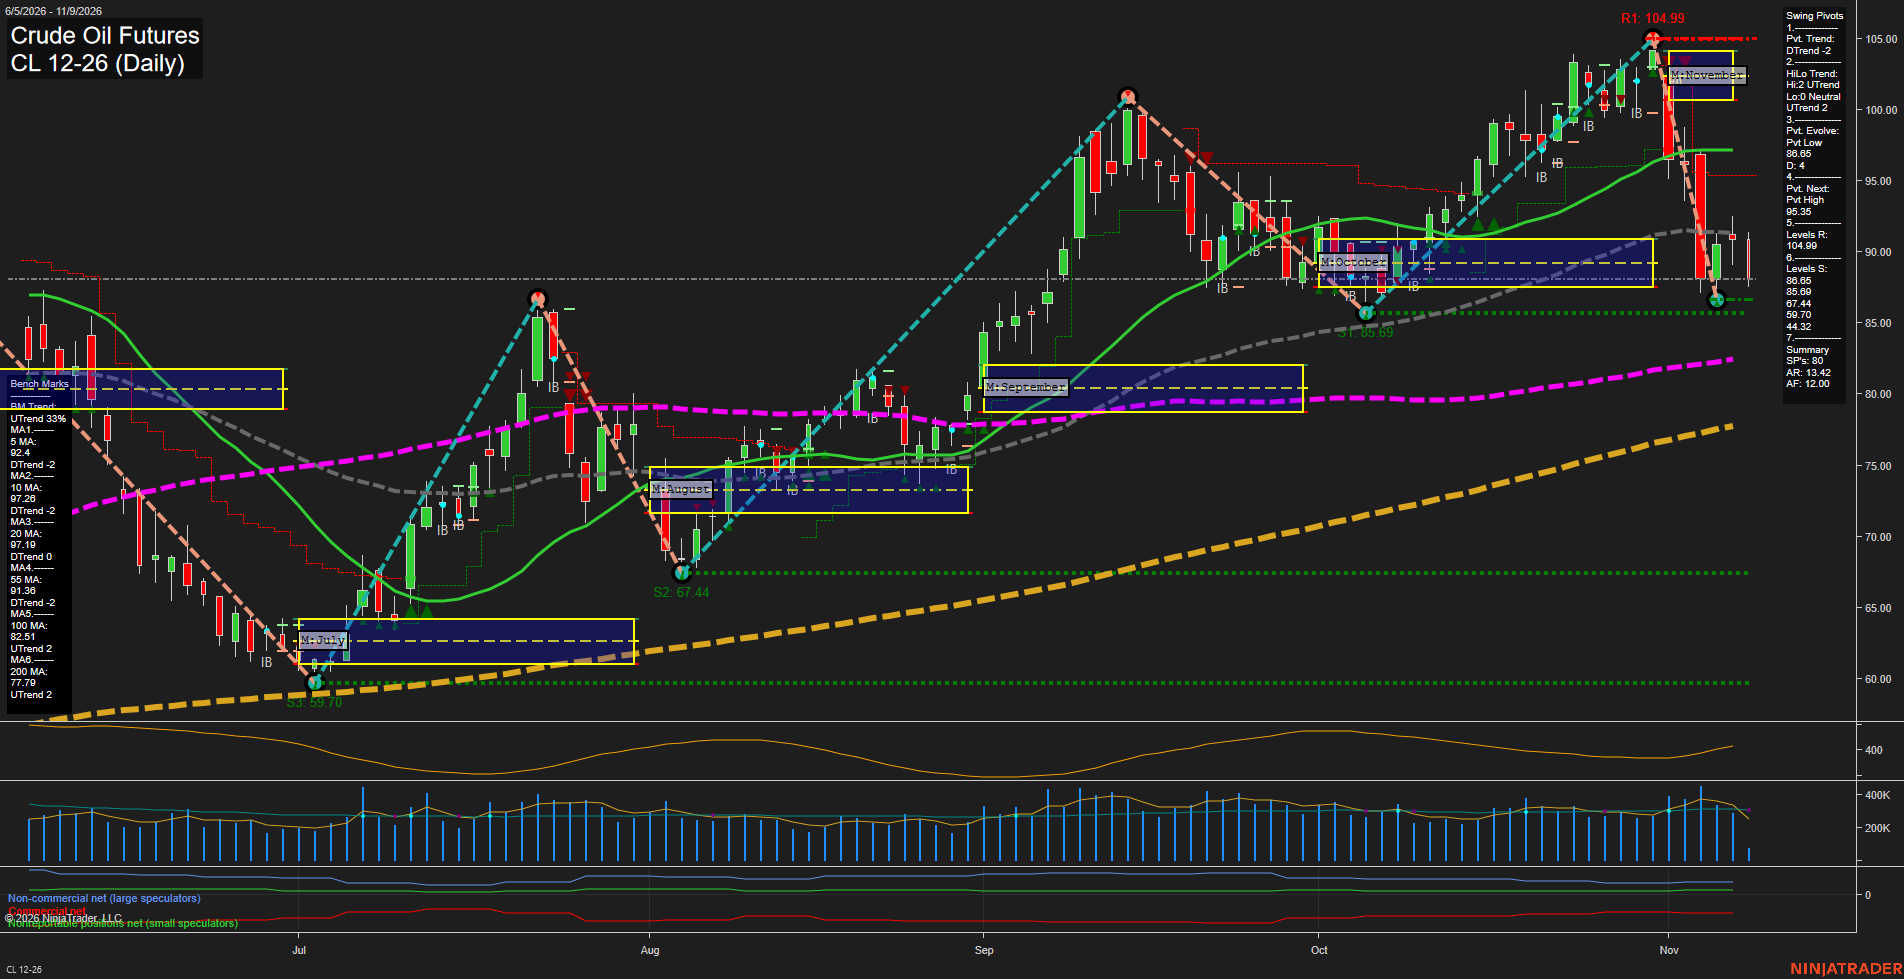
Overall Rating
- Short-Term: Bearish
- Intermediate-Term: Bearish
- Long-Term: Bullish.
Key Insights Summary
Price has undergone a fast, high-range reversal from the 104.99 pivot-high resistance area and remains below the weekly and November monthly Fib-grid center zones. The short-term pivot structure is in DTrend, with price below the declining 5-, 10-, 20-, and 55-day benchmarks, confirming a countertrend selloff within the broader yearly uptrend. The 88.65 to 87.44 support band is the immediate downside reference area, while 95.35 is the next pivot-reversal threshold and 104.99 remains the major overhead resistance. Long-term structure remains constructive because price is still above rising 100- and 200-day averages and the yearly Fib-grid bias remains positive; however, current price action reflects a sharp bearish retracement with elevated daily range and momentum.
View charts on: AlphaWebTrader HTF Charts
GLD Daily View
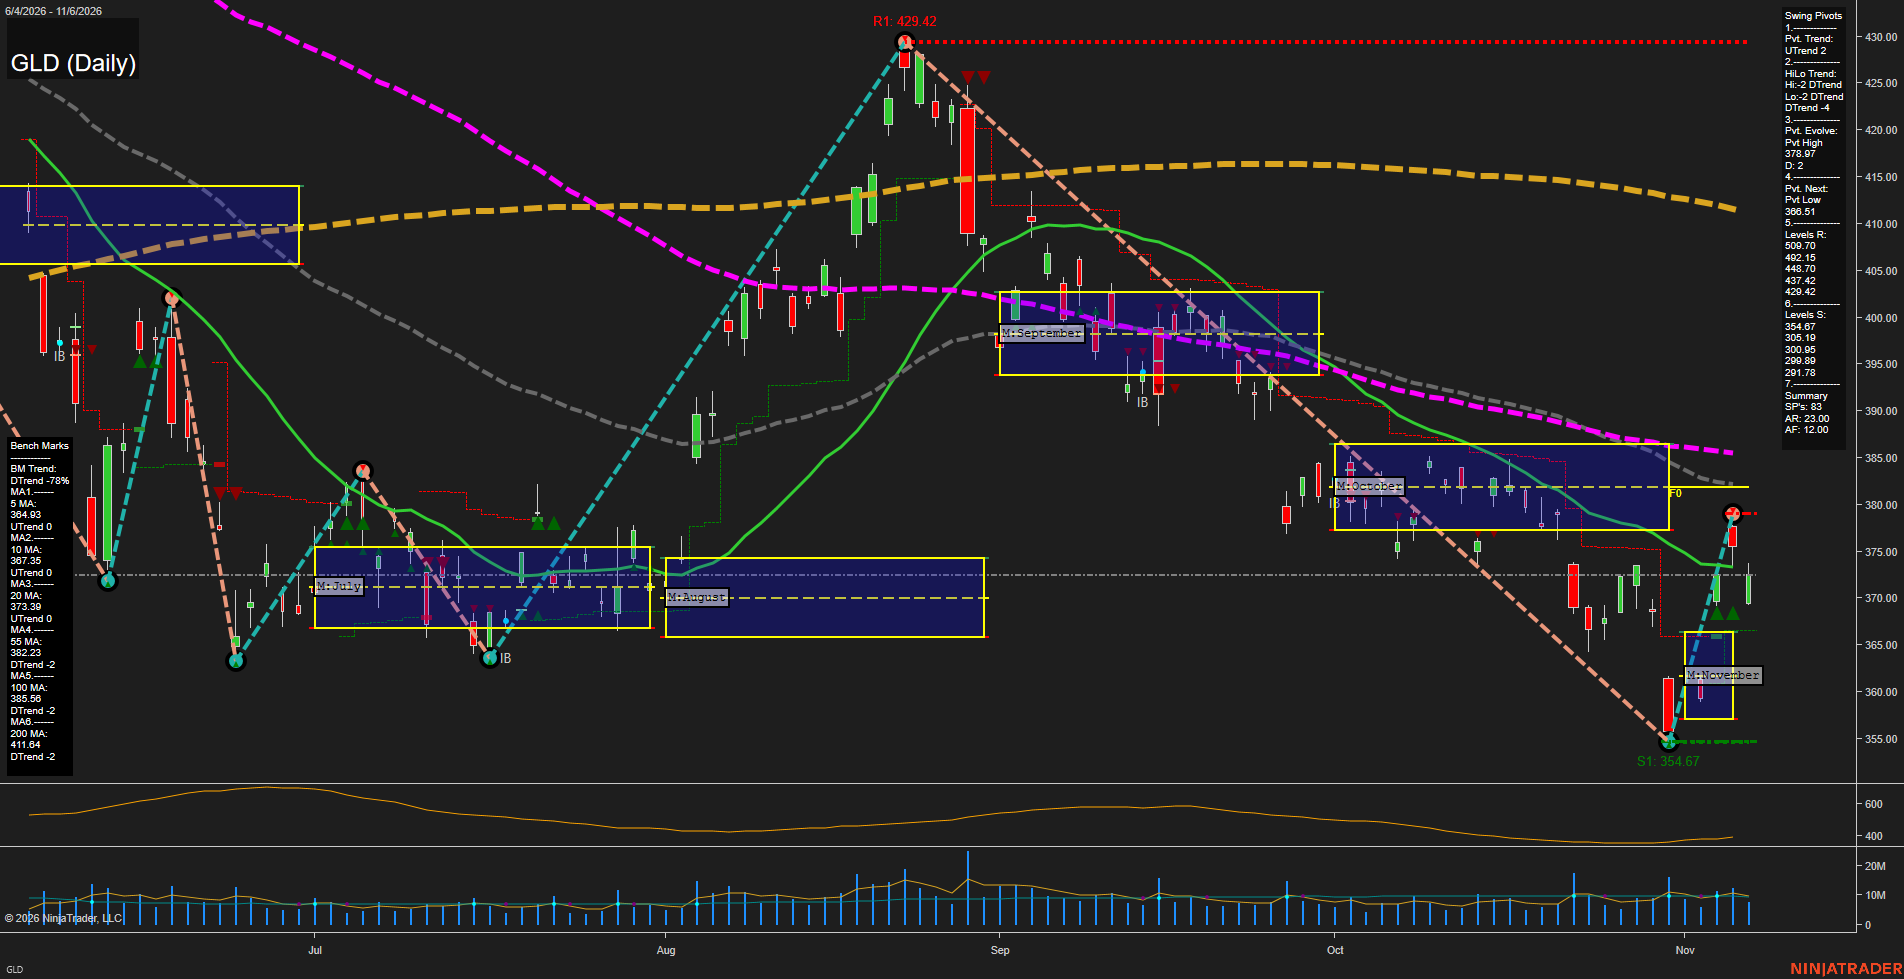
Overall Rating
- Short-Term: Bullish
- Intermediate-Term: Bearish
- Long-Term: Bearish.
Key Insights Summary
From a futures swing-trader perspective, the chart shows a sharp short-term recovery from the 354.67 swing low, producing an UTrend pivot structure and lifting price above the rising 5- and 10-day benchmarks. The rally reached 378.97 and then retraced toward the 368.51 pivot-reversal area, keeping near-term action active and volatile. Intermediate and long-term structure remains bearish because price is below the declining 55-, 100-, and 200-day benchmarks, while the HiLo pivot trend remains DTrend. The November monthly grid has shifted upward from its lower range, but the 373.90 to 382.23 benchmark zone remains a prominent overhead transition area. Support is clustered around 365.19 through 354.67, while the prior 378.97 swing high and higher resistance levels define the broader countertrend rally framework.
View charts on: AlphaWebTrader HTF Charts
GC Daily View
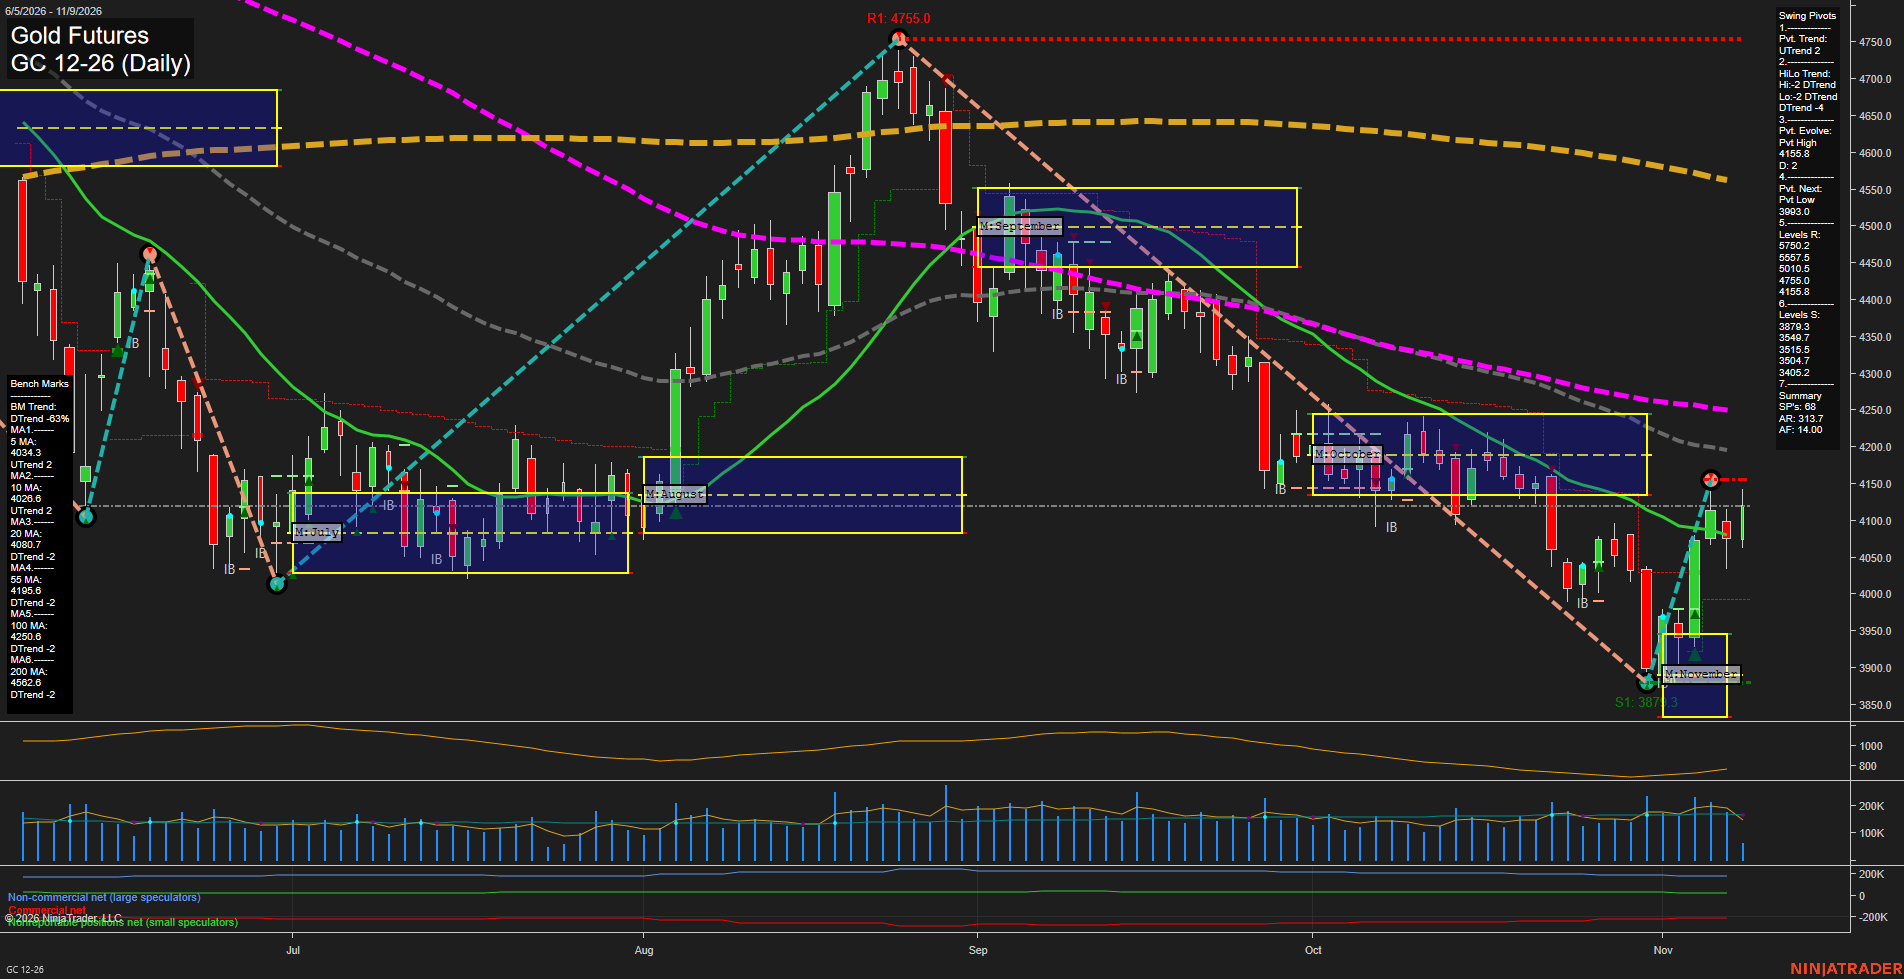
Overall Rating
- Short-Term: Bullish
- Intermediate-Term: Bearish
- Long-Term: Bearish.
Key Insights Summary
Gold has formed a sharp short-term V-recovery from the 3879.3 swing-low support area, producing an UTrend pivot condition and reclaiming both the 5-day and 10-day benchmark zone. The rebound remains a counter-trend recovery within a broader intermediate and long-term bearish structure: price is below the declining 20-, 55-, 100-, and 200-day averages, while the HiLo pivot trend remains DTrend. The 4155.8 pivot-high resistance is the immediate technical ceiling, with the 4195.6 55-day average and October grid above it reinforcing overhead supply. The 3993.0 pivot threshold and 3879.3 support define the recent recovery base, while medium-sized bars and firm volume participation reflect elevated but moderating swing volatility.
View charts on: AlphaWebTrader HTF Charts
ZB Daily View
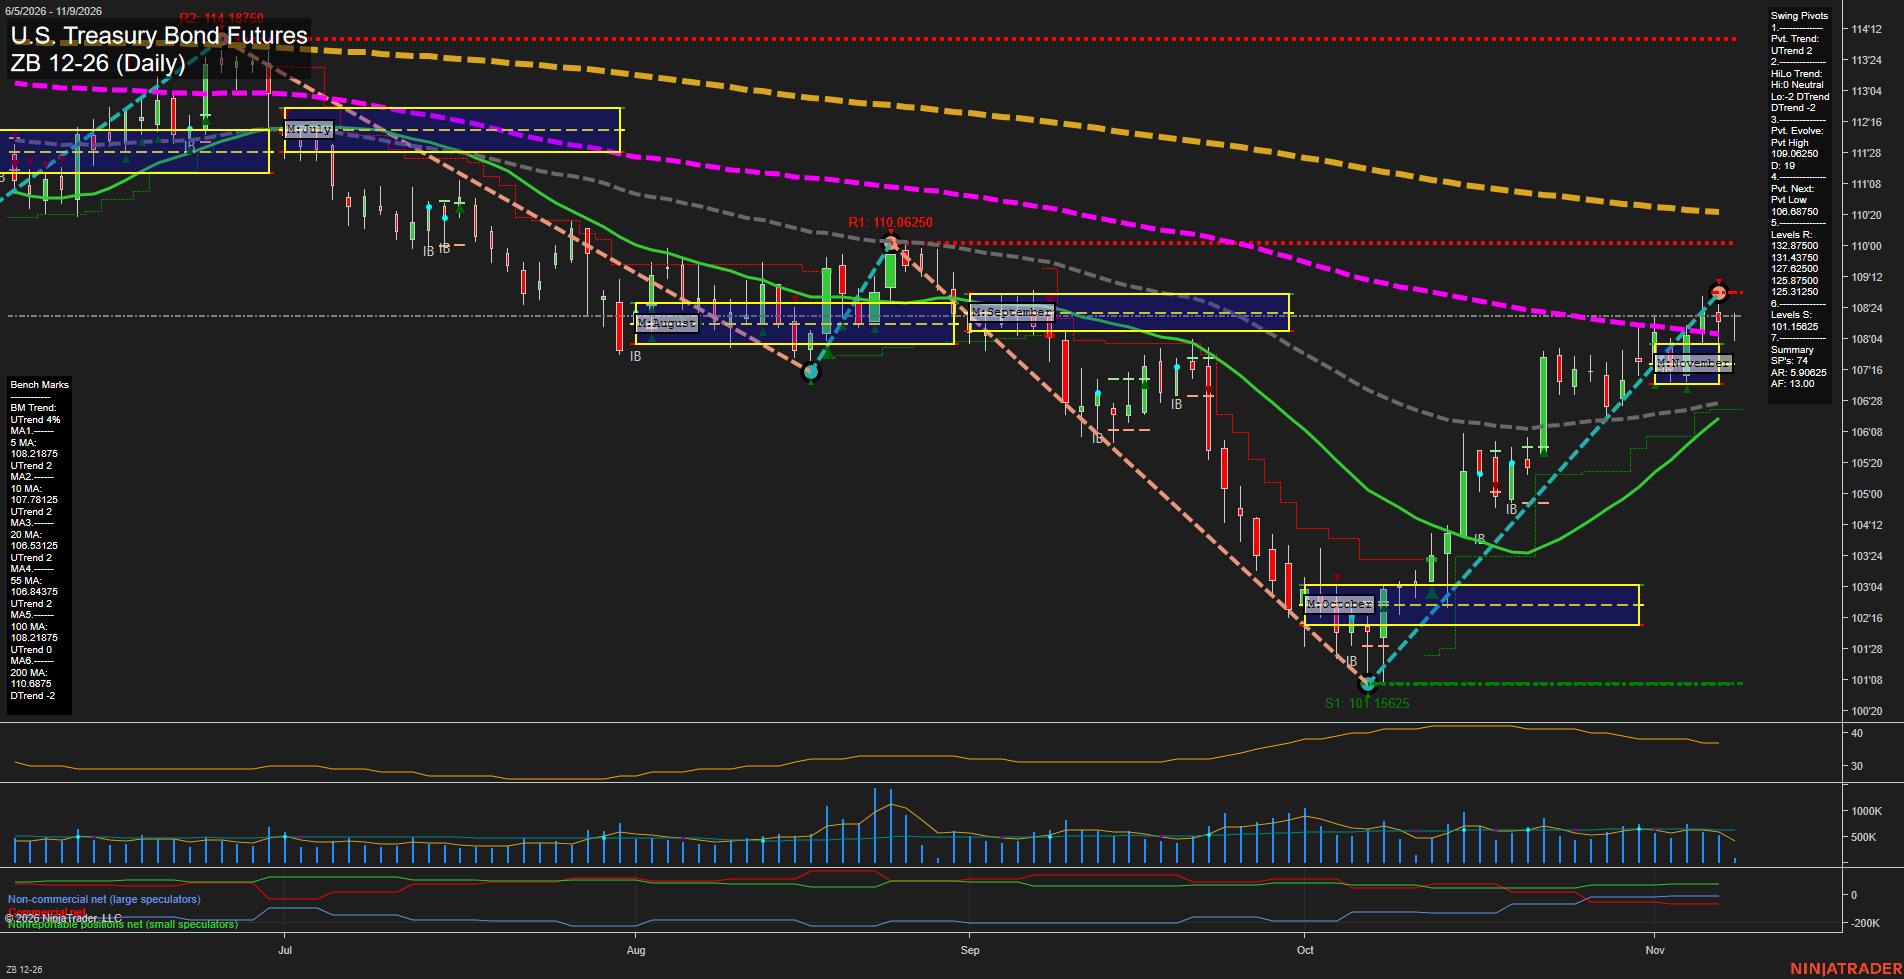
Overall Rating
- Short-Term: Bullish
- Intermediate-Term: Bullish
- Long-Term: Bearish.
Key Insights Summary
Price has staged a fast V-shaped recovery from the October 101.15625 swing low, producing higher lows and reclaiming the 5-, 10-, and 20-day benchmarks. The short-term pivot structure remains positive, although the 109.06250 pivot high produced a visible rejection and defines the near-term countertrend ceiling. Weekly and monthly Fib-grid positioning remains above F0%, supporting the recovery phase, while the declining 55-day and 200-day benchmarks and negative yearly grid position preserve a broader long-term bearish backdrop.
View charts on: AlphaWebTrader HTF Charts
Sentiment Summary: Negative coverage led positive coverage 40% to 29%, centered on Nvidia’s November 8 board investigation into CEO Jensen Huang over alleged foreign-intelligence targeting, alongside concerns about AI spending returns and post-midterm regulatory scrutiny. Nvidia fell on November 9 while broader equities rebounded from last week’s technology selloff, with gains in Meta, Amazon and Alphabet providing a counterweight supported by analyst endorsements and cloud and AI developments. Coverage also highlighted rotation beyond Big Tech and solid earnings breadth, distinguishing cautious news sentiment from the reported market rebound.
Conclusion: October CPI, scheduled for November 10, and this week’s Federal Reserve speakers remain the next reported macro tests.