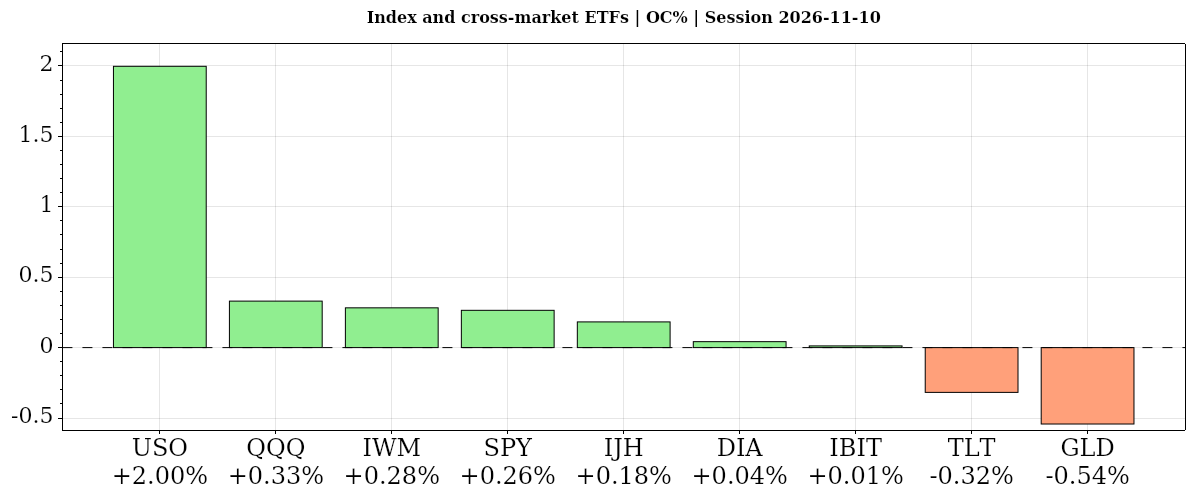
Stocks and tech rose from Tuesday’s opens but ended below prior closes. Nvidia slid, oil gained from its open, and gold and far-term Treasury bonds fell.
Fundamentals: Technology shares declined Tuesday as Nvidia's selloff deepened amid governance scrutiny, litigation and chip-export concerns. U.S. headline CPI rose 0.4% month over month and core CPI increased 0.3%, both above forecasts, while hawkish Fed remarks reinforced rate-hike concerns. The $42 billion 10-year Treasury auction yielded 5.02%. Positive Amazon and Anthropic developments offered a counterpoint to AI-sector anxiety.
Technicals: Stocks and tech gained from their opens in Tuesday’s completed session: the S&P 500 ETF rose 0.26% and the Nasdaq-100 ETF added 0.33%, yet finished 0.37% and 0.68% below their prior closes, respectively. Nvidia fell 2.92% from its open on heavy volume. The oil ETF rose 2.00% from its open but remained below its prior close, while gold and far-term Treasury ETFs declined from their opens.
After Market Close daily snapshot: market news summary and sentiment, major ETFs, Magnificent 7 analysis, Indices Futures Higher Time Frame Analysis, and E-mini S&P500, Nasdaq 100, NYMEX Crude, Gold Futures Daily Chart analysis.
As of: November 10, 2026 06:15 CT
EcoNews Radar U.S. Events Day Recap
| Date | Impact | Event, Prev, Forecast, Actual | Info |
|---|---|---|---|
| 2026-11-10 Tuesday 04:00 | Medium | Fed's Waller speech Prev: — Forecast: — Actual: — | Policy remarks can offer insight into the economic outlook and reaction to incoming data; index futures traders monitor implications for interest rates and equity valuations. |
| 2026-11-10 Tuesday 08:15 | Medium | ADP Employment Change 4-week average Prev: 17K Forecast: — Actual: 20K | Tracks average weekly changes in private payrolls over a rolling window, helping traders assess hiring momentum and its implications for growth and monetary policy. |
| 2026-11-10 Tuesday 08:30 | High | Consumer Price Index ex Food & Energy (MoM) Prev: 0.30% Forecast: 0.20% Actual: 0.30% | Measures monthly consumer price changes excluding volatile categories, helping traders assess underlying inflation persistence and the potential interest-rate path affecting equity valuations. |
| 2026-11-10 Tuesday 08:30 | High | Consumer Price Index (MoM) Prev: 0.60% Forecast: 0.30% Actual: 0.40% | Measures monthly changes in a broad basket of consumer prices, informing inflation expectations, household purchasing power and the monetary-policy outlook watched by index futures traders. |
| 2026-11-10 Tuesday 10:45 | Medium | Fed's Logan speech Prev: — Forecast: — Actual: — | Policy commentary provides perspective on inflation, employment and financial conditions; traders watch for signals about the policy outlook that could influence bond yields and equity valuations. |
| 2026-11-10 Tuesday 13:00 | High | 10-Year Note Auction · $42B Prev: 5.3% Forecast: — Actual: 5.02% | Reveals the yield required to place government debt and investor demand for duration; traders monitor implications for benchmark borrowing costs and equity discount rates. |
| 2026-11-10 Tuesday 14:00 | Medium | Fed's Schmid speech Prev: — Forecast: — Actual: — | Remarks may clarify how economic conditions inform monetary-policy judgments; traders monitor potential implications for rate expectations and the growth outlook underpinning equities. |
| 2026-11-10 Tuesday 15:30 | Medium | Fed's Bowman speech Prev: — Forecast: — Actual: — | Policy commentary can illuminate views on inflation risks and labor-market conditions; index futures traders watch for implications for expected interest rates and financial conditions. |
| 2026-11-10 Tuesday 16:30 | Low | API Weekly Crude Oil Stock Prev: -5.27M Forecast: -1.00M Actual: — | Estimates weekly changes in U.S. crude inventories, offering a supply-demand signal relevant to oil prices, energy shares and inflation expectations. |
| 2026-11-10 Tuesday 18:30 | Medium | Fed's Paulson speech Prev: — Forecast: — Actual: — | Remarks may provide insight into the economic outlook and monetary-policy priorities; traders monitor any implications for interest-rate expectations and equity valuations. |
Summary: The calendar centers on U.S. inflation and monetary-policy signals, with supporting labor, Treasury-demand and energy-inventory information.
Market News Summary:
November 10 coverage centers on Nvidia-led technology weakness and renewed rate-hike concerns following hot inflation data.
Primary Drivers & Risks:
- Primary Driver: Nvidia selloff and renewed rate-hike concerns
- Primary Risk: Persistent inflation and tighter monetary policy
Tone:
Negative overall, with technology-sector stress outweighing positive AI investment headlines.
Data, Market and System
Geopolitical:
- Reports alleged that Nvidia-linked connections helped facilitate $7.5 billion in restricted chip shipments to China.
- Coverage described growing legislative momentum for tighter Nvidia chip export restrictions following the allegations involving Huang.
Fed / Financials:
- Hot CPI data boosted rate-hike bets, while Fed Governor Christopher Waller warned that a hot report required consideration of more than a quarter-point increase.
- Fed Governor Michelle Bowman said there was still work to do on inflation.
- Foreign-linked buyers took their smallest share of a three-year Treasury auction in 15 months, although dealers retained almost none of the offering.
Macro / Other:
- Consumer prices rose 0.4% in October, according to the supplied tariff coverage.
- The White House defended continuing tariffs despite midterm backlash over rising prices, while former economic adviser Gary Cohn said American consumers were bearing the cost.
- The Canadian dollar reached a near four-week low as U.S. CPI data strengthened the U.S. dollar.
- Hackers stole $6.3 billion from Binance in a reported cryptocurrency exchange breach.
Conclusion:
Nvidia’s continuing decline and broader AI-sector anxiety dominated equity coverage. Hot inflation data and hawkish Fed commentary renewed attention to interest-rate increases.
Export-control pressure, governance scrutiny and litigation added to Nvidia’s company-specific risks. Positive Amazon and Anthropic developments provided a counterpoint, while tariff persistence and mixed Treasury auction demand added macroeconomic cross-currents.
Market News Sentiment
Sentiment Bias shows the balance of positive and negative news coverage sampled from 2026-11-09 16:03 to 2026-11-10 15:56 ET, covering stocks, energy and gold.
▼ Market news
- Bias
- ▼ -23.08%
- Articles
- 286
- Positive
- ▲ 17.13%
- Neutral
- — 42.66%
- Negative
- ▼ 40.21%
▼ GLD / Gold
- Bias
- ▼ -21.43%
- Articles
- 14
- Positive
- ▲ 21.43%
- Neutral
- — 35.71%
- Negative
- ▼ 42.86%
Sentiment Summary: Gold coverage leaned negative, with 43% negative versus 21% positive, as November 10’s hotter-than-expected U.S. CPI strengthened December Fed hike expectations; reports linked rising Treasury yields and a stronger dollar to gold’s roughly 3% decline. This reversed November 9’s gains, supported by dollar weakness and falling oil prices amid hopes for a U.S.-Iran diplomatic resolution. Continued central-bank buying, including China’s two-year accumulation streak, remained the main positive counterweight, while neutral coverage largely reflected pre-release positioning and reserve-policy discussion.
Conclusion: For indices futures traders, the dominant cross-market context was renewed inflation and rate pressure, rather than gold-specific demand weakness.
▼ USO / Oil
- Bias
- ▼ -41.18%
- Articles
- 34
- Positive
- ▲ 8.82%
- Neutral
- — 41.18%
- Negative
- ▼ 50.00%
Sentiment Summary: Oil coverage was 50% negative versus 9% positive as November 9–10 reports linked crude’s slide to Trump’s Iran de-escalation comments; Brent fell below $90 on November 10, while lower energy prices supported S&P 500 and Dow futures and global equities. The key counterweight for index traders was November 10’s hotter-than-expected October CPI release—headline inflation rose 0.4% monthly and core 0.3%—which renewed expectations for December rate increases despite the recent oil decline.
Conclusion: Equity relief remained exposed to unresolved geopolitical risk, with no signed Iran deal reported and Iran denying talks.
Glossary: Sentiment Bias = (positive articles − negative articles) ÷ total articles × 100. It ranges from −100% negative to +100% positive. A reading near zero indicates little directional bias. Neutral articles reduce the score’s strength. ▲ positive; ▼ negative; — balanced. These readings describe news coverage, not market-price direction.
Market Technical Analysis
Analysis of VIX volatility, the completed session in major ETFs and mega-cap tech stocks, and futures snapshots and higher-time-frame analysis.
VIX — Market Fear Gauge Daily
| Level | Open | High | MaxVix | Low | MinVix | DNC% | DOC% | VR | MaxVR | MinVR |
|---|---|---|---|---|---|---|---|---|---|---|
| 19.46 | 21.33 | 21.43 | 28.36 | 19.29 | 16.21 | -2.31% | -8.77% | -6.27 | 56.57 | -0.20 |
VIX fell 8.77% from the session's opening level. VIX fell 2.31% versus the previous session close. Expected volatility eased from the period open. VIX is 26.7% up the recent 15-session range (16.21–28.36), in the 20–30% band.
VR: ATN Volatility Ratio (VR): -6.27 – SPY and VIX moved in the same direction. VR is below the minimum of its preceding 15-session VR range (-0.20 to 56.57). VR fell 12.25 points from the previous session, a moderate shift relative to that range.
Range lookback: preceding 15 completed sessions.
Major ETFs and Mega Cap Tech Stocks
- Technology shares declined again Tuesday as Nvidia’s selloff deepened and Anthropic’s IPO developments failed to ease broader AI-sector anxiety.
- Nvidia coverage cited a 17.5% decline over five days and a roughly 26% decline over the past month.
- Nvidia’s board launched an independent investigation into reports that CEO Jensen Huang was targeted by a Chinese spy operation, with Wachtell Lipton leading the internal probe.
- A shareholder lawsuit filed Monday accused Nvidia and Huang of misleading investors about the alleged espionage scandal.
- Amazon coverage highlighted robust earnings, AWS growth and a partnership giving eligible Prime members free Uber Eats restaurant delivery.
- Anthropic’s IPO filing outlined a $10 billion Google stock purchase using previously committed financing, while Nvidia planned a separate $10 billion investment alongside the offering.
ETF, Mag7, and Cross-Market ETF Insights
Overall Tone
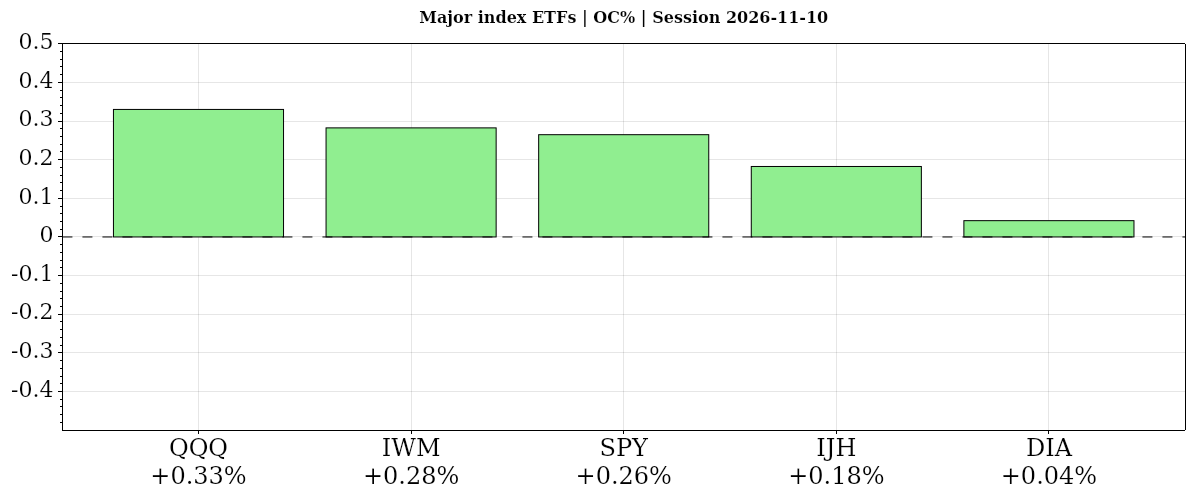
On 2026-11-10, daily risk tone was mixed: index ETFs gained from the open but remained below prior closes, while mega-cap participation was uneven.
| Instrument | Bias | Date | DNC% | DOC% | O | H | L | C | VWAP | Vol |
|---|---|---|---|---|---|---|---|---|---|---|
| ▲ QQQ | ▼ ▲ ▲ | 2026-11-10 | ▼ -0.68% | ▲ +0.33% | 672.54 | 680.95 | 667.05 | 674.76 | ▲ 673.47 | 36,917,393 |
| ▲ IWM | ▼ ▲ ▲ | 2026-11-10 | ▼ -0.68% | ▲ +0.28% | 279.79 | 281.33 | 277.91 | 280.58 | ▲ 279.72 | 21,430,514 |
| ▲ SPY | ▼ ▲ ▲ | 2026-11-10 | ▼ -0.37% | ▲ +0.26% | 747.94 | 752.14 | 744.86 | 749.92 | ▲ 748.54 | 39,536,113 |
| ▲ IJH | ▼ ▲ ▲ | 2026-11-10 | ▼ -0.35% | ▲ +0.18% | 74.00 | 74.25 | 73.49 | 74.13 | ▲ 73.95 | 7,045,662 |
| ▲ DIA | ▼ ▲ ▲ | 2026-11-10 | ▼ -0.31% | ▲ +0.04% | 521.51 | 522.60 | 519.19 | 521.73 | ▲ 520.95 | 3,060,088 |
| AVG/Sum | — | — | -0.48% | +0.22% | — | — | — | — | — | 107,989,770 |
Index ETFs
Mixed: average DNC% -0.48% versus the prior close, DOC% +0.22% from the open. All five gained from the open, led by QQQ; DIA was nearly flat and lagged, yet was most resilient versus the prior close as all five declined. SPY and QQQ retained near- and intermediate-term downtrends.
QQQ · D:2026-11-10 NC% ▼ -0.68% OC% ▲ +0.33%
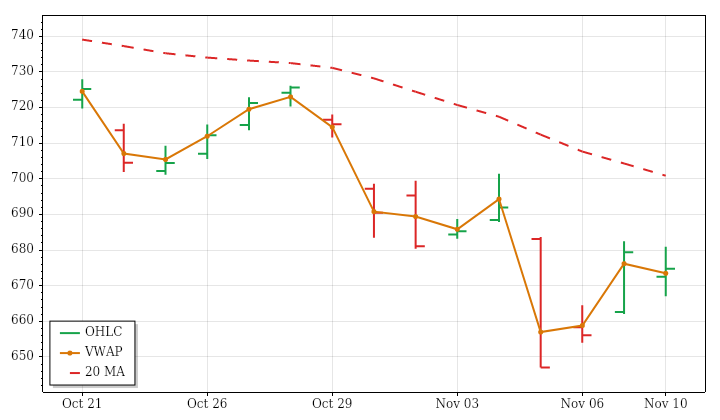
QQQ – Nasdaq 100 Technicals Summary
QQQ's completed November 10 daily session closed at 674.76, down 0.68% from the prior close despite gaining 0.33% from the open. The opening gap down was filled during trading, but the close did not retain that recovery. It nevertheless finished above VWAP. A range slightly above average remained entirely within the previous day's range, combining substantial intraday movement with a contained daily structure.
Near- and intermediate-term averages were falling above price, consistent with the downward 15-session trend. The far-term average was still edging upward, but price remained below it, making that horizon mixed. The intraday gain therefore did not resolve the broader weakness. While the day's range matched the lookback tendency toward expansion, volume was below average despite its increasing trend. PSAR and ATR-median remained bearish; a next-session high above 684.9278 would conditionally trigger an upward PSAR reversal.
Nasdaq 100 News and Fundamentals
The Nasdaq-100 posted its strongest daily gain since March, with chip stocks driving the advance despite a decline in Nvidia, its second-largest holding. Nvidia was under pressure amid an investigation involving its CEO.
IWM · D:2026-11-10 NC% ▼ -0.68% OC% ▲ +0.28%
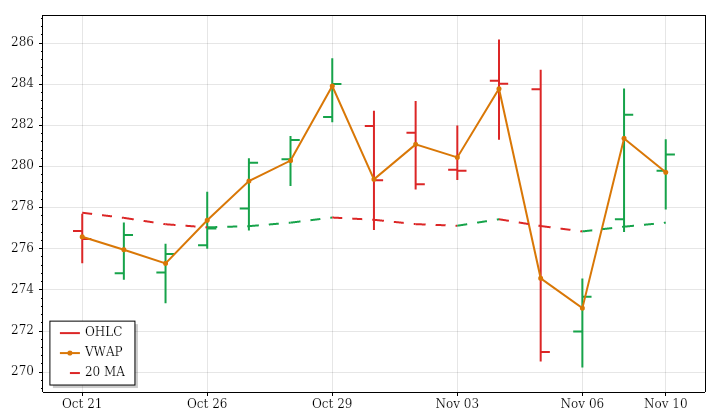
IWM – Small Cap Technicals Summary
IWM's completed November 10 daily session closed at 280.58, losing 0.68% versus the prior close while gaining 0.28% from the open. An opening gap down remained unfilled. The close above VWAP and toward the day's high showed a partial intraday recovery, but an inside bar kept all trading within the previous session's range. The positive open-to-close move therefore did not translate into a positive daily return.
The near-term average was rising beneath price, while the intermediate-term average was falling beneath it and the far-term average was falling above it. This left recent strength opposed by the longer-term structure. The latest range and volume were below average despite expanding ranges and increasing volume across the preceding 15 sessions. PSAR and the newly bearish ATR-median state also conflicted with near-term average strength. A next-session high above 283.79 would conditionally trigger an upward PSAR reversal.
SPY · D:2026-11-10 NC% ▼ -0.37% OC% ▲ +0.26%
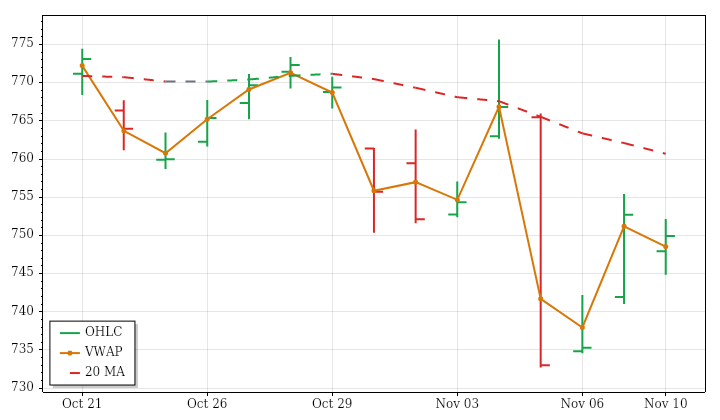
SPY – S&P 500 Technicals Summary
SPY's completed daily session on November 10 closed at 749.92, down 0.37% versus the prior close but up 0.26% from the open. The opening gap down remained unfilled. Trading crossed both sides of the open before finishing above VWAP, showing a partial intraday recovery rather than a positive close-to-close session. An inside bar kept the action contained within the previous day's range.
Price remained below falling near- and intermediate-term averages but above a rising far-term average. That configuration preserved the conflict between shorter-horizon weakness and the longer-term upward structure. The downward 15-session price trend was inefficient, indicating substantial two-way movement. Both the latest range and volume were below average, in contrast with expanding ranges and increasing volume across the lookback. PSAR and ATR-median remained bearish. A next-session high above 769.5171 would conditionally trigger an upward PSAR reversal.
S&P 500 News and Fundamentals
The S&P 500 had declined over the past month as of November 10 but remained short of correction territory. Its recovery from the November 5 selloff was uneven: only three of that session’s 20 biggest losers had recovered their losses, while Sandisk remained more than 10% below its November 4 level.
IJH · D:2026-11-10 NC% ▼ -0.35% OC% ▲ +0.18%
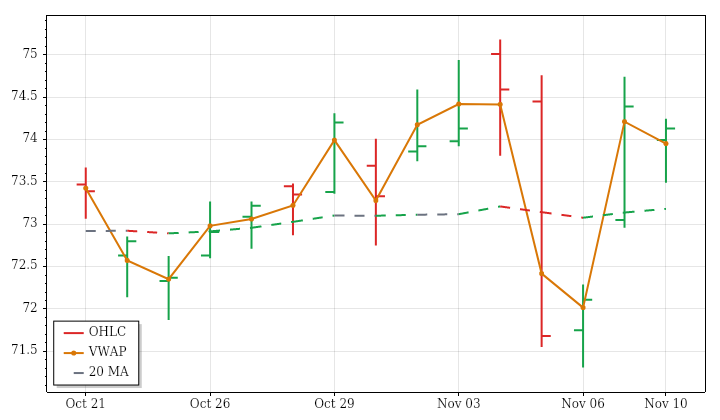
IJH – Mid Cap Technicals Summary
IJH's completed daily session on November 10 closed at 74.13, down 0.35% from the prior close but up 0.18% from the open. Its opening gap down remained unfilled, although the close above VWAP and toward the session high reflected an intraday recovery. The entire session stayed within the previous day's range, leaving the daily structure contained rather than directionally expanded.
Price remained above rising near- and far-term averages, but the intermediate-term average was falling beneath it. The broader setup was therefore partly positive, not uniformly aligned. The modest upward 15-session price trend also contained considerable back-and-forth movement. Both range and volume were below average on the latest day, unlike their expanding and increasing lookback trends. PSAR was bearish and ATR-median crossed into a bearish state, conflicting with the rising averages. A next-session high above 74.74 would conditionally reverse PSAR upward.
DIA · D:2026-11-10 NC% ▼ -0.31% OC% ▲ +0.04%
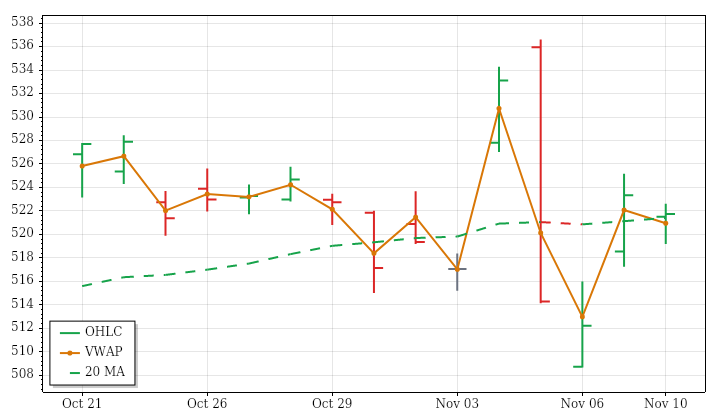
DIA – Dow Jones Technicals Summary
DIA's completed daily session on November 10 ended at 521.73, down 0.31% from the prior close despite edging 0.04% above its opening price. The opening gap down remained unfilled. Trading stayed within the previous day's range, and the close above VWAP showed some intraday recovery, but little net progress from the open. This was a contained session rather than a decisive directional move.
The broader picture remained divided: price was above a falling near-term average while intermediate- and far-term averages continued rising beneath it. Meanwhile, the 15-session price trend was downward and inefficient, indicating choppy weakness rather than a steady decline. The day's range was only about 56% of average and volume was below average, contrasting with expanding ranges and increasing volume across the lookback. PSAR remained bearish; a next-session high above 531.2914 would conditionally trigger an upward reversal.
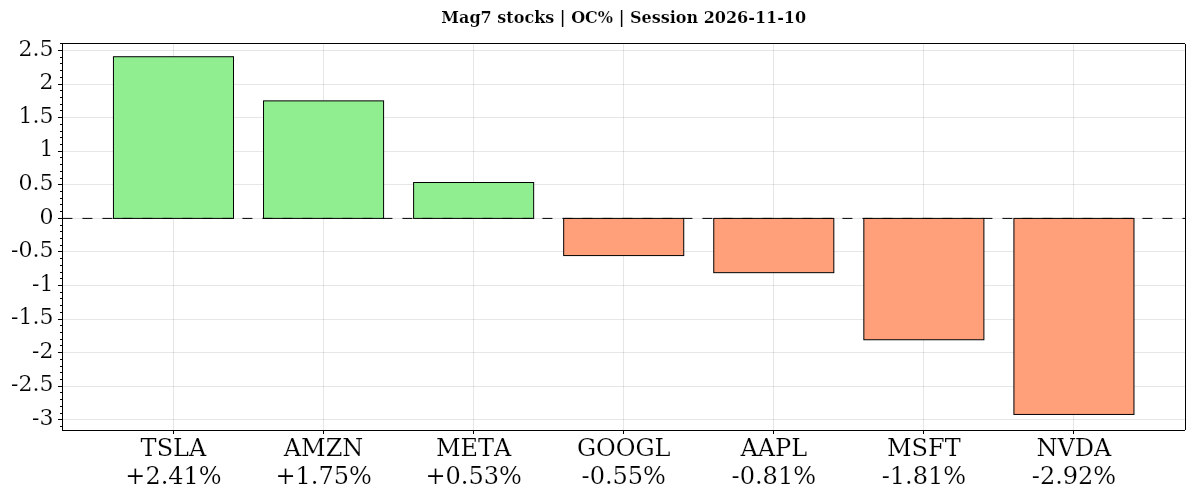
| Instrument | Bias | Date | DNC% | DOC% | O | H | L | C | VWAP | Vol |
|---|---|---|---|---|---|---|---|---|---|---|
| ▲ TSLA | ▲ ▲ ▲ | 2026-11-10 | ▲ +0.46% | ▲ +2.41% | 370.85 | 380.00 | 370.40 | 379.78 | ▲ 377.04 | 23,965,494 |
| ▲ AMZN | ▲ ▲ ▲ | 2026-11-10 | ▲ +1.48% | ▲ +1.75% | 266.21 | 272.88 | 266.14 | 270.87 | ▲ 270.42 | 38,132,604 |
| ▲ META | ▲ ▲ ▼ | 2026-11-10 | ▲ 0.00% | ▲ +0.53% | 637.98 | 647.27 | 635.50 | 641.39 | ▼ 641.69 | 12,770,035 |
| ▼ GOOGL | ▼ ▼ ▼ | 2026-11-10 | ▼ -0.27% | ▼ -0.55% | 288.98 | 292.02 | 285.68 | 287.38 | ▼ 288.10 | 28,296,530 |
| ▼ AAPL | ▼ ▼ ▼ | 2026-11-10 | ▼ -0.62% | ▼ -0.81% | 351.35 | 353.87 | 346.46 | 348.51 | ▼ 348.63 | 28,261,340 |
| ▼ MSFT | ▼ ▼ ▼ | 2026-11-10 | ▼ -2.20% | ▼ -1.81% | 542.98 | 544.19 | 526.37 | 533.16 | ▼ 535.23 | 25,940,779 |
| ▼ NVDA | ▼ ▼ ▼ | 2026-11-10 | ▼ -5.47% | ▼ -2.92% | 173.97 | 174.69 | 165.89 | 168.89 | ▼ 169.29 | 422,598,531 |
| AVG/Sum | — | — | -0.95% | -0.20% | — | — | — | — | — | 579,965,313 |
Mag7 Stocks
Negative confluence: average DNC% -0.95% versus the prior close, DOC% -0.20% from the open. Three gained from the open, led by Tesla, while Nvidia lagged; Amazon led versus the prior close, Nvidia fell 5.47%, and Meta was effectively flat. Nvidia’s weakness aligned with near- and intermediate-term downtrends on well-above-average volume.
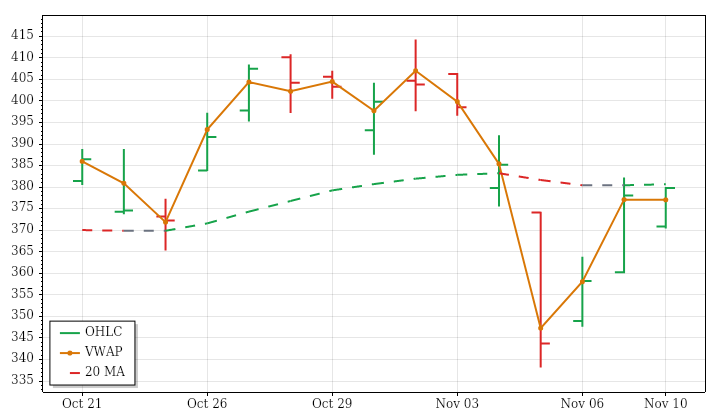
TSLA · D:2026-11-10 NC% ▲ +0.46% OC% ▲ +2.41%
TSLA – Tesla Technicals Summary
TSLA's completed daily session on November 10 closed at 379.78, up 0.46% from the prior close and 2.41% from the open. The stronger intraday return reflected recovery from an opening gap down, which was filled. Price finished above VWAP and toward the session high, but the entire day remained within the previous day's range, limiting the structural significance of the rebound.
Near- and intermediate-term averages were rising beneath price, aligning with the latest recovery. The far-term average was still falling despite price trading above it, leaving longer-term alignment incomplete. The 15-session price trend remained downward and highly inefficient, another distinction from the positive session. Range and volume were substantially below average despite rising lookback trends in both. PSAR and ATR-median remained bearish, conflicting with the shorter averages. A next-session high above 390.8392 would conditionally trigger an upward PSAR reversal.
Tesla News and Fundamentals
Tesla’s October retail sales in China fell to their lowest level since 2022, marking a deterioration in sales in that market ahead of year-end.
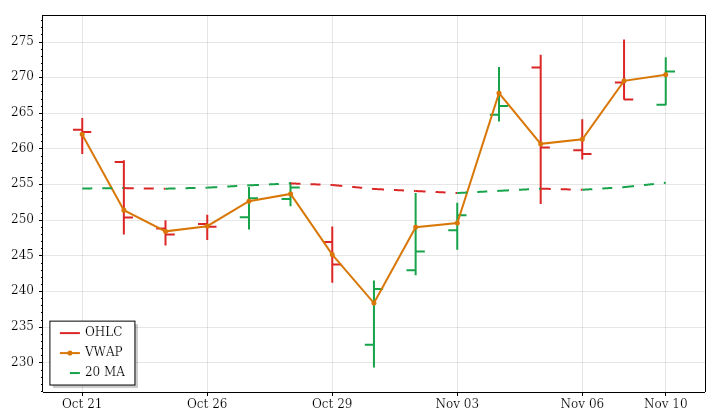
AMZN · D:2026-11-10 NC% ▲ +1.48% OC% ▲ +1.75%
AMZN – Amazon Technicals Summary
AMZN's completed November 10 daily session recovered from an opening gap down to close at 270.87, gaining 1.48% versus the prior close and 1.75% from the open. It finished above VWAP, but the recovery stayed inside the previous day's range after recording a lower high and lower low. That combination describes an intraday rebound without an accompanying upward expansion of the daily structure.
Price stood above the near- and intermediate-term averages, yet both averages were still falling, leaving those horizons mixed rather than fully aligned upward. The far-term average remained rising beneath price. The 15-session trend was positive but highly choppy, so the latest gain did not resolve that conflict. Range and volume were below average despite expanding ranges and increasing volume over the lookback. A next-session low below 252.7855 would conditionally reverse the upward PSAR state.
Amazon News and Fundamentals
Amazon Web Services grew 39.3% last quarter, its fastest pace in nearly five years, and had a $578 billion backlog alongside a roughly $220 billion spending plan. Heavy spending is putting pressure on cash flow. On November 10, Ring unveiled a $250 indoor security drone that investigates suspicious activity and captures nighttime footage, plus a patrolling robot for businesses. Amazon also announced dates for its Black Friday and Cyber Monday deals.
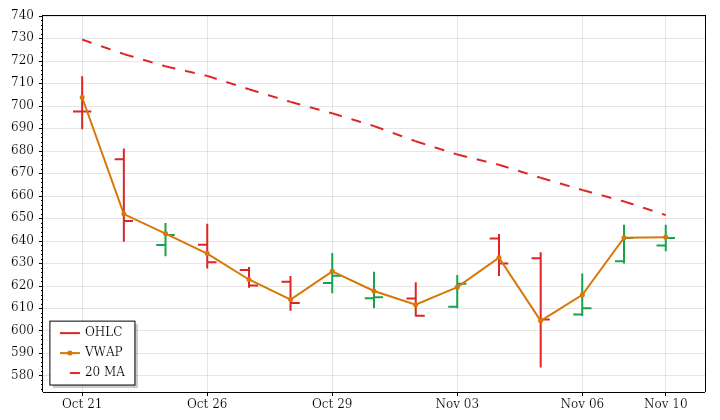
META · D:2026-11-10 NC% ▲ 0.00% OC% ▲ +0.53%
META – Meta Platforms Technicals Summary
META's completed daily session on November 10 closed at 641.39, essentially unchanged from the prior close but up 0.53% from the open. The opening gap down was filled, and the session produced a higher high and higher low. However, price finished inside the prior day's range and slightly below VWAP, so the recovery did not establish an unambiguously strong closing position.
Price was above a falling near-term average, below a falling intermediate-term average and above a rising far-term average. Those conflicting horizons placed the rebound within a broader, uneven correction rather than a fully aligned uptrend. The latest range was well below average and volume was less than half its average. Across the 15-session lookback, ranges were expanding but volume was decreasing. A fresh upward PSAR state contrasted with the bearish ATR-median trend; a next-session low below 586.9738 would conditionally reverse PSAR downward.
Meta News and Fundamentals
Meta announced on November 9 that its Muse AI agent was launching on Apple Watch and Android Wear OS. Users can interact with the assistant directly from their smartwatches through voice calls, text messages or dictation. Separately, a $9.89 billion legal charge weighed heavily on earnings despite strong advertising growth, and shares fell sharply following the results.
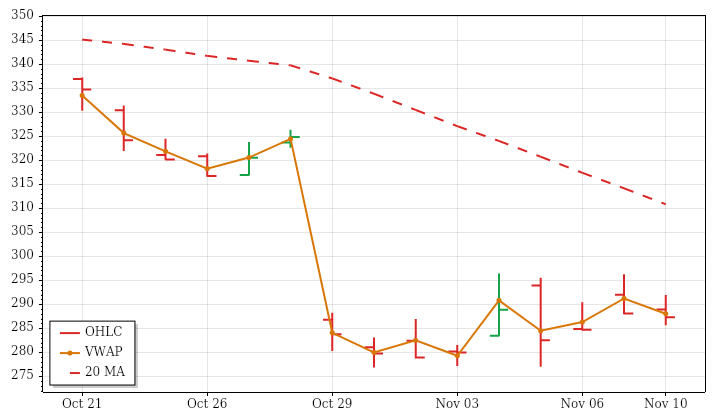
GOOGL · D:2026-11-10 NC% ▼ -0.27% OC% ▼ -0.55%
GOOGL – Alphabet Technicals Summary
GOOGL's completed daily session on November 10 closed at 287.38, down 0.27% from the prior close and 0.55% from the open. An opening gap up was filled, and the session subsequently registered a lower high and lower low. Finishing below both the prior day's low and VWAP reinforced the weak daily structure, even though the percentage decline itself was modest.
Price remained just above its sharply falling near-term average, leaving that horizon mixed rather than establishing an uptrend. Intermediate- and far-term averages were falling well above price, consistent with the pronounced downward 15-session trend. The latest range and volume were below average, contrasting with expanding ranges and increasing volume through that lookback. A fresh upward PSAR state conflicted with the broader weakness, while the ATR-median trend remained bearish. A next-session low below 277.8905 would conditionally trigger a downward PSAR reversal.
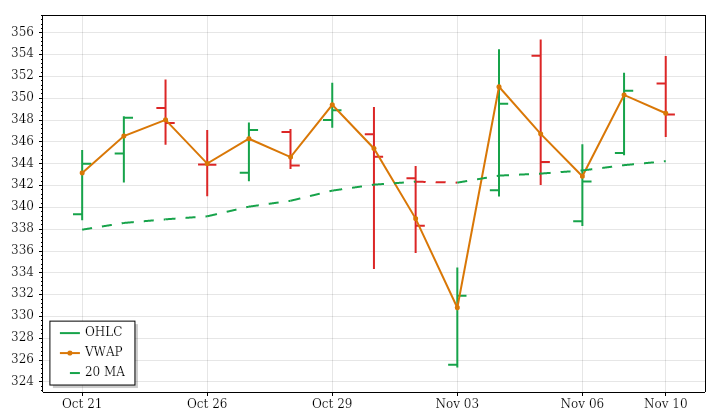
AAPL · D:2026-11-10 NC% ▼ -0.62% OC% ▼ -0.81%
AAPL – Apple Technicals Summary
AAPL's completed daily session on November 10 closed at 348.51, down 0.62% from the prior close and 0.81% from the open. The opening gain was erased, although the session produced a higher high and higher low. Trading crossed both sides of the open before finishing inside the previous day's range and slightly below VWAP, making this a retreat rather than a clean continuation higher.
That weakness contrasted with rising near-, intermediate- and far-term averages, with price still above all three. The broader alignment therefore remained positive, but the nearly flat, inefficient 15-session advance showed substantial back-and-forth movement. The day's range was near average, while volume was only about 55% of average, despite expanding ranges and increasing volume across the lookback. PSAR remained upward; a next-session low below 334.5689 would conditionally trigger a bearish reversal.
Apple News and Fundamentals
Apple received China AI approval, while rising memory costs were identified as a risk to margins. Reports also described Services, share buybacks and a new CEO as changes reshaping the business.
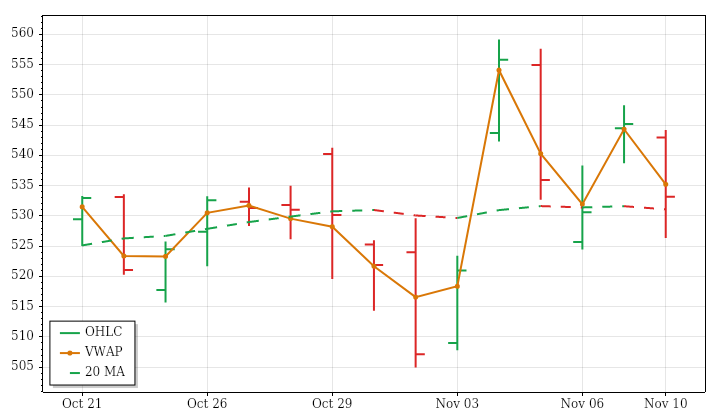
MSFT · D:2026-11-10 NC% ▼ -2.20% OC% ▼ -1.81%
MSFT – Microsoft Technicals Summary
MSFT's completed November 10 daily session closed at 533.16, down 2.20% versus the prior close and 1.81% from the open. The opening gap down remained unfilled, and further selling produced a lower high, lower low and close below the previous day's low. Finishing below VWAP reinforced the weak session, while the range expanded to roughly 130% of average.
The decline aligned with a falling near-term average above price but conflicted with rising intermediate- and far-term averages still beneath it. Thus, shorter-term deterioration remained embedded in a longer-term upward structure. The 15-session advance had been inefficient and choppy, rather than consistently directional. Volume was slightly below average despite the large range, contrasting with the lookback's increasing-volume trend. PSAR and ATR-median still retained upward states; a next-session low below 515.0119 would conditionally trigger a bearish PSAR reversal.
Microsoft News and Fundamentals
Microsoft and Ohio State University announced a five-year strategic partnership on November 10 covering healthcare, education and research. The collaboration will modernize cloud and data infrastructure, apply AI to support clinicians and researchers, and expand access to AI skills and certifications. Separately, reporting identified Azure growth and rising AI adoption as business drivers, alongside increasing capital spending and margin pressure.
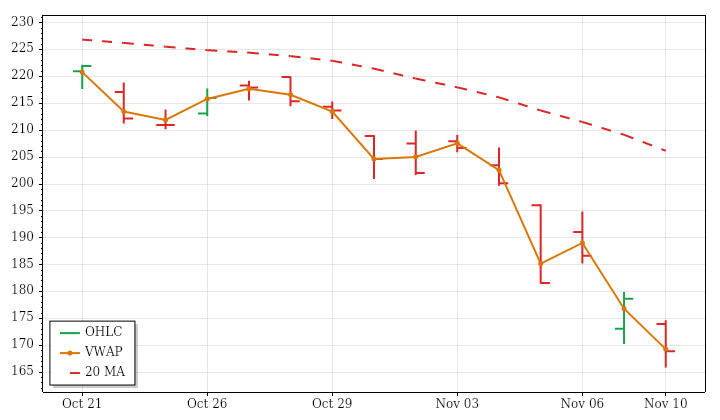
NVDA · D:2026-11-10 NC% ▼ -5.47% OC% ▼ -2.92%
NVDA – Nvidia Technicals Summary
NVDA's completed daily session on November 10 closed at 168.89, falling 5.47% from the prior close and 2.92% from the open. The opening gap down remained unfilled, and the session extended the decline with a lower high, lower low and close below the previous day's low. Price also finished below VWAP. This was the fifth consecutive large-range session, with volume nearly three times average, distinguishing the move from a low-participation retreat.
The latest weakness aligned with falling near- and intermediate-term averages well above price. The far-term average was still rising slightly, but price traded below it, leaving that horizon mixed rather than supportive through price position. Expanding ranges and increasing volume across the 15-session lookback reinforced the distinction between this decline and quieter consolidation. PSAR and ATR-median remained bearish. A next-session high above 195.5961 would conditionally trigger an upward PSAR reversal.
Nvidia News and Fundamentals
Nvidia’s board announced an independent investigation on November 8 following reports that CEO Jensen Huang was targeted by a Chinese espionage operation. Wachtell Lipton will lead the inquiry. A shareholder lawsuit filed November 9 alleges Nvidia and Huang misled investors about the matter. Separately, a report alleged that Alice Huang used Nvidia connections to help obtain restricted processors through a network facilitating $7.5 billion in shipments to China. An analyst said the controversy was increasing momentum for tougher chip-export legislation.
| Instrument | Bias | Date | DNC% | DOC% | O | H | L | C | VWAP | Vol |
|---|---|---|---|---|---|---|---|---|---|---|
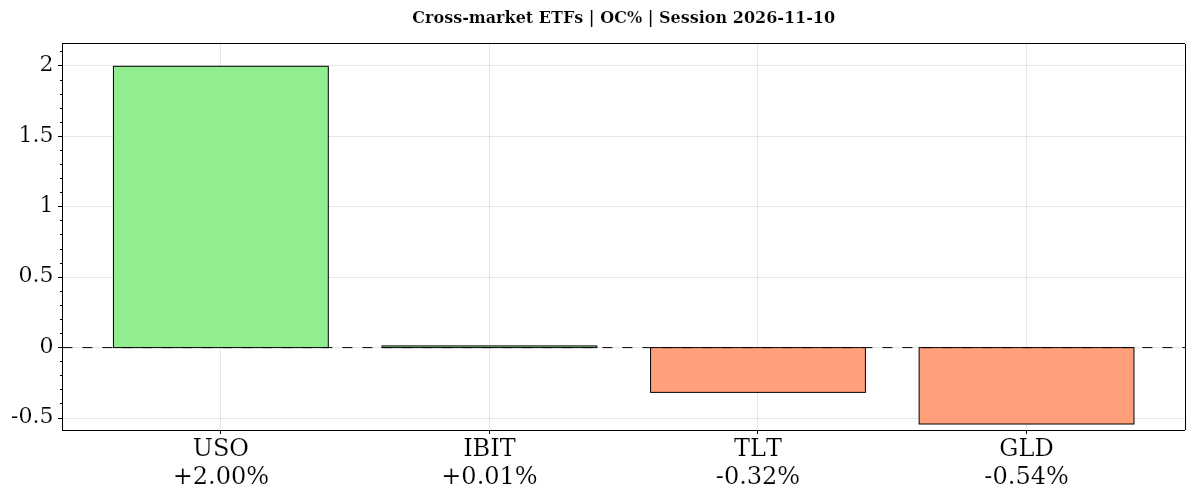
| ▲ USO | ▼ ▲ ▲ | 2026-11-10 | ▼ -0.85% | ▲ +2.00% | 138.68 | 142.62 | 138.47 | 141.45 | ▲ 140.76 | 4,020,670 |
| ▲ IBIT | ▼ ▲ ▲ | 2026-11-10 | ▼ -1.51% | ▲ +0.01% | 41.67 | 42.28 | 41.10 | 41.68 | ▲ 41.59 | 39,111,125 |
| ▼ TLT | ▼ ▼ ▲ | 2026-11-10 | ▼ -1.32% | ▼ -0.32% | 81.14 | 81.17 | 80.54 | 80.88 | ▲ 80.84 | 39,058,043 |
| ▼ GLD | ▼ ▼ ▼ | 2026-11-10 | ▼ -2.68% | ▼ -0.54% | 371.38 | 371.88 | 367.80 | 369.36 | ▼ 369.72 | 7,882,214 |
| AVG/Sum | — | — | -1.59% | +0.29% | — | — | — | — | — | 90,072,052 |
Cross-Market ETFs
Mixed: average DNC% -1.59% versus the prior close, DOC% +0.29% from the open. Oil led from the open, bitcoin was nearly flat, and gold lagged; all four declined versus the prior close, offering no positive daily divergence from equities. Gold’s moving-average downtrends aligned across horizons, while bonds fell despite an intermediate-term uptrend.
USO · D:2026-11-10 NC% ▼ -0.85% OC% ▲ +2.00%
USO – Oil Technicals Summary
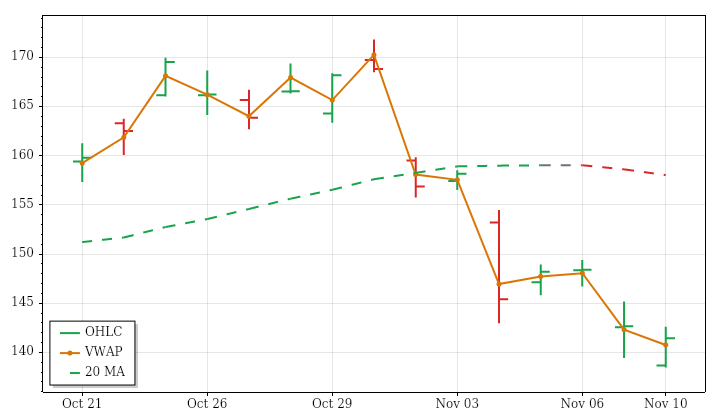
USO's completed November 10 daily session closed at 141.45, down 0.85% versus the prior close despite gaining 2.00% from the open. The large opening gap down remained unfilled. Although price recovered above VWAP and finished inside the previous day's range, the session still recorded a lower high and lower low. The intraday rebound therefore softened, but did not erase, the weaker daily outcome.
The near-term average was falling above price, while the intermediate-term average was rising above it. Price remained above a rising far-term average, preserving longer-term strength alongside shorter-term weakness and a downward 15-session trend. The latest range was near average and volume below average, contrasting with modest lookback increases in both. PSAR and ATR-median remained bearish despite the recovery from the open. A next-session high above 158.5033 would conditionally trigger an upward PSAR reversal.
Oil News and Fundamentals
Oil prices fell to their lowest levels since late August on November 10 after Donald Trump said the war on Iran was “effectively over.” Reporting attributed the decline to market relief following his comments. Benchmark oil briefly traded below $90 a barrel for the first time since August, while Brent returned to late-August levels.
IBIT · D:2026-11-10 NC% ▼ -1.51% OC% ▲ +0.01%
IBIT – Bitcoin Technicals Summary
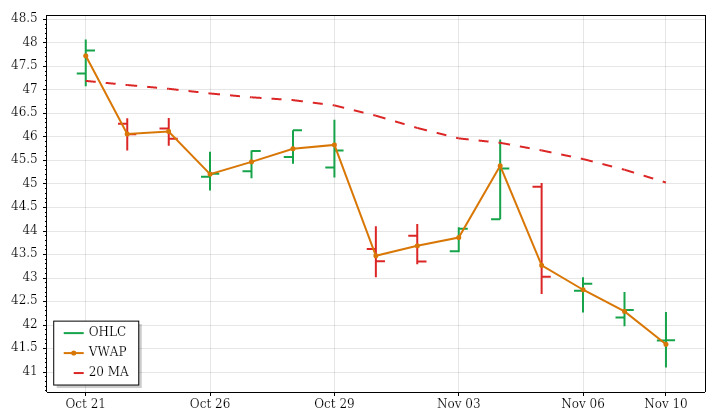
IBIT's completed November 10 daily session ended at 41.68, down 1.51% versus the prior close but essentially unchanged from the open. The loss was concentrated in an unfilled opening gap down. Although trading crossed both sides of the open and finished above VWAP, the session made a lower high and lower low and closed below the previous day's low. The intraday stabilization therefore did not erase the weaker daily structure.
Near- and intermediate-term averages were falling above price, while the far-term average was still rising slightly below it. This left shorter-horizon weakness within a longer-term upward structure. The day's range was about 119% of average, consistent with lookback range expansion, but volume remained below average despite its rising 15-session trend. Both PSAR and ATR-median remained bearish. A next-session high above 43.988 would conditionally trigger an upward PSAR reversal.
TLT · D:2026-11-10 NC% ▼ -1.32% OC% ▼ -0.32%
TLT – Long-Term Treasury Bonds Technicals Summary
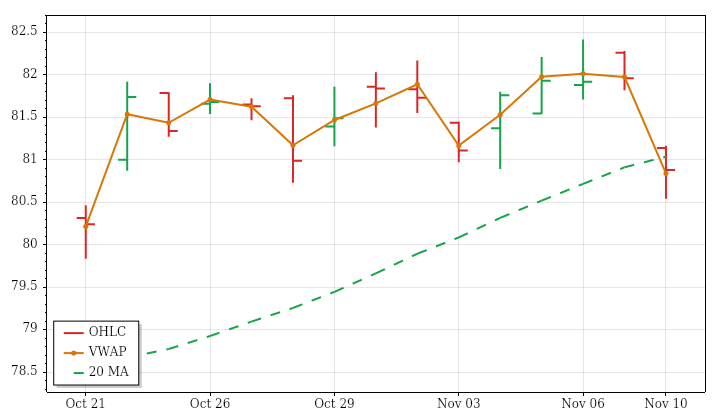
TLT's completed November 10 daily session closed at 80.88, down 1.32% from the prior close and 0.32% from the open. Most of the loss occurred through an opening gap down that remained unfilled. The session made a lower high and lower low, breached the prior inside-bar low and finished below the previous day's low. A close slightly above VWAP provided a limited intraday counterpoint, not a reversal of that daily weakness.
Price fell below its rising near-term average while remaining above the rising intermediate-term average and below the falling far-term average. The latest decline thus interrupted the positive 15-session trend within an already divided multi-horizon structure. Range was near average and volume modestly above average, broadly consistent with slight lookback increases. PSAR entered a short state while ATR-median remained upward. A next-session high above 82.415 would conditionally reverse PSAR upward.
GLD · D:2026-11-10 NC% ▼ -2.68% OC% ▼ -0.54%
GLD – Gold Technicals Summary
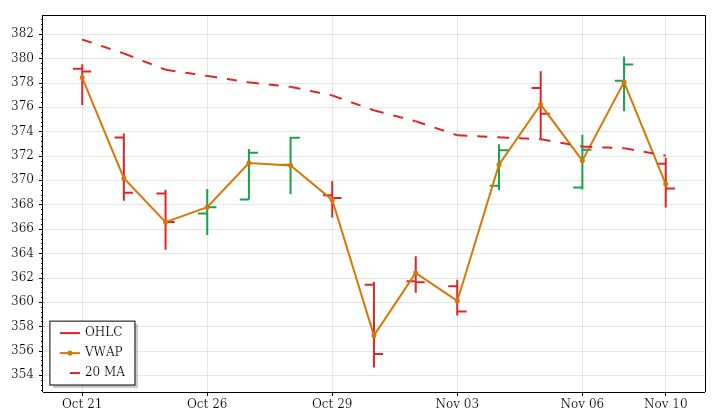
GLD's completed November 10 daily session closed at 369.36, losing 2.68% versus the prior close but only 0.54% from the open. Most of the decline therefore came through the opening gap down, which remained unfilled. A lower high and lower low, followed by a close below the previous day's low and below VWAP, kept the session's technical emphasis on weakness despite trading on both sides of the open.
Near-, intermediate- and far-term averages were all falling above price, aligning the latest decline with the broader trend structure. The 15-session price path nevertheless showed almost no directional efficiency, distinguishing this aligned average structure from a smooth lookback decline. The day's range was near average and volume below average, despite modest lookback increases in both. PSAR still showed an upward state in conflict with the averages; a next-session low below 363.3603 would conditionally reverse it.
Gold News and Fundamentals
Gold fell about 2% on November 10 after hotter-than-expected U.S. CPI increased concerns about a December Federal Reserve rate hike. Reports linked the pressure to rising Treasury yields and a stronger dollar. Meanwhile, central banks continued adding gold reserves at lower prices following a busy third quarter, with China extending its purchases to two consecutive years. Federal Reserve economist Colin Weiss said European gold repatriations had had little impact on those countries’ dollar reserve allocations.
Glossary: Instrument — ticker symbol; hover for the instrument or company name; Date — session date. DNC% — prior-session close to this session’s close; DOC% — daily session open-to-close percentage change. O — open; H — high; L — low; C — close, all for the table’s daily or weekly session; VWAP — volume-weighted average price; its arrow shows whether the close is above or below VWAP. Vol — period trading volume.
Bias — three directional readings, in order: DNC%, DOC%, then VWAP. ▲ positive/above; ▼ negative/below; — neutral or unavailable. Matching arrows show alignment; opposing arrows show mixed conditions. AVG/Sum — simple average of percentage changes and sum of reported volumes.
Futures Session Fib Grid Analysis – Snapshot
Session Fib Grids normalise market positioning as percentages, making direction and alignment comparable across different asset types.
Latest available snapshot for each instrument; Time(CT) shows the individual update date and time.
| Instrument | Bias | Time(CT) | YSFG | MSFG | WSFG | RSFG | SFG | TSI |
|---|---|---|---|---|---|---|---|---|
| ▲ ES | ▲ ▼ ▲ ▲ ▲ ▲ | 2026-11-10 15:59:54 | ▲ +39 | ▼ -23 | ▲ +69 | ▲ +22 | ▲ +22 | ▲ +50 |
| ▲ NQ | ▲ ▼ ▲ ▲ ▲ ▲ | 2026-11-10 15:59:58 | ▲ +29 | ▼ -27 | ▲ +53 | ▲ +19 | ▲ +19 | ▲ +73 |
| ▲ YM | ▲ ▲ ▲ ▲ ▲ ▲ | 2026-11-10 15:59:55 | ▲ +32 | ▲ +17 | ▲ +58 | ▲ +6 | ▲ +6 | ▲ +18 |
| ▲ EMD | ▲ ▲ ▲ ▲ ▲ ▲ | 2026-11-10 15:56:04 | ▲ +41 | ▲ +27 | ▲ +85 | ▲ +17 | ▲ +17 | ▲ +92 |
| ▲ RTY | ▲ ▲ ▲ ▲ ▲ ▲ | 2026-11-10 15:59:57 | ▲ +39 | ▲ +2 | ▲ +71 | ▲ +17 | ▲ +17 | ▲ +68 |
| ▲ FDAX | ▲ ▲ ▲ ▲ ▲ ▲ | 2026-11-10 15:03:32 | ▲ +45 | ▲ +56 | ▲ +100 | ▲ +2 | ▲ +5 | ▲ +87 |
| ▼ NKD | ▲ ▼ ▲ ▼ ▲ ▲ | 2026-11-10 15:59:43 | ▲ +114 | ▼ -30 | ▲ +41 | ▼ -31 | ▲ +6 | ▲ +26 |
| Instrument | Bias | Time(CT) | YSFG | MSFG | WSFG | RSFG | SFG | TSI |
|---|---|---|---|---|---|---|---|---|
| ▼ BTC | ▼ ▼ ▼ ▼ ▲ ▲ | 2026-11-10 15:58:58 | ▼ -61 | ▼ -28 | ▼ -39 | ▼ -16 | ▲ +5 | ▲ +35 |
| ▼ GC | ▼ ▲ ▼ ▼ ▼ ▼ | 2026-11-10 15:59:40 | ▼ -138 | ▲ +36 | ▼ -16 | ▼ -48 | ▼ -21 | ▼ -23 |
| ▲ CL | ▲ ▼ ▼ ▲ ▲ ▲ | 2026-11-10 15:59:59 | ▲ +145 | ▼ -84 | ▼ -43 | ▲ +44 | ▲ +39 | ▲ +59 |
| ▼ 6E | ▼ ▲ ▲ ▼ ▼ ▼ | 2026-11-10 15:59:59 | ▼ -60 | ▲ +2 | ▲ +13 | ▼ -69 | ▼ -40 | ▼ -28 |
| ▼ ZB | ▼ ▼ ▼ ▼ ▼ ▼ | 2026-11-10 15:59:57 | ▼ -34 | ▼ -11 | ▼ -50 | ▼ -117 | ▼ -25 | ▼ -39 |
Glossary: YSFG — yearly; MSFG — monthly; WSFG — weekly; RSFG — regular trading hours (RTH); SFG — the current session, including pre-market or other sessions. TSI indicates trend strength and power.
Bias shows trend alignment across these six readings. The arrows follow the column order: YSFG, MSFG, WSFG, RSFG, SFG and TSI. Matching arrows show alignment; opposing arrows show mixed conditions.
Futures Higher Time Frame Analysis
Summary of the current state of US Indices Futures based on higher time-frame (HTF) technical analysis as of: 2026-11-10 16:00 -05:00 CT.
US Indices Futures
- ES YSFG/WSFG above centers, MSFG below, daily intermediate benchmarks declining, daily UTrend/weekly DTrend pivots, support 7322.25, resistance 7600.50/7683.25/7906.25.
- NQ YSFG/WSFG above centers, MSFG below, daily 10–100 benchmarks declining, daily UTrend/weekly DTrend pivots, support 26366.50–26368.50, resistance 28129.25/28789.00/31616.50.
- YM YSFG/MSFG/WSFG above centers, rising long-term benchmarks, daily UTrend/weekly DTrend pivots, support 50859–51054, weekly reversal 53377, resistance 53631/54259/55316.
- EMD YSFG/MSFG/WSFG above centers, daily 55/100 benchmarks declining, daily UTrend/weekly DTrend pivots, support 3560.7/3618.0/3705.5, resistance 3742.2–3773.1/3996.6.
- RTY YSFG/MSFG/WSFG above centers, rising weekly long-term benchmarks, daily UTrend/weekly DTrend pivots, support 2714.2/2754.6, resistance 2862.2/2888.7/2906.0/3101.8.
- FDAX YSFG/MSFG/WSFG above centers, daily benchmarks rising, daily pivot/HiLo UTrend, recent weekly-grid/monthly-grid short signals, support 24925/25895, daily reversal 25815, resistance 26721–26847.
Overall State
- Short-Term: Bullish
- Intermediate-Term: Neutral
- Long-Term: Bullish
Conclusion
Daily UTrend pivots and rebounds above WSFG centers show aligned short-term recoveries, while ES, NQ, YM, EMD, and RTY retain weekly DTrend pivots. Intermediate alignment remains divided: ES and NQ remain below MSFG centers with declining daily benchmarks; YM and EMD retain bullish ratings, while RTY remains mixed. FDAX shows the broadest directional alignment through daily pivot/HiLo UTrends and rising benchmarks, despite recent weekly WSFG/MSFG short signals. Yearly grids and weekly long-term benchmarks preserve the broader bullish structure, with daily NQ and RTY long-term ratings neutral. Overhead swing pivots remain the principal resistance references.
Note: Intra-day counter-trend pullbacks or retracements may occur, HTF is context for informational usage and market structure. Glossary: Session Fib Grids periods of YSFG:’Yearly’, MSFG:’Monthly’, WSFG:’Weekly’
For full details visit: AlphaWebTrader Technicals
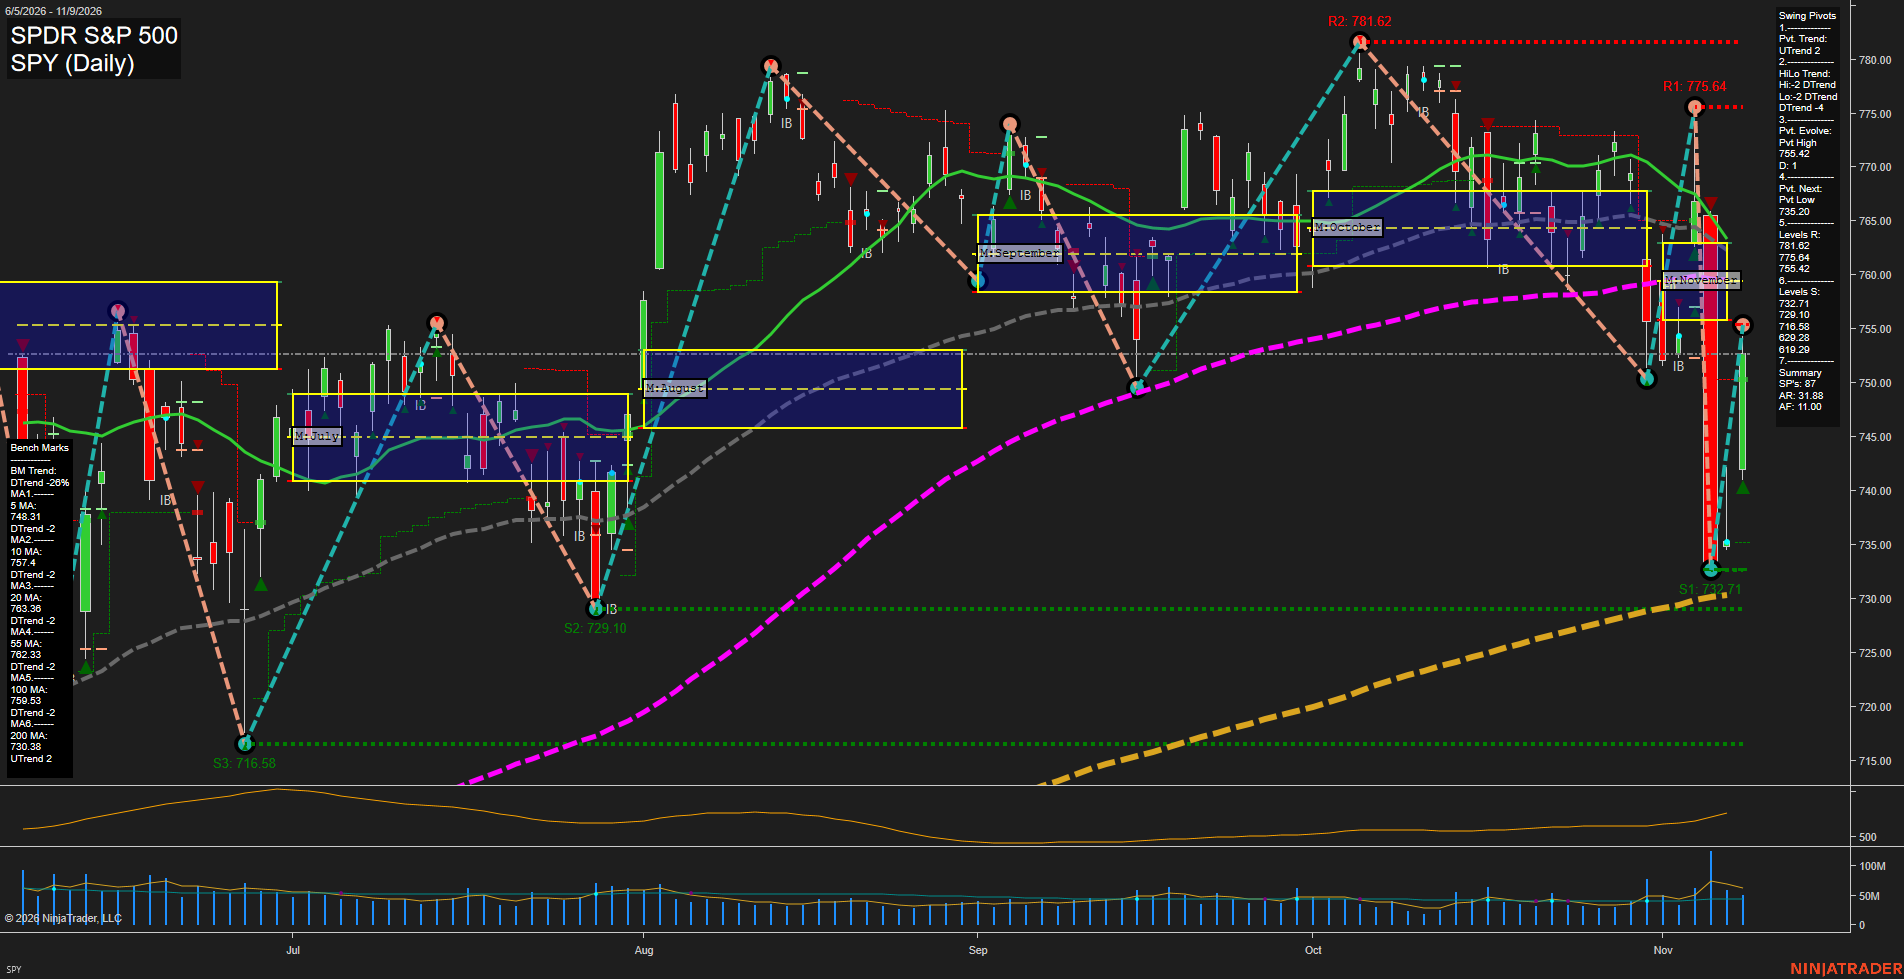
SPY Daily View
Overall Rating
- Short-Term: Neutral
- Intermediate-Term: Bearish
- Long-Term: Neutral.
Key Insights Summary
SPY shows a high-volatility V-recovery following a sharp November selloff, with price rebounding above the 5-day benchmark but remaining beneath the declining 10-, 20-, 55-, and 100-day averages. The short-term pivot has shifted to UTrend, yet the intermediate HiLo structure remains DTrend and the active pivot-high resistance at 755.42 is immediately overhead. From a futures swing perspective, the 755.42 to 763.38 area is the principal rebound and moving-average supply zone, while 732.71 to 729.10 remains the major downside support band. The elevated ATR confirms unusually wide daily ranges and fast momentum, while the rising 200-day average preserves the broader long-term support structure.
View charts on: AlphaWebTrader HTF Charts
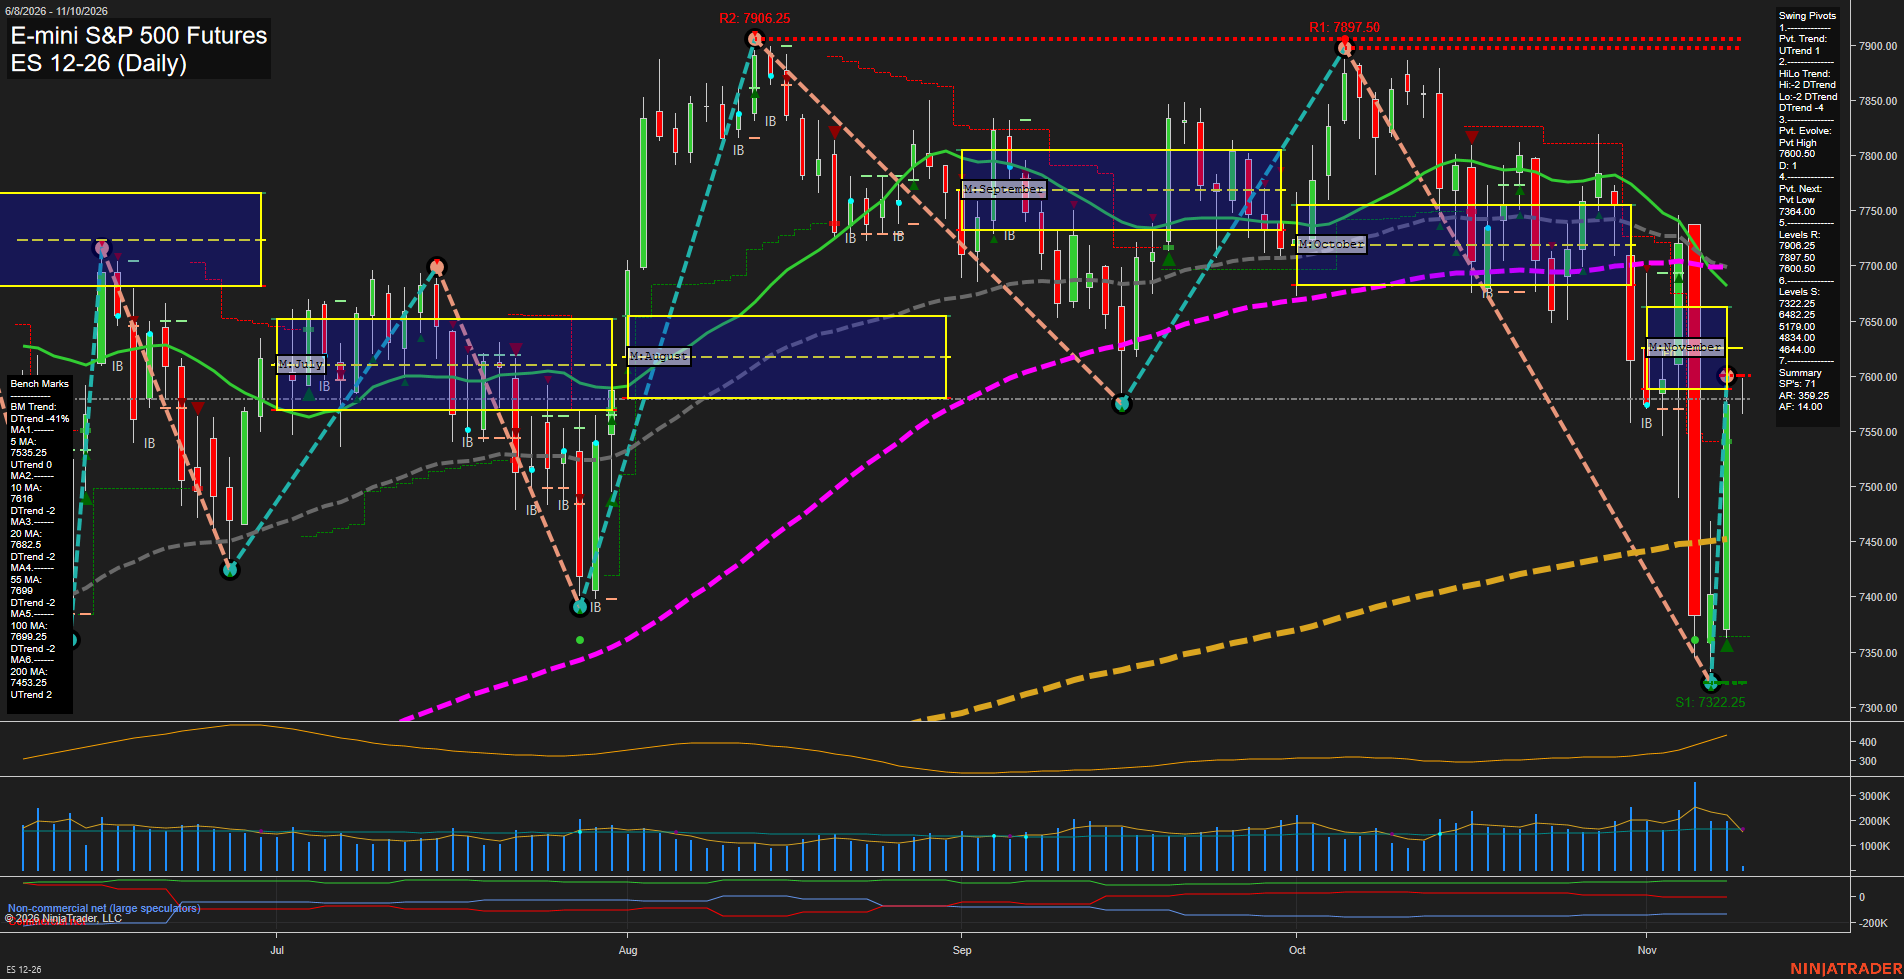
ES Daily View
Overall Rating
- Short-Term: Bullish
- Intermediate-Term: Bearish
- Long-Term: Bullish.
Key Insights Summary
The daily chart reflects a high-volatility V-shaped rebound from the 7322.25 swing-low support area, producing fast upside momentum and restoring the short-term pivot trend to UTrend. Price is above the weekly Fib-grid center zone and the rising 5-day benchmark, while the 10-day average near 7616.00 and the evolving pivot-high level at 7600.50 define nearby short-term overhead structure. Intermediate structure remains counter-trend bearish: price is below the November MSFG center bias and beneath declining 20-, 55-, and 100-day benchmarks clustered from 7682.50 to 7699.25. The broader yearly Fib-grid bias and rising 200-day average remain constructive, framing the recent decline as a sharp retracement within a still-positive long-term structure. The 7600.50 area is the immediate pivot reference, followed by resistance near 7897.50-7906.25, while 7322.25 remains the major daily swing-support reference.
View charts on: AlphaWebTrader HTF Charts
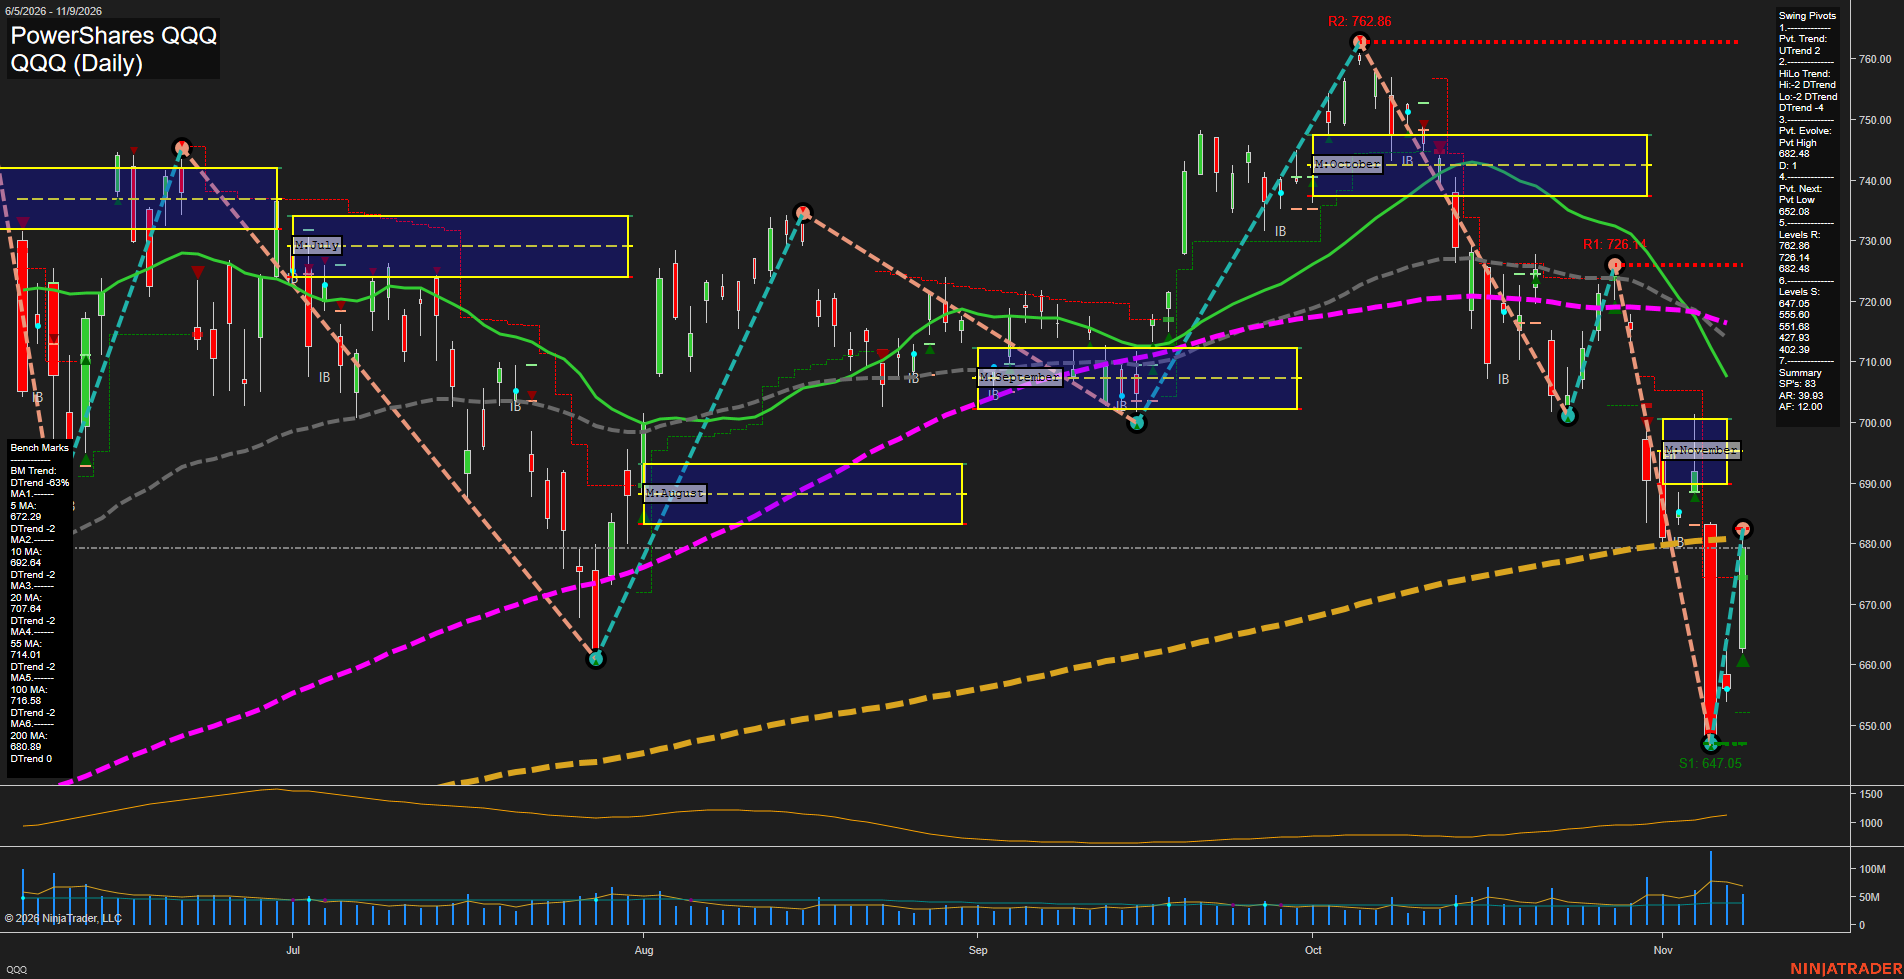
QQQ Daily View
Overall Rating
- Short-Term: Bearish
- Intermediate-Term: Bearish
- Long-Term: Neutral.
Key Insights Summary
QQQ is exhibiting a high-volatility futures-style swing environment following a sharp washout into the 647.05 pivot-support area and a fast rebound toward 682.48. The short-term pivot designation has turned upward, but the broader HiLo structure remains in a downtrend, characterizing the bounce as a countertrend recovery within an intermediate bearish sequence of lower highs. Price remains below the declining 10-, 20-, 55-, and 100-day benchmarks, while the 200-day average near 680.89 is acting as the principal long-term balance reference. The 682.48 pivot is the immediate overhead decision level, with 726.14 the next major resistance; 647.05 remains the defining downside swing support. Elevated ATR and expanded volume reflect a repricing phase with wide daily ranges, rapid retracements, and unstable directional control.
View charts on: AlphaWebTrader HTF Charts
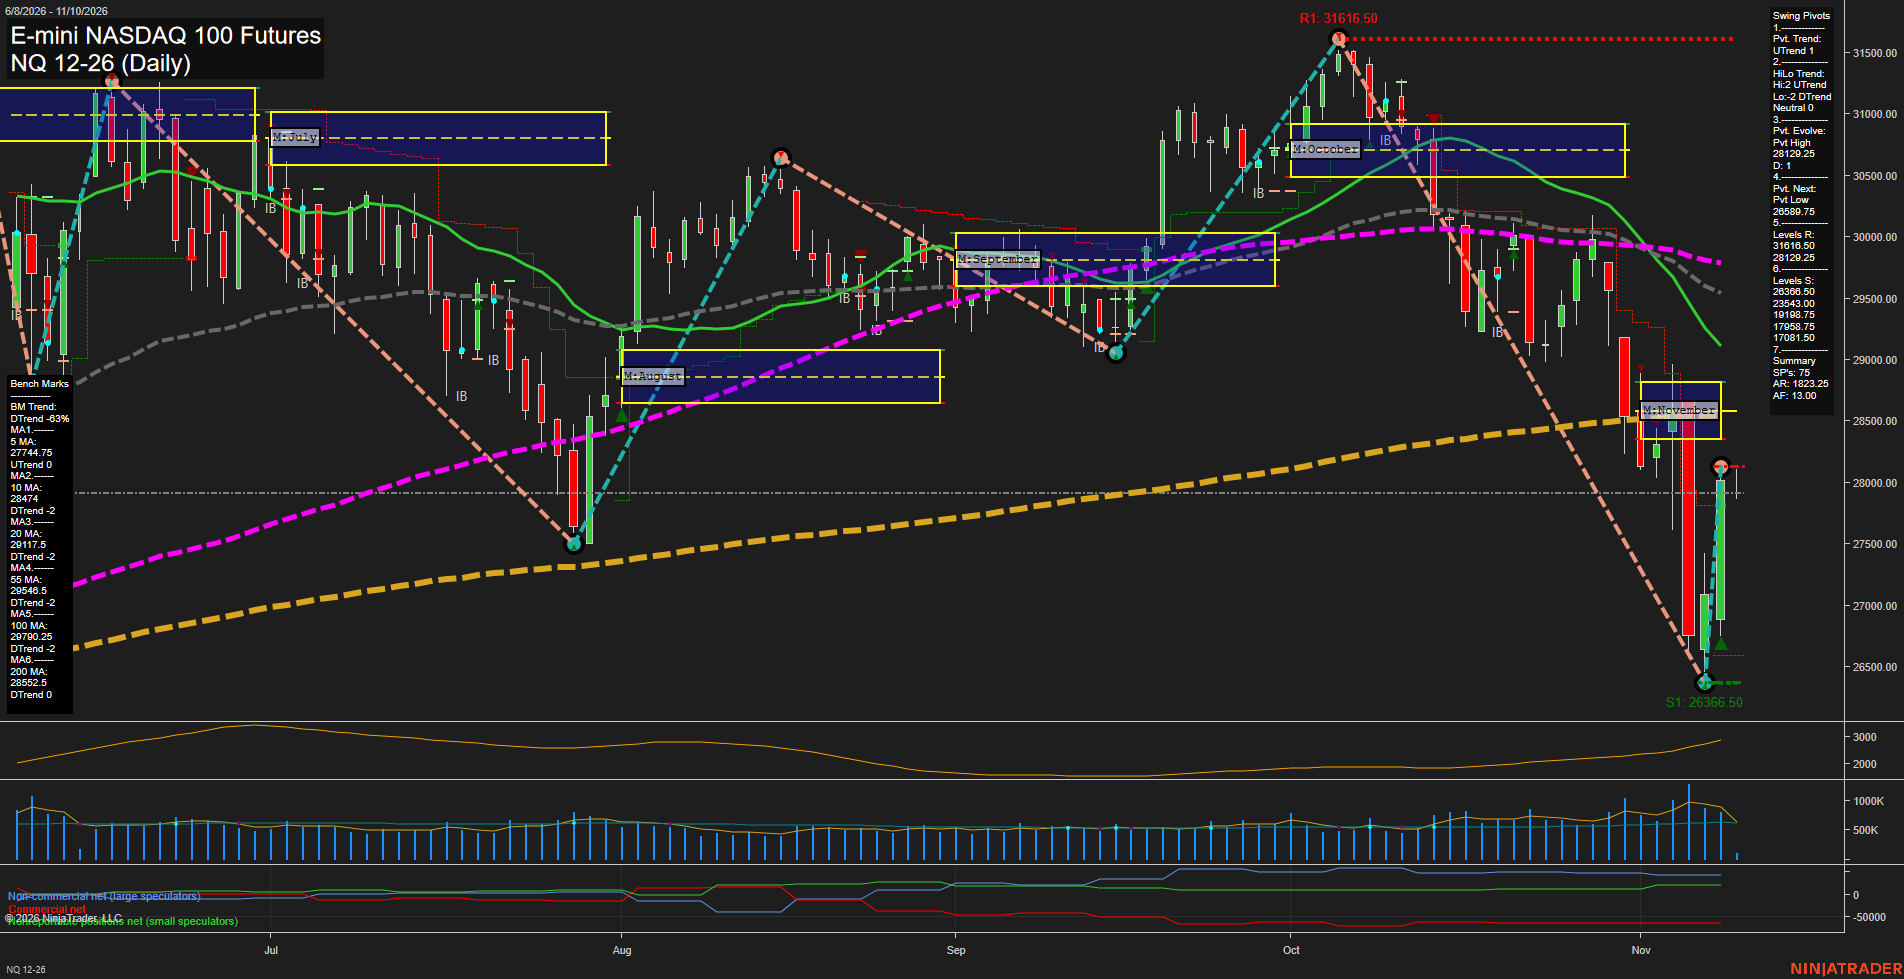
NQ Daily View
Overall Rating
- Short-Term: Neutral
- Intermediate-Term: Bearish
- Long-Term: Neutral.
Key Insights Summary
The daily structure shows a high-volatility V-recovery from the 26366.50 swing-low area, with large recent bars and fast upside momentum restoring the short-term pivot trend to UTrend. Price is above the weekly F0% reference and the rising 5-day benchmark, but remains below the declining 10-, 20-, 55-, and 100-day averages, leaving the rebound within a broader intermediate-term corrective structure. The 28129.25 pivot-high area and the 28552.50 200-day benchmark form nearby overhead technical references, while 26839.75 and 26366.50 remain the principal swing-support references. Monthly positioning remains below F0% and confirms a downtrend on the intermediate horizon, whereas the yearly grid remains positive and reflects an intact longer-cycle structure despite the current retracement.
View charts on: AlphaWebTrader HTF Charts
USO Daily View
Overall Rating
- Short-Term: Bearish
- Intermediate-Term: Bearish
- Long-Term: Bullish.
Key Insights Summary
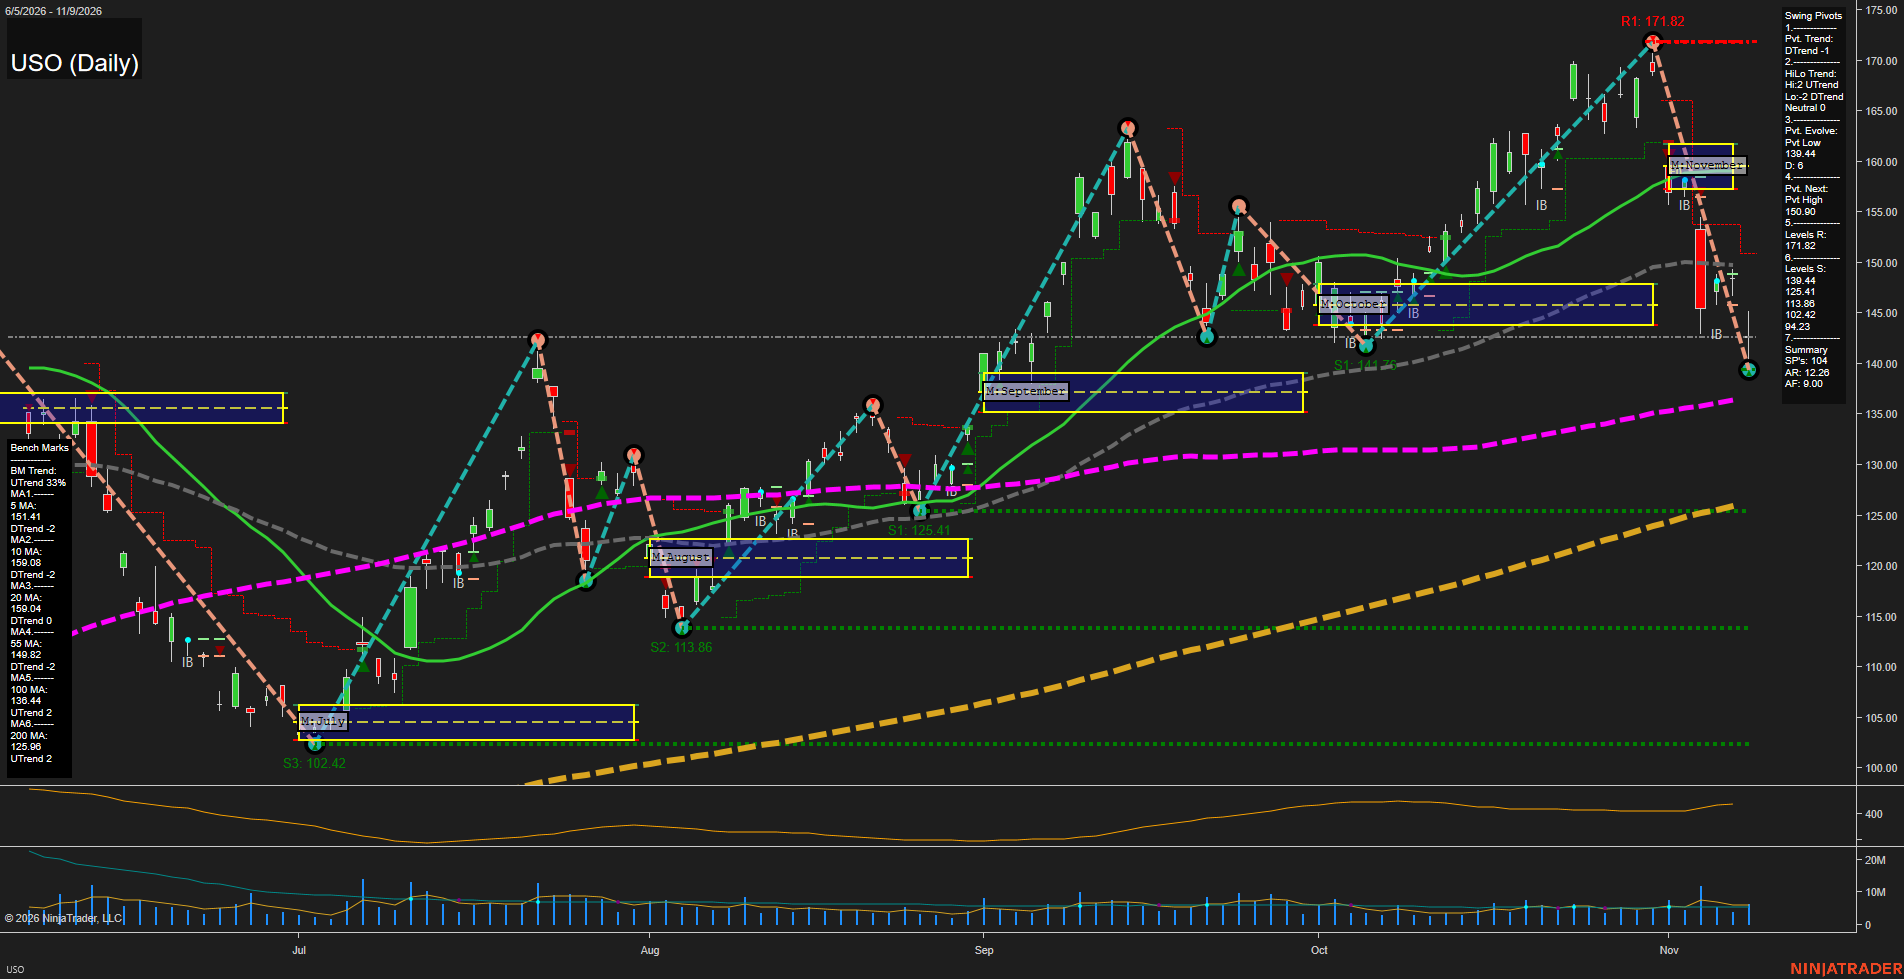
USO is in a fast, high-volatility corrective swing after rejecting from the 171.82 pivot high. The short-term pivot structure is bearish, with price below the 5, 10, 20, and marginally below the 55-day benchmarks. The rebound from 139.44 has produced a sharp countertrend bounce, but 150.90 is the defined pivot-reversal threshold and the clustered 151.41 to 159.08 moving-average zone remains overhead. From a futures swing perspective, the larger structure remains constructive because price is still above rising 100-day and 200-day benchmarks; however, the current daily cycle is a retracement phase within that broader long-term advance.
View charts on: AlphaWebTrader HTF Charts
CL Daily View
Overall Rating
- Short-Term: Bearish
- Intermediate-Term: Bearish
- Long-Term: Bullish.
Key Insights Summary
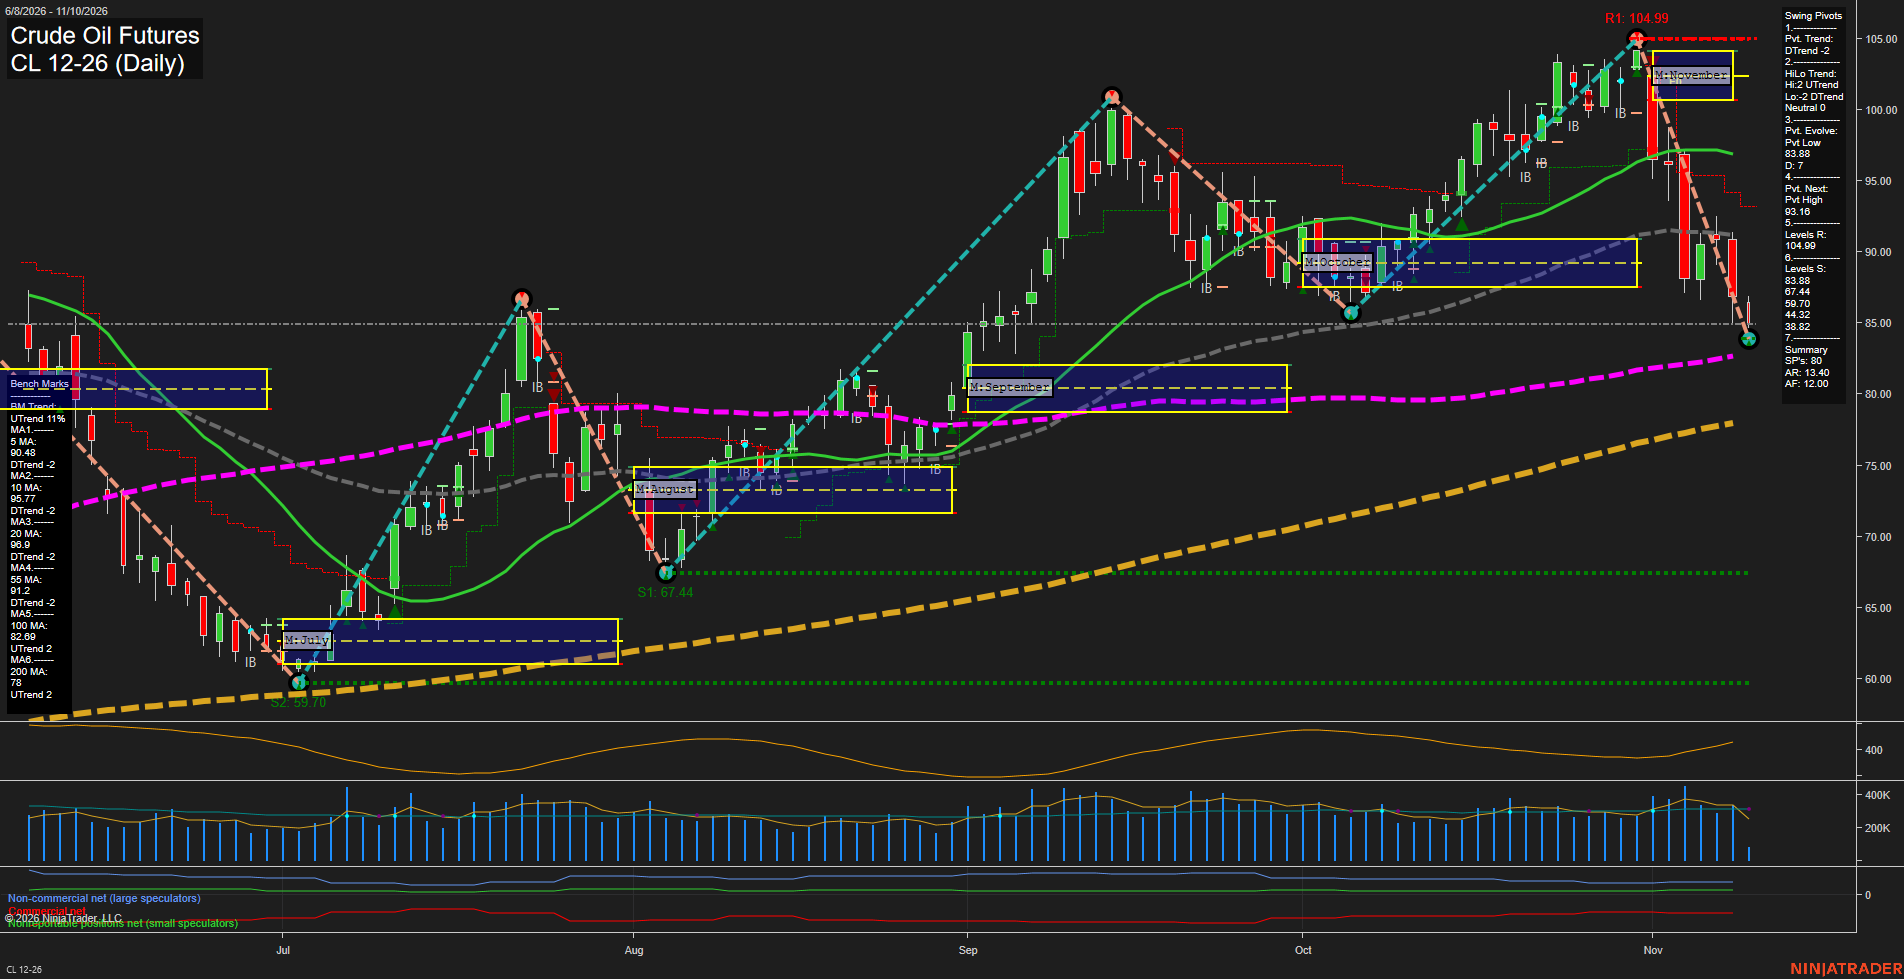
CL has shifted into a fast downside swing following rejection from the 104.99 pivot high. Price is below the weekly and monthly F0%/NTZ structures and below all short- and intermediate-term benchmarks, confirming broad bearish alignment. The 83.88 pivot-low area is the immediate swing reference, while 93.16 defines the reversal level required for a new short-term pivot high. Despite the sharp selloff, the annual grid and rising 100- and 200-day benchmarks preserve a constructive long-term structure; the current decline is a major countertrend retracement within that longer-term uptrend.
View charts on: AlphaWebTrader HTF Charts
GLD Daily View
Overall Rating
- Short-Term: Bullish
- Intermediate-Term: Bearish
- Long-Term: Bearish.
Key Insights Summary
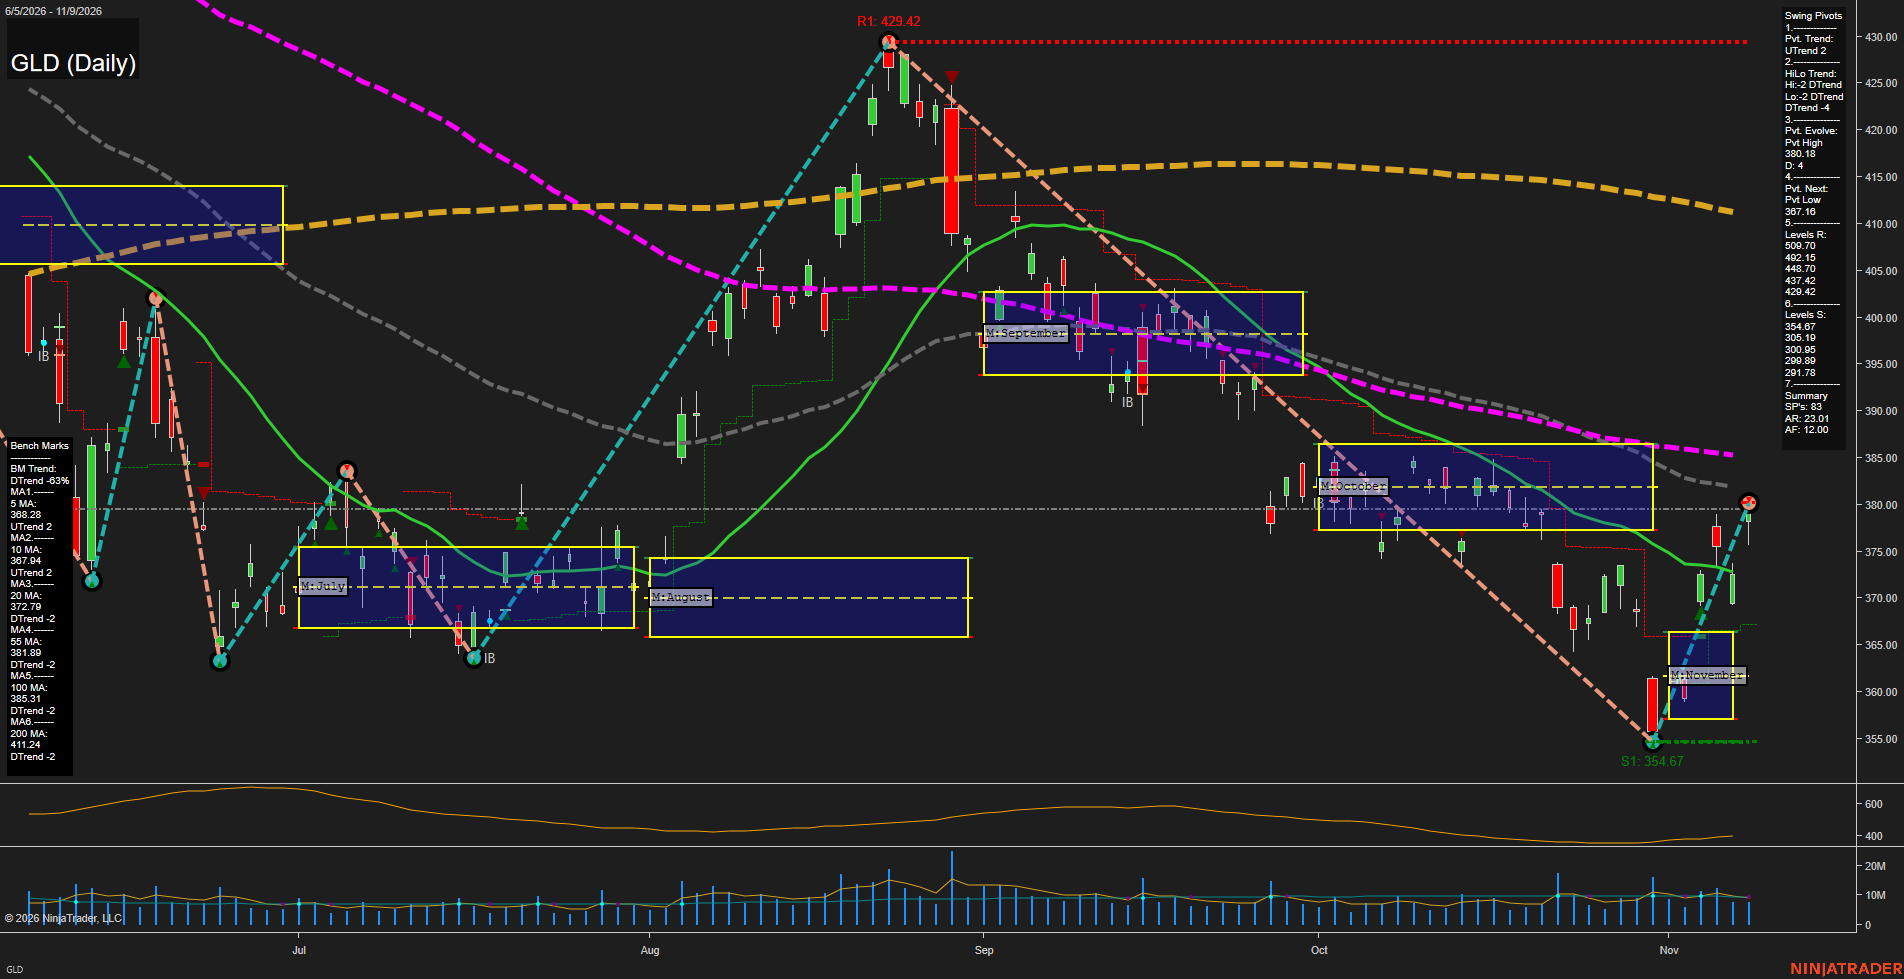
GLD shows a fast short-term rebound from the 354.67 swing low, with price reclaiming the 5-, 10-, and 20-day benchmarks and the November NTZ upper area. From a futures swing-trader perspective, this is a countertrend recovery inside a broader intermediate and long-term decline: the 55-, 100-, and 200-day averages remain downward sloping and overhead. The current 380.18 pivot high is the immediate decision area, while 367.16 is the reversal level for the developing short-term upswing. The recovery has a sharp V-shaped character and elevated ATR, whereas the larger structure still contains lower highs from the August peak and a declining major-trend backdrop.
View charts on: AlphaWebTrader HTF Charts
GC Daily View
Overall Rating
- Short-Term: Bullish
- Intermediate-Term: Neutral
- Long-Term: Bearish.
Key Insights Summary
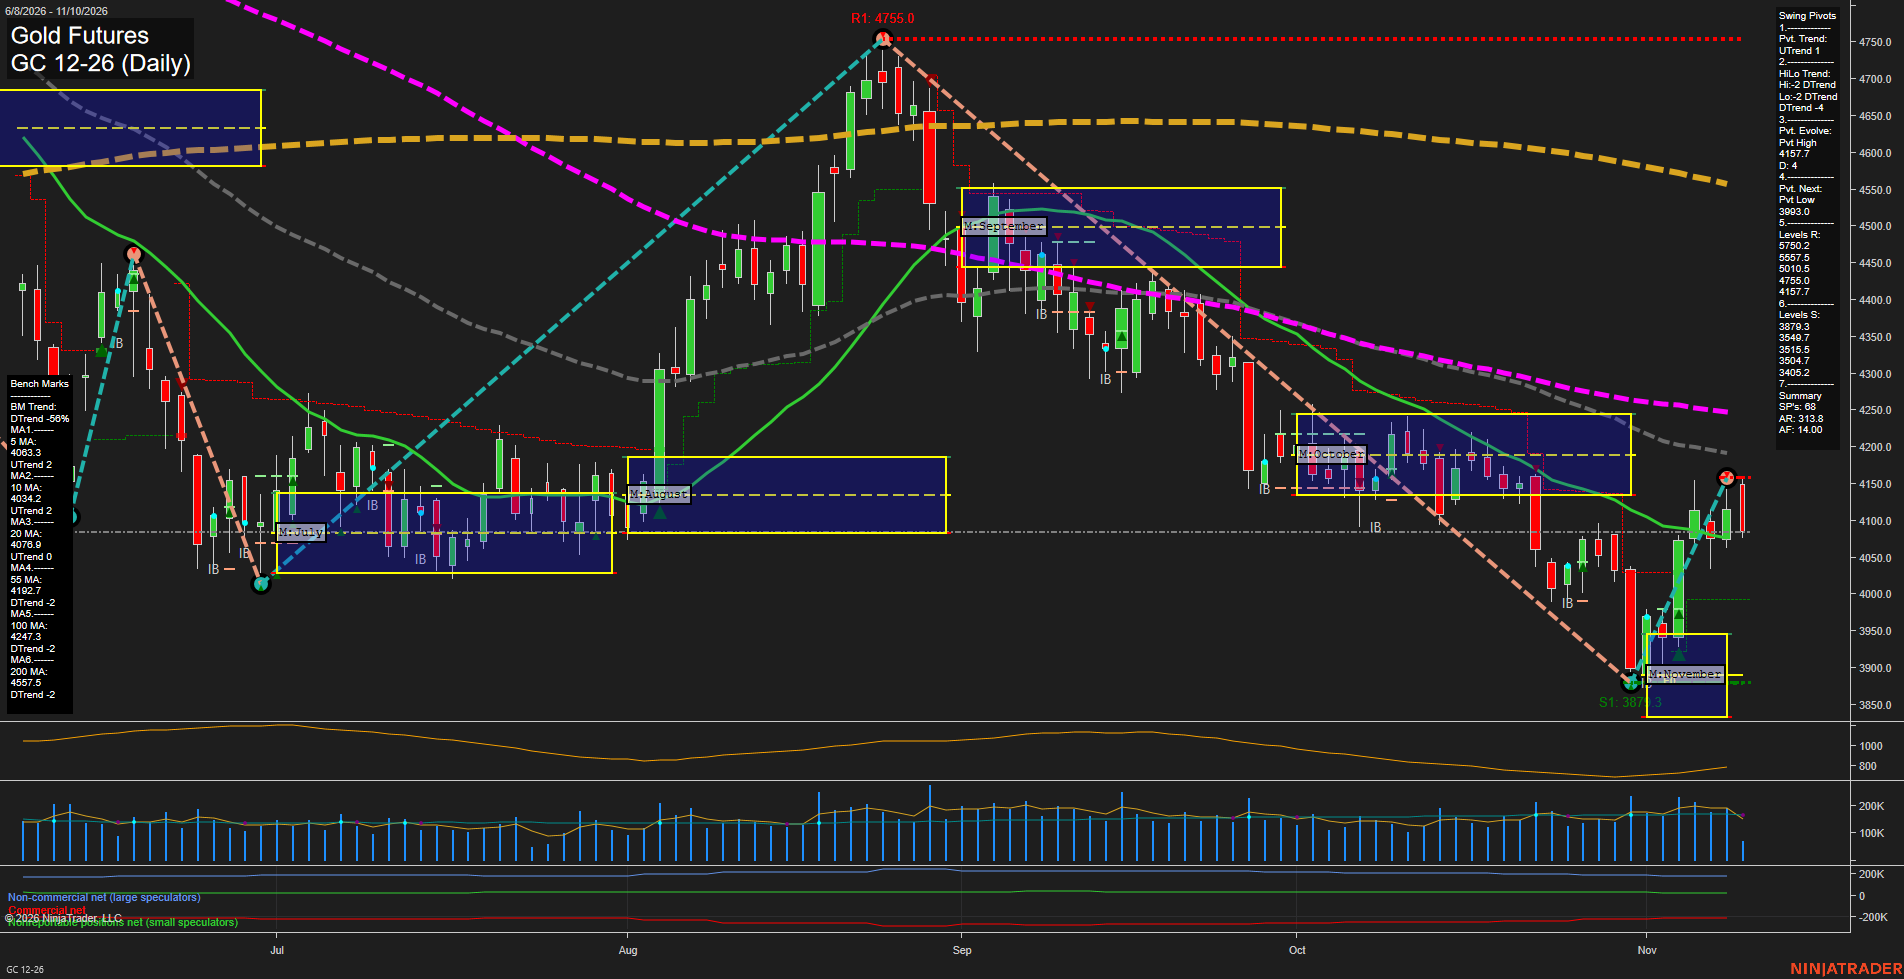
Price is holding above the rising 5-, 10-, and 20-day benchmarks following the sharp November rebound from the 3879.3 swing-low area, maintaining a short-term recovery structure. The latest rejection from 4157.7 marks the active pivot-high resistance and leaves the broader intermediate swing structure in a DTrend while price remains below the declining 55-, 100-, and 200-day averages. The November MSFG remains positive above its F0% area, but the yearly grid remains negative, defining the advance as a countertrend recovery within a weaker long-term structure. Medium daily bars and elevated ATR reflect active volatility, with 4157.7 as the nearby ceiling and 3903.0 to 3879.3 as the principal swing support zone.
View charts on: AlphaWebTrader HTF Charts
ZB Daily View
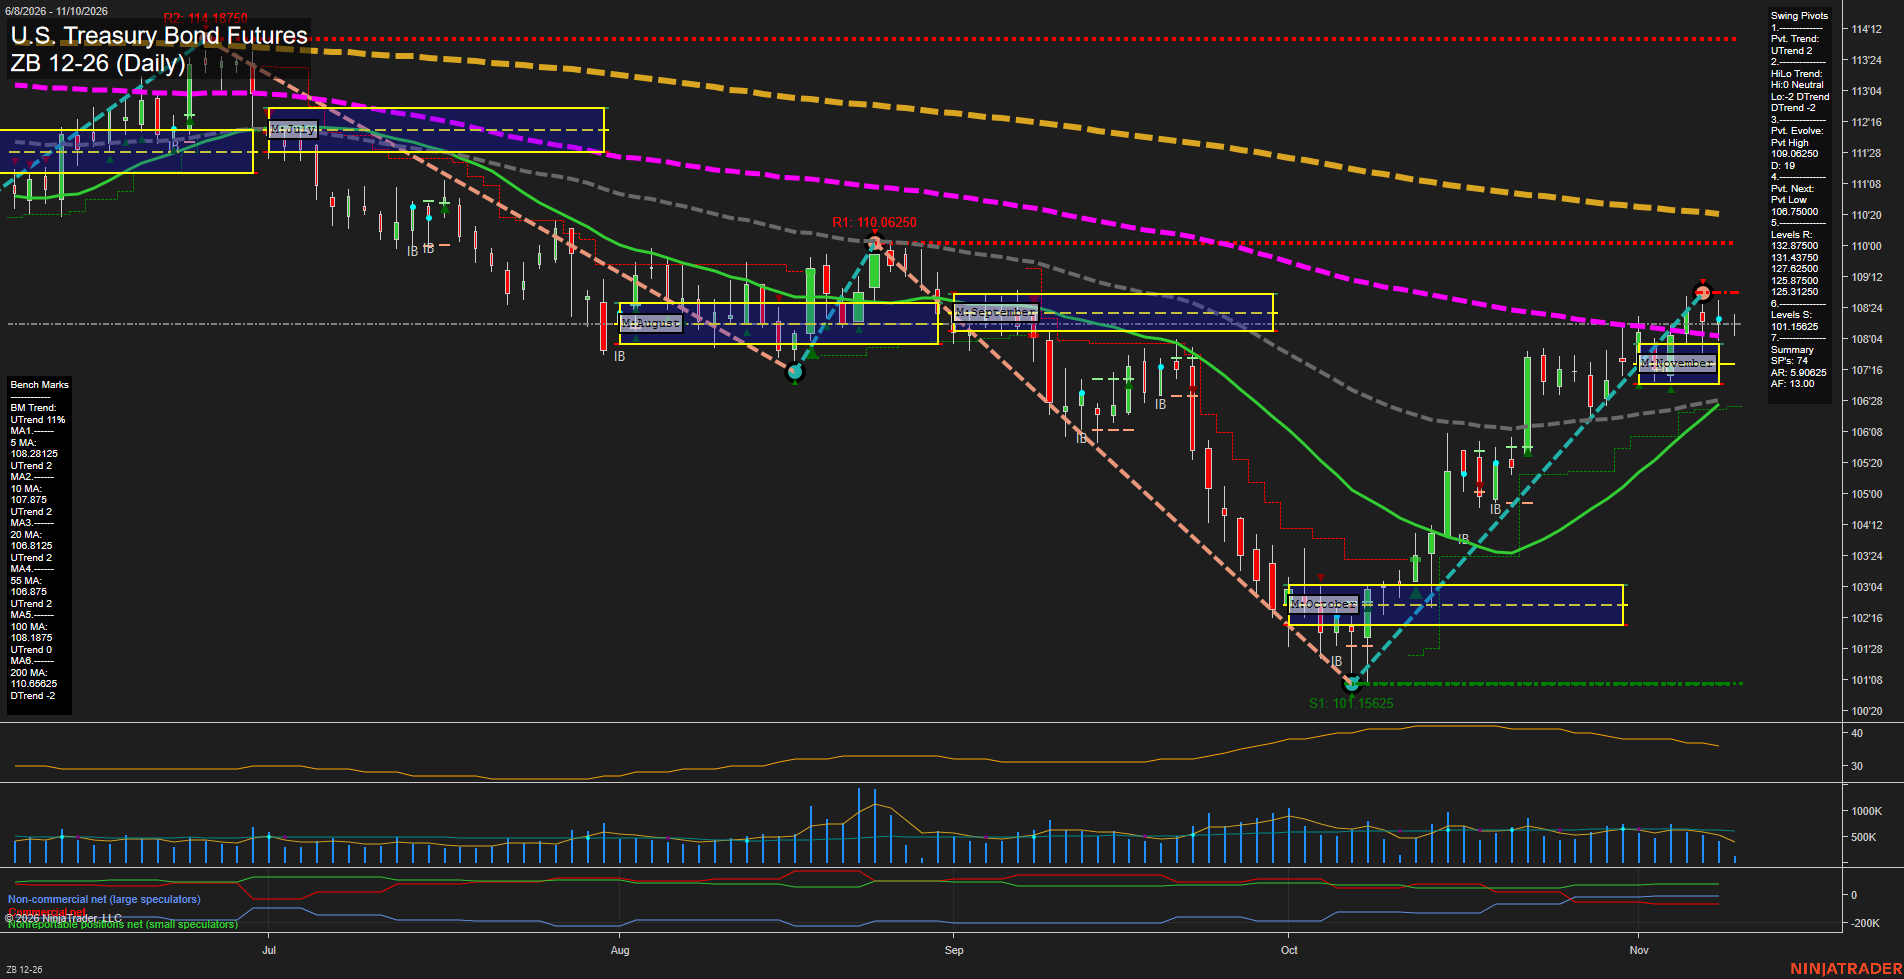
Overall Rating
- Short-Term: Bullish
- Intermediate-Term: Bullish
- Long-Term: Bearish.
Key Insights Summary
Price has staged a sharp V-recovery from the October 101.15625 pivot low, establishing higher lows and recovering above the 5-day, 10-day, 20-day, and 100-day benchmarks. The short-term pivot structure remains positive, although recent small daily bars beneath the 109.06250 pivot high reflect slowing momentum and consolidation following the rally. Monthly structure remains constructive above the November F0% area, while the yearly grid and declining 200-day benchmark retain a broader bearish backdrop. The chart depicts a countertrend recovery within the longer-term downtrend, with 108.87500 and 109.06250 defining nearby overhead technical pressure.
View charts on: AlphaWebTrader HTF Charts
Sentiment Summary: Neutral coverage led at 43%, but negative articles outweighed positive 40% to 17%, reflecting Nvidia’s continuing November 10 selloff amid its CEO investigation and export-control scrutiny, alongside renewed inflation concerns. October CPI, released November 10, rose 0.4% monthly versus 0.3% expected; Waller had earlier opened the door to a half-point December hike, and Treasury yields subsequently approached 5% as stocks weakened. The main counterweight was November 9’s broad rebound, with 10 of 11 S&P 500 sectors advancing despite Nvidia’s decline, alongside strong cloud earnings coverage.
Conclusion: The coverage supports a volatile, sector-divergent index context rather than uniform equity weakness.