
U.S. futures fell before the open as tech weighed; Dow trends stayed bullish and Russell 2000 weak, while Brent topped $112 and Treasurys drew demand.
Fundamentals: U.S. index futures fell ahead of the open, with Nasdaq 100 futures down 1.93% as AI spending scrutiny and technology earnings reactions weighed on shares. Attacks in Saudi Arabia pushed oil up more than 2%, lifting Brent above $112 despite recovering Gulf exports. Gold faced pressure, while Treasurys attracted safe-haven demand and French government bonds sold off.
Technicals: Stock index futures show divergent technical trends. The Nasdaq remains under near-term pressure, while the S&P 500 is pulling back within a bullish far-term structure. Dow daily trends remain bullish following an October rebound. Russell 2000 daily trends remain bearish beyond the near term, while midcaps show a countertrend recovery and Germany’s DAX retains a constructive broader backdrop.
Pre-Market Trading 360° view Market Radar of: holidays, earnings, eco-news, market-news summary, news sentiment, prior session major ETFs, MAG7, Higher Time Frame Analysis Indices Futures Summary, and E-mini S&P500, Nasdaq 100, NYMEX Crude, Gold Futures Daily Chart analysis.
As of: October 22, 2026 07:18 CT
Earnings Radar
Monitoring for earnings releases by the Magnificent 7, AI-tech-related firms, and major financial institutions.
| Date/Day | Impact | Company / Symbol | Time | EPS | Revenue | ||||||||
|---|---|---|---|---|---|---|---|---|---|---|---|---|---|
| 2026-10-20 – Tuesday | High | SpaceX (SPCX) | After close |
|
| ||||||||
| 2026-10-21 – Wednesday | Medium | International Business Machines (IBM) | After close |
|
| ||||||||
| 2026-10-21 – Wednesday | High | Meta Platforms (META) | After close |
|
| ||||||||
| 2026-10-21 – Wednesday | High | Tesla (TSLA) | After close |
|
|
Conclusion: As of 2026-10-22, all listed earnings dates have passed; no upcoming releases are included. META and TSLA’s Oct. 21 after-market releases are relevant to broad-index post-earnings context, alongside IBM; no results or market reactions are provided.
For full details visit: Yahoo Earnings Calendar
EcoNews Radar U.S. Events
| Date/Day | Impact | Event | Time | Forecast | Previous |
|---|---|---|---|---|---|
| 2026-10-22 – Thursday | Medium | Unemployment Claims | 08:30 | 200K | 199K |
| 2026-10-23 – Friday | Medium | Flash Manufacturing PMI | 09:45 | 55.4 | 57.0 |
| 2026-10-23 – Friday | Medium | Flash Services PMI | 09:45 | 57.9 | 58.7 |
| 2026-10-23 – Friday | Medium | Revised UoM Consumer Sentiment | 10:00 | 46.3 | 46.3 |
| 2026-10-23 – Friday | Medium | Revised UoM Inflation Expectations | 10:00 | — | 4.7% |
EcoNews Summary
This medium-impact USD calendar covers Thursday’s unemployment claims and Friday’s business activity, consumer sentiment, and inflation expectations releases. For equity index futures, these reports provide context on labor conditions, economic growth, and inflation perceptions, with implications for interest-rate pricing.
Event Notes:
- Thursday 08:30 — Unemployment Claims (Medium): Weekly initial applications for unemployment benefits measure layoffs and labor-market conditions. Traders monitor changes for signals about economic momentum and interest-rate pricing.
- Friday 09:45 — Flash Manufacturing PMI (Medium): A preliminary survey of manufacturing business conditions. Readings above 50 indicate expansion and below 50 indicate contraction; the report provides insight into industrial momentum and cost pressures.
- Friday 09:45 — Flash Services PMI (Medium): A preliminary survey of service-sector business conditions, with 50 separating expansion from contraction. Traders monitor it for signals about broad economic activity and price pressures.
- Friday 10:00 — Revised UoM Consumer Sentiment (Medium): An updated measure of households’ views on personal finances and economic conditions. Revisions inform assessments of consumer demand.
- Friday 10:00 — Revised UoM Inflation Expectations (Medium): Updated survey readings of consumers’ anticipated inflation. Traders monitor shifts for their relevance to inflation perceptions, bond yields, and interest-rate pricing.
Conclusion:
Thursday’s claims report provides a labor-market update, while Friday concentrates four medium-impact releases between 09:45 and 10:00. The 10:00 sentiment and inflation-expectations updates fall within a time cycle where news releases act as catalysts for reversals or continuations in equity index futures.
For full details visit: Forex Factory EcoNews
NYSE Session Open Gap Radar
Session gaps compare the predicted opening price with the prior session’s close to predict the upcoming session’s opening gap pattern.
| Instrument | Gap | Prior Close | Predicted Open | Gap % |
|---|---|---|---|---|
| USO | ▲ OGU | 159.80 | 162.66 | ▲ +1.79% |
| TLT | ▲ OGU | 80.24 | 80.49 | ▲ +0.32% |
| DIA | ▲ IGD | 527.70 | 524.69 | ▼ -0.57% |
| IWM | ▼ OGD | 276.48 | 274.83 | ▼ -0.60% |
| IJH | ▼ OGD | 73.39 | 72.79 | ▼ -0.81% |
| SPY | ▼ OGD | 773.09 | 766.02 | ▼ -0.91% |
| QQQ | ▼ OGD | 725.20 | 713.79 | ▼ -1.57% |
| GLD | ▼ OGD | 378.95 | 372.80 | ▼ -1.62% |
Before the session opens, the table shows the predicted opening price and gap. Once the session opens, it uses the recorded opening price.
Glossary: IGU — Inside Gap Up: above the prior close, within the prior session’s range. IGD — Inside Gap Down: below the prior close, within that range. OGU — Outside Gap Up: above the prior session’s high. OGD — Outside Gap Down: below the prior session’s low.
As of: 2026-10-22 07:18 CT. Predicted gaps are best estimates as of publication and may change before the regular-session open, particularly when the session is still some time away.
Market News Summary:
U.S. index futures fell ahead of the open as scrutiny of AI spending and renewed Saudi attacks weighed on risk sentiment.
Primary Drivers & Risks:
- Primary Driver: AI spending concerns pressure technology shares
- Primary Risk: Saudi attacks intensify oil supply concerns
Tone:
Risk-off, with technology leading equity declines and investors seeking Treasurys.
Data, Market and System
Geopolitical:
Deadly attacks at a Saudi Aramco oil field and a Saudi airport prompted the U.S. to order some diplomats and their families out of Saudi Arabia. Intensifying Houthi attacks and continued U.S.-Iran tensions added to concerns over regional energy infrastructure.
Oil / Energy:
Oil rose more than 2%, with Brent topping $112 in the excerpts. The increase persisted despite recovering Persian Gulf exports approaching prewar levels and India’s September Middle East oil imports returning to prewar levels. Aramco outlined efforts to expand stockpile partnerships and increase East-West pipeline capacity toward 10 million barrels a day.
Gold / Metals:
Gold faced pressure from oil-related Fed rate-hike bets and Russian selling, with the cited analysis identifying $4,079 as support. Silver broke below $56.92. Rising Chinese aluminum production and exports offset Gulf supply disruptions and restrained prices.
Fed / Financials:
Treasurys attracted safe-haven demand as French government bonds sold off, pushing the French-German 10-year yield spread to its widest since 2011. Barclays’ refunding assessment pointed to unchanged U.S. Treasury auction sizes and less restrictive guidance. The Philippine central bank delivered a larger-than-anticipated rate increase, citing accelerating inflation tied to Middle East energy costs.
Conclusion:
AI investment scrutiny and technology earnings reactions drove the equity retreat, with Nasdaq futures underperforming broader U.S. benchmarks. Attacks in Saudi Arabia pushed Brent above $112 and reinforced energy-related inflation concerns.
French bond stress added a separate financial-market pressure while Treasurys drew defensive flows. Recovering Gulf exports and lighter hedge-fund positioning provided counterpoints to the risk-off backdrop.
Market News Sentiment
Market News Articles: 55
- Neutral: 52.73%
- Positive: 23.64%
- Negative: 23.64%
Sentiment Summary: Across 55 market news articles, sentiment is 53% neutral, 24% positive, and 24% negative.
Conclusion: Neutral coverage predominates, with positive and negative coverage evenly balanced.
GLD,Gold Articles: 12
- Positive: 41.67%
- Negative: 33.33%
- Neutral: 25.00%
Sentiment Summary: Across 12 GLD/gold articles, sentiment was 42% positive, 33% negative, and 25% neutral.
Conclusion: Positive coverage led, but the snapshot covers gold rather than indices futures.
USO,Oil Articles: 8
- Negative: 50.00%
- Positive: 37.50%
- Neutral: 12.50%
Sentiment Summary: Across 8 USO/oil articles, sentiment was 50% negative, 38% positive, and 13% neutral.
Conclusion: Negative coverage was the largest category; the snapshot contains no direct indices futures sentiment data.
Market Technical Analysis
Analysis of VIX volatility, prior-session major ETFs and mega-cap tech stocks, and real-time futures snapshots and higher-time-frame analysis.
VIX — Market Fear Gauge Daily
| Level | Open | High | Low | DNC% | DOC% | VR |
|---|---|---|---|---|---|---|
| 16.68 | 17.08 | 17.46 | 16.51 | -3.64% | -2.34% | 6.93 |
VIX fell 2.34% from the session's opening level. VIX fell 3.64% versus the previous session close. Expected volatility eased from the period open.
VR: Stocks up; volatility down. Volatility moved more in percentage terms.
Major ETFs and Mega Cap Tech Stocks
At the 6:48 a.m. update, Nasdaq 100 futures were down more than 500 points, or 1.93%; S&P 500 futures fell 1.1%, and Dow futures declined 0.69%. Global AI shares weakened as earnings failed to meet elevated investor expectations. Meta reported 26% revenue growth and above-consensus fourth-quarter guidance, alongside a $135–145 billion annual capital-spending range. Tesla shares fell after hours despite higher gross margins. China stocks also declined sharply.
ETF, Mag7, and Cross-Market ETF prior day Insights
Overall Tone
Daily risk appetite was broadly positive, though intraday participation was uneven.
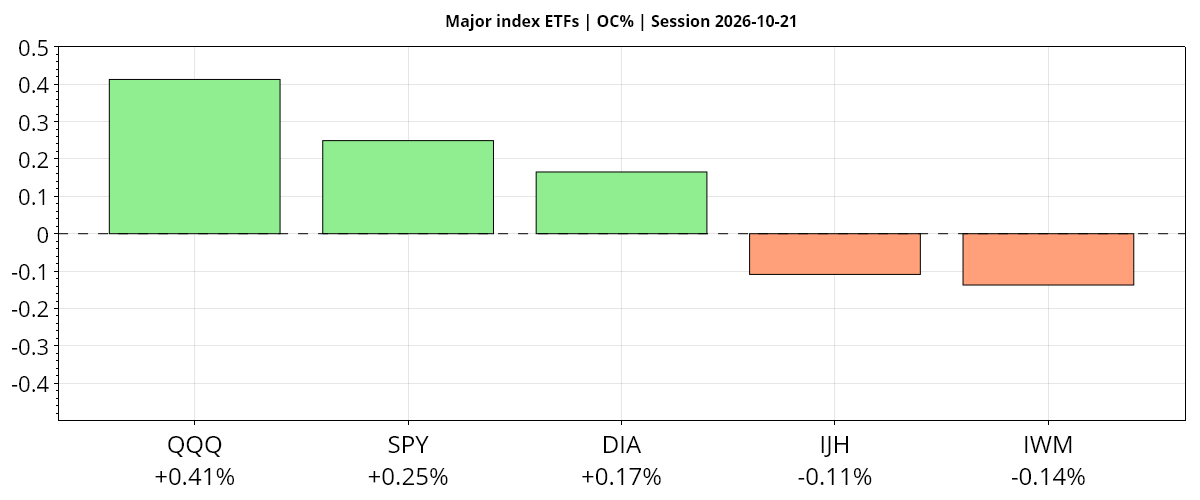
| Instrument | Bias | Date | DNC% | DOC% | O | H | L | C | VWAP | Vol |
|---|---|---|---|---|---|---|---|---|---|---|
| ▲ QQQ | ▲ ▲ ▲ | 2026-10-21 | ▲ +1.05% | ▲ +0.41% | 722.22 | 727.95 | 719.71 | 725.20 | ▲ 724.53 | 31,446,934 |
| ▲ SPY | ▲ ▲ ▲ | 2026-10-21 | ▲ +0.53% | ▲ +0.25% | 771.17 | 774.44 | 768.40 | 773.09 | ▲ 772.23 | 31,507,827 |
| ▲ DIA | ▲ ▲ ▲ | 2026-10-21 | ▲ +0.64% | ▲ +0.17% | 526.83 | 527.79 | 523.15 | 527.70 | ▲ 525.82 | 2,572,731 |
| ▼ IJH | ▲ ▼ ▼ | 2026-10-21 | ▲ +0.41% | ▼ -0.11% | 73.47 | 73.67 | 73.06 | 73.39 | ▼ 73.43 | 6,772,772 |
| ▼ IWM | ▲ ▼ ▼ | 2026-10-21 | ▲ +0.25% | ▼ -0.14% | 276.86 | 277.70 | 275.30 | 276.48 | ▼ 276.58 | 15,680,730 |
| AVG/Sum | — | — | +0.58% | +0.12% | — | — | — | — | — | 87,980,994 |
| Instrument | Bias | Date | DNC% | DOC% | O | H | L | C | VWAP | Vol |
|---|---|---|---|---|---|---|---|---|---|---|
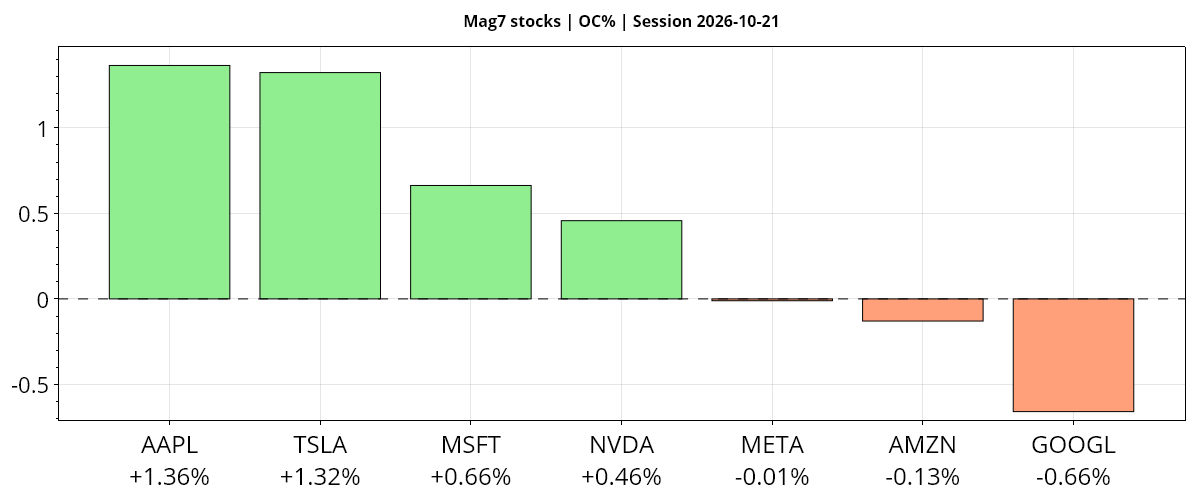
| ▲ AAPL | ▲ ▲ ▲ | 2026-10-21 | ▲ +1.32% | ▲ +1.36% | 339.36 | 345.25 | 338.83 | 343.99 | ▲ 343.16 | 35,439,295 |
| ▲ TSLA | ▲ ▲ ▲ | 2026-10-21 | ▲ +3.41% | ▲ +1.32% | 381.43 | 388.84 | 380.51 | 386.47 | ▲ 385.96 | 44,067,145 |
| ▲ MSFT | ▲ ▲ ▲ | 2026-10-21 | ▲ +0.20% | ▲ +0.66% | 529.44 | 533.28 | 525.02 | 532.95 | ▲ 531.51 | 13,866,379 |
| ▲ NVDA | ▲ ▲ ▲ | 2026-10-21 | ▲ +2.54% | ▲ +0.46% | 220.96 | 222.19 | 217.66 | 221.97 | ▲ 220.82 | 86,446,983 |
| ▼ META | ▲ ▼ ▼ | 2026-10-21 | ▲ +0.47% | ▼ -0.01% | 697.60 | 713.22 | 689.68 | 697.52 | ▼ 703.80 | 24,447,681 |
| ▼ AMZN | ▼ ▼ ▲ | 2026-10-21 | ▼ -0.10% | ▼ -0.13% | 262.71 | 264.36 | 259.29 | 262.37 | ▲ 262.04 | 30,838,660 |
| ▼ GOOGL | ▼ ▼ ▲ | 2026-10-21 | ▼ -1.62% | ▼ -0.66% | 336.98 | 337.27 | 330.38 | 334.76 | ▲ 333.54 | 28,533,222 |
| AVG/Sum | — | — | +0.89% | +0.43% | — | — | — | — | — | 263,639,365 |
Mag7 Stocks
Tesla led prior-close gains at 3.41%, followed by Nvidia and Apple; all three also advanced from the open, alongside Microsoft. Alphabet lagged, falling 1.62% versus the prior close and 0.66% from the open, while Amazon edged lower despite a positive VWAP bias. Meta gained versus the prior close but was essentially flat to slightly lower from the open, with a negative VWAP bias.
| Instrument | Bias | Date | DNC% | DOC% | O | H | L | C | VWAP | Vol |
|---|---|---|---|---|---|---|---|---|---|---|
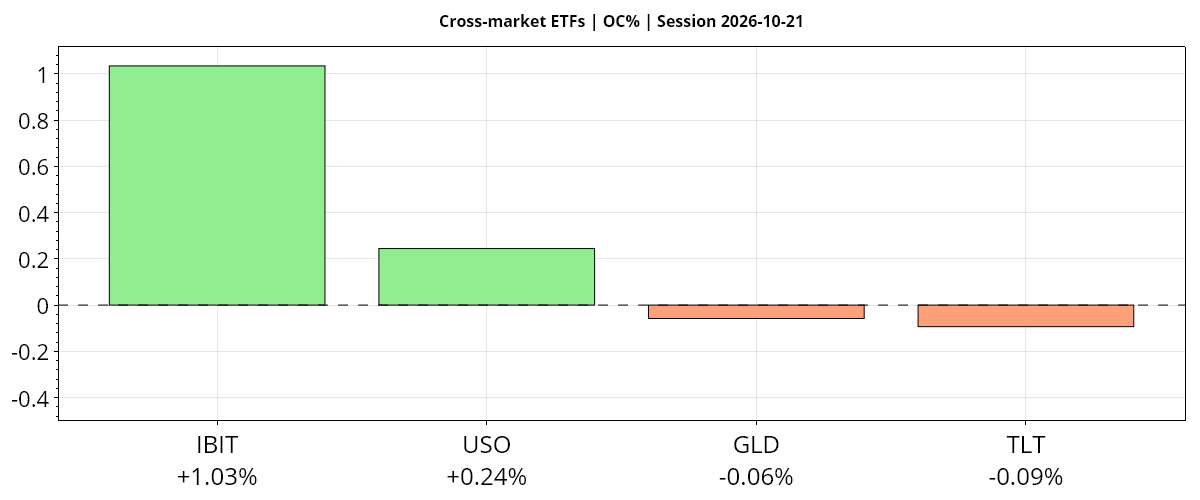
| ▲ IBIT | ▲ ▲ ▲ | 2026-10-21 | ▲ +2.42% | ▲ +1.03% | 47.35 | 48.07 | 47.08 | 47.84 | ▲ 47.72 | 49,817,406 |
| ▲ USO | ▼ ▲ ▲ | 2026-10-21 | ▼ -0.50% | ▲ +0.24% | 159.41 | 161.28 | 157.33 | 159.80 | ▲ 159.25 | 5,781,391 |
| ▼ GLD | ▲ ▼ ▲ | 2026-10-21 | ▲ +0.34% | ▼ -0.06% | 379.17 | 379.55 | 376.20 | 378.95 | ▲ 378.45 | 6,904,153 |
| ▼ TLT | ▲ ▼ ▲ | 2026-10-21 | ▲ +0.14% | ▼ -0.09% | 80.31 | 80.47 | 79.83 | 80.24 | ▲ 80.21 | 35,893,642 |
| AVG/Sum | — | — | +0.60% | +0.28% | — | — | — | — | — | 98,396,592 |
Cross-Market ETFs
Bitcoin ETF IBIT rose 2.42% versus the prior close and 1.03% from the open, outpacing equities. Bonds and gold posted modest prior-close gains but slipped from the open, unlike the leading equity ETFs. Oil diverged from equities on the daily comparison: USO fell 0.50% versus the prior close despite rising 0.24% from the open.
Glossary: Instrument — ticker symbol; hover for the instrument or company name; Date — session date. DNC% — prior-session close to this session’s close; DOC% — daily session open-to-close percentage change. O — open; H — high; L — low; C — close, all for the table’s daily or weekly session; VWAP — volume-weighted average price; its arrow shows whether the close is above or below VWAP. Vol — period trading volume.
Bias — three directional readings, in order: DNC%, DOC%, then VWAP. ▲ positive/above; ▼ negative/below; — neutral or unavailable. Matching arrows show alignment; opposing arrows show mixed conditions. AVG/Sum — simple average of percentage changes and sum of reported volumes.
Futures Session Fib Grid Analysis – realtime
Session Fib Grids normalise market positioning as percentages, making direction and alignment comparable across different asset types.
Latest available snapshot for each instrument; Time(CT) shows the individual update date and time.
| Instrument | Bias | Time(CT) | YSFG | MSFG | WSFG | RSFG | SFG | TSI |
|---|---|---|---|---|---|---|---|---|
| ▼ ES | ▲ ▼ ▲ ▼ ▲ ▼ | 2026-10-22 07:19:42 | ▲ +56 | ▼ -8 | ▲ +30 | ▼ -64 | ▲ +4 | ▼ -66 |
| ▼ NQ | ▲ ▼ ▲ ▼ ▲ ▼ | 2026-10-22 07:19:39 | ▲ +66 | ▼ -64 | ▲ +27 | ▼ -61 | ▲ +3 | ▼ -57 |
| ▼ YM | ▲ ▲ ▲ ▼ ▲ ▼ | 2026-10-22 07:19:28 | ▲ +38 | ▲ +67 | ▲ +56 | ▼ -33 | ▲ +1 | ▼ -29 |
| ▼ EMD | ▲ ▲ ▲ ▼ ▼ ▼ | 2026-10-22 07:16:02 | ▲ +29 | ▲ +13 | ▲ +25 | ▼ -75 | ▼ -1 | ▼ -48 |
| ▼ RTY | ▲ ▼ ▲ ▼ ▲ ▲ | 2026-10-22 07:19:26 | ▲ +29 | ▼ -36 | ▲ +54 | ▼ -48 | ▲ +2 | ▲ +34 |
| ▼ FDAX | ▲ ▲ ▼ ▼ ▲ ▲ | 2026-10-22 07:19:25 | ▲ +15 | ▲ +38 | ▼ -19 | ▼ -1 | ▲ +6 | ▲ +102 |
| ▼ NKD | ▲ ▼ ▼ ▼ ▲ ▲ | 2026-10-22 07:19:13 | ▲ +151 | ▼ -76 | ▼ -3 | ▼ -81 | ▲ +5 | ▲ +26 |
| Instrument | Bias | Time(CT) | YSFG | MSFG | WSFG | RSFG | SFG | TSI |
|---|---|---|---|---|---|---|---|---|
| ▼ BTC | ▼ ▼ ▼ ▼ ▲ ▼ | 2026-10-22 07:19:37 | ▼ -32 | ▼ -16 | ▼ -2 | ▼ -84 | ▲ +2 | ▼ -143 |
| ▼ GC | ▼ ▼ ▼ ▼ ▲ ▼ | 2026-10-22 07:19:43 | ▼ -128 | ▼ -32 | ▼ -68 | ▼ -138 | ▲ +17 | ▼ -59 |
| ▲ CL | ▲ ▲ ▲ ▲ ▲ ▲ | 2026-10-22 07:19:42 | ▲ +182 | ▲ +69 | ▲ +4 | ▲ +62 | ▲ +2 | ▲ +41 |
| ▼ 6E | ▼ ▼ ▲ ▼ ▲ ▼ | 2026-10-22 07:19:00 | ▼ -56 | ▼ -63 | ▲ +1 | ▼ -56 | ▲ +12 | ▼ -75 |
| ▼ ZB | ▼ ▲ ▲ ▼ ▼ ▲ | 2026-10-21 09:39:59 | ▼ -39 | ▲ +77 | ▲ +6 | ▼ -3 | ▼ -2 | ▲ +29 |
Glossary: YSFG — yearly; MSFG — monthly; WSFG — weekly; RSFG — regular trading hours (RTH); SFG — the current session, including pre-market or other sessions. TSI indicates trend strength and power.
Bias shows trend alignment across these six readings. The arrows follow the column order: YSFG, MSFG, WSFG, RSFG, SFG and TSI. Matching arrows show alignment; opposing arrows show mixed conditions.
Futures Higher Time Frame Analysis
Summary of the current state of US Indices Futures based on higher time-frame (HTF) technical analysis as of: 2026-10-22: 07:19 CT.
US Indices Futures
- ES YSFG above F0%, MSFG below F0%, WSFG unspecified, below 5–55-day benchmarks, daily pivots down, support 7672.75–7676.00, resistance 7897.50–7906.25.
- NQ YSFG/WSFG above F0%, MSFG below F0%, below 5–100-day benchmarks, pivots down, support 29053–29268, reversal threshold 30197, resistance 31616.50.
- YM YSFG/MSFG/WSFG above F0%, above 5–55-day benchmarks, daily pivots up, weekly pivots down, support 51900–51970, resistance 53219–53223.
- EMD YSFG/MSFG/WSFG above F0%, below 55/100-day benchmarks, above 200-day benchmark, pivots down, support 3600.3, resistance 3700.5–3737.8.
- RTY YSFG/WSFG above F0%, MSFG below F0%, below 10–200-day benchmarks, daily pivot/HiLo downtrends, support 2723.3–2723.9, resistance 2808.7–2811.9.
- FDAX YSFG/MSFG above F0%, WSFG below F0%, above 200-day benchmark, daily pivots up, weekly pivots down, support 24925–25169, resistance 25843–25990.
Overall State
- Short-Term: Neutral
- Intermediate-Term: Neutral
- Long-Term: Bullish
Conclusion
YSFG positioning and longer-term weekly benchmarks retain a broadly bullish HTF backdrop, while short-term directional alignment remains mixed. YM leads daily structure with rising pivots and all three grids above F0%. NQ and RTY lag through declining pivots and MSFG readings below F0%; RTY also remains below its 200-day benchmark. ES retains its weekly uptrend despite daily weakness and recent weekly short signals. EMD’s recovery remains beneath overhead benchmarks with daily pivot and HiLo downtrends. FDAX retains bullish monthly and yearly positioning, offset by WSFG weakness and recent short signals. These divergences leave intermediate structure mixed, with the listed pivot thresholds and support/resistance zones defining current swing boundaries.
Note: Intra-day counter-trend pullbacks or retracements may occur, HTF is context for informational usage and market structure. Glossary: Session Fib Grids periods of YSFG:’Yearly’, MSFG:’Monthly’, WSFG:’Weekly’
For full details visit: AlphaWebTrader Technicals
ES Daily View
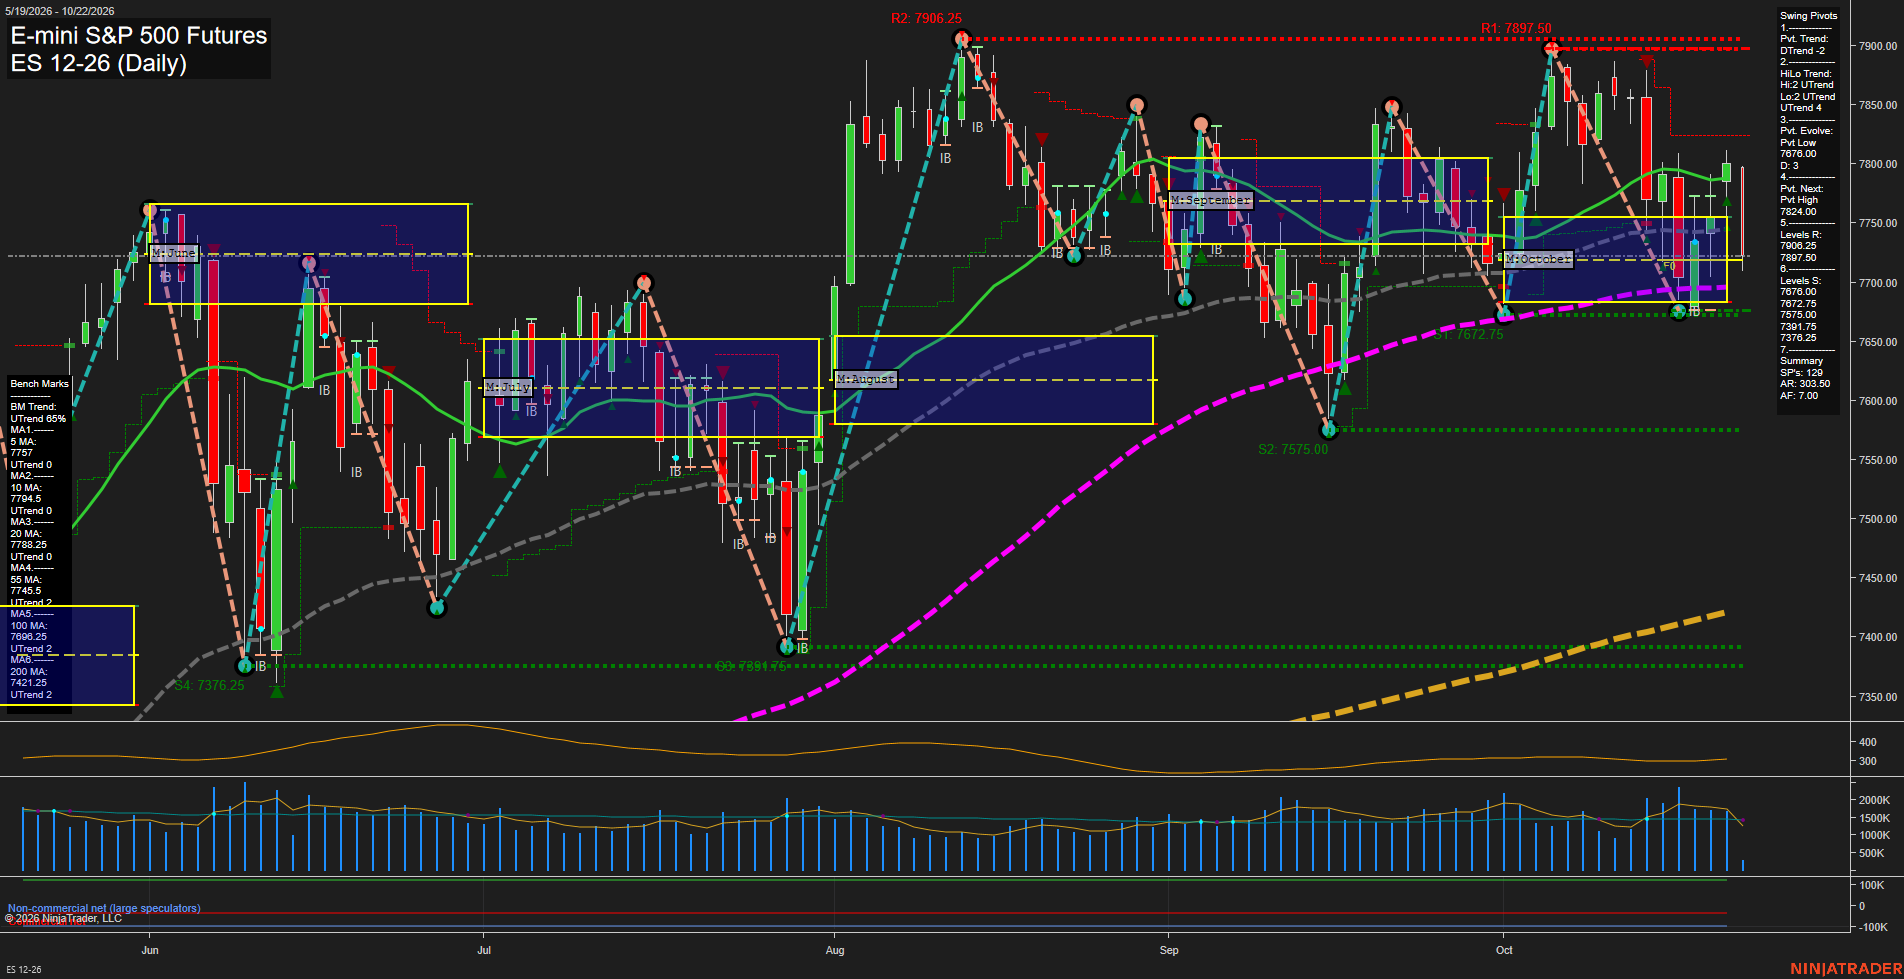
Overall Rating
- Short-Term: Bearish
- Intermediate-Term: Neutral
- Long-Term: Bullish.
Key Insights Summary
The daily structure reflects a short-term downswing from the October high near 7900, with price beneath the 5-, 10-, 20-, and 55-day benchmarks and below the October MSFG F0% area. The active pivot trend is down, while the intermediate HiLo structure remains up, defining the move as a pullback within a still-positive broader trend. The 7676.00-7672.75 pivot-support cluster is the immediate downside reference, while 7824.00 is the next pivot-reversal threshold and 7897.50-7906.25 remains major overhead resistance. Long-term positioning remains constructive because price holds above the rising 100- and 200-day benchmarks and the yearly grid remains positive.
View charts on: AlphaWebTrader HTF Charts
NQ Daily View
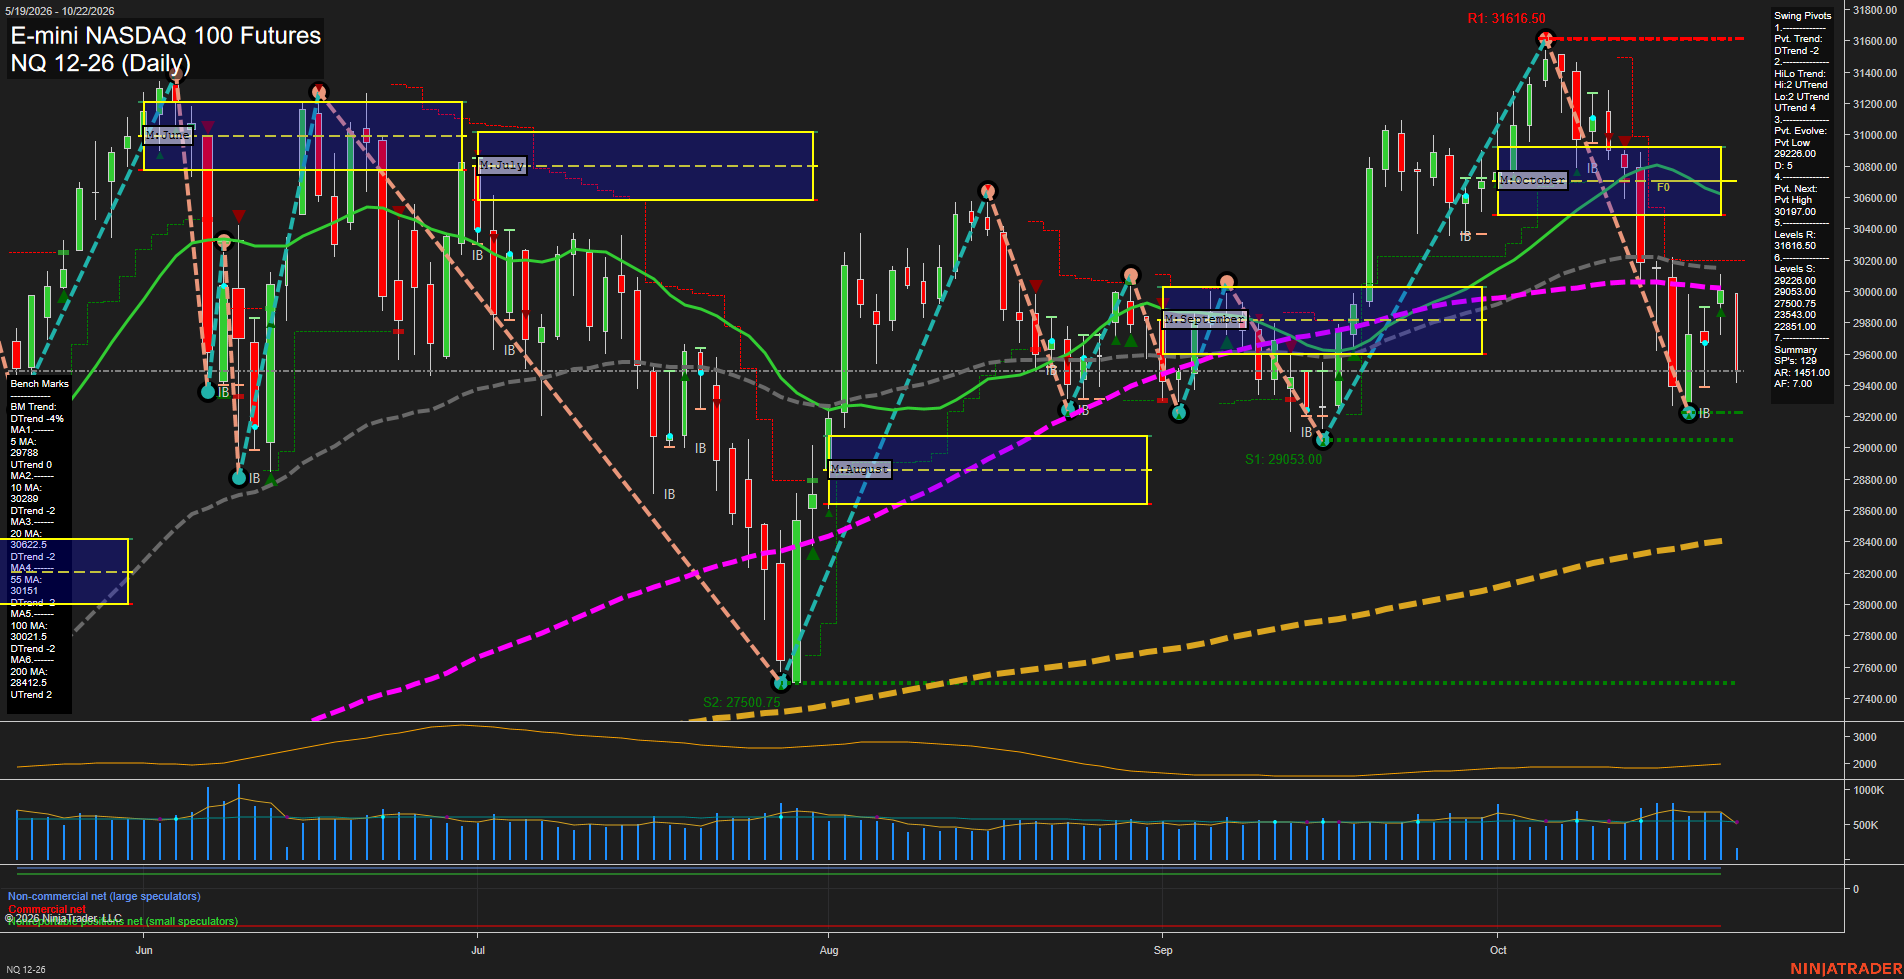
Overall Rating
- Short-Term: Bearish
- Intermediate-Term: Bearish
- Long-Term: Neutral.
Key Insights Summary
Price remains in a short-term pivot decline following the rejection from the 31616.50 swing high. The rebound from the 29268.00 pivot low has not yet restored price above the 5, 10, 20, 55, or 100 day benchmarks, preserving a bearish overhead moving-average structure. The weekly grid remains positive, while the October monthly grid is negative and price is below its F0% area, reflecting a counter-trend bounce within an intermediate-term retracement. The higher-level yearly grid and rising 200 day benchmark retain a constructive long-term backdrop, although the 100 day average and long-term signal structure remain weak. Volatility is elevated, with 29268.00 and 29053.00 defining the nearby downside pivot zone and 30197.00 representing the first pivot-reversal threshold.
View charts on: AlphaWebTrader HTF Charts
CL Daily View
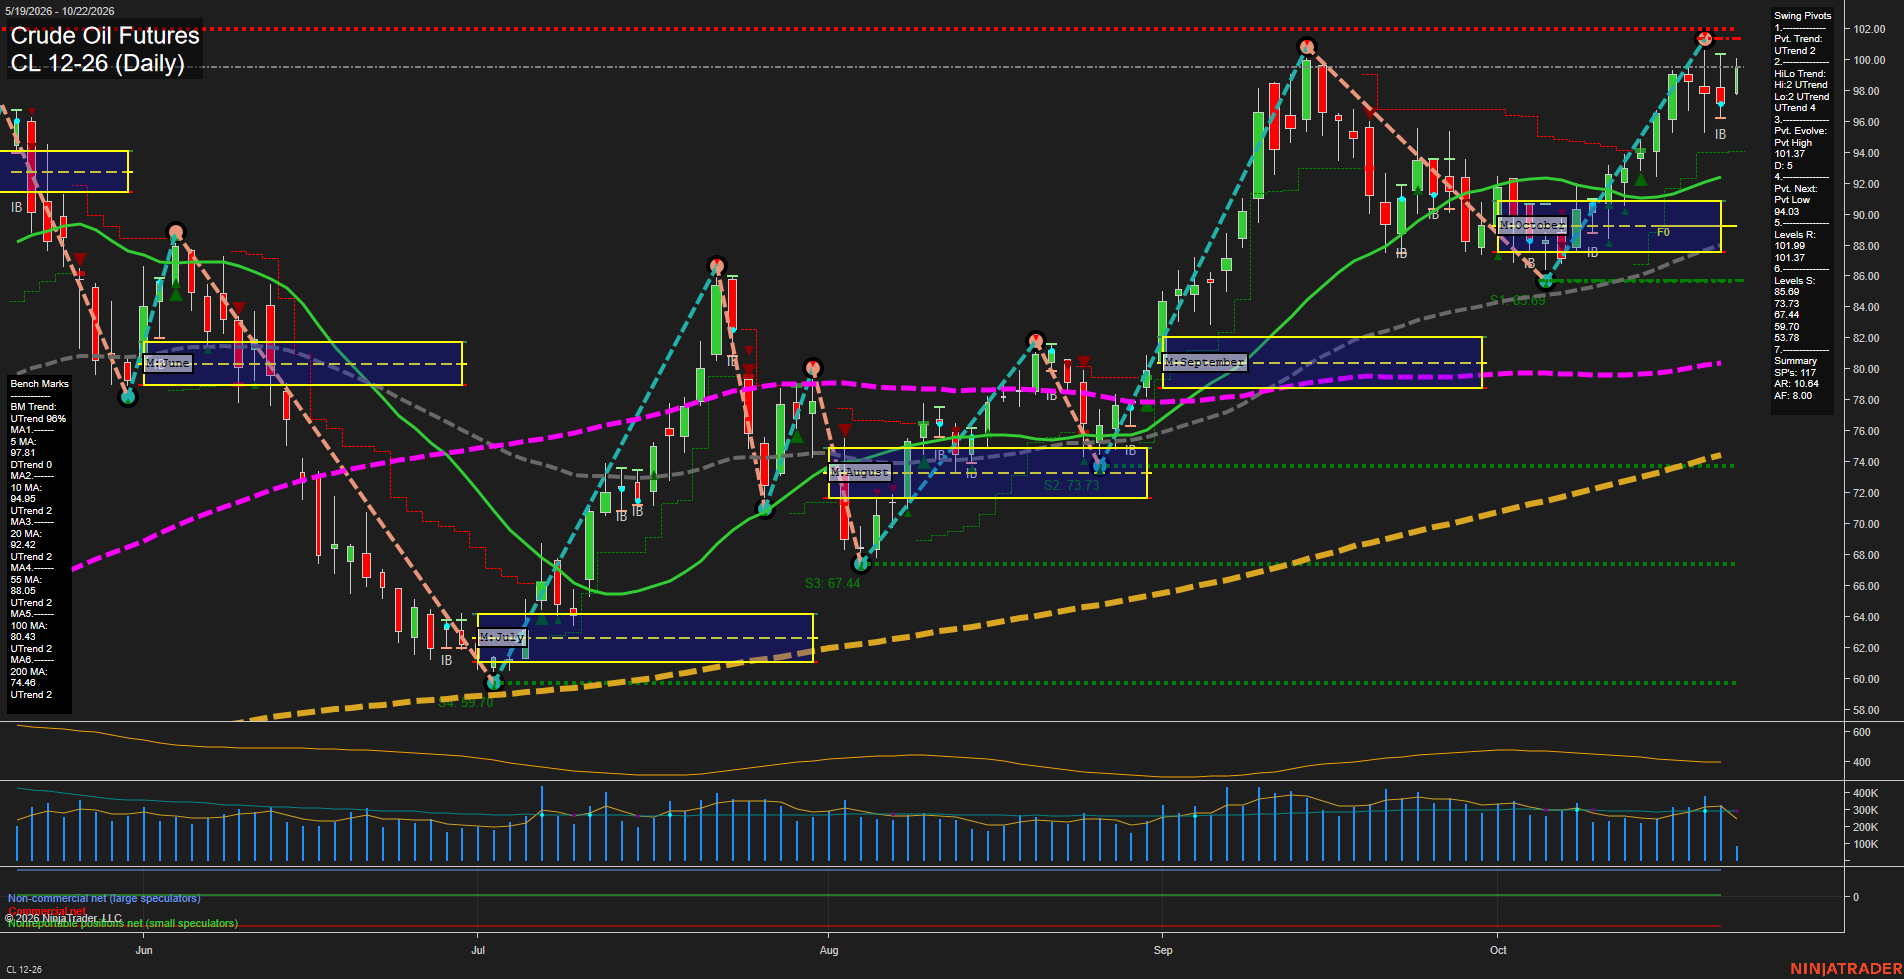
Overall Rating
- Short-Term: Bullish
- Intermediate-Term: Bullish
- Long-Term: Bullish.
Key Insights Summary
Price has recovered sharply from the early-October swing low and is again testing the 101.37-101.89 pivot-resistance cluster. The short-term pivot structure is in UTrend, while the intermediate HiLo trend remains UTrend, supported by price holding above the rising 10, 20, 55, 100, and 200-day benchmarks. The 5-day benchmark remains below price and marked downtrend, reflecting recent near-term consolidation beneath resistance after a fast rally. Monthly and yearly Fib-grid structure remains positive, with higher lows intact above the 94.03 next-pivot level and the 92.44 20-day benchmark.
View charts on: AlphaWebTrader HTF Charts
GC Daily View
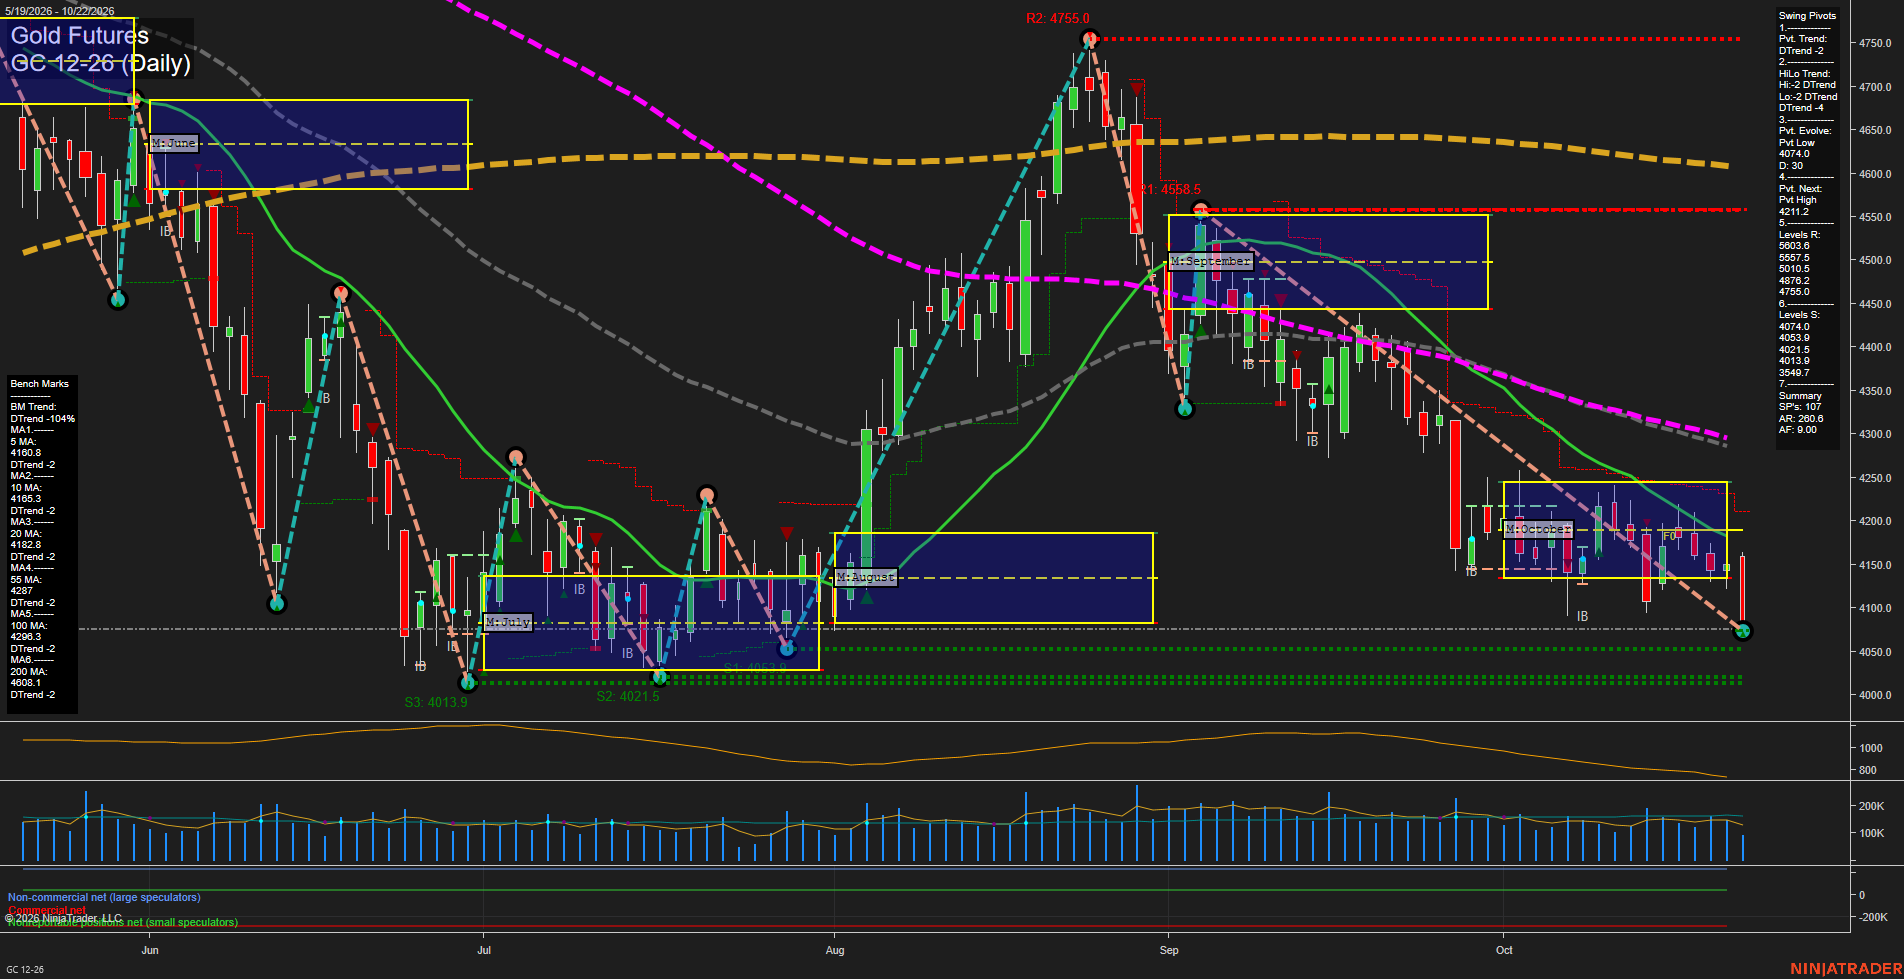
Overall Rating
- Short-Term: Bearish
- Intermediate-Term: Bearish
- Long-Term: Bearish.
Key Insights Summary
Price remains in a broad daily decline, with lower pivot highs and lower pivot lows confirmed by both Pivot Trend and HiLo Trend. The latest decline has carried GC below all six falling benchmark averages and below the weekly, monthly, and yearly Fib-grid reference areas. Small recent candles indicate consolidation near the 4074-4014 support cluster following the October selloff, while 4211 is the nearest pivot-reversal threshold and the 4165-4183 moving-average area is overhead resistance. The chart structure remains bearish across swing horizons, with slowing near-term momentum occurring inside a larger downtrend.
View charts on: AlphaWebTrader HTF Charts
ZB Daily View
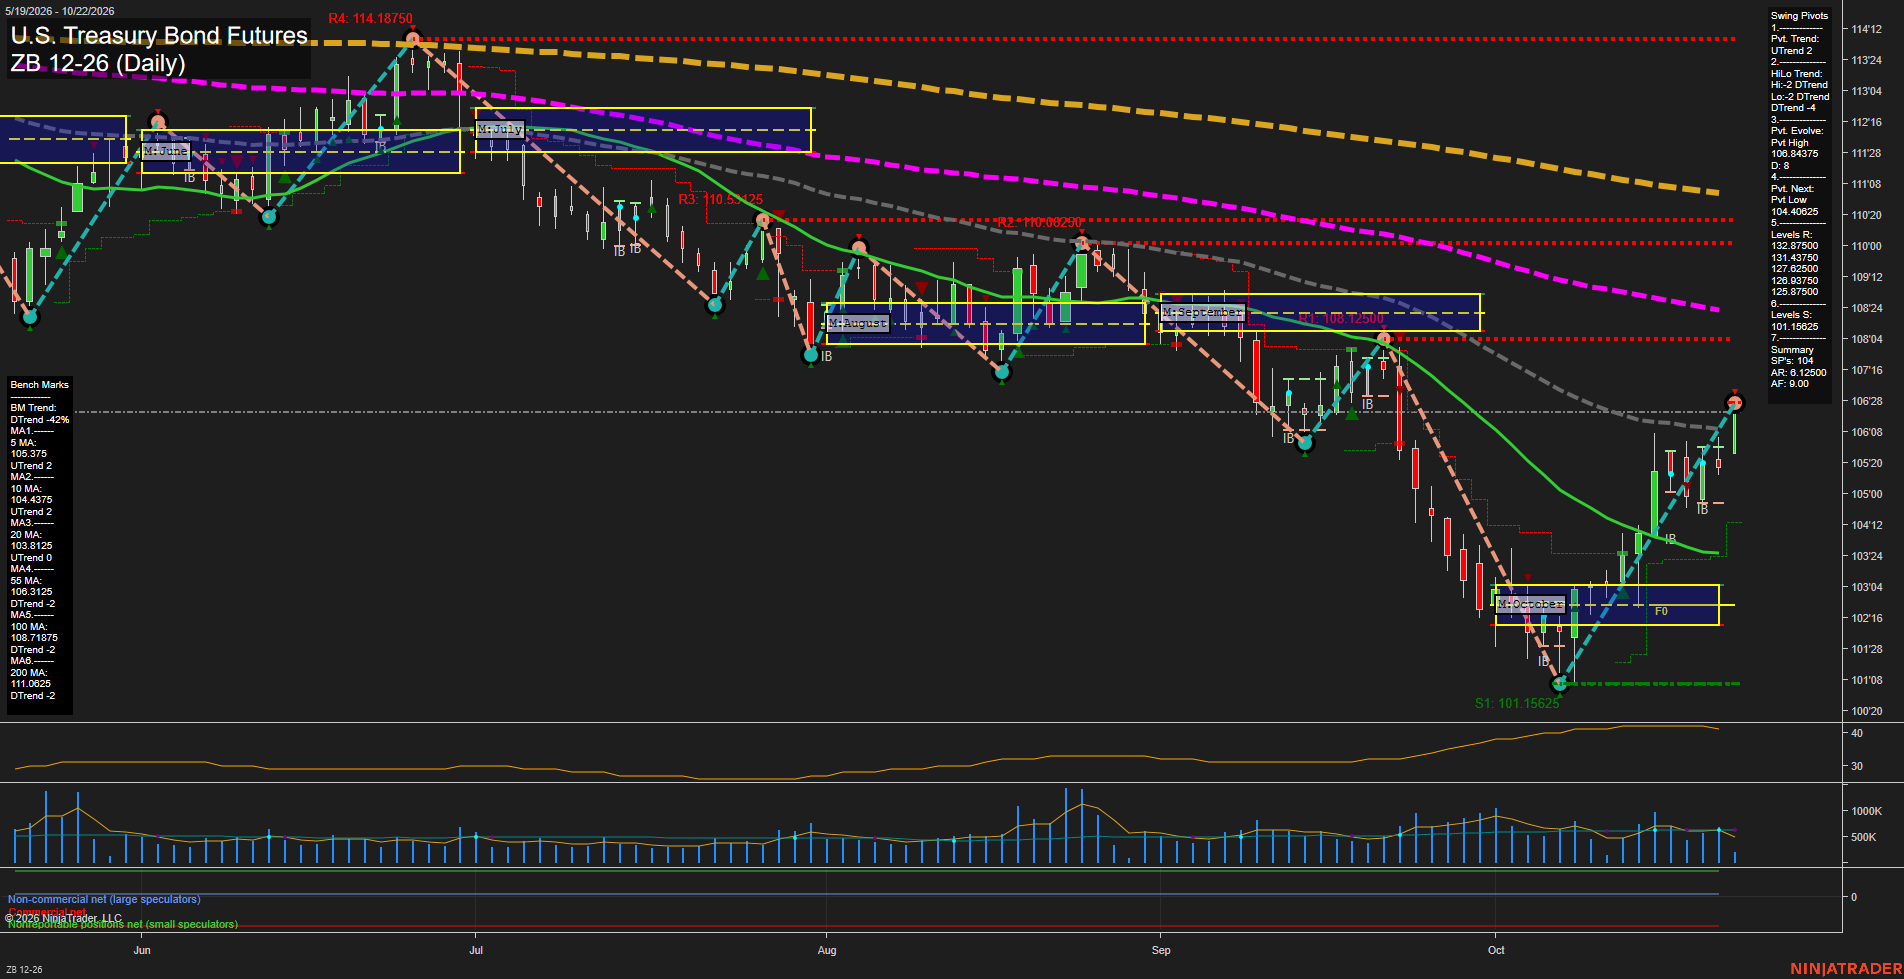
Overall Rating
- Short-Term: Bullish
- Intermediate-Term: Neutral
- Long-Term: Bearish.
Key Insights Summary
The daily structure shows a sharp V-style recovery from the October low near 101.15625, with fast upside momentum and price above the rising 5-, 10-, and 20-day benchmarks. Weekly and monthly fib-grid positioning is positive, confirming a short-term recovery phase. However, price is testing the declining 55-day average near 106.3125 while the intermediate HiLo pivot trend remains down, making the current advance a countertrend rebound within the broader yearly downtrend. The evolving pivot high at 106.375 is the immediate upside structural reference, while 104.40625 defines the next pivot-reversal level. Long-term trend pressure remains intact beneath declining 100- and 200-day averages.
View charts on: AlphaWebTrader HTF Charts
Index ETFs
QQQ led the index ETFs, with DIA and SPY also gaining both versus the prior close and from the open. Mid- and small-caps lagged: IJH and IWM finished above their prior closes but slipped from the open, tempering the breadth of the advance.