
Nasdaq futures remain bearish as S&P 500 futures consolidate and Dow ratings stay bullish; Brent crude tops $114 while gold falls below $4,000.
Fundamentals: Wall Street futures softened after the AI selloff, despite gains in more than 300 S&P 500 stocks in the prior session. Upcoming earnings and the Fed meeting remained key tests for technology shares. Brent rose above $114 as Middle East hostilities threatened energy supplies, while gold fell below $4,000. A Treasury rally paused after technology weakness drove defensive demand.
Technicals: Nasdaq futures show a sharp pullback within a longer-term uptrend, while S&P 500 futures consolidate below key daily averages. Dow futures retain bullish ratings despite a sharp daily rejection. Small-cap and mid-cap futures remain under corrective pressure. In the prior session, Meta, Amazon and Nvidia fell sharply, while Apple, oil and Treasury bond ETFs advanced.
Pre-Market Trading 360° view Market Radar of: holidays, earnings, eco-news, market-news summary, news sentiment, prior session major ETFs, MAG7, Higher Time Frame Analysis Indices Futures Summary, and E-mini S&P500, Nasdaq 100, NYMEX Crude, Gold Futures Daily Chart analysis.
As of: October 23, 2026 07:16 CT
EcoNews Radar U.S. Events
| Date/Day | Impact | Event | Time | Forecast | Previous | Info |
|---|---|---|---|---|---|---|
| 2026-10-23 – Friday | Medium | Flash Manufacturing PMI | 09:45 | 55.4 | 57.0 | An early survey of factory activity, covering output, orders and employment. Index futures traders monitor it for signals about economic momentum and corporate demand. |
| 2026-10-23 – Friday | Medium | Flash Services PMI | 09:45 | 57.9 | 58.7 | An early survey of business activity across service industries. Traders watch it to assess momentum in the economy’s largest sector and implications for earnings and monetary policy. |
| 2026-10-23 – Friday | Medium | Revised UoM Consumer Sentiment | 10:00 | 46.3 | 46.3 | Updates a survey of households’ views on personal finances and economic conditions. Traders monitor it for clues about consumer spending, a major driver of growth and corporate revenues. |
| 2026-10-23 – Friday | Medium | Revised UoM Inflation Expectations | 10:00 | — | 4.7% | Updates households’ expectations for future price increases. Traders watch whether expectations remain anchored, informing assessments of inflation persistence and the monetary policy outlook. |
Summary: The calendar centers on U.S. business momentum and household perceptions of economic conditions and inflation.
For full details visit: Forex Factory EcoNews
NYSE Session Open Gap Radar
Session gaps compare the predicted opening price with the prior session’s close to predict the upcoming session’s opening gap pattern.
| Instrument | Gap | Prior Close | Predicted Open | Gap % |
|---|---|---|---|---|
| USO | ▲ OGU | 162.51 | 166.12 | ▲ +2.22% |
| GLD | ▲ IGD | 369.00 | 368.41 | ▼ -0.16% |
| QQQ | ▲ IGD | 704.47 | 703.21 | ▼ -0.18% |
| SPY | ▲ IGD | 763.96 | 761.25 | ▼ -0.36% |
| IJH | ▲ IGD | 72.80 | 72.35 | ▼ -0.62% |
| IWM | ▲ IGD | 276.67 | 274.85 | ▼ -0.66% |
| DIA | ▼ OGD | 527.89 | 523.68 | ▼ -0.80% |
| TLT | ▼ OGD | 81.74 | 80.49 | ▼ -1.52% |
Before the session opens, the table shows the predicted opening price and gap. Once the session opens, it uses the recorded opening price.
Glossary: IGU — Inside Gap Up: above the prior close, within the prior session’s range. IGD — Inside Gap Down: below the prior close, within that range. OGU — Outside Gap Up: above the prior session’s high. OGD — Outside Gap Down: below the prior session’s low.
As of: 2026-10-23 07:16 CT. Predicted gaps are best estimates as of publication and may change before the regular-session open, particularly when the session is still some time away.
Market News Summary:
Equity futures softened after the AI selloff, while rising energy prices and Fed policy uncertainty remained central market pressures.
Primary Drivers & Risks:
- Primary Driver: AI stock weakness weighs on index futures
- Primary Risk: Middle East escalation intensifies energy inflation pressures
Tone:
Cautious, with technology weakness, defensive Treasury flows and elevated energy prices.
Data, Market and System
Geopolitical:
Renewed U.S.-Iran hostilities, attacks on Saudi energy infrastructure and shipping disruptions dominated supply concerns. Iran said it was prepared for warfare, while President Trump accused it of manipulating the oil market. Separately, the U.S. Treasury sought tighter restrictions on Chinese biotechnology and AI deals, contrasting with reported global-use approvals for China’s DeepSeek and MiniMax.
Oil / Energy:
Brent climbed above $114 to a five-month high, while U.S. crude held above $100. European natural-gas prices reached their highest level since late 2022 as escalation fears threatened LNG supply ahead of winter.
Middle East crude flows largely recovered to around 24 million barrels per day, but refined-product flows remained 50% below pre-war levels. Tight fuel markets pushed refining margins to record highs, supporting oil-major earnings, while Russian ESPO sellers sought record premiums amid Gulf export uncertainty.
Gold / Metals:
Gold broke below $4,000, with December Fed rate-hike risk and oil-driven inflation pressure cited as factors behind the selling.
Fed / Financials:
The Treasury rally paused after technology selling drove investors toward government bonds. Higher interest rates were cited as compressing equity price-to-earnings multiples, keeping rate sensitivity in focus ahead of the Fed meeting.
French bond yields and spreads over German debt reached levels not seen since the eurozone debt crisis amid fiscal and political concerns. Citi received approval for a wholly owned Chinese securities company, while Munich Re raised its full-year profit guidance.
Conclusion:
AI stock selling remained the main equity-index driver, with early Nasdaq stabilization giving way to softer Wall Street futures. Oil above $100 and persistent Middle East supply concerns added inflation pressure.
Broad participation outside technology contrasted with weakness in major index leaders. Treasury safe-haven demand, Fed policy uncertainty and French sovereign-debt stress added cross-currents, while recovering crude flows contrasted with continued refined-product shortages.
Market News Sentiment
Sentiment Bias shows the balance of positive and negative news coverage.
| Coverage | Info | ||||||||||
|---|---|---|---|---|---|---|---|---|---|---|---|
▼ Market news
| Sentiment Summary: Neutral coverage led at 43%, but negative news outweighed positive 39% to 18%, reflecting Thursday’s technology selloff over AI spending and financing concerns, followed by softer futures early Friday despite gains in more than 300 S&P 500 constituents Thursday. Higher energy prices amid U.S.–Iran tensions and September’s above-forecast producer inflation added pressure, while next week’s earnings, Fed decision and economic releases remained ahead. Conclusion: The main context is technology-led index weakness alongside broader stock resilience and Treasury demand, with AI funding concerns and inflation central to coverage ahead of next week’s events. | ||||||||||
▼ GLD / Gold
| Sentiment Summary: Coverage was 57% negative versus 7% positive, driven by Thursday’s stronger-than-expected jobless claims report and Hormuz-related oil gains that reinforced inflation and Fed-tightening concerns despite falling yields. After briefly stabilizing in early Asian trading, gold broke below $4,000 by Friday morning as reports highlighted December rate-hike risk; Thursday’s coverage also linked precious-metals selling to Meta’s AI spending plans. Conclusion: The main context for indices futures day traders is oil-driven inflation and tighter-policy risk alongside equity weakness, with gold reported as providing ineffective protection against recent stock-market pullbacks. | ||||||||||
▼ USO / Oil
| Sentiment Summary: Coverage was slightly negative (41% negative, 36% positive, 23% neutral), balancing oil gains and strong refining margins against Middle East supply disruptions and oil-driven inflation and rate concerns. Thursday’s reports covered Wednesday’s Saudi attacks and overnight Hormuz tanker damage; after a late-Thursday pullback, Friday reports showed Brent above $114 despite largely recovered regional crude flows, with refined-product flows still 50% below prewar levels. Conclusion: For indices futures, the main reported context was elevated oil prices and rate concerns alongside a tech selloff tied to AI spending and financing concerns, with Friday reports showing signs of stabilization after a Treasury safe-haven rally. |
Glossary: Sentiment Bias = (positive articles − negative articles) ÷ total articles × 100. It ranges from −100% negative to +100% positive. A reading near zero indicates little directional bias. Neutral articles reduce the score’s strength. ▲ positive; ▼ negative; — balanced. These readings describe news coverage, not market-price direction.
Market Technical Analysis
Analysis of VIX volatility, prior-session major ETFs and mega-cap tech stocks, and real-time futures snapshots and higher-time-frame analysis.
VIX — Market Fear Gauge Daily
| Level | Open | High | Low | DNC% | DOC% | VR |
|---|---|---|---|---|---|---|
| 19.05 | 17.84 | 20.31 | 17.71 | +14.21% | +6.78% | 12.03 |
VIX rose 6.78% from the session's opening level. VIX rose 14.21% versus the previous session close. Expected volatility rose from the period open.
Major ETFs and Mega Cap Tech Stocks
Nasdaq futures initially steadied after the index’s worst session since June; later headlines reported broader Wall Street futures dipping and telecom shares sliding. Technology weakness contrasted with gains in more than 300 S&P 500 constituents on Thursday, highlighting a split between index leaders and the broader market. Upcoming earnings and the Fed meeting form the next major tests for the AI rally.
BlackRock’s technology team reported improved AI infrastructure economics, with estimated investment payback below three years versus up to four years previously. However, Bloom Energy failed to receive the usual post-results lift despite beating earnings and revenue estimates, underscoring the uneven response to AI-linked corporate results.
ETF, Mag7, and Cross-Market ETF prior day Insights
Overall Tone
Daily risk tone was defensive overall, but resilience outside technology and gains in long-term Treasuries kept the retreat from being uniform.
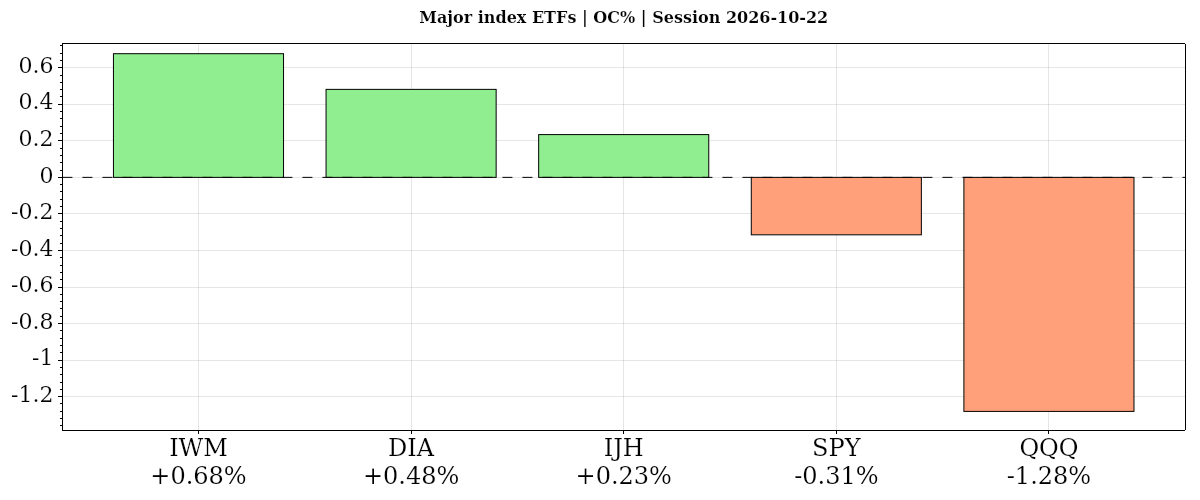
| Instrument | Bias | Date | DNC% | DOC% | O | H | L | C | VWAP | Vol |
|---|---|---|---|---|---|---|---|---|---|---|
| ▲ IWM | ▲ ▲ ▲ | 2026-10-22 | ▲ +0.07% | ▲ +0.68% | 274.81 | 277.28 | 274.49 | 276.67 | ▲ 275.95 | 25,510,051 |
| ▲ DIA | ▲ ▲ ▲ | 2026-10-22 | ▲ +0.04% | ▲ +0.48% | 525.36 | 528.45 | 524.29 | 527.89 | ▲ 526.66 | 2,598,051 |
| ▲ IJH | ▼ ▲ ▲ | 2026-10-22 | ▼ -0.80% | ▲ +0.23% | 72.63 | 72.86 | 72.14 | 72.80 | ▲ 72.57 | 8,766,849 |
| ▼ SPY | ▼ ▼ ▲ | 2026-10-22 | ▼ -1.18% | ▼ -0.31% | 766.37 | 767.71 | 761.16 | 763.96 | ▲ 763.69 | 53,231,890 |
| ▼ QQQ | ▼ ▼ ▼ | 2026-10-22 | ▼ -2.86% | ▼ -1.28% | 713.61 | 715.43 | 701.90 | 704.47 | ▼ 707.09 | 63,371,830 |
| AVG/Sum | — | — | -0.95% | -0.04% | — | — | — | — | — | 153,478,671 |
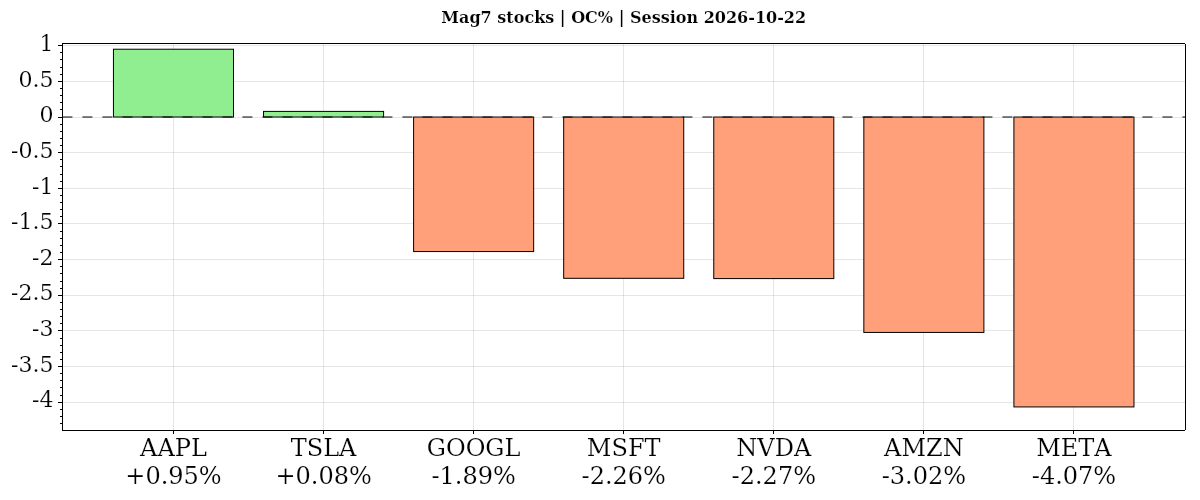
| Instrument | Bias | Date | DNC% | DOC% | O | H | L | C | VWAP | Vol |
|---|---|---|---|---|---|---|---|---|---|---|
| ▲ AAPL | ▲ ▲ ▲ | 2026-10-22 | ▲ +1.23% | ▲ +0.95% | 344.94 | 348.36 | 342.28 | 348.22 | ▲ 346.54 | 43,726,401 |
| ▲ TSLA | ▼ ▲ ▼ | 2026-10-22 | ▼ -3.08% | ▲ +0.08% | 374.29 | 388.86 | 373.71 | 374.58 | ▼ 380.89 | 51,503,614 |
| ▼ GOOGL | ▼ ▼ ▼ | 2026-10-22 | ▼ -3.15% | ▼ -1.89% | 330.45 | 331.43 | 322.00 | 324.22 | ▼ 325.71 | 27,461,164 |
| ▼ MSFT | ▼ ▼ ▼ | 2026-10-22 | ▼ -2.23% | ▼ -2.26% | 533.14 | 533.60 | 520.30 | 521.08 | ▼ 523.38 | 21,091,198 |
| ▼ NVDA | ▼ ▼ ▼ | 2026-10-22 | ▼ -4.40% | ▼ -2.27% | 217.13 | 218.88 | 211.26 | 212.21 | ▼ 213.48 | 124,608,379 |
| ▼ AMZN | ▼ ▼ ▼ | 2026-10-22 | ▼ -4.57% | ▼ -3.02% | 258.18 | 258.41 | 248.00 | 250.38 | ▼ 251.42 | 48,315,905 |
| ▼ META | ▼ ▼ ▼ | 2026-10-22 | ▼ -6.98% | ▼ -4.07% | 676.35 | 681.07 | 639.69 | 648.85 | ▼ 651.98 | 40,424,790 |
| AVG/Sum | — | — | -3.31% | -1.78% | — | — | — | — | — | 357,131,451 |
Mag7 Stocks
Apple was the lone Mag7 gainer, advancing both versus the previous close and from the open, while Meta led losses at 6.98% and 4.07%, respectively. Amazon, Nvidia, Alphabet and Microsoft also weakened on both comparisons; Tesla fell 3.08% versus the previous close despite edging up 0.08% from the open.
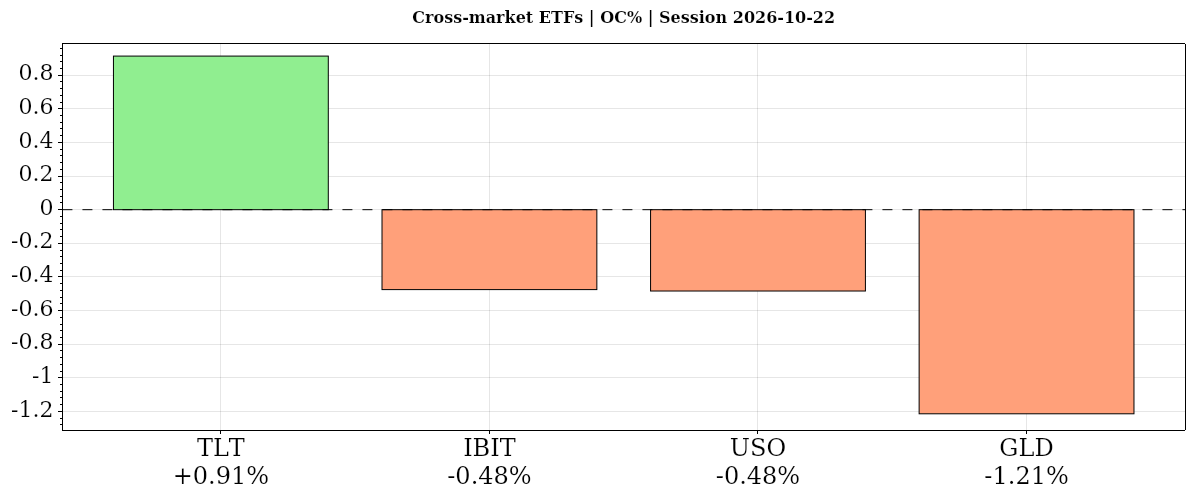
| Instrument | Bias | Date | DNC% | DOC% | O | H | L | C | VWAP | Vol |
|---|---|---|---|---|---|---|---|---|---|---|
| ▲ TLT | ▲ ▲ ▲ | 2026-10-22 | ▲ +1.87% | ▲ +0.91% | 81.00 | 81.92 | 80.87 | 81.74 | ▲ 81.54 | 64,530,544 |
| ▼ IBIT | ▼ ▼ ▼ | 2026-10-22 | ▼ -3.72% | ▼ -0.48% | 46.28 | 46.40 | 45.71 | 46.06 | ▼ 46.06 | 43,062,165 |
| ▼ USO | ▲ ▼ ▲ | 2026-10-22 | ▲ +1.70% | ▼ -0.48% | 163.30 | 163.77 | 160.09 | 162.51 | ▲ 161.88 | 4,240,642 |
| ▼ GLD | ▼ ▼ ▼ | 2026-10-22 | ▼ -2.63% | ▼ -1.21% | 373.54 | 373.87 | 368.35 | 369.00 | ▼ 370.20 | 16,966,525 |
| AVG/Sum | — | — | -0.70% | -0.31% | — | — | — | — | — | 128,799,876 |
Cross-Market ETFs
Long-term Treasury ETF TLT rose on both comparisons, diverging from the broader equity retreat, while gold and bitcoin ETFs declined on both. Oil ETF USO gained 1.70% versus the previous close but slipped 0.48% from the open, distinguishing its daily gain from its weaker session.
Glossary: Instrument — ticker symbol; hover for the instrument or company name; Date — session date. DNC% — prior-session close to this session’s close; DOC% — daily session open-to-close percentage change. O — open; H — high; L — low; C — close, all for the table’s daily or weekly session; VWAP — volume-weighted average price; its arrow shows whether the close is above or below VWAP. Vol — period trading volume.
Bias — three directional readings, in order: DNC%, DOC%, then VWAP. ▲ positive/above; ▼ negative/below; — neutral or unavailable. Matching arrows show alignment; opposing arrows show mixed conditions. AVG/Sum — simple average of percentage changes and sum of reported volumes.
Futures Session Fib Grid Analysis – Snapshot
Session Fib Grids normalise market positioning as percentages, making direction and alignment comparable across different asset types.
Latest available snapshot for each instrument; Time(CT) shows the individual update date and time.
| Instrument | Bias | Time(CT) | YSFG | MSFG | WSFG | RSFG | SFG | TSI |
|---|---|---|---|---|---|---|---|---|
| ▼ ES | ▲ ▼ ▼ ▼ ▼ ▼ | 2026-10-23 07:17:49 | ▲ +51 | ▼ -26 | ▼ -2 | ▼ -57 | ▼ -12 | ▼ -138 |
| ▼ NQ | ▲ ▼ ▼ ▼ ▼ ▼ | 2026-10-23 07:17:44 | ▲ +55 | ▼ -84 | ▼ -13 | ▼ -69 | ▼ -9 | ▼ -107 |
| ▼ YM | ▲ ▲ ▲ ▼ ▼ ▼ | 2026-10-23 07:17:27 | ▲ +36 | ▲ +63 | ▲ +52 | ▼ -27 | ▼ -16 | ▼ -215 |
| ▼ EMD | ▲ ▼ ▲ ▼ ▼ ▼ | 2026-10-23 07:17:13 | ▲ +25 | ▼ -1 | ▲ +1 | ▼ -31 | ▼ -11 | ▼ -198 |
| ▲ RTY | ▲ ▼ ▲ ▲ ▼ ▼ | 2026-10-23 07:17:49 | ▲ +29 | ▼ -35 | ▲ +57 | ▲ +1 | ▼ -10 | ▼ -115 |
| ▼ FDAX | ▲ ▲ ▼ ▼ ▼ ▼ | 2026-10-23 07:17:47 | ▲ +5 | ▲ +3 | ▼ -68 | ▼ -71 | ▼ -12 | ▼ -164 |
| ▼ NKD | ▲ ▼ ▼ ▼ ▼ ▼ | 2026-10-23 07:17:06 | ▲ +138 | ▼ -91 | ▼ -29 | ▼ -3 | ▼ -7 | ▼ -156 |
| Instrument | Bias | Time(CT) | YSFG | MSFG | WSFG | RSFG | SFG | TSI |
|---|---|---|---|---|---|---|---|---|
| ▼ BTC | ▼ ▼ ▼ ▼ ▼ ▼ | 2026-10-23 07:17:27 | ▼ -34 | ▼ -20 | ▼ -10 | ▼ -17 | ▼ -8 | ▼ -96 |
| ▼ GC | ▼ ▼ ▼ ▼ ▼ ▼ | 2026-10-23 07:17:46 | ▼ -137 | ▼ -44 | ▼ -104 | ▼ -81 | ▼ -1 | ▼ -9 |
| ▲ CL | ▲ ▲ ▲ ▲ ▲ ▲ | 2026-10-23 07:17:49 | ▲ +188 | ▲ +82 | ▲ +29 | ▲ +54 | ▲ +22 | ▲ +171 |
| ▼ 6E | ▼ ▼ ▼ ▼ ▲ ▼ | 2026-10-23 07:17:25 | ▼ -57 | ▼ -69 | ▼ -7 | ▼ -21 | ▲ +7 | ▼ -65 |
| ▼ ZB | ▼ ▲ ▲ ▼ ▼ ▲ | 2026-10-21 09:39:59 | ▼ -39 | ▲ +77 | ▲ +6 | ▼ -3 | ▼ -2 | ▲ +29 |
Glossary: YSFG — yearly; MSFG — monthly; WSFG — weekly; RSFG — regular trading hours (RTH); SFG — the current session, including pre-market or other sessions. TSI indicates trend strength and power.
Bias shows trend alignment across these six readings. The arrows follow the column order: YSFG, MSFG, WSFG, RSFG, SFG and TSI. Matching arrows show alignment; opposing arrows show mixed conditions.
Futures Higher Time Frame Analysis
Summary of the current state of US Indices Futures based on higher time-frame (HTF) technical analysis as of: 2026-10-23: 07:17 CT.
US Indices Futures
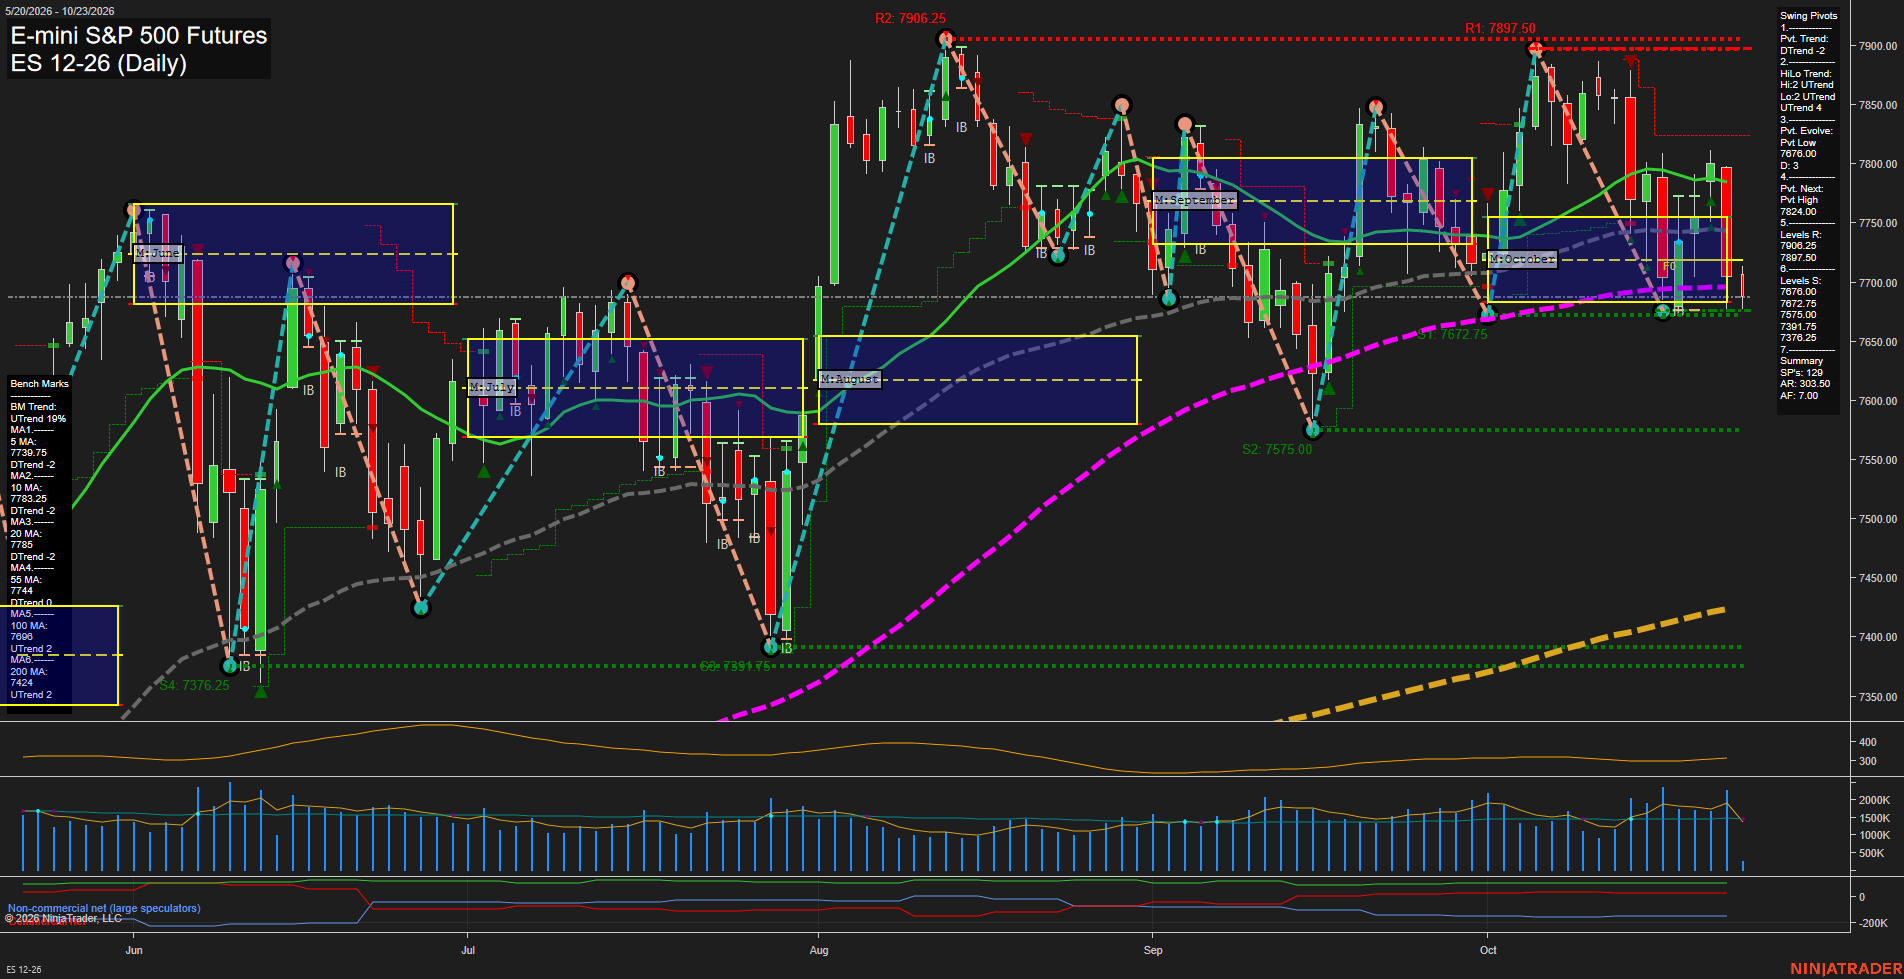
- ES YSFG bullish, MSFG below F0%, WSFG support holding, declining daily 10/20/55 benchmarks, DTrend pivots, support 7672.75–7676.00, resistance 7897.50–7906.25.
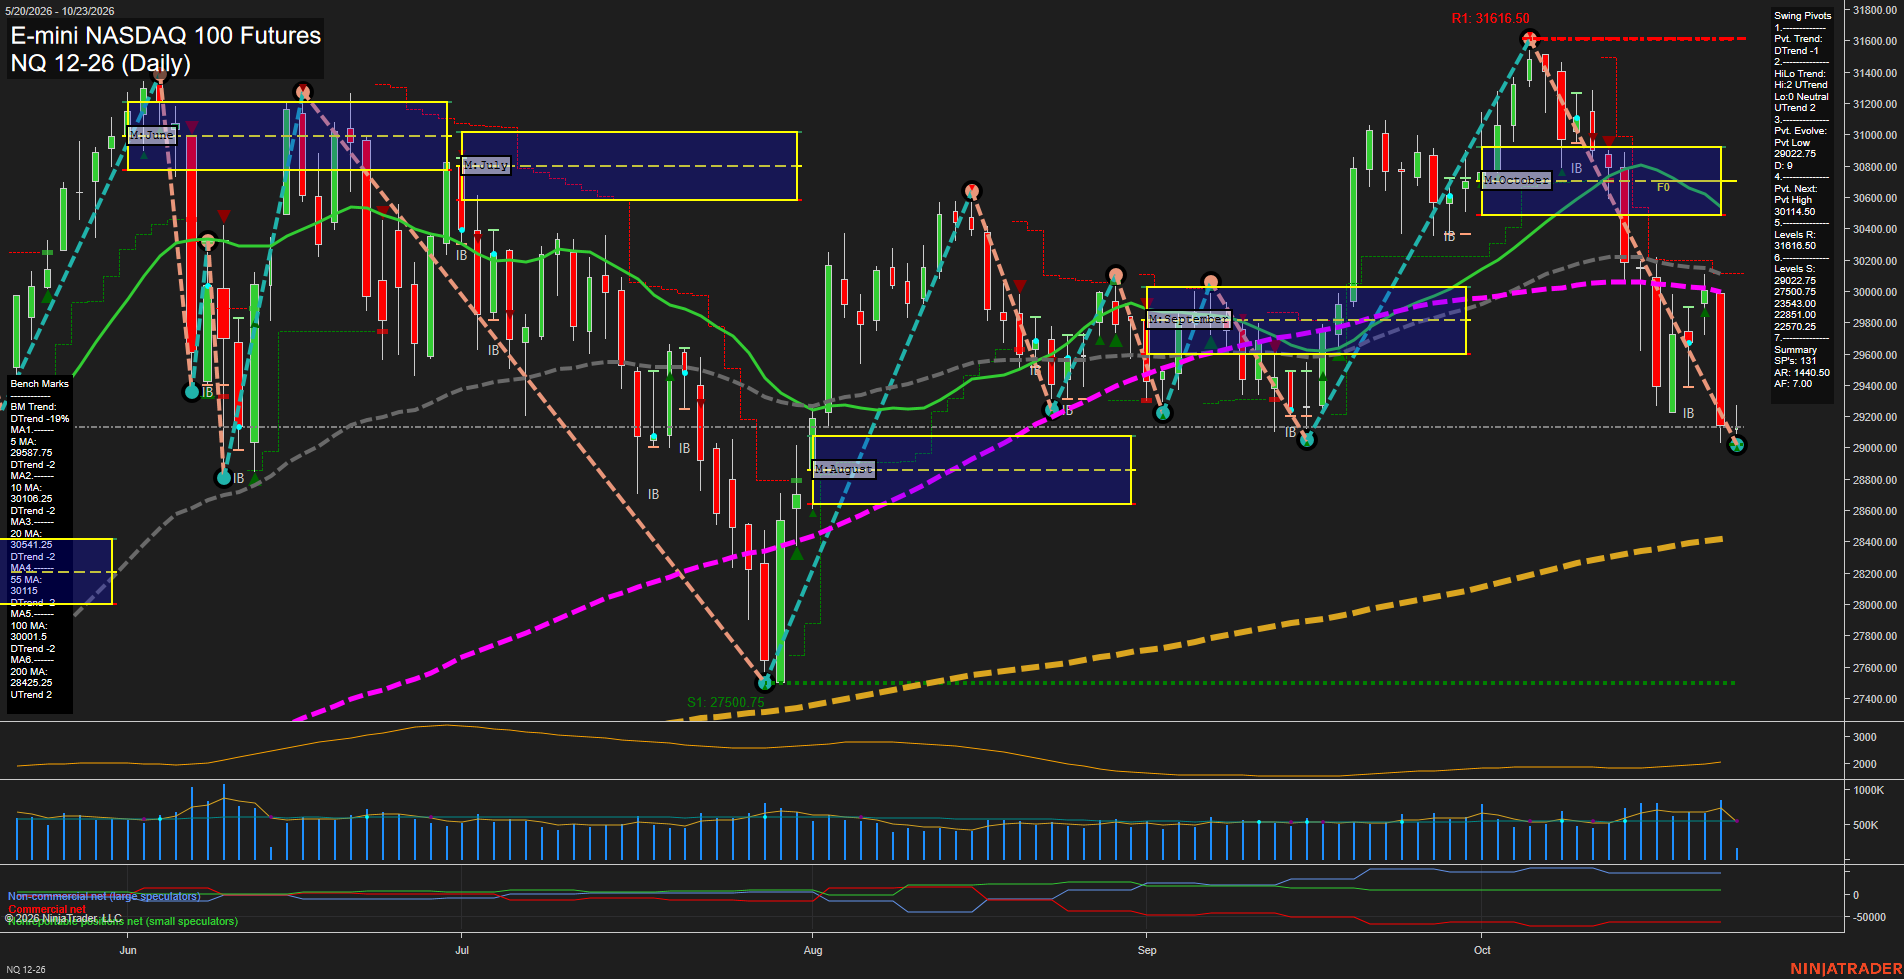
- NQ YSFG bullish, MSFG/WSFG below F0%, below benchmarks through daily 100, DTrend pivots, support 29022.75–29027.75, reversal 30114.50, resistance 31616.50.
- YM YSFG/MSFG/WSFG above F0%, rising weekly 55/100/200 benchmarks, daily UTrend versus weekly DTrend, support 51970/50859, resistance 53118/55316.
- EMD YSFG/MSFG/WSFG above F0%, below daily 5–200 benchmarks, DTrend pivots, support 3600.3–3609.1, reversal 3708.7, resistance 3737.8.
- RTY YSFG/WSFG above F0%, MSFG below F0%, declining daily 20/55/100 benchmarks, lower-high/lower-low pivots, support 2723.2–2723.3, reversal 2803.7, resistance 2887.2.
- FDAX YSFG/MSFG bullish, WSFG below F0%, below weekly 5/10/20 benchmarks, rising 55/100/200 benchmarks, DTrend pivots, support 24925, reversal 26255, resistance 26847.
Overall State
- Short-Term: Bearish
- Intermediate-Term: Neutral
- Long-Term: Bullish
Conclusion
Short-term downside alignment spans NQ, EMD, and FDAX, while ES and RTY retain corrective pivot structures. YM shows relative strength through bullish Fib-grid alignment and a daily UTrend. Intermediate conditions diverge: ES, NQ, and RTY remain below monthly F0%, whereas YM, EMD, and FDAX retain higher monthly positioning. Yearly grids and rising longer-term weekly benchmarks preserve the broader bullish framework, although EMD and RTY carry neutral daily long-term ratings. NQ’s fast decline contrasts with RTY’s rebound and EMD’s compressed base; the listed swing supports and pivot-reversal thresholds define their structural boundaries.
Note: Intra-day counter-trend pullbacks or retracements may occur, HTF is context for informational usage and market structure. Glossary: Session Fib Grids periods of YSFG:’Yearly’, MSFG:’Monthly’, WSFG:’Weekly’
For full details visit: AlphaWebTrader Technicals
SPY Daily View
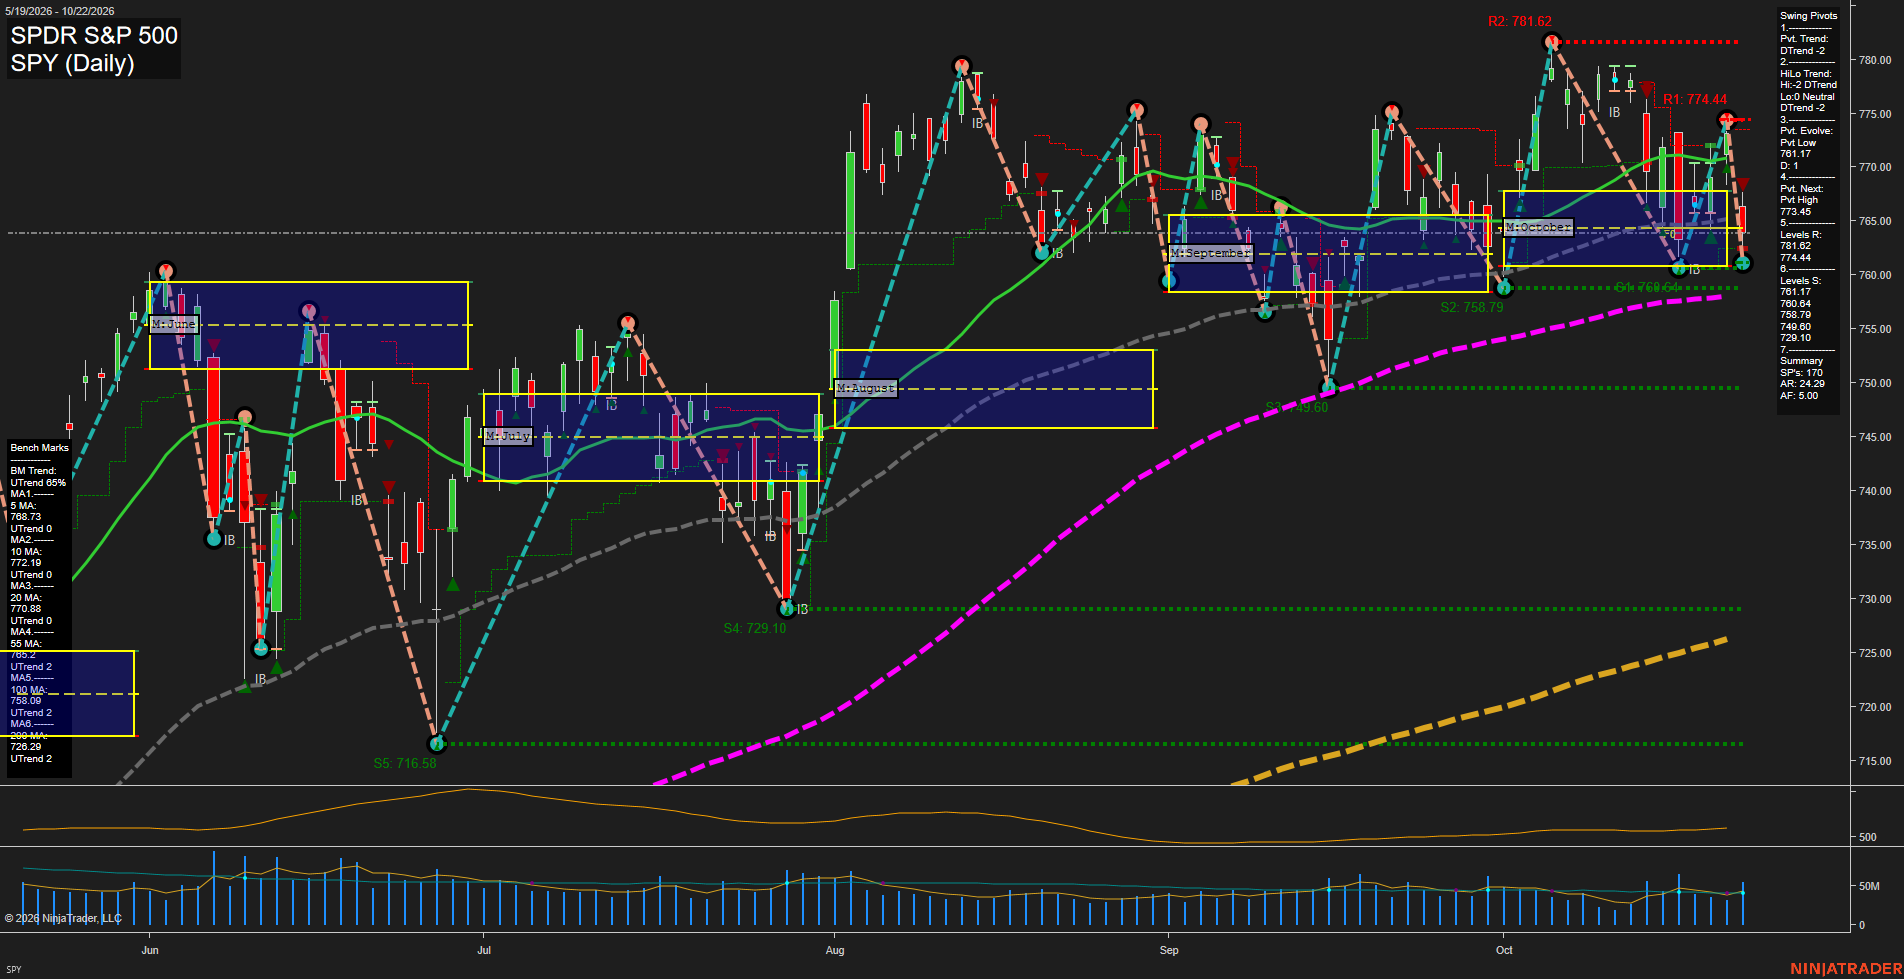
Overall Rating
- Short-Term: Bearish
- Intermediate-Term: Bearish
- Long-Term: Bullish.
Key Insights Summary
The SPY proxy for index futures reflects a sharp short-term downside rotation, with the large decline closing below the 5, 10, 20, and 55-day benchmarks. The active pivot structure is a DTrend and the next upside pivot threshold is 773.45, while 761.17 and 760.64 define the immediate downside pivot/support cluster. For a futures swing-trader market read, this is a countertrend pullback within a still-positive long-term moving-average structure: price remains above the rising 100-day and 200-day benchmarks. The 774.44 to 781.62 resistance zone marks the prior swing-high supply area, while a sustained break beneath the 758.79 to 749.60 support band would extend the intermediate corrective sequence.
View charts on: AlphaWebTrader HTF Charts
ES Daily View
Overall Rating
- Short-Term: Neutral
- Intermediate-Term: Bearish
- Long-Term: Bullish.
Key Insights Summary
Price is consolidating below the declining 10, 20, and 55-day benchmarks after rejection from the early-October high zone near 7900. The short-term pivot sequence remains in DTrend, although price is holding above the weekly F0% area and the 7676.00 to 7672.75 support cluster. Intermediate structure is corrective as the October MSFG remains below F0%, while the annual grid and rising 100-day and 200-day averages preserve the broader bullish trend. The chart reflects a choppy retracement within a larger uptrend, with 7824.00 as the next pivot reversal level and 7897.50 to 7906.25 as major overhead resistance.
View charts on: AlphaWebTrader HTF Charts
QQQ Daily View
Overall Rating
- Short-Term: Bearish
- Intermediate-Term: Bearish
- Long-Term: Bullish.
Key Insights Summary
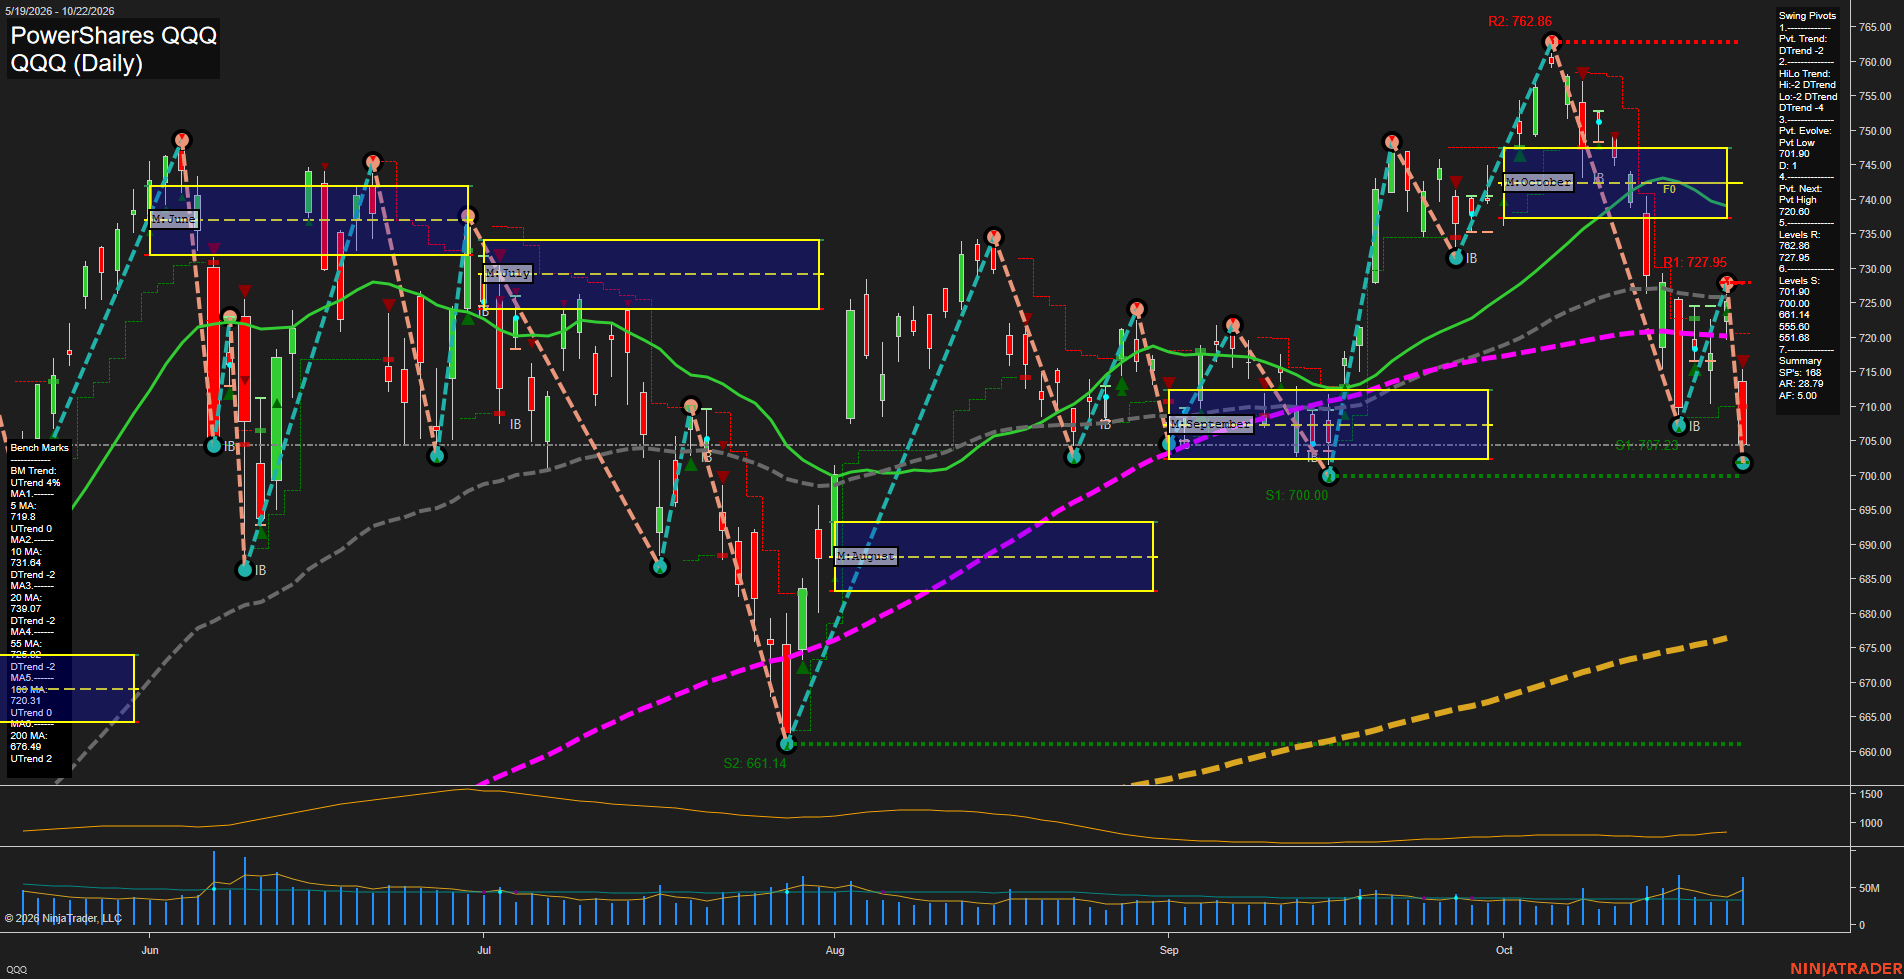
QQQ, as a liquid proxy for Nasdaq futures swing conditions, shows a fast downside impulse with a large red daily bar pressing the 701.90 pivot-low support. Both the short-term pivot trend and intermediate HiLo trend are down, while price remains beneath the declining 10-, 20-, and 55-day benchmarks. The 720.60 pivot-high reversal threshold and 727.95 resistance define the overhead countertrend zone. Long-term structure remains positive because the rising 100- and 200-day averages are materially below price, framing the current action as a sharp intermediate pullback within a broader long-term uptrend.
View charts on: AlphaWebTrader HTF Charts
NQ Daily View
Overall Rating
- Short-Term: Bearish
- Intermediate-Term: Bearish
- Long-Term: Bullish.
Key Insights Summary
Price is in a fast, high-range decline from the October swing high near 31616.50 and has reached the active 29027.75 swing-low support. Short-term structure is bearish, with price below every benchmark through the 100-day average and both weekly and monthly Fib-grid readings below their F0% levels. The intermediate HiLo trend remains upward, creating a countertrend condition within the larger 2026 advance; however, the current decline has produced lower highs and lower lows. The 200-day average remains rising beneath price near 28425.25, while the next lower structural support is 27500.75. A recovery through 30114.50 would establish the next short-term pivot-high reversal threshold.
View charts on: AlphaWebTrader HTF Charts
USO Daily View
Overall Rating
- Short-Term: Bullish
- Intermediate-Term: Bullish
- Long-Term: Bullish.
Key Insights Summary
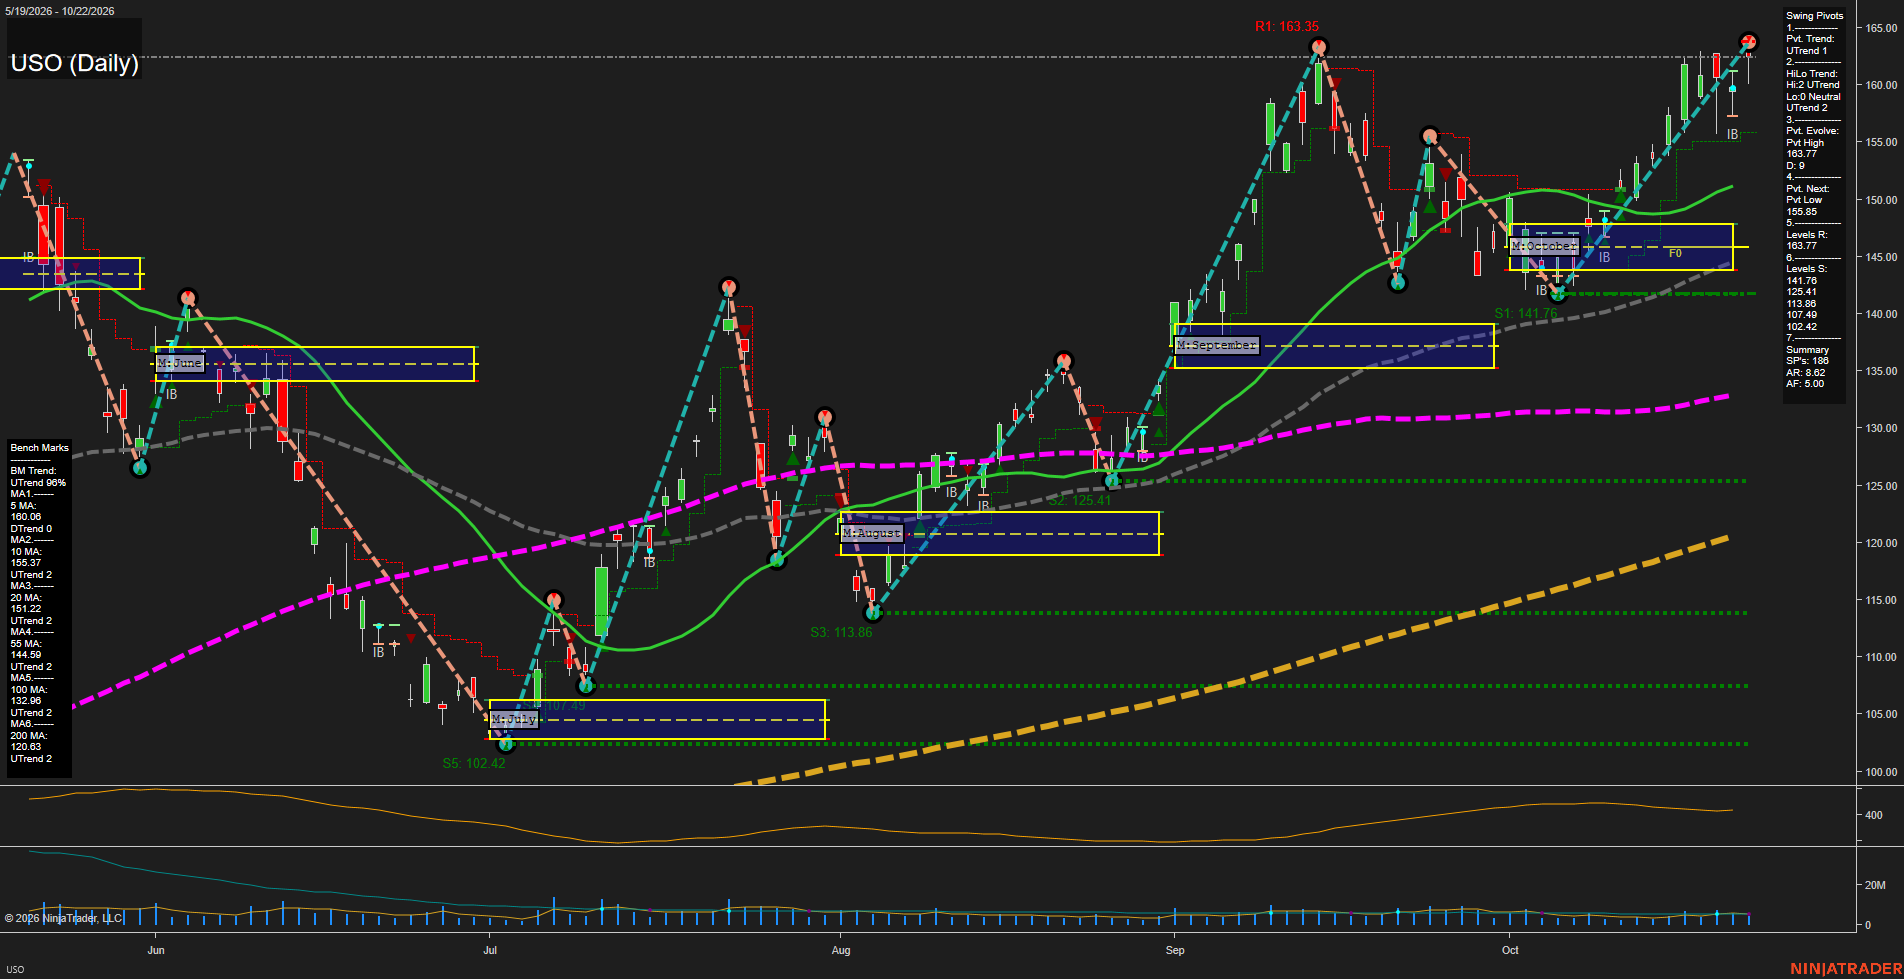
USO is in a broad daily-chart advance, with price holding above every benchmark average and the moving-average structure positively aligned from the 5-day through 200-day measures. The latest rally has produced higher highs and higher lows, while the pivot structure remains in UTrend on both short- and intermediate-term measures. Price is pressing the 163.77 pivot-high resistance area after a fast upside leg from the October NTZ, making the current phase extended relative to the 5-day and 10-day averages. The 155.85 next-pivot level defines the nearest swing retracement reference, while the October MSFG and 20-day average near 151.22 provide the principal intermediate trend zone. Rising ATR reflects expanded daily range and an active crude-oil volatility cycle.
View charts on: AlphaWebTrader HTF Charts
CL Daily View
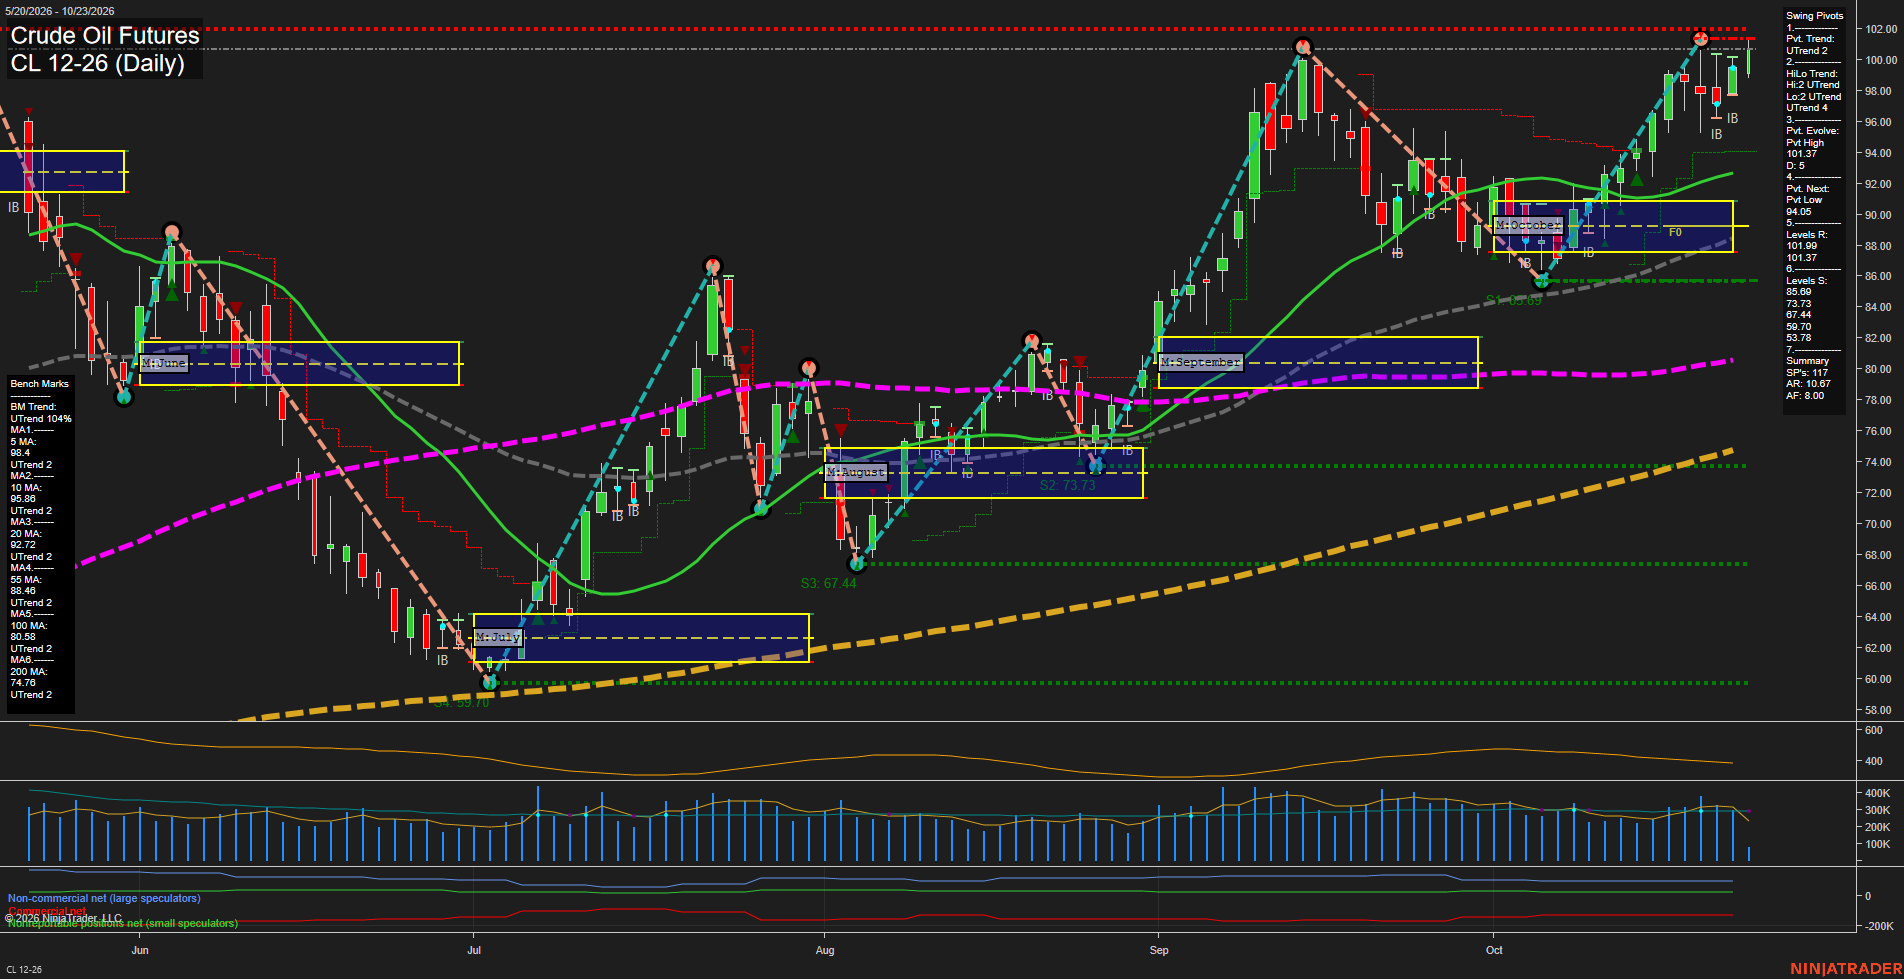
Overall Rating
- Short-Term: Bullish
- Intermediate-Term: Bullish
- Long-Term: Bullish.
Key Insights Summary
CL remains in a broad daily-chart advance, with price above every benchmark moving average and all benchmark trends aligned upward. The recent decline from the 101.37 pivot high appears as a pullback within that larger uptrend, followed by a rebound that has restored price above the weekly and monthly Fib-grid centers. Near-term action remains below the 101.37 pivot resistance, while 94.05 defines the next swing-pivot reversal level. The current structure shows higher-level trend strength with moderate momentum rather than an extended high-velocity breakout.
View charts on: AlphaWebTrader HTF Charts
GLD Daily View
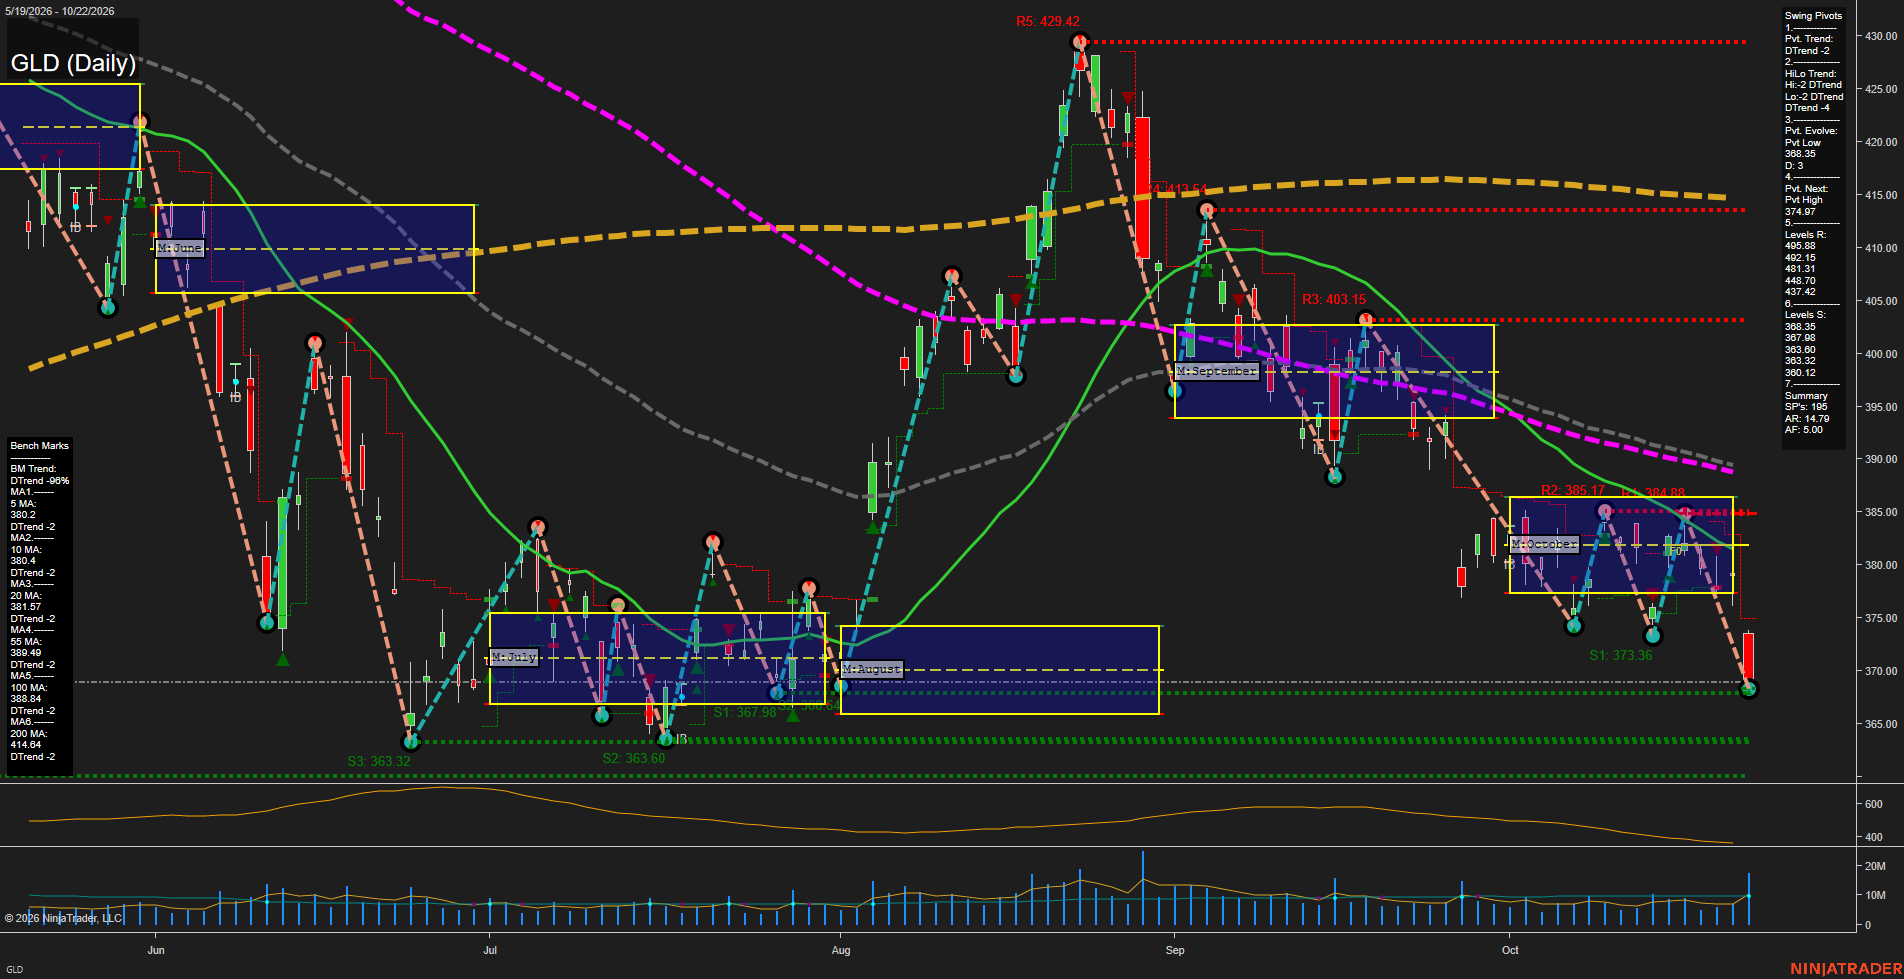
Overall Rating
- Short-Term: Bearish
- Intermediate-Term: Bearish
- Long-Term: Bearish.
Key Insights Summary
GLD reflects a broad futures-style downside swing structure: price has broken below the October monthly NTZ and all six daily benchmark averages, while both pivot trend measures remain in DTrend. The latest decline expanded into the 368.35 pivot-low area with large, fast-momentum bars, establishing 368.35 to 367.98 as the immediate downside test zone. A rebound would initially be characterized as countertrend while price remains beneath the 374.97 next-pivot threshold and the clustered 5-to-20 day averages near 380 to 382. The larger structure retains lower highs from the 429.42 peak, with the 389 to 403 area representing the prior breakdown and overhead resistance region.
View charts on: AlphaWebTrader HTF Charts
GC Daily View
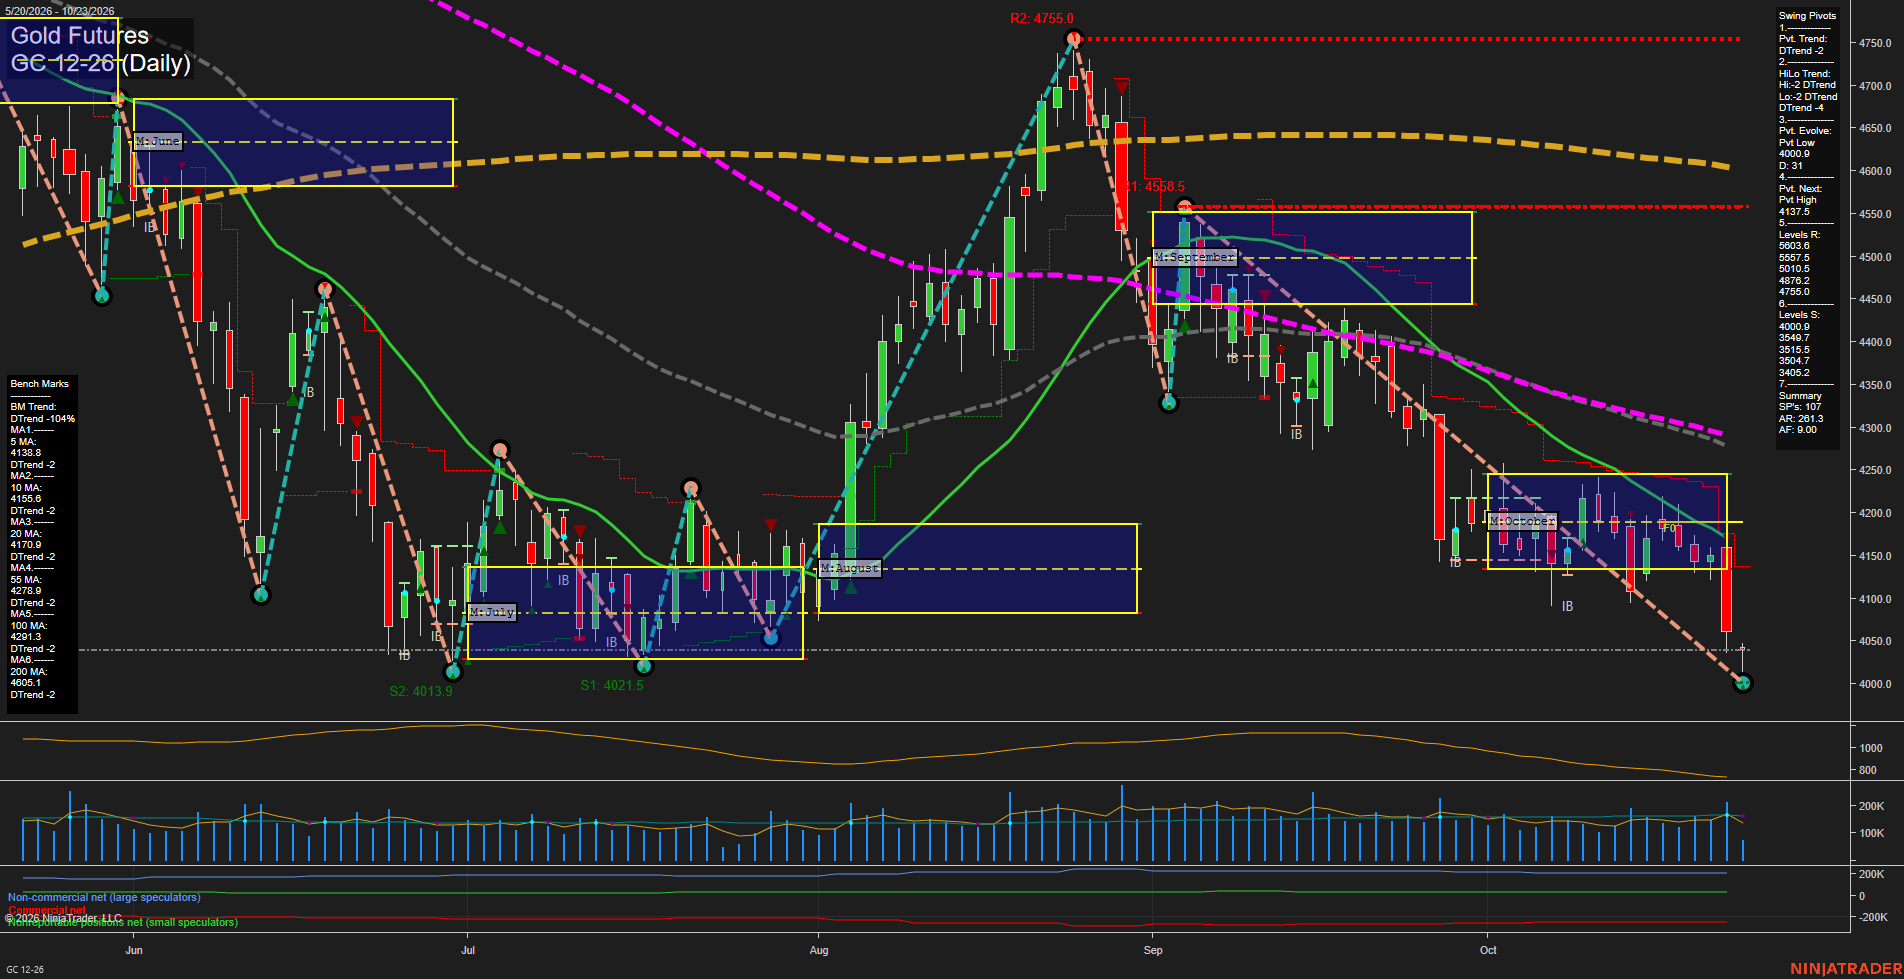
Overall Rating
- Short-Term: Bearish
- Intermediate-Term: Bearish
- Long-Term: Bearish.
Key Insights Summary
Gold futures remain in a broad multi-timeframe decline, with price below every benchmark average and beneath the weekly, monthly, and yearly Fib-grid centers. The large bearish daily bar shows accelerated downside momentum following October consolidation, while the pivot structure remains in DTrend with 4137.5 defining the next pivot-high reversal level. The 4000.9 pivot low is the nearest structural support; a break beneath it extends the established lower-high, lower-low pattern. Elevated ATR reflects a volatile selloff phase rather than a quiet consolidation.
View charts on: AlphaWebTrader HTF Charts
ZB Daily View
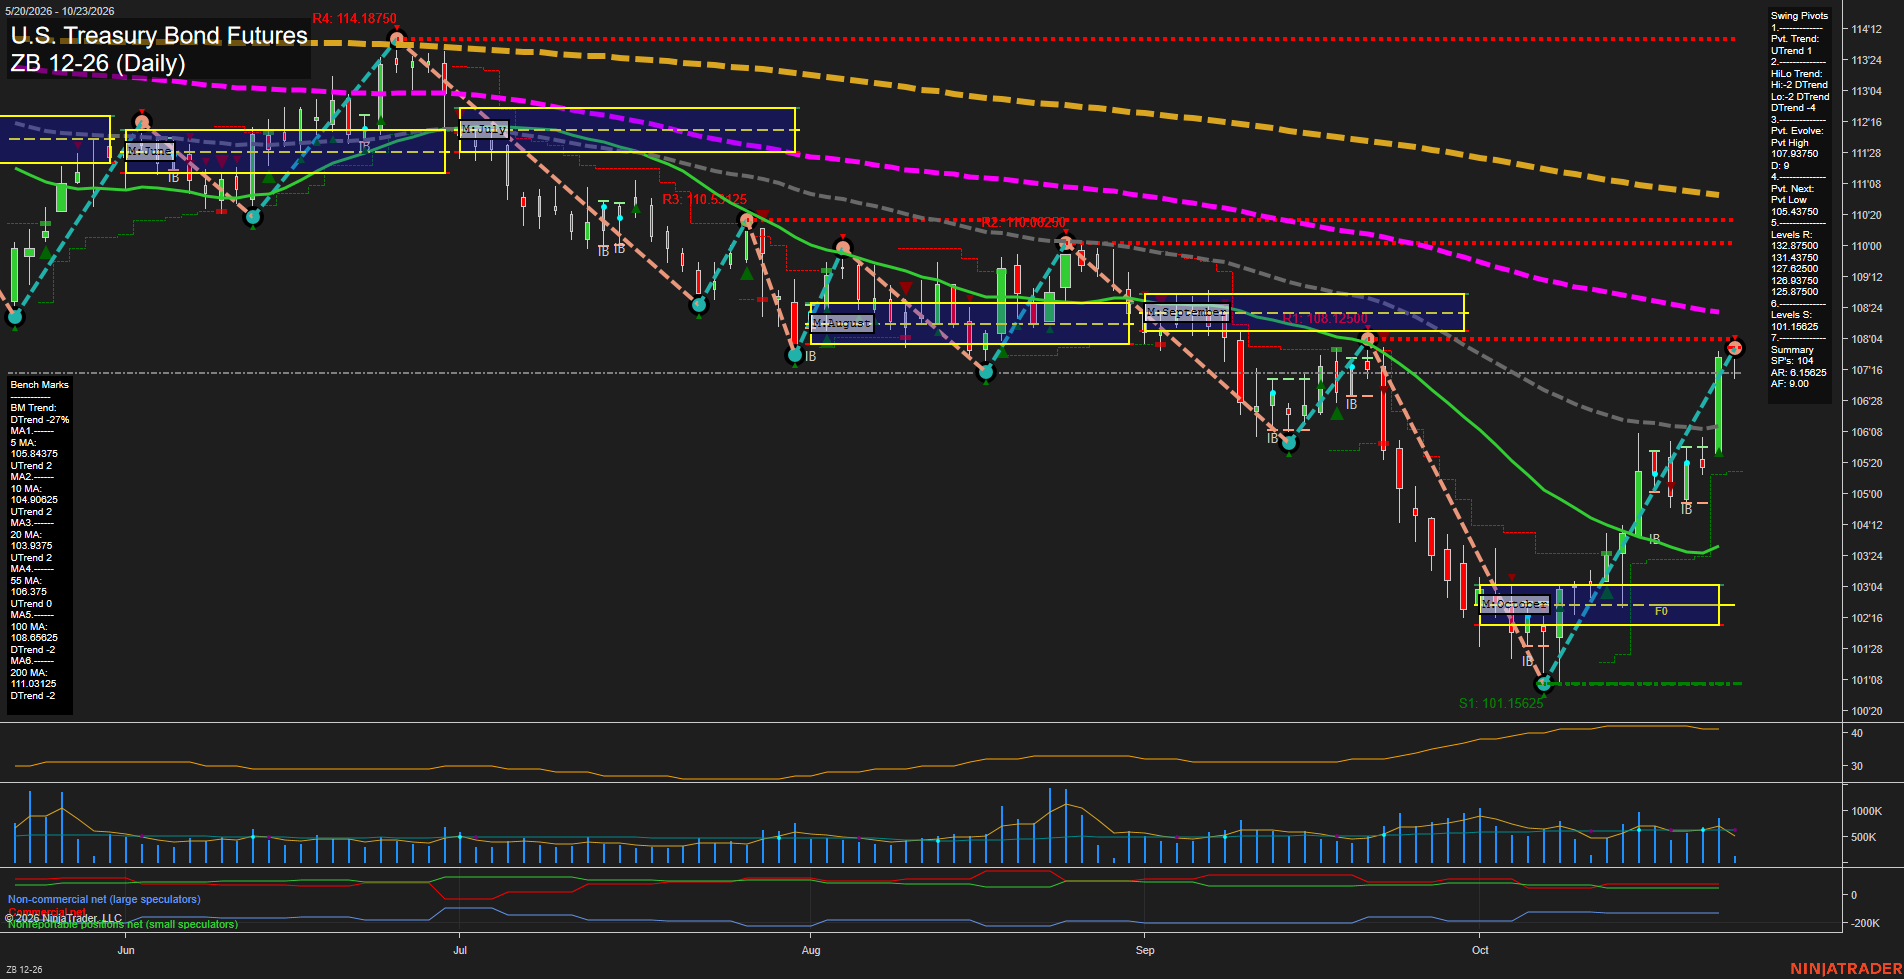
Overall Rating
- Short-Term: Bullish
- Intermediate-Term: Neutral
- Long-Term: Bearish.
Key Insights Summary
The daily structure shows a sharp V-style recovery from the October low, with fast upside momentum, an active short-term UTrend, and price holding above the rising 5-, 10-, and 20-day benchmarks. The advance has reached the 107'16 to 108'04 area and is testing the recent pivot-high region near 107.9750, while the declining 55-day average remains overhead. Intermediate conditions are mixed: the monthly grid is positive, but the HiLo pivot trend remains down. The broader backdrop remains bearish as price stays below declining 100- and 200-day averages and the yearly grid remains below its F0% reference.
View charts on: AlphaWebTrader HTF Charts
Index ETFs
Index ETF breadth was mixed: IWM and DIA edged above their previous closes and gained from the open, while QQQ lagged, falling 2.86% versus the previous close and 1.28% from the open. SPY also declined; IJH finished below its previous close despite rising 0.23% from the open.