
Stocks and tech weakened in the October 22 session as AI spending concerns weighed; oil closed above its prior close, gold fell and Treasuries rose.
Fundamentals: U.S. stocks fell as AI spending concerns weighed on technology shares, with the Nasdaq dropping 2.6%. Strait of Hormuz tanker disruptions pushed oil to a five-month high near $100, adding to inflation concerns. Gold tested $4,000 and silver fell 4.6%, while Treasuries drew safety demand. Positive midday S&P 500 breadth pointed to uneven selling, even as corporate credit stress increased.
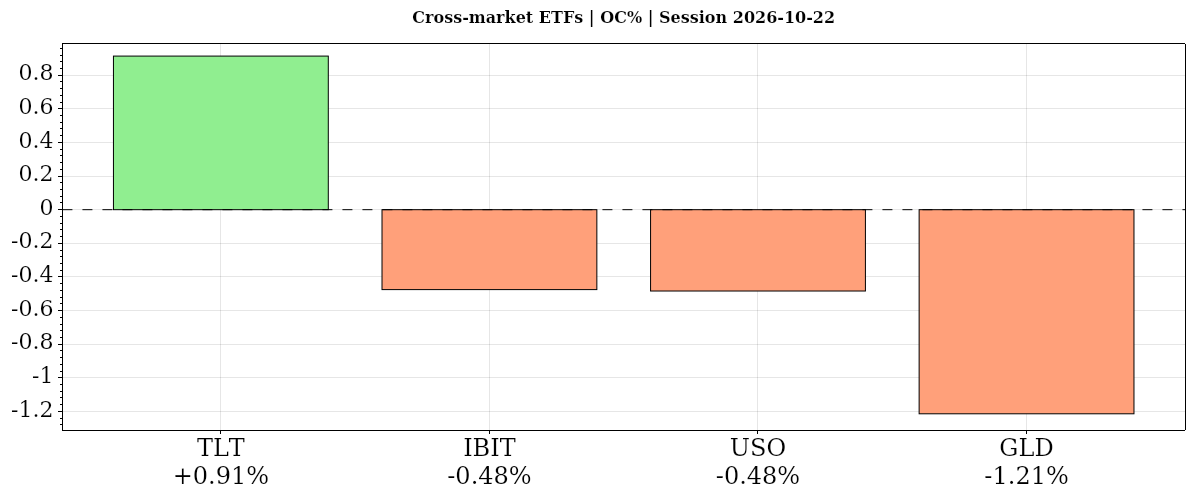
Technicals: The S&P 500 and Nasdaq 100 ETFs fell 0.31% and 1.28% from their opens in the October 22 session, while Dow and small-cap ETFs rose. Nasdaq futures retained bearish short- and medium-term daily trends. The oil ETF fell 0.48% from its open but finished 1.70% above its prior close; the gold ETF lost 1.21% from its open and the far-term Treasury bond ETF gained 0.91%.
After Market Close daily snapshot: market news summary and sentiment, major ETFs, Magnificent 7 analysis, Indices Futures Higher Time Frame Analysis, and E-mini S&P500, Nasdaq 100, NYMEX Crude, Gold Futures Daily Chart analysis.
As of: October 22, 2026 05:00 CT
Earnings Radar Day Recap
Monitoring for earnings releases by the Magnificent 7, AI-tech-related firms, and major financial institutions.
No monitored earnings releases available for this recap period.
For full details visit: Yahoo Earnings Calendar
EcoNews Radar U.S. Events Day Recap
| Date/Day | Impact | Event | Time | Forecast | Previous | Info |
|---|---|---|---|---|---|---|
| 2026-10-22 – Thursday | Medium | Unemployment Claims | 08:30 | 200K | 199K | Counts new applications for jobless benefits, providing a timely gauge of layoffs that index futures traders monitor for labor-market conditions and potential implications for Federal Reserve policy. |
Summary: The calendar focuses on a single U.S. labor-market update.
For full details visit: Forex Factory EcoNews
Market News Summary:
AI spending concerns pressured technology stocks, while rising Middle East tensions lifted oil and reinforced inflation concerns.
Primary Drivers & Risks:
- Primary Driver: AI spending concerns drive technology selloff
- Primary Risk: Hormuz disruptions intensify energy inflation pressures
Tone:
Risk-off, with technology weakness, Treasury demand, and rising energy costs.
Data, Market and System
Geopolitical:
Tehran reported that seven oil tankers caught fire or sustained damage in the Strait of Hormuz after attacks or encounters with naval mines. President Trump ruled out Iran negotiations as concerns about renewed U.S.-Israeli attacks and broader regional conflict increased.
Oil / Energy:
Oil reached a five-month high as tanker disruptions and rising shipping rates intensified supply concerns. Crude traded around $100, linking the geopolitical escalation directly to energy costs and inflation pressures. Trump also invoked the Defense Production Act for oil production and refining.
Gold / Metals:
Gold fell sharply, erasing its summer gains and testing $4,000 an ounce despite declining Treasury yields. Silver futures settled down 4.6% at $54.764 an ounce, their lowest close since November 2025. The metals selloff accompanied higher oil prices and renewed concerns about additional monetary tightening.
Fed / Financials:
September producer prices rose 1.3% month over month versus a 0.5% forecast, and 6.3% year over year versus 5.3% forecast. The inflation surprise and higher energy costs sharpened attention on the October FOMC decision. Treasury yields dropped below 5% amid safety demand, while widening AI-related credit default swap spreads and elevated corporate borrowing costs signaled credit stress.
Macro / Other:
Global strains included falling Japanese equities, an eleven-week losing streak in Chinese stocks, French ten-year yields reaching 5%, and record-low pending U.S. home sales. Upcoming GDP, personal income, and consumer spending releases add to the macro calendar alongside the Fed decision.
Conclusion:
AI capital spending and cash-flow concerns drove the technology-led equity decline. Hormuz disruptions pushed oil higher, adding an inflationary pressure point for index futures.
Treasury demand contrasted with tighter corporate credit conditions and falling precious metals. Positive midday S&P 500 breadth tempered the broad index weakness, while the inflation surprise kept monetary policy in focus.
Market News Sentiment
Sentiment Bias shows the balance of positive and negative news coverage.
| Coverage | Bias | Articles | Positive | Negative | Neutral | Info |
|---|---|---|---|---|---|---|
| ▼ Market news | ▼ -10.34% | 58 | ▲ 22.41% | ▼ 32.76% | — 44.83% | Sentiment Summary: Neutral coverage led at 45%, while negative news outweighed positive 33% to 22%, reflecting Thursday’s reversal of Wednesday’s AI-led gains as Meta’s spending plans, tech earnings reactions and AI-related credit concerns pressured stocks and drew investors into Treasuries. Thursday’s reports also highlighted September’s stronger-than-expected producer inflation, last week’s low jobless claims and rising oil amid Middle East tensions, with the October Fed decision and GDP, income and spending releases still ahead. Conclusion: The main context for index futures was technology-led weakness alongside positive midday S&P 500 breadth, with AI financing concerns and inflation pressures central to coverage. |
| ▼ GLD / Gold | ▼ -46.15% | 13 | ▲ 15.38% | ▼ 61.54% | — 23.08% | Sentiment Summary: Gold coverage was predominantly negative (62%; net bias -46%), as Wednesday’s late-session gains gave way to overnight and Thursday selling amid rising energy costs, renewed Hormuz attacks and Fed tightening concerns. Thursday morning’s jobless claims of 194,000 versus 200,000 expected reinforced labor-market resilience, while later reports linked further precious-metals selling to Meta’s AI spending plans; gold tested $4,000 despite lower yields. Conclusion: For indices futures day traders, the main context is oil-driven inflation and restrictive-policy concerns ahead of the Fed meeting, alongside reports that gold has not effectively hedged recent equity drawdowns. |
| — USO / Oil | — 0.00% | 16 | ▲ 43.75% | ▼ 43.75% | — 12.50% | Sentiment Summary: Positive and negative coverage was evenly balanced at 44% each, as oil gains tied to Middle East attacks, shipping bottlenecks and supply concerns contrasted with inflation risks and equity weakness. Coverage moved from Wednesday evening’s escalation concerns to Thursday’s reports of overnight Hormuz tanker damage and renewed AI-related selling; late Thursday reports placed WTI near $100 and noted Trump’s invocation of the Defense Production Act for oil production and refining. Conclusion: The main context for indices futures was geopolitical energy-supply stress alongside AI spending and funding concerns, with Nasdaq futures reported down more than 1% early Thursday. |
Glossary: Sentiment Bias = (positive articles − negative articles) ÷ total articles × 100. It ranges from −100% negative to +100% positive. A reading near zero indicates little directional bias. Neutral articles reduce the score’s strength. ▲ positive; ▼ negative; — balanced. These readings describe news coverage, not market-price direction.
Market Technical Analysis
Analysis of VIX volatility, the completed session in major ETFs and mega-cap tech stocks, and futures snapshots and higher-time-frame analysis.
VIX — Market Fear Gauge Daily
| Level | Open | High | Low | DNC% | DOC% | VR |
|---|---|---|---|---|---|---|
| 19.05 | 17.84 | 20.31 | 17.71 | +14.21% | +6.78% | 12.03 |
VIX rose 6.78% from the session's opening level. VIX rose 14.21% versus the previous session close. Expected volatility rose from the period open.
VR: Stocks down; volatility up. Volatility moved more in percentage terms.
Major ETFs and Mega Cap Tech Stocks
The Nasdaq Composite fell 2.6%, its steepest daily decline since June, while the S&P 500 posted its worst session since July. Meta’s additional spending commitments and concerns about AI investment sustainability weighed on technology shares; semiconductor stocks also faced pressure after Lam Research’s results. Midday S&P 500 breadth remained positive, with 320 advancing stocks and fewer than 200 decliners despite the index’s decline, indicating uneven selling rather than uniform weakness.
ETF, Mag7, and Cross-Market ETF Insights
Overall Tone
Daily risk tone was defensive overall, with uneven equity participation and notable divergence across other markets.
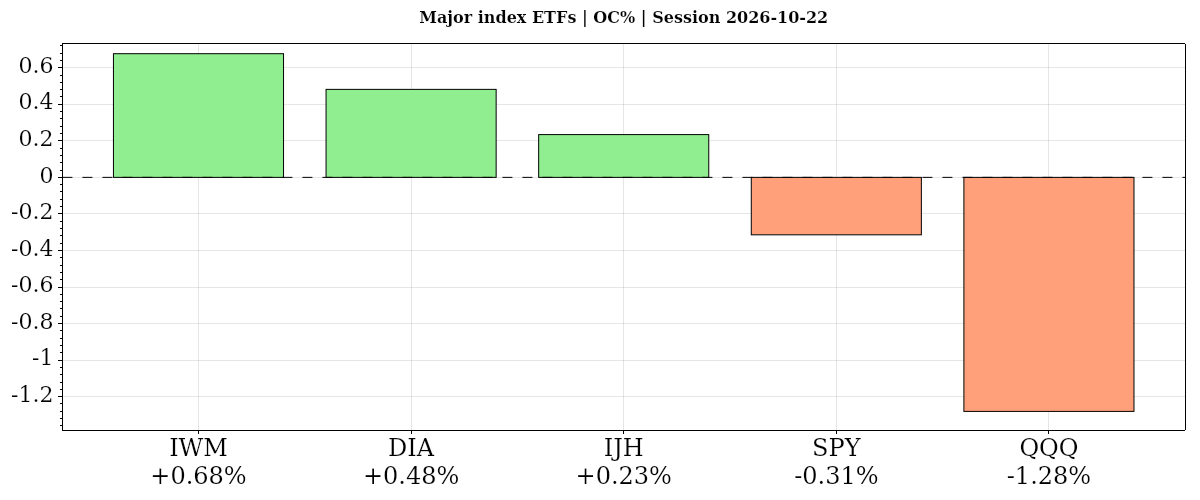
| Instrument | Bias | Date | DNC% | DOC% | O | H | L | C | VWAP | Vol |
|---|---|---|---|---|---|---|---|---|---|---|
| ▲ IWM | ▲ ▲ ▲ | 2026-10-22 | ▲ +0.07% | ▲ +0.68% | 274.81 | 277.28 | 274.49 | 276.67 | ▲ 275.95 | 25,510,051 |
| ▲ DIA | ▲ ▲ ▲ | 2026-10-22 | ▲ +0.04% | ▲ +0.48% | 525.36 | 528.45 | 524.29 | 527.89 | ▲ 526.66 | 2,598,051 |
| ▲ IJH | ▼ ▲ ▲ | 2026-10-22 | ▼ -0.80% | ▲ +0.23% | 72.63 | 72.86 | 72.14 | 72.80 | ▲ 72.57 | 8,766,849 |
| ▼ SPY | ▼ ▼ ▲ | 2026-10-22 | ▼ -1.18% | ▼ -0.31% | 766.37 | 767.71 | 761.16 | 763.96 | ▲ 763.69 | 53,231,890 |
| ▼ QQQ | ▼ ▼ ▼ | 2026-10-22 | ▼ -2.86% | ▼ -1.28% | 713.61 | 715.43 | 701.90 | 704.47 | ▼ 707.09 | 63,371,830 |
| AVG/Sum | — | — | -0.95% | -0.04% | — | — | — | — | — | 153,478,671 |
| Instrument | Bias | Date | DNC% | DOC% | O | H | L | C | VWAP | Vol |
|---|---|---|---|---|---|---|---|---|---|---|
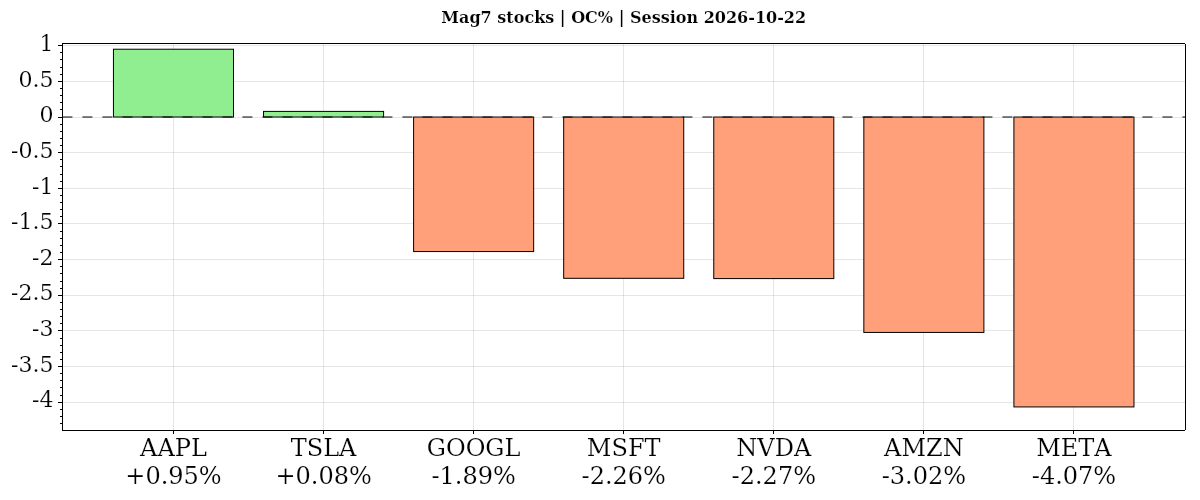
| ▲ AAPL | ▲ ▲ ▲ | 2026-10-22 | ▲ +1.23% | ▲ +0.95% | 344.94 | 348.36 | 342.28 | 348.22 | ▲ 346.54 | 43,726,401 |
| ▲ TSLA | ▼ ▲ ▼ | 2026-10-22 | ▼ -3.08% | ▲ +0.08% | 374.29 | 388.86 | 373.71 | 374.58 | ▼ 380.89 | 51,503,614 |
| ▼ GOOGL | ▼ ▼ ▼ | 2026-10-22 | ▼ -3.15% | ▼ -1.89% | 330.45 | 331.43 | 322.00 | 324.22 | ▼ 325.71 | 27,461,164 |
| ▼ MSFT | ▼ ▼ ▼ | 2026-10-22 | ▼ -2.23% | ▼ -2.26% | 533.14 | 533.60 | 520.30 | 521.08 | ▼ 523.38 | 21,091,198 |
| ▼ NVDA | ▼ ▼ ▼ | 2026-10-22 | ▼ -4.40% | ▼ -2.27% | 217.13 | 218.88 | 211.26 | 212.21 | ▼ 213.48 | 124,608,379 |
| ▼ AMZN | ▼ ▼ ▼ | 2026-10-22 | ▼ -4.57% | ▼ -3.02% | 258.18 | 258.41 | 248.00 | 250.38 | ▼ 251.42 | 48,315,905 |
| ▼ META | ▼ ▼ ▼ | 2026-10-22 | ▼ -6.98% | ▼ -4.07% | 676.35 | 681.07 | 639.69 | 648.85 | ▼ 651.98 | 40,424,790 |
| AVG/Sum | — | — | -3.31% | -1.78% | — | — | — | — | — | 357,131,451 |
Mag7 Stocks
Apple was the sole Mag7 daily gainer, advancing both from the prior close and during the session, while Meta lagged with a 6.98% daily loss and 4.07% open-to-close decline. Amazon, Nvidia, Alphabet and Microsoft also weakened on both comparisons; Tesla fell 3.08% from the prior close despite edging up 0.08% from the open.
| Instrument | Bias | Date | DNC% | DOC% | O | H | L | C | VWAP | Vol |
|---|---|---|---|---|---|---|---|---|---|---|
| ▲ TLT | ▲ ▲ ▲ | 2026-10-22 | ▲ +1.87% | ▲ +0.91% | 81.00 | 81.92 | 80.87 | 81.74 | ▲ 81.54 | 64,530,544 |
| ▼ IBIT | ▼ ▼ ▼ | 2026-10-22 | ▼ -3.72% | ▼ -0.48% | 46.28 | 46.40 | 45.71 | 46.06 | ▼ 46.06 | 43,062,165 |
| ▼ USO | ▲ ▼ ▲ | 2026-10-22 | ▲ +1.70% | ▼ -0.48% | 163.30 | 163.77 | 160.09 | 162.51 | ▲ 161.88 | 4,240,642 |
| ▼ GLD | ▼ ▼ ▼ | 2026-10-22 | ▼ -2.63% | ▼ -1.21% | 373.54 | 373.87 | 368.35 | 369.00 | ▼ 370.20 | 16,966,525 |
| AVG/Sum | — | — | -0.70% | -0.31% | — | — | — | — | — | 128,799,876 |
Cross-Market ETFs
TLT diverged from equity weakness, gaining 1.87% from the prior close and advancing from the open, while gold and bitcoin ETFs declined on both measures. USO rose 1.70% versus the prior close but fell 0.48% from the open, distinguishing its daily strength from its softer session.
Glossary: Instrument — ticker symbol; hover for the instrument or company name; Date — session date. DNC% — prior-session close to this session’s close; DOC% — daily session open-to-close percentage change. O — open; H — high; L — low; C — close, all for the table’s daily or weekly session; VWAP — volume-weighted average price; its arrow shows whether the close is above or below VWAP. Vol — period trading volume.
Bias — three directional readings, in order: DNC%, DOC%, then VWAP. ▲ positive/above; ▼ negative/below; — neutral or unavailable. Matching arrows show alignment; opposing arrows show mixed conditions. AVG/Sum — simple average of percentage changes and sum of reported volumes.
Futures Session Fib Grid Analysis – Snapshot
Session Fib Grids normalise market positioning as percentages, making direction and alignment comparable across different asset types.
Latest available snapshot for each instrument; Time(CT) shows the individual update date and time.
| Instrument | Bias | Time(CT) | YSFG | MSFG | WSFG | RSFG | SFG | TSI |
|---|---|---|---|---|---|---|---|---|
| ▼ ES | ▲ ▼ ▲ ▼ ▼ ▼ | 2026-10-22 14:46:25 | ▲ +52 | ▼ -23 | ▲ +4 | ▼ -51 | ▼ -51 | ▼ -125 |
| ▼ NQ | ▲ ▼ ▼ ▼ ▼ ▼ | 2026-10-22 14:46:24 | ▲ +55 | ▼ -85 | ▼ -15 | ▼ -78 | ▼ -78 | ▼ -267 |
| ▲ YM | ▲ ▲ ▲ ▲ ▲ ▲ | 2026-10-22 14:46:24 | ▲ +41 | ▲ +79 | ▲ +75 | ▲ +30 | ▲ +30 | ▲ +64 |
| ▼ EMD | ▲ ▲ ▲ ▼ ▼ ▲ | 2026-10-22 14:46:03 | ▲ +28 | ▲ +8 | ▲ +16 | ▼ -2 | ▼ -2 | ▲ +22 |
| ▲ RTY | ▲ ▼ ▲ ▲ ▲ ▲ | 2026-10-22 14:46:25 | ▲ +31 | ▼ -28 | ▲ +65 | ▲ +26 | ▲ +26 | ▲ +28 |
| ▼ FDAX | ▲ ▲ ▼ ▼ ▼ ▼ | 2026-10-22 14:46:14 | ▲ +12 | ▲ +26 | ▼ -35 | ▼ -38 | ▼ -47 | ▼ -82 |
| ▼ NKD | ▲ ▼ ▼ ▼ ▼ ▼ | 2026-10-22 14:45:32 | ▲ +142 | ▼ -86 | ▼ -21 | ▼ -129 | ▼ -48 | ▼ -230 |
| Instrument | Bias | Time(CT) | YSFG | MSFG | WSFG | RSFG | SFG | TSI |
|---|---|---|---|---|---|---|---|---|
| ▼ BTC | ▼ ▼ ▼ ▼ ▼ ▼ | 2026-10-22 14:46:10 | ▼ -34 | ▼ -20 | ▼ -11 | ▼ -20 | ▼ -20 | ▼ -31 |
| ▼ GC | ▼ ▼ ▼ ▼ ▼ ▼ | 2026-10-22 14:46:24 | ▼ -137 | ▼ -44 | ▼ -99 | ▼ -83 | ▼ -87 | ▼ -257 |
| ▼ CL | ▲ ▲ ▲ ▼ ▼ ▼ | 2026-10-22 14:46:21 | ▲ +181 | ▲ +68 | ▲ +3 | ▼ -11 | ▼ -17 | ▼ -8 |
| ▲ 6E | ▼ ▼ ▲ ▲ ▲ ▼ | 2026-10-22 14:46:02 | ▼ -55 | ▼ -57 | ▲ +10 | ▲ +20 | ▲ +24 | ▼ -14 |
| ▼ ZB | ▼ ▲ ▲ ▼ ▼ ▲ | 2026-10-21 09:39:59 | ▼ -39 | ▲ +77 | ▲ +6 | ▼ -3 | ▼ -2 | ▲ +29 |
Glossary: YSFG — yearly; MSFG — monthly; WSFG — weekly; RSFG — regular trading hours (RTH); SFG — the current session, including pre-market or other sessions. TSI indicates trend strength and power.
Bias shows trend alignment across these six readings. The arrows follow the column order: YSFG, MSFG, WSFG, RSFG, SFG and TSI. Matching arrows show alignment; opposing arrows show mixed conditions.
Futures Higher Time Frame Analysis
Summary of the current state of US Indices Futures based on higher time-frame (HTF) technical analysis as of: 2026-10-22: 17:01 CT.
US Indices Futures
- ES YSFG above F0%, MSFG below F0%, WSFG unspecified, below daily 5–55 benchmarks, daily pivots down, support 7672.75–7676.00, resistance 7897.50–7906.25.
- NQ YSFG/WSFG above F0%, MSFG below F0%, below daily 5–100 benchmarks, pivots down, support 29053–29268, reversal threshold 30197, resistance 31616.50.
- YM YSFG/MSFG/WSFG above F0%, above daily 5–55 benchmarks, daily pivots up versus weekly down, support 51900–51970, resistance 53219–53223.
- EMD YSFG/MSFG/WSFG above F0%, above daily 5/10 benchmarks, below 55/100, pivots down, support 3600.3, resistance 3700.5–3737.8, weekly threshold 3794.1.
- RTY YSFG/WSFG above F0%, MSFG below F0%, below daily 10–200 benchmarks, pivots down, support 2723.3–2723.9, resistance 2808.7–2811.9, weekly threshold 2888.9.
- FDAX YSFG/MSFG above F0%, WSFG below F0%, above 200-day benchmark, daily pivots up versus weekly down, support 24925–25169, resistance 25843–25990.
Overall State
- Short-Term: Neutral
- Intermediate-Term: Neutral
- Long-Term: Bullish
Conclusion
YSFG positioning remains above F0% across the instruments, while MSFG readings separate YM, EMD, and FDAX from ES, NQ, and RTY. YM leads US daily directional structure with both pivot measures rising; NQ and RTY lag through declining pivots and overhead benchmarks. EMD’s rebound retains declining daily pivot and HiLo structures. ES holds its broader weekly uptrend despite daily weakness and two weekly short-direction signals. FDAX retains rising daily pivots despite recent short signals and WSFG positioning below F0%. Longer-term weekly benchmark structures remain broadly bullish, contrasting with weaker daily structures, particularly RTY below its 200-day benchmark.
Note: Intra-day counter-trend pullbacks or retracements may occur, HTF is context for informational usage and market structure. Glossary: Session Fib Grids periods of YSFG:’Yearly’, MSFG:’Monthly’, WSFG:’Weekly’
For full details visit: AlphaWebTrader Technicals
ES Daily View
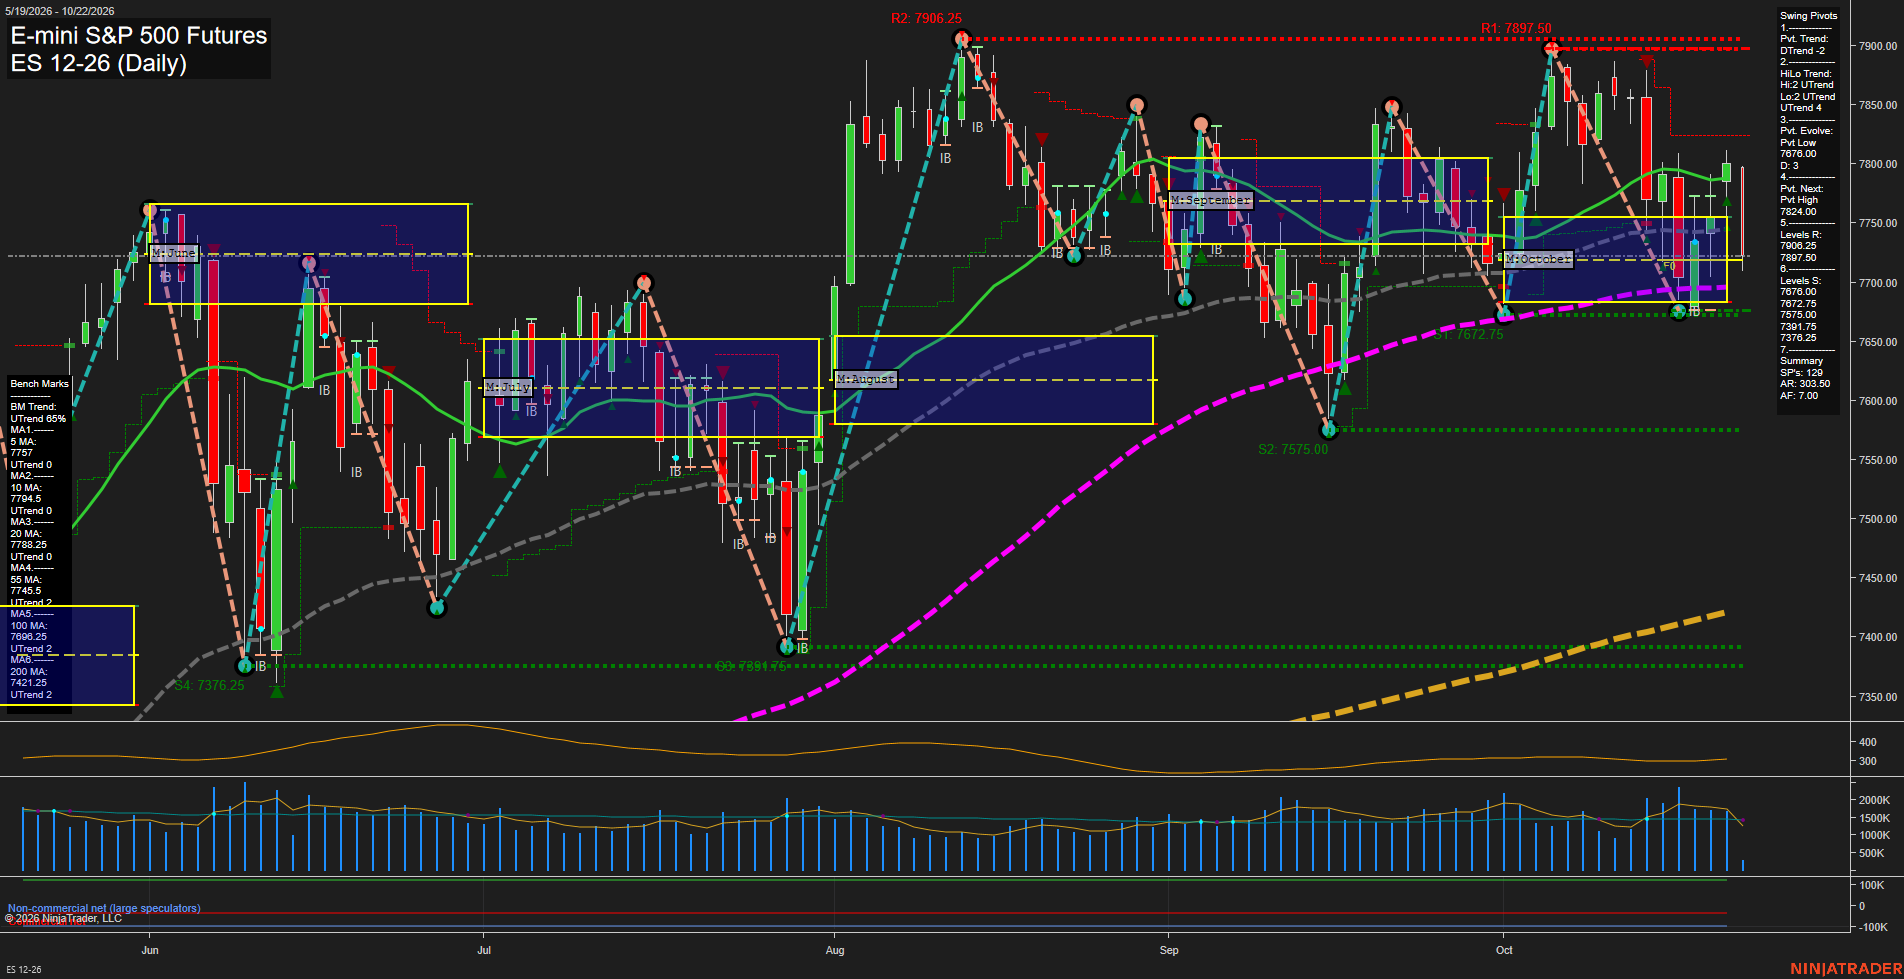
Overall Rating
- Short-Term: Bearish
- Intermediate-Term: Neutral
- Long-Term: Bullish.
Key Insights Summary
The daily structure reflects a short-term downswing from the October high near 7900, with price beneath the 5-, 10-, 20-, and 55-day benchmarks and below the October MSFG F0% area. The active pivot trend is down, while the intermediate HiLo structure remains up, defining the move as a pullback within a still-positive broader trend. The 7676.00-7672.75 pivot-support cluster is the immediate downside reference, while 7824.00 is the next pivot-reversal threshold and 7897.50-7906.25 remains major overhead resistance. Long-term positioning remains constructive because price holds above the rising 100- and 200-day benchmarks and the yearly grid remains positive.
View charts on: AlphaWebTrader HTF Charts
NQ Daily View
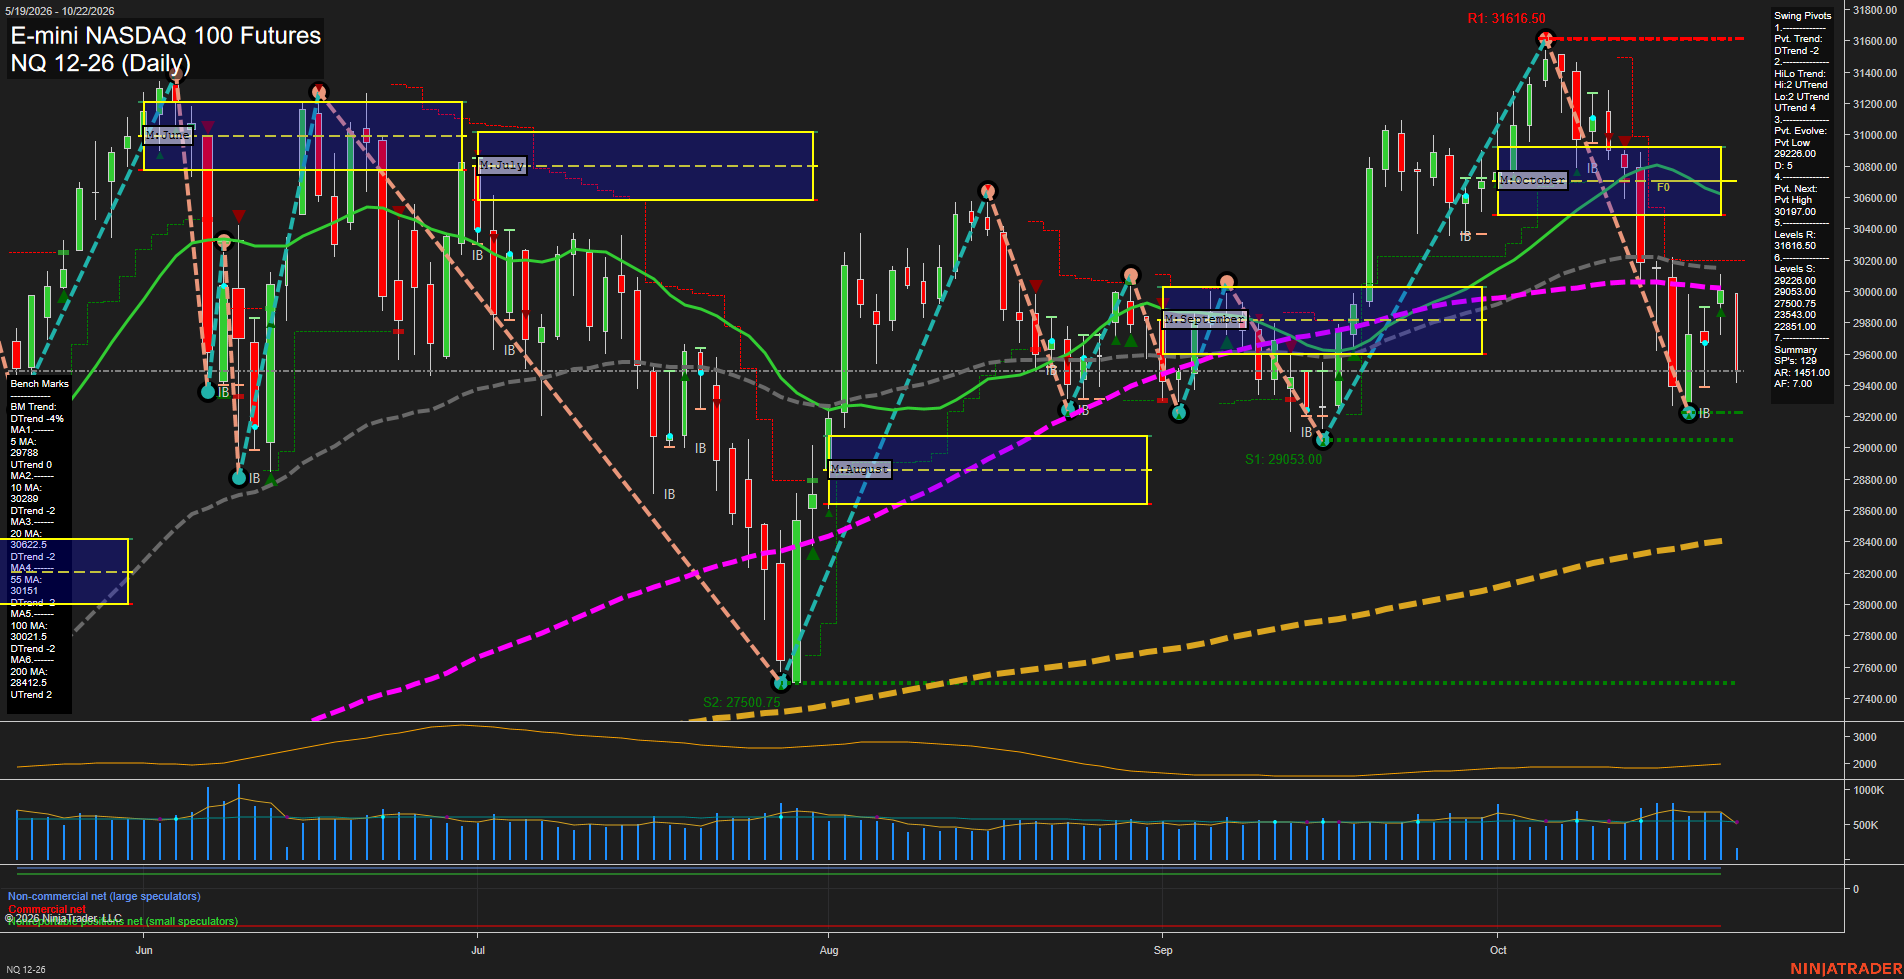
Overall Rating
- Short-Term: Bearish
- Intermediate-Term: Bearish
- Long-Term: Neutral.
Key Insights Summary
Price remains in a short-term pivot decline following the rejection from the 31616.50 swing high. The rebound from the 29268.00 pivot low has not yet restored price above the 5, 10, 20, 55, or 100 day benchmarks, preserving a bearish overhead moving-average structure. The weekly grid remains positive, while the October monthly grid is negative and price is below its F0% area, reflecting a counter-trend bounce within an intermediate-term retracement. The higher-level yearly grid and rising 200 day benchmark retain a constructive long-term backdrop, although the 100 day average and long-term signal structure remain weak. Volatility is elevated, with 29268.00 and 29053.00 defining the nearby downside pivot zone and 30197.00 representing the first pivot-reversal threshold.
View charts on: AlphaWebTrader HTF Charts
CL Daily View
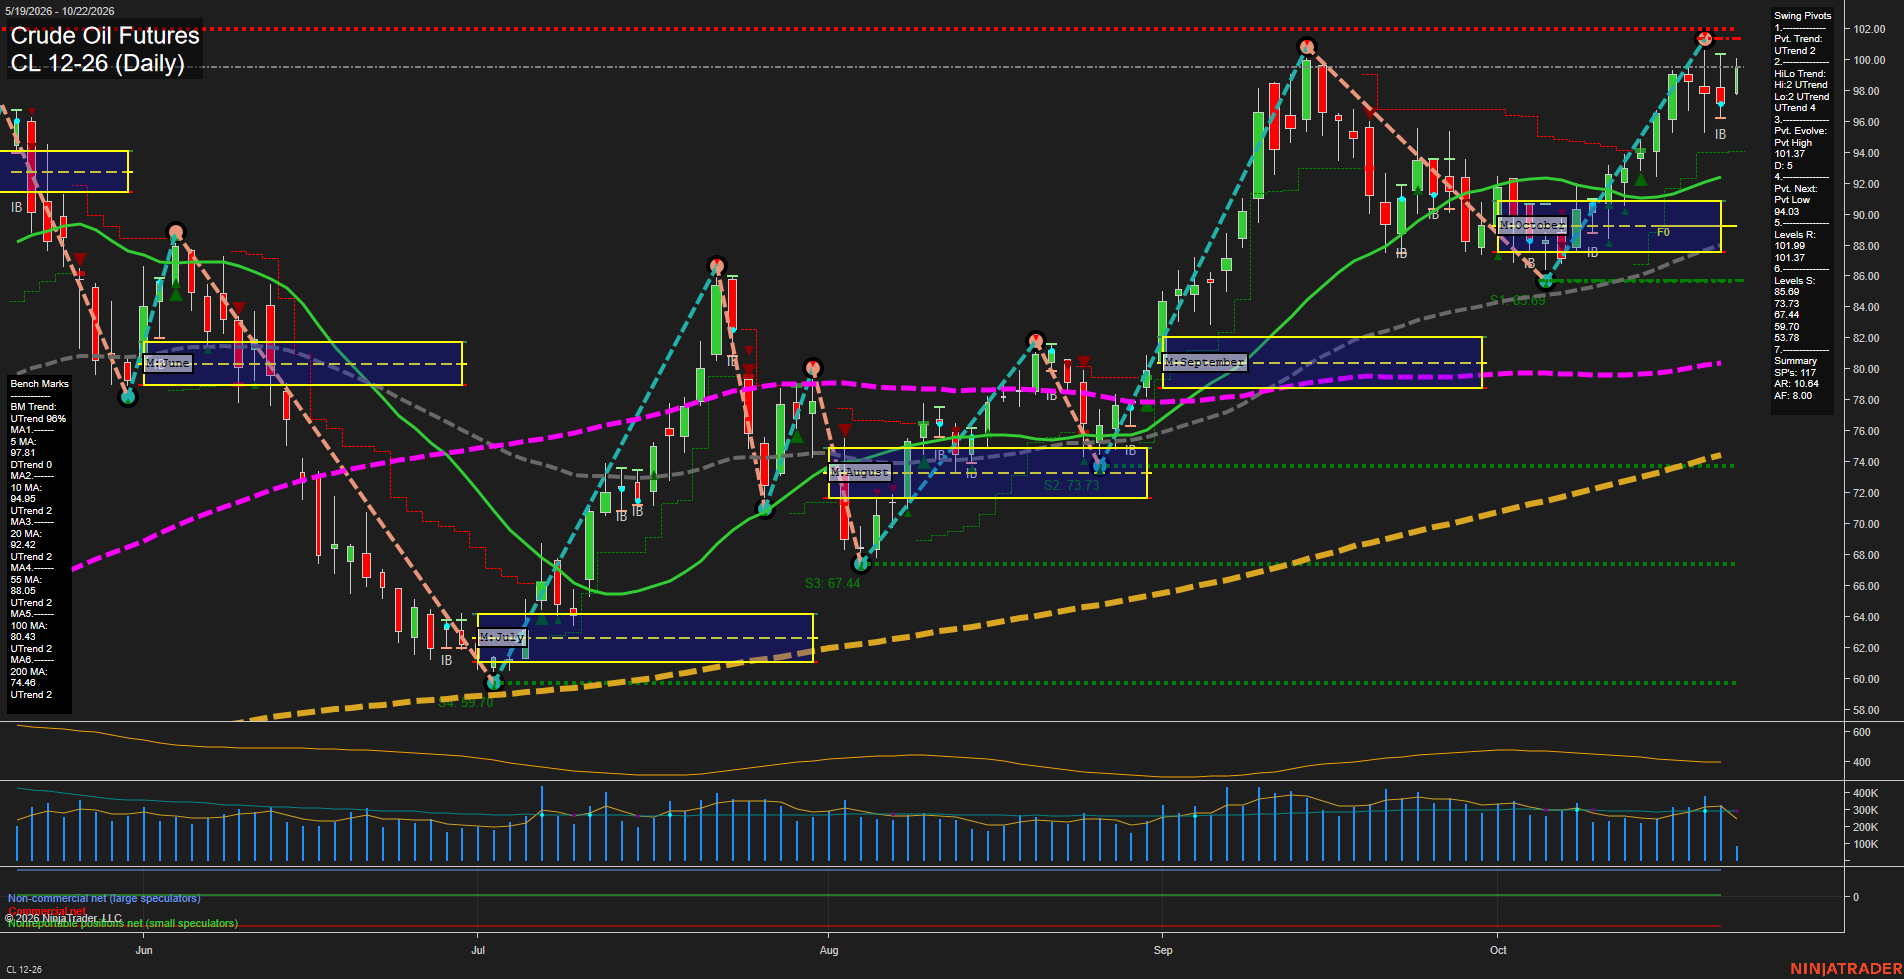
Overall Rating
- Short-Term: Bullish
- Intermediate-Term: Bullish
- Long-Term: Bullish.
Key Insights Summary
Price has recovered sharply from the early-October swing low and is again testing the 101.37-101.89 pivot-resistance cluster. The short-term pivot structure is in UTrend, while the intermediate HiLo trend remains UTrend, supported by price holding above the rising 10, 20, 55, 100, and 200-day benchmarks. The 5-day benchmark remains below price and marked downtrend, reflecting recent near-term consolidation beneath resistance after a fast rally. Monthly and yearly Fib-grid structure remains positive, with higher lows intact above the 94.03 next-pivot level and the 92.44 20-day benchmark.
View charts on: AlphaWebTrader HTF Charts
GC Daily View
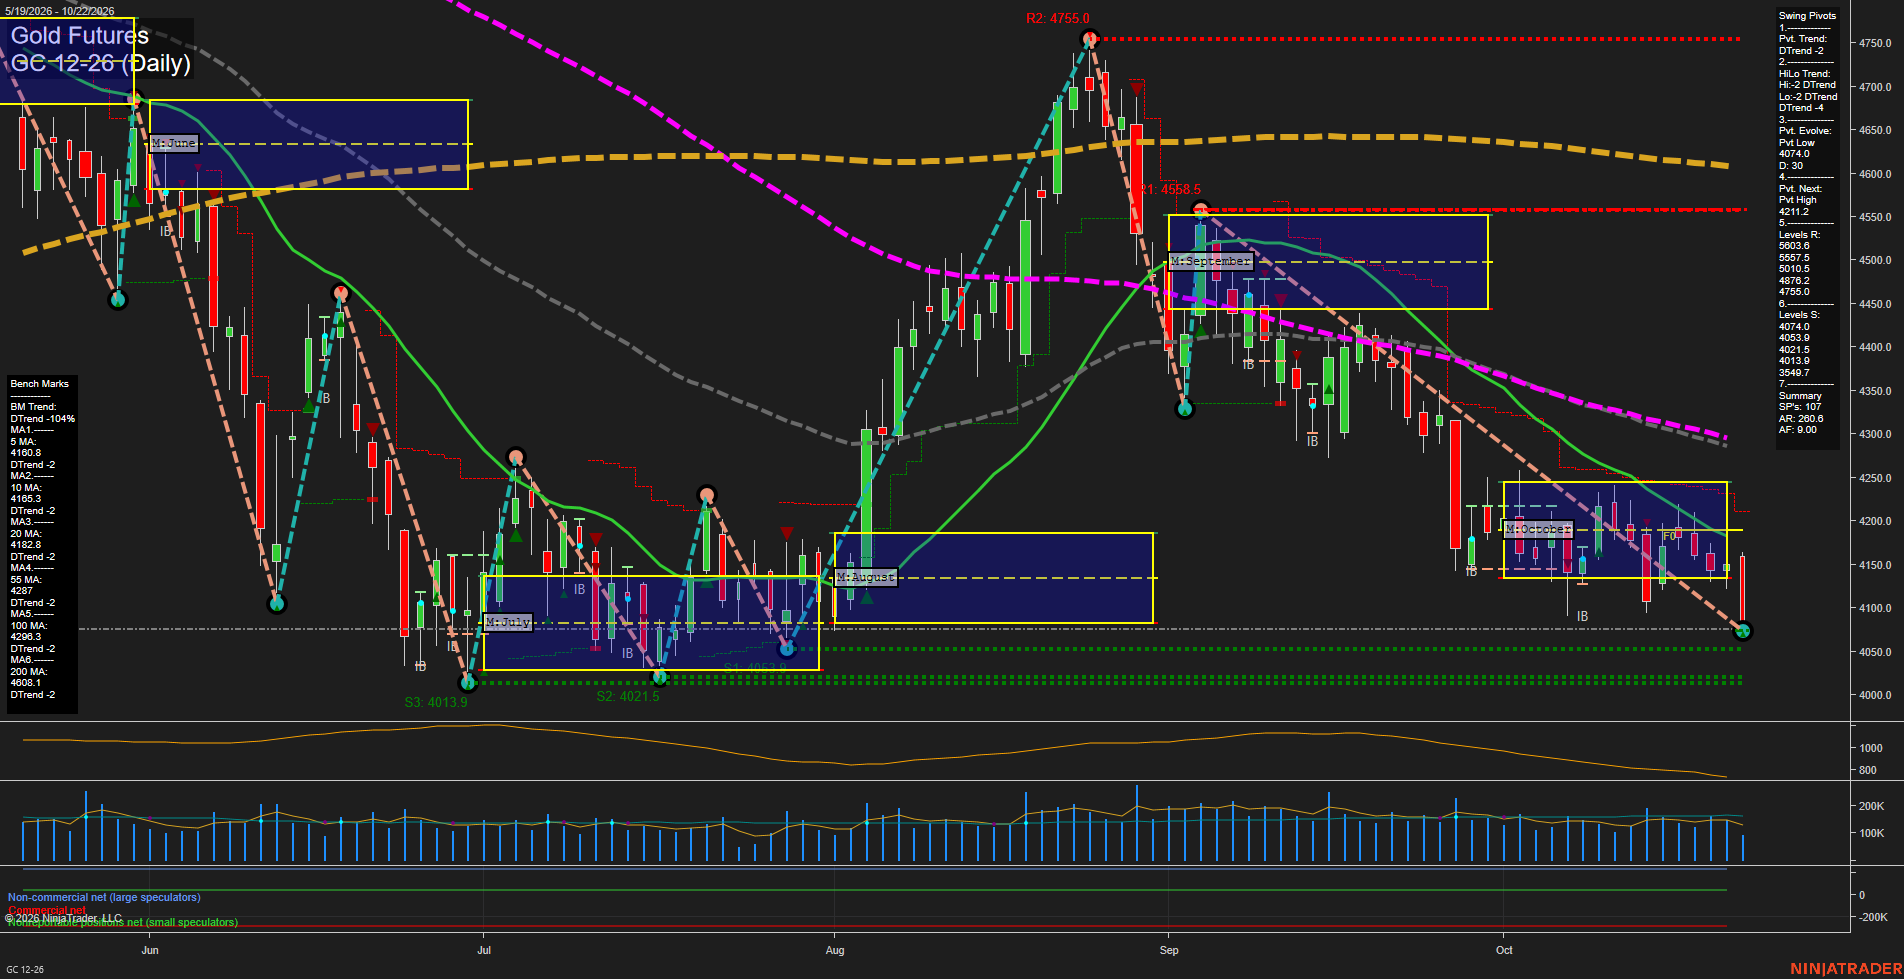
Overall Rating
- Short-Term: Bearish
- Intermediate-Term: Bearish
- Long-Term: Bearish.
Key Insights Summary
Price remains in a broad daily decline, with lower pivot highs and lower pivot lows confirmed by both Pivot Trend and HiLo Trend. The latest decline has carried GC below all six falling benchmark averages and below the weekly, monthly, and yearly Fib-grid reference areas. Small recent candles indicate consolidation near the 4074-4014 support cluster following the October selloff, while 4211 is the nearest pivot-reversal threshold and the 4165-4183 moving-average area is overhead resistance. The chart structure remains bearish across swing horizons, with slowing near-term momentum occurring inside a larger downtrend.
View charts on: AlphaWebTrader HTF Charts
ZB Daily View
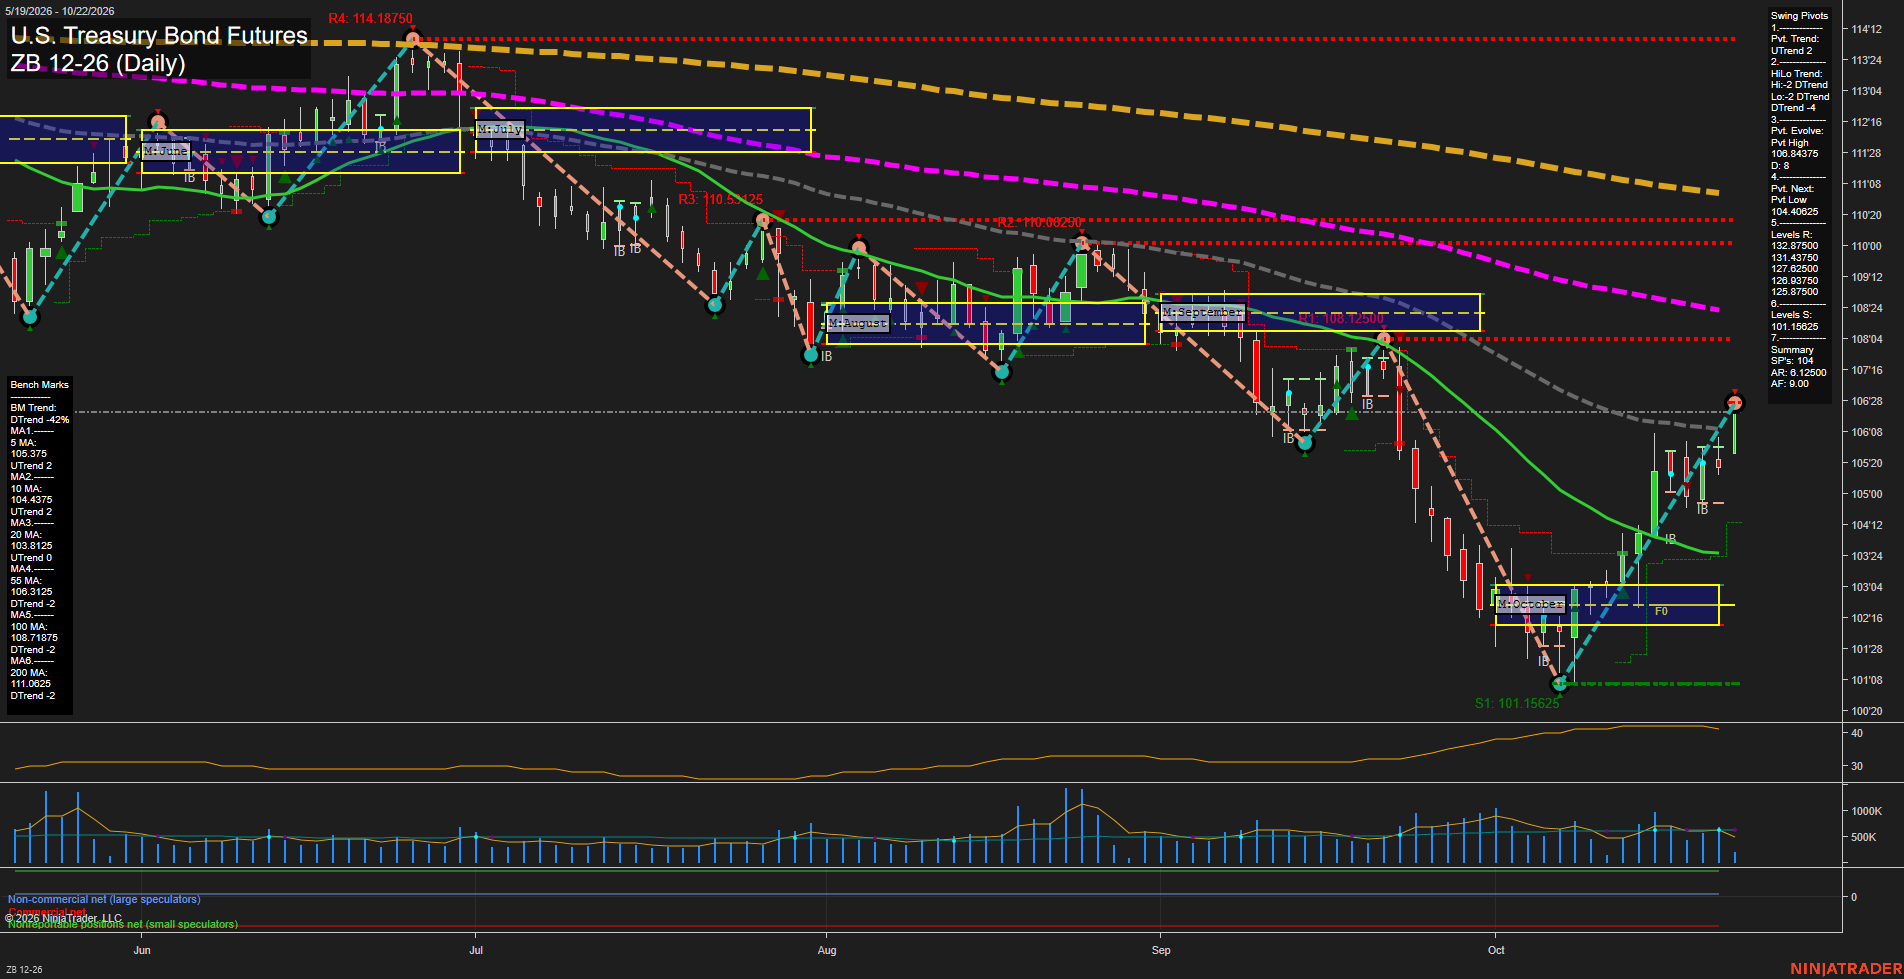
Overall Rating
- Short-Term: Bullish
- Intermediate-Term: Neutral
- Long-Term: Bearish.
Key Insights Summary
The daily structure shows a sharp V-style recovery from the October low near 101.15625, with fast upside momentum and price above the rising 5-, 10-, and 20-day benchmarks. Weekly and monthly fib-grid positioning is positive, confirming a short-term recovery phase. However, price is testing the declining 55-day average near 106.3125 while the intermediate HiLo pivot trend remains down, making the current advance a countertrend rebound within the broader yearly downtrend. The evolving pivot high at 106.375 is the immediate upside structural reference, while 104.40625 defines the next pivot-reversal level. Long-term trend pressure remains intact beneath declining 100- and 200-day averages.
View charts on: AlphaWebTrader HTF Charts
Index ETFs
QQQ lagged, falling 2.86% from the prior close and 1.28% from the open, while SPY posted smaller declines. IWM and DIA led with marginal daily gains and firmer open-to-close advances; IJH remained below its prior close despite rising from the open.