U.S. futures steady ahead of Alphabet and Microsoft earnings Wednesday after close and Amazon Thursday after close; S&P 500 and Nasdaq daily trends stay…
Fundamentals: U.S. futures stabilized after last week's technology selloff ahead of Vertiv earnings before Wednesday's open, Alphabet and Microsoft after Wednesday's close, and Amazon and Intel after Thursday's close. The coming week's Fed decision and growth and inflation data share focus with AI financing pressures. Oil retreated from a six-month high, European gas prices exceeded €97 per megawatt-hour, and Treasury yields edged higher.
Technicals: Ahead of Monday’s session, S&P 500 and Nasdaq futures show bearish short- and medium-term daily trends despite broadly constructive weekly structures. Dow futures are consolidating within a broader recovery, while midcap daily trends remain bearish and small caps are stabilizing after October’s decline. DAX futures also face near-term selling pressure within a larger recovery cycle.
Pre-Market Trading 360° view Market Radar of: holidays, earnings, eco-news, market-news summary, news sentiment, prior session major ETFs, MAG7, Higher Time Frame Analysis Indices Futures Summary, and E-mini S&P500, Nasdaq 100, NYMEX Crude, Gold Futures Daily Chart analysis.
As of: October 26, 2026 07:16 CT
Earnings Radar
Monitoring for earnings releases by the Magnificent 7, AI-tech-related firms, and major financial institutions.
| Date/Day | Impact | Company / Symbol | Time | EPS | Revenue | ||||
|---|---|---|---|---|---|---|---|---|---|
| 2026-10-28 – Wednesday | High | Alphabet (GOOGL) | After close |
|
| ||||
| 2026-10-28 – Wednesday | High | Microsoft (MSFT) | After close |
|
| ||||
| 2026-10-28 – Wednesday | Medium | Vertiv (VRT) | Before open |
|
| ||||
| 2026-10-29 – Thursday | High | Amazon (AMZN) | After close |
|
| ||||
| 2026-10-29 – Thursday | Medium | Intel (INTC) | After close |
|
|
Conclusion: No releases are listed for today, Oct. 26. Upcoming reports are VRT before market open and GOOGL/MSFT after market close on Oct. 28, followed by AMZN/INTC after market close on Oct. 29—an earnings concentration relevant to broad-index futures through major tech, AI infrastructure, and semiconductor exposure. Market momentum and volume can slow ahead of these major releases.
For full details visit: Yahoo Earnings Calendar
EcoNews Radar U.S. Events
| Date | Impact | Event, Prev, Forecast, Actual | Info |
|---|---|---|---|
| 2026-10-26 Monday 11:30 | Medium | 13-Week Bill Auction · $95B Prev: 4.095% Forecast: — Actual: — | Reveals demand and clearing yields for short-term Treasury debt; traders monitor funding conditions and front-end rates that influence equity valuations. |
| 2026-10-26 Monday 11:30 | Medium | 26-Week Bill Auction · $82B Prev: 4.22% Forecast: — Actual: — | Shows investor demand for short-term government financing; auction pricing helps traders assess money-market conditions and expectations for policy rates. |
| 2026-10-26 Monday 13:00 | High | 2-Year Note Auction · $69B Prev: 4.787% Forecast: — Actual: — | Reveals demand for policy-sensitive Treasury debt; yields and bidding strength help traders assess rate expectations and the discount rates applied to equities. |
| 2026-10-27 Tuesday 08:15 | Medium | ADP Employment Change 4-week average Prev: 18K Forecast: — Actual: — | Tracks the recent average change in private payroll employment; traders monitor hiring momentum for signals about household demand and monetary policy. |
| 2026-10-27 Tuesday 08:30 | Medium | Durable Goods Orders ex Transportation Prev: 0.3 Forecast: 0.6 Actual: — | Measures orders for long-lasting manufactured goods excluding transportation equipment; traders use it to assess underlying factory demand with less aircraft-related volatility. |
| 2026-10-27 Tuesday 08:30 | Medium | Durable Goods Orders Prev: 0 Forecast: 0.6 Actual: — | Measures new orders for long-lasting manufactured goods; traders monitor it for signals about manufacturing demand, investment momentum and economic growth. |
| 2026-10-27 Tuesday 08:30 | Medium | Durable Goods Orders ex Defense Prev: 0.1 Forecast: — Actual: — | Measures orders for long-lasting manufactured goods excluding defense purchases; traders monitor civilian demand while recognizing that transportation orders can still create volatility. |
| 2026-10-27 Tuesday 08:30 | Medium | Nondefense Capital Goods Orders ex Aircraft Prev: 1.6% Forecast: — Actual: — | Tracks orders for business equipment excluding defense and aircraft; traders view it as a gauge of capital investment intentions and future production demand. |
| 2026-10-27 Tuesday 09:00 | Medium | Housing Price Index (MoM) Prev: 0.3 Forecast: 0.1 Actual: — | Tracks monthly changes in residential property values; traders monitor housing wealth, affordability and potential implications for consumption and inflation. |
| 2026-10-27 Tuesday 10:00 | Medium | Consumer Confidence Prev: 81.9 Forecast: 80.5 Actual: — | Surveys households’ views of current conditions and future prospects; traders monitor sentiment for clues about spending resilience and perceived labor-market strength. |
| 2026-10-27 Tuesday 10:00 | Medium | New Home Sales Change (MoM) Prev: 6.4 Forecast: — Actual: — | Measures the monthly change in newly built single-family home sales; traders monitor housing demand and its implications for construction and related consumer spending. |
| 2026-10-27 Tuesday 11:30 | Medium | 52-Week Bill Auction · $54B Prev: 4.4% Forecast: — Actual: — | Reveals demand for government debt near the outer end of the bill curve; traders monitor pricing for signals about funding conditions and expected short-term rates. |
| 2026-10-27 Tuesday 11:30 | Medium | 6-Week Bill Auction · $95B Prev: — Forecast: — Actual: — | Shows demand for very short-term Treasury financing; traders monitor auction pricing and participation for signs of cash demand and money-market conditions. |
| 2026-10-27 Tuesday 13:00 | High | 5-Year Note Auction · $70B Prev: 5.033% Forecast: — Actual: — | Reveals investor demand for intermediate-term Treasury debt; auction yields and bidding strength matter for the yield curve and equity discount rates. |
| 2026-10-27 Tuesday 16:30 | Low | API Weekly Crude Oil Stock Prev: -4.93M Forecast: — Actual: — | Provides an industry estimate of weekly crude inventory changes; traders monitor the supply-demand balance for implications for energy shares and inflation expectations. |
| 2026-10-28 Wednesday 10:30 | Low | EIA Crude Oil Stocks Change Prev: -3.06M Forecast: -0.30M Actual: — | Reports weekly changes in commercial crude inventories; traders monitor oil-market supply-demand conditions and their relevance to energy earnings and inflation. |
| 2026-10-28 Wednesday 11:30 | High | 2-Year FRN Auction · $30B Prev: — Forecast: — Actual: — | Reveals demand and the clearing spread for floating-rate Treasury debt; traders monitor appetite for instruments whose coupons adjust with short-term bill rates. |
| 2026-10-28 Wednesday 11:30 | Medium | 17-Week Bill Auction Prev: — Forecast: — Actual: — | Shows investor demand for short-term government debt; auction yields and participation provide context on cash-market liquidity and front-end funding conditions. |
| 2026-10-28 Wednesday 14:00 | High | Fed Interest Rate Decision Prev: 4% Forecast: 4.00% Actual: — | Sets the central bank’s policy-rate target; traders assess the decision and accompanying guidance for implications for financing costs, economic demand and equity valuations. |
| 2026-10-28 Wednesday 14:30 | High | FOMC Press Conference Prev: — Forecast: — Actual: — | Explains policymakers’ assessment of the economy and policy outlook; traders monitor the discussion for clarification of the decision and potential future rate adjustments. |
| 2026-10-29 Thursday 08:30 | High | Advance GDP q/q Prev: 1.5% Forecast: 3.2% Actual: — | Provides an early estimate of quarterly real economic growth; traders assess the pace and composition of activity for implications for corporate earnings and monetary policy. |
| 2026-10-29 Thursday 08:30 | High | Core Personal Consumption Expenditures – Price Index (MoM) Prev: 0.2 Forecast: 0.3 Actual: — | Measures monthly consumer-price changes excluding food and energy; traders monitor underlying inflation momentum because it informs the central bank’s policy assessment. |
| 2026-10-29 Thursday 08:30 | High | Gross Domestic Product Price Index Prev: 6.1 Forecast: 3.5 Actual: — | Measures price changes across domestically produced final goods and services; traders monitor this broad inflation gauge alongside real growth to assess nominal economic conditions. |
| 2026-10-29 Thursday 08:30 | Medium | Initial Jobless Claims Prev: 194K Forecast: 196K Actual: — | Counts new applications for unemployment benefits; traders monitor this timely indicator for changes in layoffs, labor-market resilience and growth risks. |
| 2026-10-29 Thursday 08:30 | Medium | Personal Income (MoM) Prev: 0.2 Forecast: 0.3 Actual: — | Measures monthly changes in household income from wages and other sources; traders assess consumers’ capacity to sustain spending and support economic growth. |
| 2026-10-29 Thursday 08:30 | Medium | Personal Spending Prev: 0.9 Forecast: 0.3 Actual: — | Tracks household consumption expenditures; traders monitor this major component of economic activity for implications for business revenues, growth and inflation pressure. |
| 2026-10-29 Thursday 08:30 | High | Core Personal Consumption Expenditures – Price Index (YoY) Prev: 3 Forecast: 3.1 Actual: — | Measures annual consumer-price inflation excluding food and energy; traders assess persistent price pressures and progress toward the central bank’s inflation objective. |
| 2026-10-29 Thursday 08:30 | Medium | Core Personal Consumption Expenditures (QoQ) Prev: 3.3 Forecast: — Actual: — | Tracks quarterly consumer-price inflation excluding food and energy; traders monitor underlying price pressures over the quarter for implications for monetary policy. |
| 2026-10-29 Thursday 08:30 | High | Gross Domestic Product Annualized Prev: 2.2 Forecast: 3.2 Actual: — | Expresses real economic growth at an annualized pace; traders assess overall activity and its components for implications for earnings expectations and interest rates. |
| 2026-10-29 Thursday 08:30 | Medium | Personal Consumption Expenditures – Price Index (MoM) Prev: 0.3 Forecast: 0.5 Actual: — | Measures monthly changes in prices paid by consumers, including food and energy; traders monitor broad inflation momentum and its implications for purchasing power and policy. |
| 2026-10-29 Thursday 08:30 | Medium | Personal Consumption Expenditures – Price Index (YoY) Prev: 3.4 Forecast: 3.6% Actual: — | Measures annual changes in prices paid by consumers; traders monitor this broad inflation gauge against the central bank’s objective and its implications for interest rates. |
| 2026-10-29 Thursday 08:30 | Medium | Personal Consumption Expenditures Prices (QoQ) Prev: 5 Forecast: — Actual: — | Tracks quarterly changes in consumer prices, including food and energy; traders assess broad inflation pressure alongside consumption growth and the monetary-policy outlook. |
| 2026-10-29 Thursday 11:30 | Medium | 4-Week Bill Auction Prev: 3.945% Forecast: — Actual: — | Reveals demand for very short-term government debt; traders monitor clearing yields and bidding strength for context on cash availability and money-market conditions. |
| 2026-10-29 Thursday 11:30 | Medium | 8-Week Bill Auction Prev: — Forecast: — Actual: — | Shows demand for short-term Treasury financing; traders monitor auction pricing and participation as indicators of money-market liquidity and front-end rate conditions. |
| 2026-10-29 Thursday 13:00 | High | 7-Year Note Auction · $44B Prev: 5.085% Forecast: — Actual: — | Reveals demand for intermediate-maturity Treasury debt; auction pricing and participation help traders assess yield-curve conditions and financing costs relevant to equity valuations. |
| 2026-10-30 Friday 08:30 | Medium | Employment Cost Index q/q Prev: 0.9% Forecast: 0.8% Actual: — | Measures quarterly changes in employer compensation costs, including wages and benefits; traders monitor persistent labor-cost pressure and its implications for margins, inflation and monetary policy. |
| 2026-10-30 Friday 08:30 | Medium | Employment Cost Index Prev: 0.9 Forecast: 0.8 Actual: — | Tracks employer compensation costs while controlling for shifts in employment composition; traders use it to assess underlying wage and benefit pressures affecting inflation and corporate margins. |
| 2026-10-30 Friday 09:45 | Medium | Chicago PMI Prev: 58.8 Forecast: 55.9 Actual: — | Surveys business activity in the Chicago region; traders monitor orders, employment and production indicators for clues about broader economic momentum. |
| 2026-10-30 Friday 12:30 | Medium | Fed's Musalem speech Prev: — Forecast: — Actual: — | Offers a policymaker’s perspective on economic conditions and monetary policy; traders monitor remarks for signals about the outlook for rates and inflation. |
Summary: The calendar centers on U.S. monetary policy, growth and inflation, alongside labor, consumer and Treasury financing indicators.
Conclusion: The principal macroeconomic releases are concentrated on Wednesday and Thursday.
NYSE Session Open Gap Radar
Session gaps compare the predicted opening price with the prior session’s close to predict the upcoming session’s opening gap pattern.
| Instrument | Gap | Prior Close | Predicted Open | Gap % |
|---|---|---|---|---|
| QQQ | ▼ IGU | 704.40 | 708.71 | ▲ +0.61% |
| GLD | ▼ IGU | 366.61 | 368.25 | ▲ +0.45% |
| IJH | ▲ OGU | 72.37 | 72.65 | ▲ +0.38% |
| DIA | ▼ IGU | 521.37 | 523.36 | ▲ +0.38% |
| SPY | ▼ IGU | 759.97 | 762.79 | ▲ +0.37% |
| IWM | ▲ OGU | 275.75 | 276.42 | ▲ +0.24% |
| TLT | ▼ OGD | 81.34 | 80.49 | ▼ -1.04% |
| USO | ▼ OGD | 169.53 | 165.04 | ▼ -2.65% |
Before the session opens, the table shows the predicted opening price and gap. Once the session opens, it uses the recorded opening price.
Glossary: IGU — Inside Gap Up: above the prior close, within the prior session’s range. IGD — Inside Gap Down: below the prior close, within that range. OGU — Outside Gap Up: above the prior session’s high. OGD — Outside Gap Down: below the prior session’s low.
As of: 2026-10-26 07:16 CT. Predicted gaps are best estimates as of publication and may change before the regular-session open, particularly when the session is still some time away.
Market News Summary:
U.S. futures steadied after last week’s technology selloff as traders focused on the Fed meeting, major technology earnings, and AI financing pressures.
Primary Drivers & Risks:
- Primary Driver: Fed meeting and mega-cap technology earnings
- Primary Risk: AI funding constraints and persistent inflation
Tone:
Cautious stabilization in U.S. futures contrasts with pressure on AI-related shares and Brazilian assets.
Data, Market and System
Geopolitical:
- Brazilian assets sold off sharply after Lula da Silva’s surprise election victory, while challenger Flávio Bolsonaro refused to concede.
- Saudi Arabia’s defense minister was scheduled for Tehran security talks with Pakistani and Turkish officials as Trump weighed an Iran agreement against renewed attacks.
Oil / Energy:
- Oil retreated from a six-month high while risks surrounding the Strait of Hormuz persisted.
- European natural-gas prices exceeded €97 per megawatt-hour for the first time since late 2022 amid colder weather and supply concerns.
- Siemens Energy was reported to be outselling GE Vernova in gas turbines.
Gold / Metals:
- Gold coverage described Fed-week relief alongside continued pressure from inflation.
- Precious metals remained in a downward stretch after earlier-year peaks, with investor sentiment described as extremely bearish.
Fed / Financials:
- Fed coverage centered on an unchanged-rate outcome this week, citing officials’ calls for patience despite firmer inflation readings.
- Former Fed Vice Chair Roger Ferguson argued that two rate increases were necessary to address inflation.
- Treasury yields moved slightly higher after earlier stability, tracking increases across most eurozone peers.
- French government bonds outperformed after Moody’s left France’s credit rating unchanged.
- Musk said debt markets had nearly shut off AI data-center financing, while SpaceX secured $40 billion in mostly callable debt for GPU purchases.
Conclusion:
The Fed meeting and major technology earnings dominate the U.S. index backdrop. AI capital spending, free cash flow, and funding access are central themes as futures stabilize after the technology selloff.
Firmer inflation readings and slightly higher Treasury yields accompany continued financing stress among neocloud companies. Brazil’s election-driven selloff, Iran-related security risks, and elevated European gas prices add cross-market pressures.
Market News Sentiment
Sentiment Bias shows the balance of positive and negative news coverage sampled from 2026-10-25 08:27 to 2026-10-26 07:26 ET, covering stocks, energy and gold.
▲ Market news
- Bias
- ▲ +16.25%
- Articles
- 80
- Positive
- ▲ 35.00%
- Neutral
- — 46.25%
- Negative
- ▼ 18.75%
▲ GLD / Gold
- Bias
- ▲ +16.67%
- Articles
- 6
- Positive
- ▲ 33.33%
- Neutral
- — 50.00%
- Negative
- ▼ 16.67%
Sentiment Summary: Gold coverage is mildly positive but predominantly neutral, with 33% positive versus 17% negative, as October 26 reports describe softer oil helping prices steady near $4,010 ahead of the upcoming Fed meeting. That relief contrasts with October 25 coverage of high-oil pressure and gold below $4,000; inflation concerns and reported rate-hike odds of 75% remain the main counterweight. The positive mix also includes an October 25 article on a five-year GLD investment gain and its collectible-tax treatment, rather than a fresh price catalyst.
Conclusion: The central market context is gold stabilization ahead of the Fed amid persistent inflation and rate concerns.
▼ USO / Oil
- Bias
- ▼ -40.00%
- Articles
- 15
- Positive
- ▲ 20.00%
- Neutral
- — 20.00%
- Negative
- ▼ 60.00%
Sentiment Summary: Oil coverage was 60% negative versus 20% positive as crude fell on October 26 from near six-month highs, reflecting reported U.S.-Iran diplomacy hopes, technical correction and demand concerns after the October 23 rally following Houthi attacks on Saudi Arabia. Persistent Saudi supply and Hormuz risks counterbalanced the pullback, while refining constraints sustained concerns about elevated fuel prices. For equities, Asian stocks weakened as risk appetite ebbed ahead of the upcoming Fed decision, although bullish S&P 500 commentary cited potential oil relief and AI opportunities.
Conclusion: Energy-related inflation and interest-rate risks remain central to the reported cross-market context.
Glossary: Sentiment Bias = (positive articles − negative articles) ÷ total articles × 100. It ranges from −100% negative to +100% positive. A reading near zero indicates little directional bias. Neutral articles reduce the score’s strength. ▲ positive; ▼ negative; — balanced. These readings describe news coverage, not market-price direction.
Market Technical Analysis
Analysis of VIX volatility, prior-session major ETFs and mega-cap tech stocks, and real-time futures snapshots and higher-time-frame analysis.
VIX — Market Fear Gauge Daily
| Level | Open | High | MaxVix | Low | MinVix | DNC% | DOC% | VR | MaxVR | MinVR |
|---|---|---|---|---|---|---|---|---|---|---|
| 19.45 | 20.10 | 20.66 | 22.31 | 18.88 | 14.77 | +2.21% | -3.23% | 4.23 | 41.30 | -2.03 |
VIX fell 3.23% from the session's opening level. VIX rose 2.21% versus the previous session close. Expected volatility eased from the period open. VIX is 62.1% up the recent 15-session range (14.77–22.31), in the 60–70% band.
VR: ATN Volatility Ratio (VR): 4.23 – Stocks fell while expected volatility rose. VR is in the lower part of its preceding 15-session VR range (-2.03 to 41.30), in the 10–20% band. VR fell 7.70 points from the previous session, a moderate shift relative to that range.
Range lookback: preceding 15 completed sessions.
Major ETFs and Mega Cap Tech Stocks
- U.S. stock futures were broadly steady to recovering following last week’s technology rout.
- Neocloud stocks fell after Elon Musk warned of widespread failures and consolidation amid tightening AI financing conditions.
- Alphabet, Microsoft, and Amazon earnings previews emphasized capital spending, free cash flow, and access to financing.
- Amazon’s cloud revenue growth and increased capital spending featured prominently in coverage ahead of its October 29 earnings.
- SpaceX rose after strong third-quarter results and bullish analyst revisions, while separate coverage highlighted heavy investment requirements and insider share-sale eligibility beginning October 26.
- Goldman Sachs cut its Korean market target by 25%, citing lower AI valuation multiples and increased volatility.
- Verizon raised its full-year outlook and announced an AI agreement with Amazon worth more than $2 billion.
- Meta announced a new non-voting Class C common stock effective January 2027.
ETF, Mag7, and Cross-Market ETF prior day Insights
Overall Tone
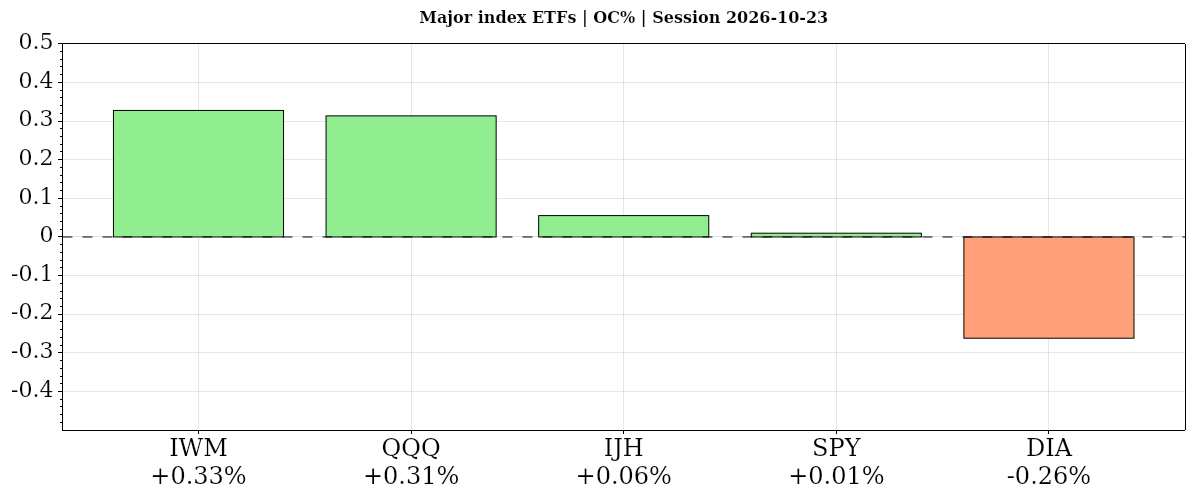
The October 23, 2026 daily session showed selective gains from the open but broadly weaker prior-close comparisons, leaving risk tone cautious.
| Instrument | Bias | Date | DNC% | DOC% | O | H | L | C | VWAP | Vol |
|---|---|---|---|---|---|---|---|---|---|---|
| ▲ IWM | ▼ ▲ ▲ | 2026-10-23 | ▼ -0.33% | ▲ +0.33% | 274.85 | 276.24 | 273.35 | 275.75 | ▲ 275.29 | 20,819,392 |
| ▲ QQQ | ▼ ▲ ▼ | 2026-10-23 | ▼ -0.01% | ▲ +0.31% | 702.20 | 709.30 | 701.16 | 704.40 | ▼ 705.42 | 29,638,600 |
| ▲ IJH | ▼ ▲ ▲ | 2026-10-23 | ▼ -0.59% | ▲ +0.06% | 72.33 | 72.62 | 71.87 | 72.37 | ▲ 72.35 | 5,355,035 |
| ▲ SPY | ▼ ▲ ▼ | 2026-10-23 | ▼ -0.52% | ▲ +0.01% | 759.90 | 763.47 | 758.68 | 759.97 | ▼ 760.77 | 33,112,524 |
| ▼ DIA | ▼ ▼ ▼ | 2026-10-23 | ▼ -1.24% | ▼ -0.26% | 522.74 | 523.70 | 519.88 | 521.37 | ▼ 522.02 | 2,857,655 |
| AVG/Sum | — | — | -0.54% | +0.09% | — | — | — | — | — | 91,783,206 |
Index ETFs
Mixed: average DOC% +0.09% from the open, DNC% -0.54% versus the prior close. Four of five index ETFs gained from the open, led by IWM and QQQ; SPY was near-flat and DIA lagged, while all five fell versus the prior close. IWM and IJH closed above VWAP, unlike the larger-cap funds.
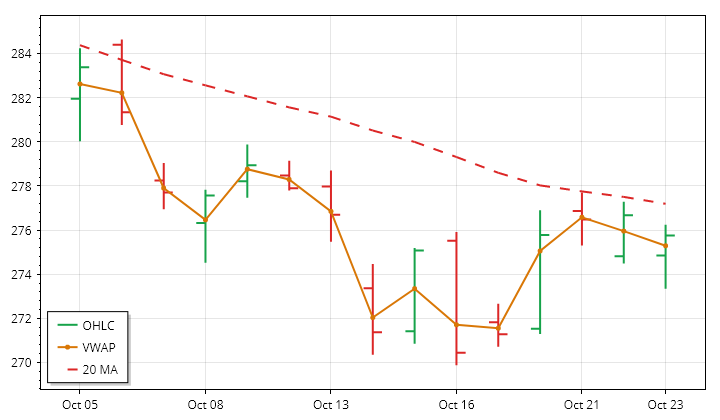
IWM · D:2026-10-23 NC% ▼ -0.33% OC% ▲ +0.33%
IWM – Small Cap Technicals Summary
IWM's completed daily session on October 23 closed at 275.75, down 0.33% from the previous close but up 0.33% from the open. The intraday rebound left the opening gap lower unfilled, yet produced a close near the day's high and above session VWAP. A lower high and lower low still marked the session, and the close stayed inside the previous day's range.
That recovery has not resolved the broader conflicts. Price is above a falling near-term average, below a falling intermediate-term average, and below a slightly rising far-term average. The 15-session trend remains downward with limited net directional progress. Both range and volume were below average; the smaller range opposed the expanding lookback trend, while lighter volume matched declining participation. PSAR remains bullish, but a next-session low below 270.6379 would trigger a bearish reversal.
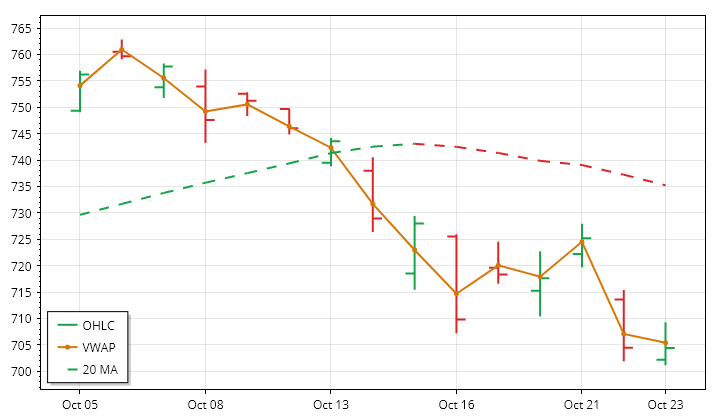
QQQ · D:2026-10-23 NC% ▼ -0.01% OC% ▲ +0.31%
QQQ – Nasdaq 100 Technicals Summary
QQQ's completed daily session on October 23 ended at 704.4, essentially unchanged from the prior close but up 0.31% from the open. The opening gap lower was filled, although the close remained marginally below the prior-close reference. A lower high and lower low, together with a finish below session VWAP, temper the positive open-to-close performance. The close remained inside the previous day's range.
The near-term downtrend and declining 15-session price trend contrast with a still-rising far-term structure. Price also remains below a rising intermediate average, leaving that horizon mixed rather than positively aligned. The latest range and volume were below their prior 15-session averages, opposing the broader expansion in ranges and increase in participation. PSAR remains bearish; a next-session high above 722.592 would trigger a bullish reversal, not establish one in the completed session.
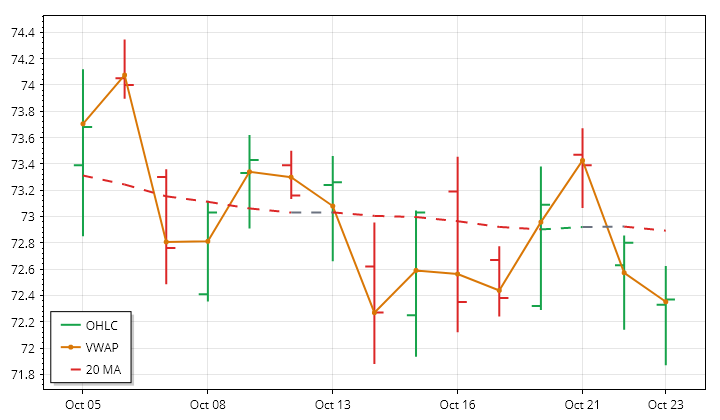
IJH · D:2026-10-23 NC% ▼ -0.59% OC% ▲ +0.06%
IJH – Mid Cap Technicals Summary
IJH's completed daily session on October 23 finished at 72.37, down 0.59% versus the prior close despite gaining 0.06% from the open. The small intraday gain did little to offset an opening gap lower that remained unfilled. Trading crossed both sides of the open and ended just above session VWAP, while a lower high and lower low preserved a weaker daily structure.
Near- and intermediate-term downtrends remain aligned, with price below falling averages. The far-term average still rises, but price is beneath it, leaving that horizon mixed rather than confirming strength. The prior 15-session price path showed almost no net directional efficiency, indicating substantial back-and-forth movement. The latest range was slightly below average despite an expanding range trend, and below-average volume matched the softer lookback volume direction. A high above 73.6015 next session would conditionally reverse bearish PSAR.
SPY · D:2026-10-23 NC% ▼ -0.52% OC% ▲ +0.01%
SPY – S&P 500 Technicals Summary
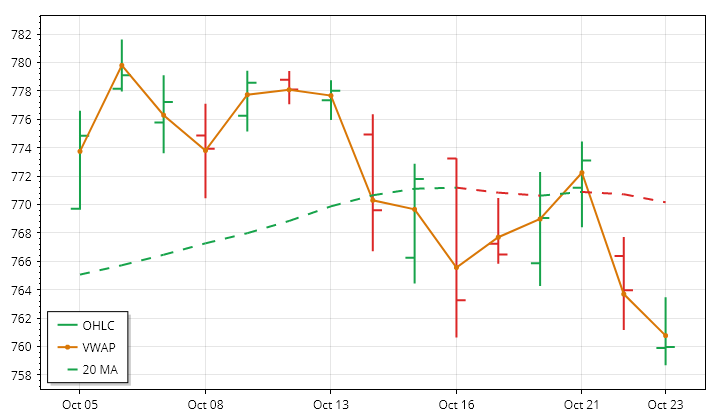
SPY's completed daily session on October 23 closed at 759.97, down 0.52% from the previous close but virtually unchanged from the open. The loss was therefore concentrated in an opening gap lower that remained unfilled. Trading on both sides of the open produced a lower high and lower low, with the finish beneath the previous day's low and session VWAP.
Near-term weakness persists within a rising far-term structure. The intermediate average is also rising, but price is below it, leaving that horizon mixed. Across the prior 15 sessions, directional efficiency was almost zero, showing little net progress relative to the back-and-forth movement. The latest range and volume were below average despite expanding ranges and increasing volume over that window. PSAR is in a short state; a next-session high above 774.44 would conditionally trigger a bullish reversal.
DIA · D:2026-10-23 NC% ▼ -1.24% OC% ▼ -0.26%
DIA – Dow Jones Technicals Summary
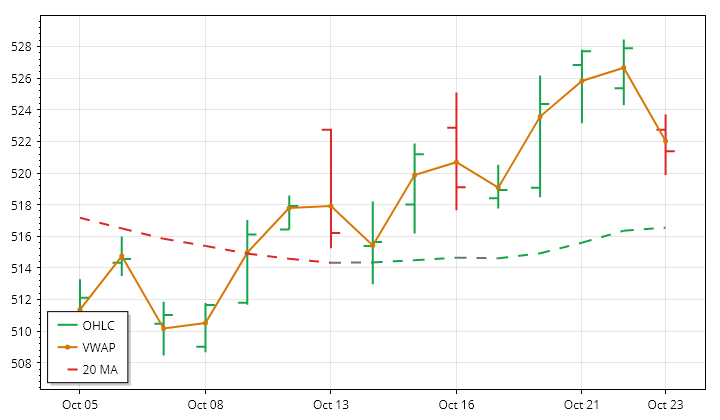
DIA's completed daily session on October 23 closed at 521.37, losing 1.24% against the prior close but only 0.26% from the open. Most of the decline therefore occurred in the opening gap, which remained unfilled. The session added a lower high and lower low and finished below the previous day's low and session VWAP, leaving the intraday recovery attempts unable to repair the initial weakness.
That decline interrupts a rising 15-session price trend without overturning the far-term uptrend. Shorter horizons are conflicted: price is below a rising near-term average but above a falling intermediate-term average. The day's range was below average despite expanding ranges over the lookback, while subdued volume matched the broader declining volume trend. PSAR remains in a short state; a next-session high above 528.45 would trigger a bullish reversal only if reached.
| Instrument | Bias | Date | DNC% | DOC% | O | H | L | C | VWAP | Vol |
|---|---|---|---|---|---|---|---|---|---|---|
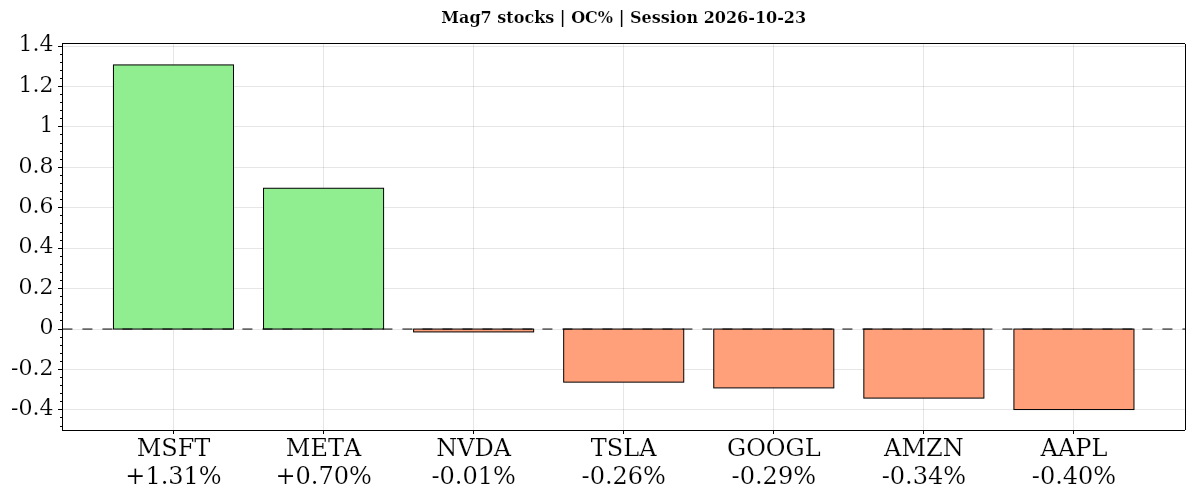
| ▲ MSFT | ▲ ▲ ▲ | 2026-10-23 | ▲ +0.66% | ▲ +1.31% | 517.75 | 525.77 | 515.70 | 524.51 | ▲ 523.31 | 13,396,359 |
| ▲ META | ▼ ▲ ▼ | 2026-10-23 | ▼ -0.96% | ▲ +0.70% | 638.17 | 648.04 | 633.27 | 642.62 | ▼ 643.25 | 14,706,091 |
| ▼ NVDA | ▼ ▼ ▼ | 2026-10-23 | ▼ -0.59% | ▼ -0.01% | 210.99 | 213.85 | 210.18 | 210.96 | ▼ 211.91 | 78,096,384 |
| ▼ TSLA | ▼ ▼ ▲ | 2026-10-23 | ▼ -0.63% | ▼ -0.26% | 373.20 | 377.32 | 365.27 | 372.22 | ▲ 371.86 | 34,782,708 |
| ▼ GOOGL | ▼ ▼ ▼ | 2026-10-23 | ▼ -1.24% | ▼ -0.29% | 321.14 | 324.53 | 320.18 | 320.21 | ▼ 321.89 | 17,590,246 |
| ▼ AMZN | ▼ ▼ ▼ | 2026-10-23 | ▼ -0.95% | ▼ -0.34% | 248.85 | 250.01 | 246.45 | 248.00 | ▼ 248.45 | 25,419,607 |
| ▼ AAPL | ▼ ▼ ▼ | 2026-10-23 | ▼ -0.14% | ▼ -0.40% | 349.12 | 351.73 | 345.75 | 347.73 | ▼ 348.03 | 40,020,875 |
| AVG/Sum | — | — | -0.55% | +0.10% | — | — | — | — | — | 224,012,270 |
Mag7 Stocks
Mixed: average DOC% +0.10% from the open, DNC% -0.55% versus the prior close. Microsoft led the two open-to-close gainers, ahead of Meta, while Apple lagged; Microsoft alone gained versus the prior close. Apple retained rising moving-average structures across horizons despite its decline, while Nvidia’s near-term weakness contrasted with its longer-term uptrend.
MSFT · D:2026-10-23 NC% ▲ +0.66% OC% ▲ +1.31%
MSFT – Microsoft Technicals Summary
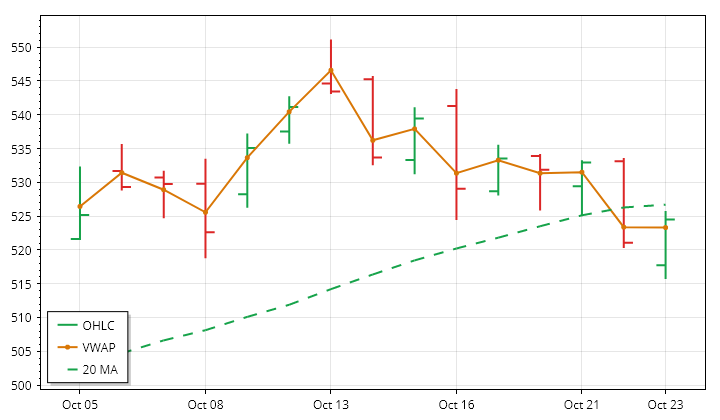
MSFT's completed daily session on October 23 closed at 524.51, up 0.66% from the previous close and 1.31% from the open. The stronger open-to-close gain reflects a recovery from an opening gap lower, which was filled. Price finished near the session high and above VWAP, although the day still recorded a lower high and lower low and closed inside the previous day's range.
The rebound fits rising intermediate- and far-term structures, but price remains below its rising near-term average, leaving incomplete alignment. The prior 15-session advance also showed limited directional efficiency, suggesting considerable back-and-forth trading. The day's range was close to average despite a broader expansion trend, while volume was roughly two-thirds of average, consistent with declining lookback participation. PSAR remains bearish; a next-session high above 536.9257 would trigger a bullish reversal only conditionally.
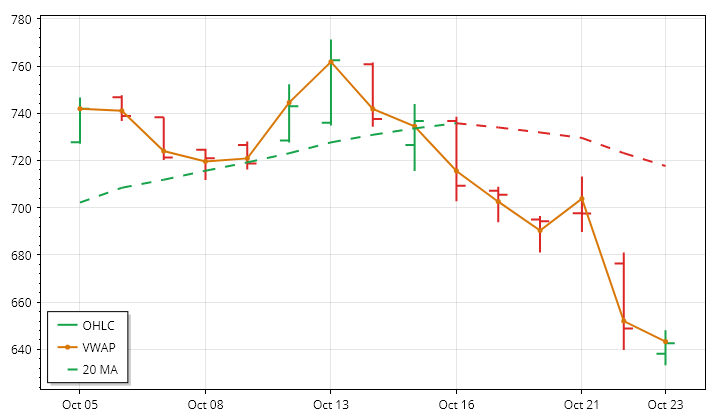
META · D:2026-10-23 NC% ▼ -0.96% OC% ▲ +0.70%
META – Meta Platforms Technicals Summary
META's completed daily session on October 23 ended at 642.62, down 0.96% from the prior close even after rising 0.70% from the open. The recovery only partially offset a substantial opening gap lower, which remained unfilled. The session made a lower high and lower low, and its close stayed inside the previous day's range but slightly below session VWAP, limiting the strength of the intraday rebound.
The near-term trend remains downward, while price below a rising intermediate average leaves that horizon mixed. The far-term structure is still rising, with price above its benchmark, so recent weakness has not aligned all horizons bearishly. The day's range and volume were below their prior 15-session averages despite expanding ranges and increasing volume over that window. PSAR remains bearish; a next-session high above 711.4497 would conditionally trigger a bullish reversal.
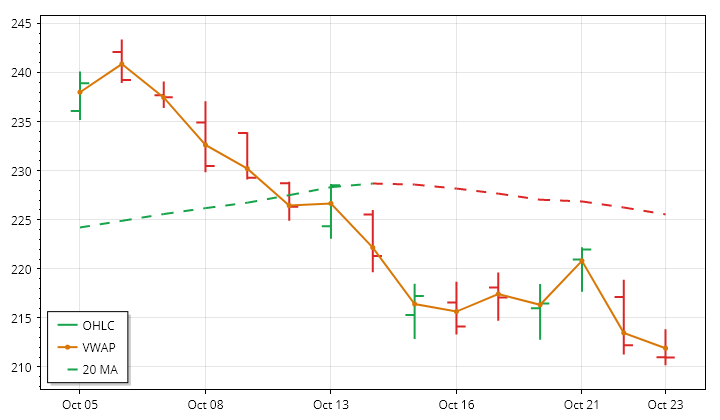
NVDA · D:2026-10-23 NC% ▼ -0.59% OC% ▼ -0.01%
NVDA – Nvidia Technicals Summary
NVDA's completed daily session on October 23 closed at 210.96, down 0.59% from the prior close but almost unchanged from the open. The opening gap lower was filled intraday, yet the recovery faded. A lower high and lower low accompanied a finish near the session low, below the previous day's low and session VWAP, making the flat open-to-close result less reassuring than it first appears.
Near-term weakness matches the declining 15-session price trend. Intermediate signals remain mixed because price is below a rising average, while the far-term uptrend persists with price still above its benchmark. The latest range was below average despite expanding lookback ranges, and lighter volume was consistent with the declining volume trend. PSAR has turned bearish; a next-session high above 221.5895 would be needed to trigger a conditional bullish reversal.
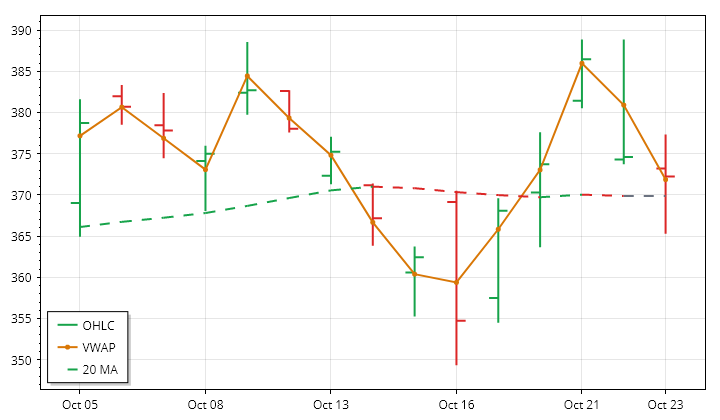
TSLA · D:2026-10-23 NC% ▼ -0.63% OC% ▼ -0.26%
TSLA – Tesla Technicals Summary
TSLA's completed daily session on October 23 closed at 372.22, down 0.63% from the prior close and 0.26% from the open. Its opening gap lower was filled, but the session still produced a lower high and lower low and finished beneath the previous day's low. The close was slightly above session VWAP, providing a modest counterpoint to the negative daily structure rather than confirming broader strength.
Trend alignment remains fragmented. Price is just below a rising near-term average, above a rising intermediate average, and below a falling far-term average. The latest range was above average, matching the prior 15-session expansion and marking a second consecutive large-range session. Volume, however, was slightly below average despite an increasing lookback trend. PSAR remains bullish; a next-session low below 355.0618 would trigger a bearish reversal only if breached.
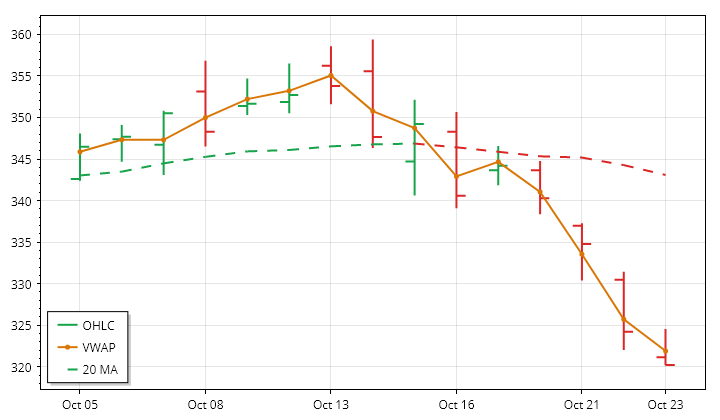
GOOGL · D:2026-10-23 NC% ▼ -1.24% OC% ▼ -0.29%
GOOGL – Alphabet Technicals Summary
GOOGL's completed daily session on October 23 ended at 320.21, down 1.24% from the prior close and 0.29% from the open. The opening gap lower was filled during trading, but that recovery did not last. The day registered a lower high and lower low and closed near its low, beneath both the previous day's low and session VWAP.
The latest weakness fits the declining 15-session price trend and aligned near- and far-term downtrends. The intermediate horizon is conflicted rather than bullishly aligned: its average is still rising, but price remains below it. Range and volume were both well below their prior 15-session averages, opposing the lookback's expanding ranges and increasing volume. Thus, the latest decline occurred with reduced activity rather than an acceleration in participation. A next-session high above 340.199 would conditionally reverse the bearish PSAR state.
AMZN · D:2026-10-23 NC% ▼ -0.95% OC% ▼ -0.34%
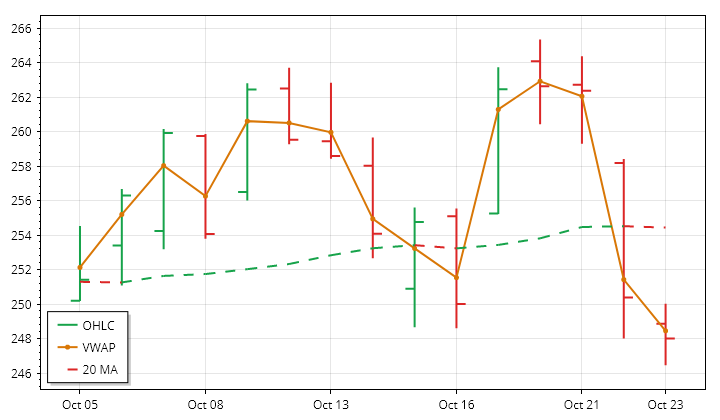
AMZN – Amazon Technicals Summary
AMZN's completed daily session on October 23 ended at 248, down 0.95% from the previous close and 0.34% from the open. The opening gap lower remained unfilled. A lower high and lower low, followed by a close beneath the previous day's low and session VWAP, left the latest day's price action weak despite its relatively contained trading range.
The broader structure is less uniform. Price sits below rising near- and intermediate-term averages, creating mixed signals, while remaining only slightly above the rising far-term benchmark. The prior 15-session price trend was marginally upward but made very little net directional progress. Both range and volume were substantially below average in the latest session, contrasting with their expanding and increasing lookback trends. PSAR is in a downtrend; a next-session high above 264.3953 would conditionally trigger a bullish reversal.
AAPL · D:2026-10-23 NC% ▼ -0.14% OC% ▼ -0.40%
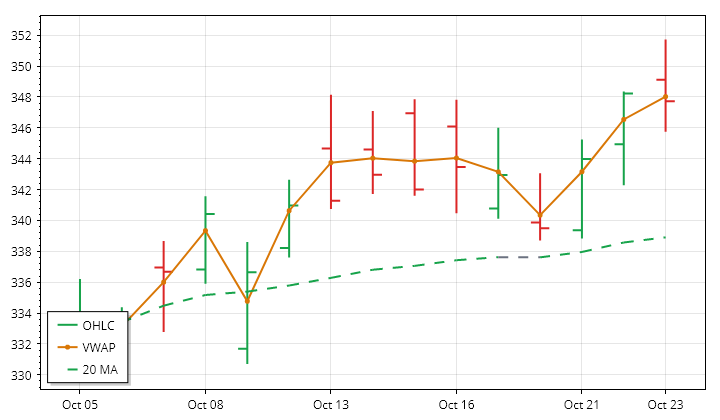
AAPL – Apple Technicals Summary
AAPL's completed daily session on October 23 closed at 347.725, down 0.14% from the prior close and 0.40% from the open. The opening gap higher was filled, and trading on both sides of the open ended below session VWAP. Although the day produced a higher high and higher low, the close returned inside the previous day's range, showing that the early strength did not hold.
This daily setback contrasts with aligned near-, intermediate- and far-term uptrends, with price still above rising averages across all three horizons. The session's range and volume were both modestly above their prior 15-session averages, consistent with expanding ranges and increasing volume over that lookback. The existing PSAR uptrend remains intact; a next-session low below 341.41 would trigger a bearish reversal rather than confirm one now.
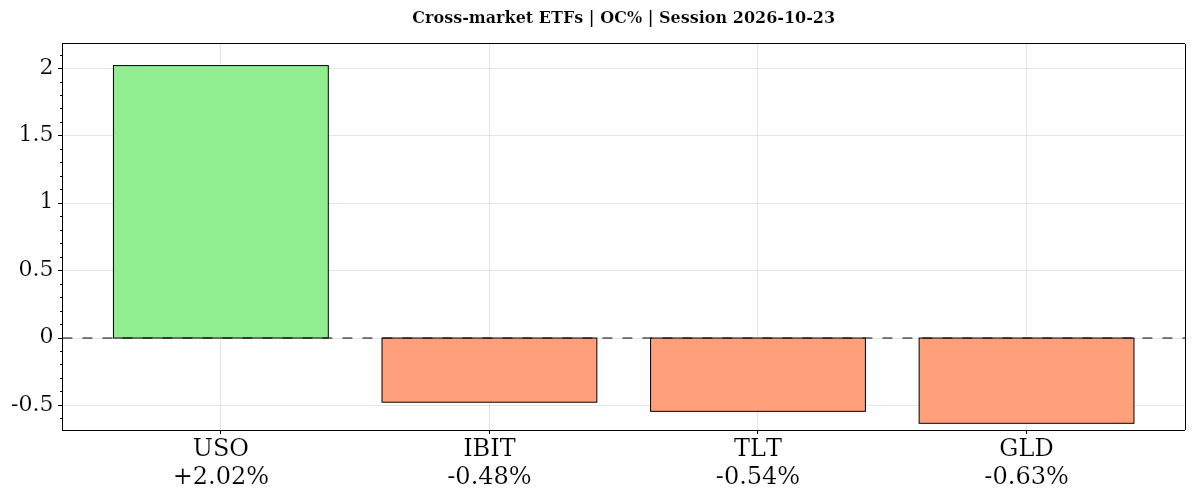
| Instrument | Bias | Date | DNC% | DOC% | O | H | L | C | VWAP | Vol |
|---|---|---|---|---|---|---|---|---|---|---|
| ▲ USO | ▲ ▲ ▲ | 2026-10-23 | ▲ +4.32% | ▲ +2.02% | 166.17 | 169.96 | 166.04 | 169.53 | ▲ 168.13 | 6,331,989 |
| ▼ IBIT | ▼ ▼ ▼ | 2026-10-23 | ▼ -0.22% | ▼ -0.48% | 46.18 | 46.41 | 45.81 | 45.96 | ▼ 46.12 | 22,744,158 |
| ▼ TLT | ▼ ▼ ▼ | 2026-10-23 | ▼ -0.49% | ▼ -0.54% | 81.78 | 81.80 | 81.27 | 81.34 | ▼ 81.44 | 34,576,600 |
| ▼ GLD | ▼ ▼ ▲ | 2026-10-23 | ▼ -0.65% | ▼ -0.63% | 368.94 | 369.25 | 364.33 | 366.61 | ▲ 366.59 | 9,921,237 |
| AVG/Sum | — | — | +0.74% | +0.09% | — | — | — | — | — | 73,573,984 |
Cross-Market ETFs
Positive confluence: average DOC% +0.09% from the open, DNC% +0.74% versus the prior close. Oil alone rose on both comparisons, gaining 2.02% from the open and 4.32% versus the prior close, with aligned uptrends and above-average volume. Bonds, gold and bitcoin fell alongside equities rather than diverging positively.
USO · D:2026-10-23 NC% ▲ +4.32% OC% ▲ +2.02%
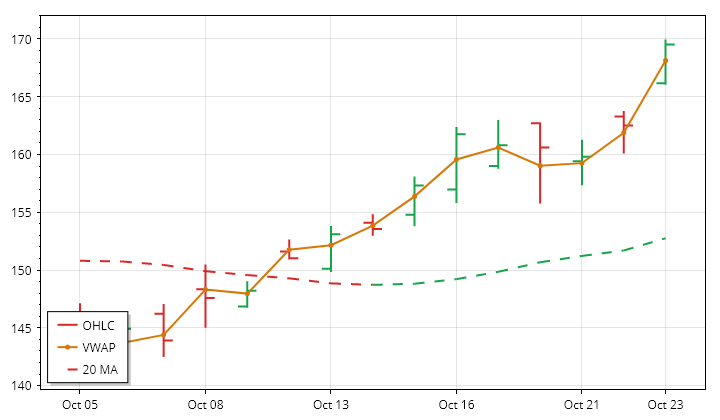
USO – Oil Technicals Summary
USO's completed daily session on October 23 closed at 169.53, up 4.32% from the previous close and 2.02% from the open. The distinction reflects a substantial opening gap higher that remained unfilled, followed by further intraday gains. The session made a higher high and higher low and finished near its high, above both the previous day's high and session VWAP.
This advance reinforces aligned near-, intermediate- and far-term uptrends, with price above rising averages across all horizons. Volume was about 38% above its prior 15-session average, consistent with increasing lookback participation. The daily range was slightly below average despite the broader expansion trend, distinguishing the gap-driven total gain from the intraday range. The close was just below the 52-week high. A next-session low below 159.856 would conditionally reverse the bullish PSAR state.
Oil News and Fundamentals
Oil reached five-month highs on October 23, with Brent futures reported up 2.7% at $116.26 a barrel and headed for a weekly gain exceeding 10%. Reports linked gains to falling U.S. crude inventories and Middle East supply risks. Iran-backed Houthis claimed attacks on Saudi Arabia’s Yanbu port, an oil field and an airport. Kpler said Gulf crude flows had largely recovered to roughly 24 million barrels daily, but refined-product flows remained 50% below pre-war levels.
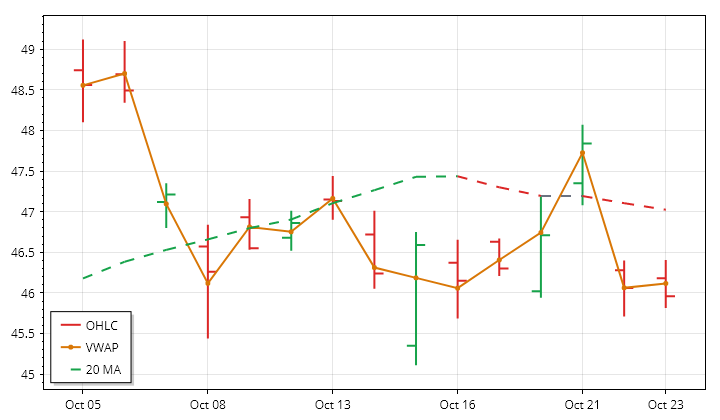
IBIT · D:2026-10-23 NC% ▼ -0.22% OC% ▼ -0.48%
IBIT – Bitcoin Technicals Summary
IBIT's completed daily session on October 23 closed at 45.96, down 0.22% from the prior close and 0.48% from the open. An initial gap higher was filled, and the close finished near the day's low and below session VWAP. Nevertheless, the session formed a higher high and higher low and remained inside the previous day's range at the close, making the daily structure less uniformly negative than the return alone suggests.
Near-term weakness continues against rising intermediate- and far-term averages, with price barely above the intermediate benchmark. The latest range was below average, consistent with the prior 15-session contraction in ranges. Volume was also subdued, unlike its modestly increasing lookback trend. PSAR still indicates an uptrend despite the weaker near-term average structure; a next-session low below 45.71 would trigger a bearish reversal.
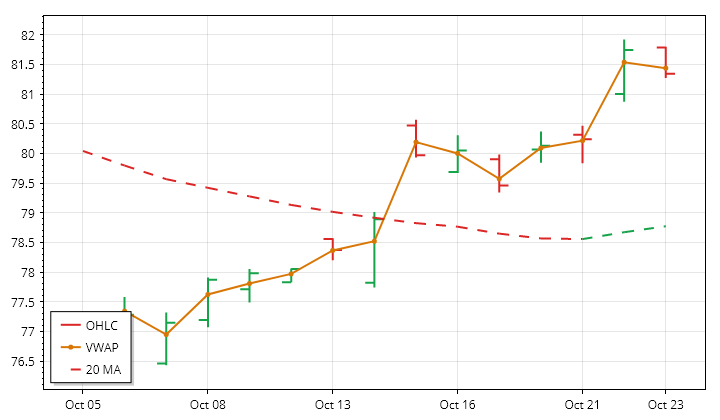
TLT · D:2026-10-23 NC% ▼ -0.49% OC% ▼ -0.54%
TLT – Long-Term Treasury Bonds Technicals Summary
TLT's completed daily session on October 23 finished at 81.34, down 0.49% from the prior close and 0.54% from the open. A small opening gap higher was filled, and the session ended near its low and below VWAP. The entire day's range remained inside the previous day's range, framing the decline as a contained pullback rather than a fresh expansion in daily price movement.
The near-term trend remains upward, consistent with the rising prior 15-session price trend, but the far-term average still falls with price beneath it. Price is above a falling intermediate average, leaving that horizon mixed. Range and volume were both below average despite modestly expanding ranges and increasing volume in the lookback. The existing bullish PSAR state remains intact; a next-session low below 80.252 would conditionally trigger a bearish reversal.
Treasury Bonds News and Fundamentals
The 10-year Treasury yield fell sharply on October 22 amid reported signs that debt issuance from AI hyperscalers may be easing. Investors expressed hope that the Treasury market’s decline was finding a bottom, although yields remained elevated.
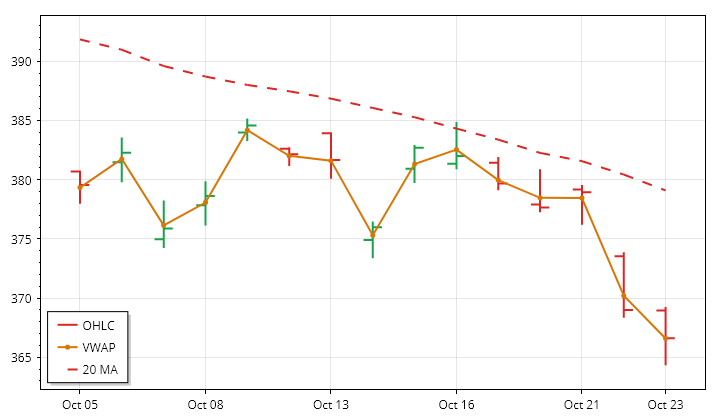
GLD · D:2026-10-23 NC% ▼ -0.65% OC% ▼ -0.63%
GLD – Gold Technicals Summary
GLD's completed daily session on October 23 closed at 366.61, down 0.65% from the previous close and 0.63% from the open. The nearly unchanged opening level gave way to a lower high and lower low, with the close below the prior day's low. It finished only fractionally above session VWAP, so that positive VWAP position offers little contrast to the otherwise negative daily structure.
Near-, intermediate- and far-term trends are aligned downward, with price beneath falling averages throughout. The latest session's range was about 35% above its prior 15-session average, breaking against the lookback's contracting range trend, while above-average volume accompanied an already increasing volume trend. This was also the second consecutive large-range session. PSAR is bearish; a next-session high above 383.8525 would be required to trigger its conditional bullish reversal.
Gold News and Fundamentals
Gold fell below $4,000 an ounce on October 23, extending its weekly decline. Reports attributed pressure to rising oil prices, inflation concerns, expectations of further Federal Reserve tightening and liquidations during Thursday’s technology-led stock selloff. Prices weakened despite U.S. 10-year Treasury yields falling below 5%. October’s final University of Michigan consumer sentiment reading was 48, above the 46.3 consensus forecast, while inflation expectations rose. The Fed’s October 28 decision is the next identified catalyst.
Glossary: Instrument — ticker symbol; hover for the instrument or company name; Date — session date. DNC% — prior-session close to this session’s close; DOC% — daily session open-to-close percentage change. O — open; H — high; L — low; C — close, all for the table’s daily or weekly session; VWAP — volume-weighted average price; its arrow shows whether the close is above or below VWAP. Vol — period trading volume.
Bias — three directional readings, in order: DNC%, DOC%, then VWAP. ▲ positive/above; ▼ negative/below; — neutral or unavailable. Matching arrows show alignment; opposing arrows show mixed conditions. AVG/Sum — simple average of percentage changes and sum of reported volumes.
Futures Session Fib Grid Analysis – Snapshot
Session Fib Grids normalise market positioning as percentages, making direction and alignment comparable across different asset types.
Latest available snapshot for each instrument; Time(CT) shows the individual update date and time.
| Instrument | Bias | Time(CT) | YSFG | MSFG | WSFG | RSFG | SFG | TSI |
|---|---|---|---|---|---|---|---|---|
| ▼ ZB | ▼ ▲ ▲ ▼ ▼ ▲ | 2026-10-21 09:39:59 | ▼ -39 | ▲ +77 | ▲ +6 | ▼ -3 | ▼ -2 | ▲ +29 |
Glossary: YSFG — yearly; MSFG — monthly; WSFG — weekly; RSFG — regular trading hours (RTH); SFG — the current session, including pre-market or other sessions. TSI indicates trend strength and power.
Bias shows trend alignment across these six readings. The arrows follow the column order: YSFG, MSFG, WSFG, RSFG, SFG and TSI. Matching arrows show alignment; opposing arrows show mixed conditions.
Futures Higher Time Frame Analysis
Summary of the current state of US Indices Futures based on higher time-frame (HTF) technical analysis as of: 2026-10-26 07:16 -05:00 CT.
US Indices Futures
- ES YSFG upward, MSFG below F0%, WSFG unspecified, daily benchmarks breached through 100-day, pivots down, support 7648.50/7575.00, resistance 7809.00/7906.25.
- NQ YSFG/WSFG upward, MSFG below F0%, rising 200-day benchmark, pivots down, support 28987.00/28437.50, resistance 30102.50/31618.50.
- YM YSFG/MSFG/WSFG upward, daily benchmarks mixed, weekly pivots down, support 51970/50859, resistance 53168/53688/55316.
- EMD YSFG/MSFG/WSFG upward, below all daily benchmarks, pivots down, support 3600.3–3604.1, reversal threshold 3705.9, resistance 3737.8/3825.3.
- RTY YSFG upward, MSFG below F0%, WSFG unspecified, below declining 20–200-day benchmarks, pivots down, support 2723.0–2723.3, resistance 2803.7/2887.2.
- FDAX YSFG/MSFG above F0%, WSFG below F0%, below 5/10/55/100-day benchmarks, pivots down, support 25119–24897, reversal threshold 25725, resistance 25833/25990.
Overall State
- Short-Term: Bearish
- Intermediate-Term: Neutral
- Long-Term: Bullish
Conclusion
Downward short-term pivot structures correlate across all six instruments, while yearly grids retain upward structure. ES, NQ, and RTY have MSFG readings below F0%; YM, EMD, and FDAX retain upward monthly grids. YM shows relative intermediate-term strength, while EMD and RTY have bearish daily long-term ratings despite bullish weekly structures. ES and FDAX recent short signals align with pullbacks; EMD weekly long signals contrast with its daily decline. Rising longer-period weekly benchmarks support the broader advance, but daily benchmark weakness and overhead pivot resistance maintain timeframe divergence.
Note: Intra-day counter-trend pullbacks or retracements may occur, HTF is context for informational usage and market structure. Glossary: Session Fib Grids periods of YSFG:’Yearly’, MSFG:’Monthly’, WSFG:’Weekly’
For full details visit: AlphaWebTrader Technicals
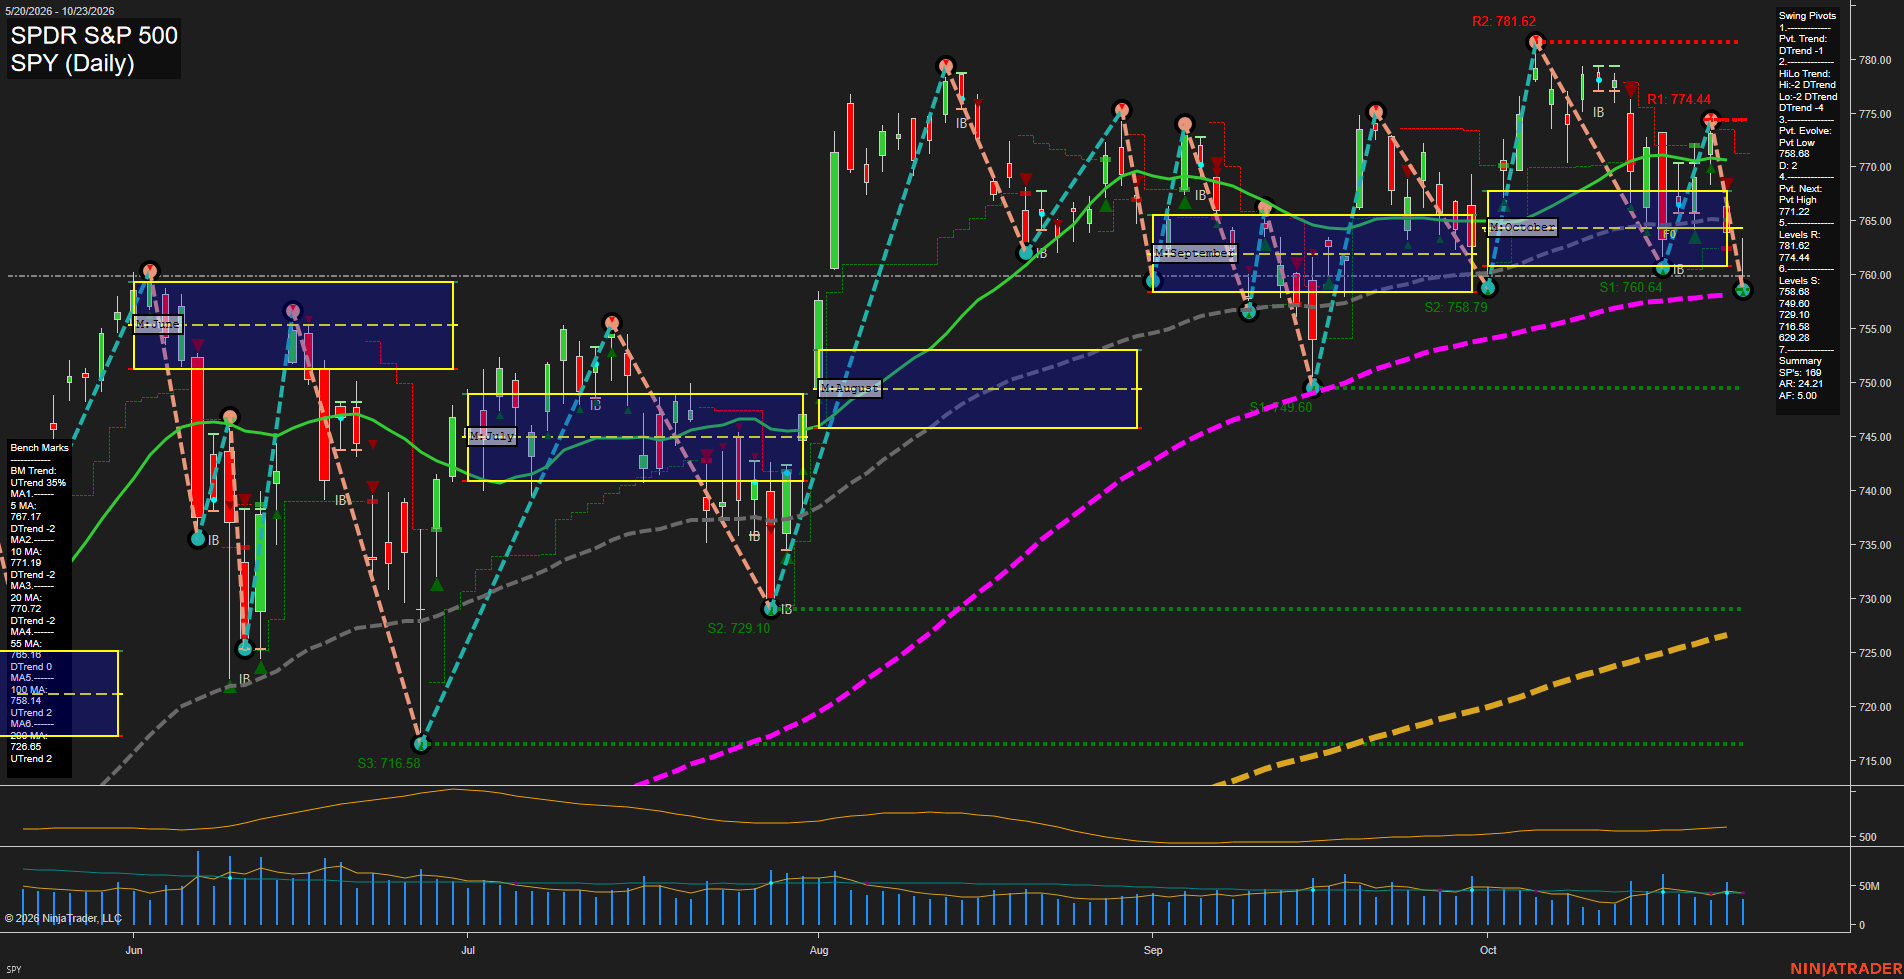
SPY Daily View
Overall Rating
- Short-Term: Bearish
- Intermediate-Term: Bearish
- Long-Term: Bullish.
Key Insights Summary
SPY’s futures-equivalent swing structure is in a fast downside rotation, with price closing at the active 758.68 pivot-low support after a sharp rejection from the 774.44 resistance area. The short-term pivot and intermediate HiLo structures are both DTrend, while price is below the 5-, 10-, 20-, and 55-day benchmark cluster. The 758.68 level is the immediate structural inflection point; lower supports are 749.60 and 728.10. A recovery through 771.22 would define the next pivot-high reversal threshold, with 774.44 and 781.62 the overhead swing resistance levels. Long-term structure remains constructive because the 100-day and 200-day benchmarks continue rising, placing the current decline within a longer-term bullish trend that is undergoing a pronounced intermediate-term pullback.
View charts on: AlphaWebTrader HTF Charts
ES Daily View
Overall Rating
- Short-Term: Bearish
- Intermediate-Term: Bearish
- Long-Term: Bullish.
Key Insights Summary
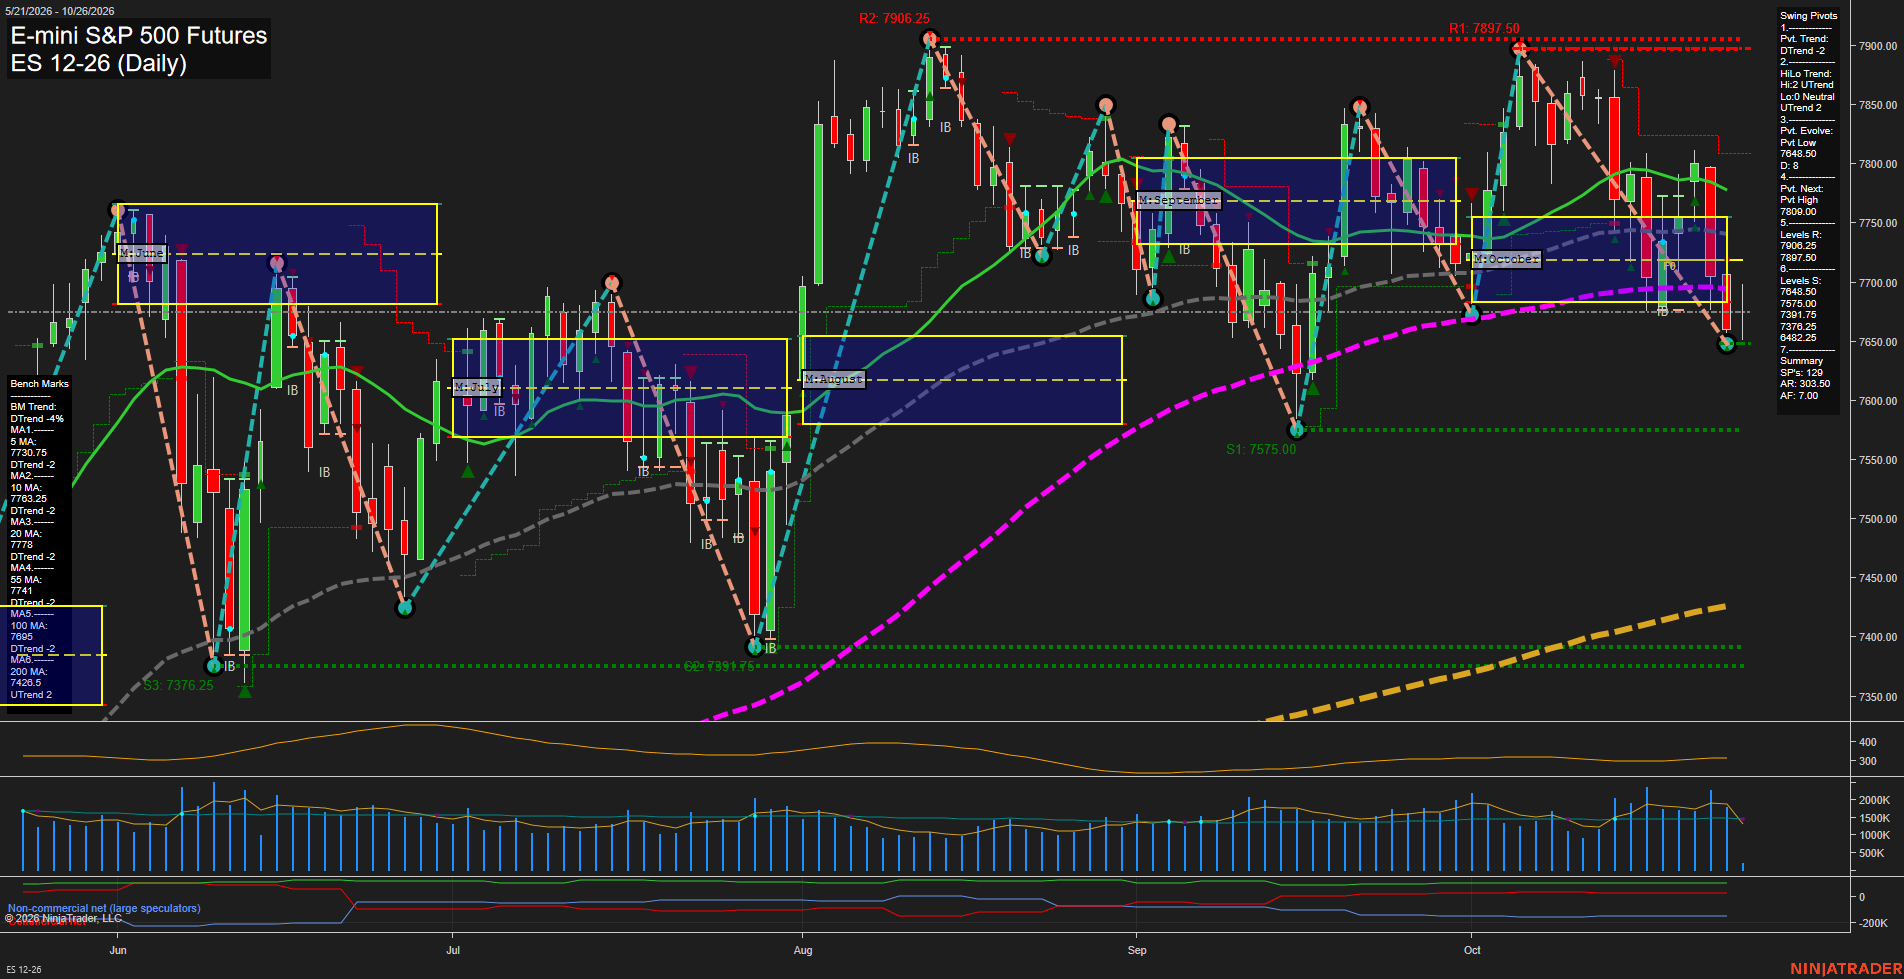
Price has accelerated lower from the October swing-high region near 7897.50, producing large-range bearish bars and a short-term DTrend pivot structure. The decline has broken beneath the 5-, 10-, 20-, 55-, and 100-day benchmarks, while the monthly grid remains below its F0% area, confirming intermediate-term downside pressure. The 7648.50 pivot-low area is the immediate structural support, with 7575.00 the next prominent downside reference. Despite the current selloff, the intermediate HiLo pivot trend and yearly grid remain upward, supported by the rising 200-day benchmark; this frames the present move as a sharp countertrend retracement within the broader long-term advance. Resistance is concentrated at 7809.00 and the 7897.50-7906.25 prior-high zone.
View charts on: AlphaWebTrader HTF Charts
QQQ Daily View
Overall Rating
- Short-Term: Bearish
- Intermediate-Term: Bearish
- Long-Term: Neutral.
Key Insights Summary
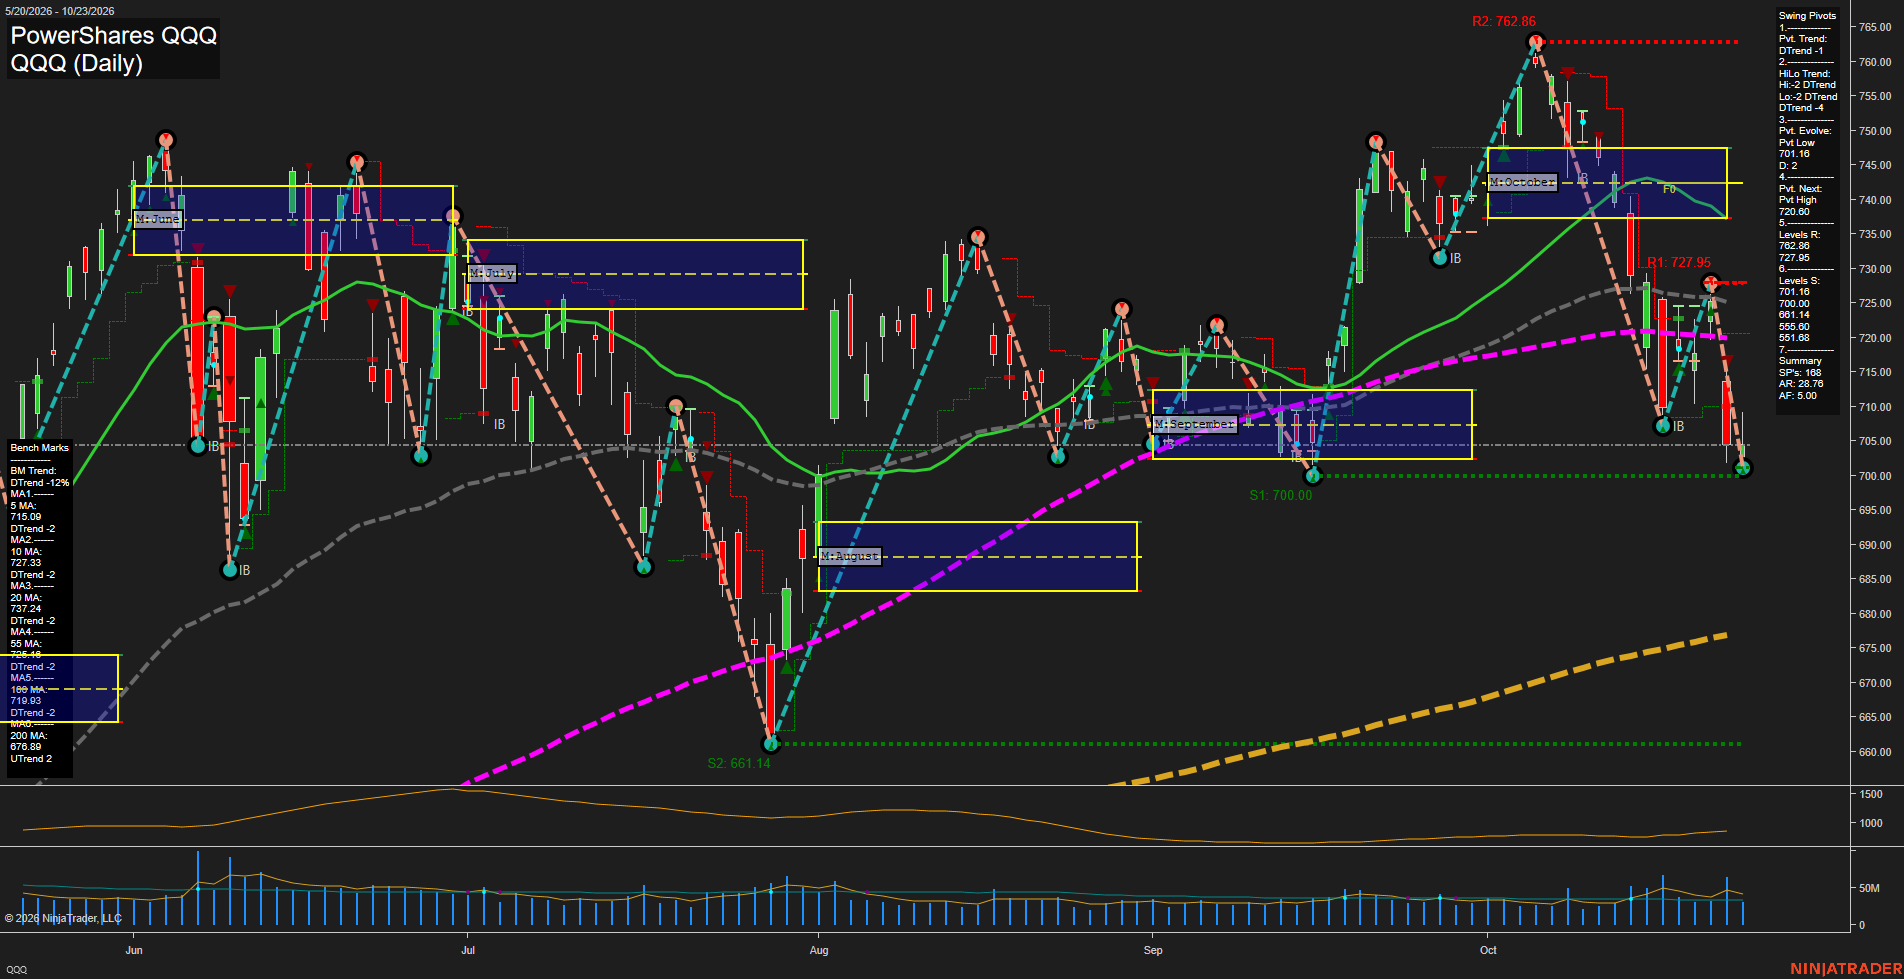
For a futures swing trader, QQQ reflects a sharp downside impulse from the October high near 765 into the 701 pivot-low area. Short-term and intermediate pivot structures are both in DTrend, while price is below every benchmark through the 100-day average. The 701.16 area is the immediate structural support; 727.95 is the nearest overhead pivot resistance, followed by the 720.60 pivot-reversal threshold. Large daily ranges and a 28.76 ATR indicate an expanded-volatility, fast-momentum selloff. The rising 200-day average near 676.89 preserves longer-term underlying support, but current price action remains a countertrend decline beneath the October monthly grid.
View charts on: AlphaWebTrader HTF Charts
NQ Daily View
Overall Rating
- Short-Term: Bearish
- Intermediate-Term: Bearish
- Long-Term: Neutral.
Key Insights Summary
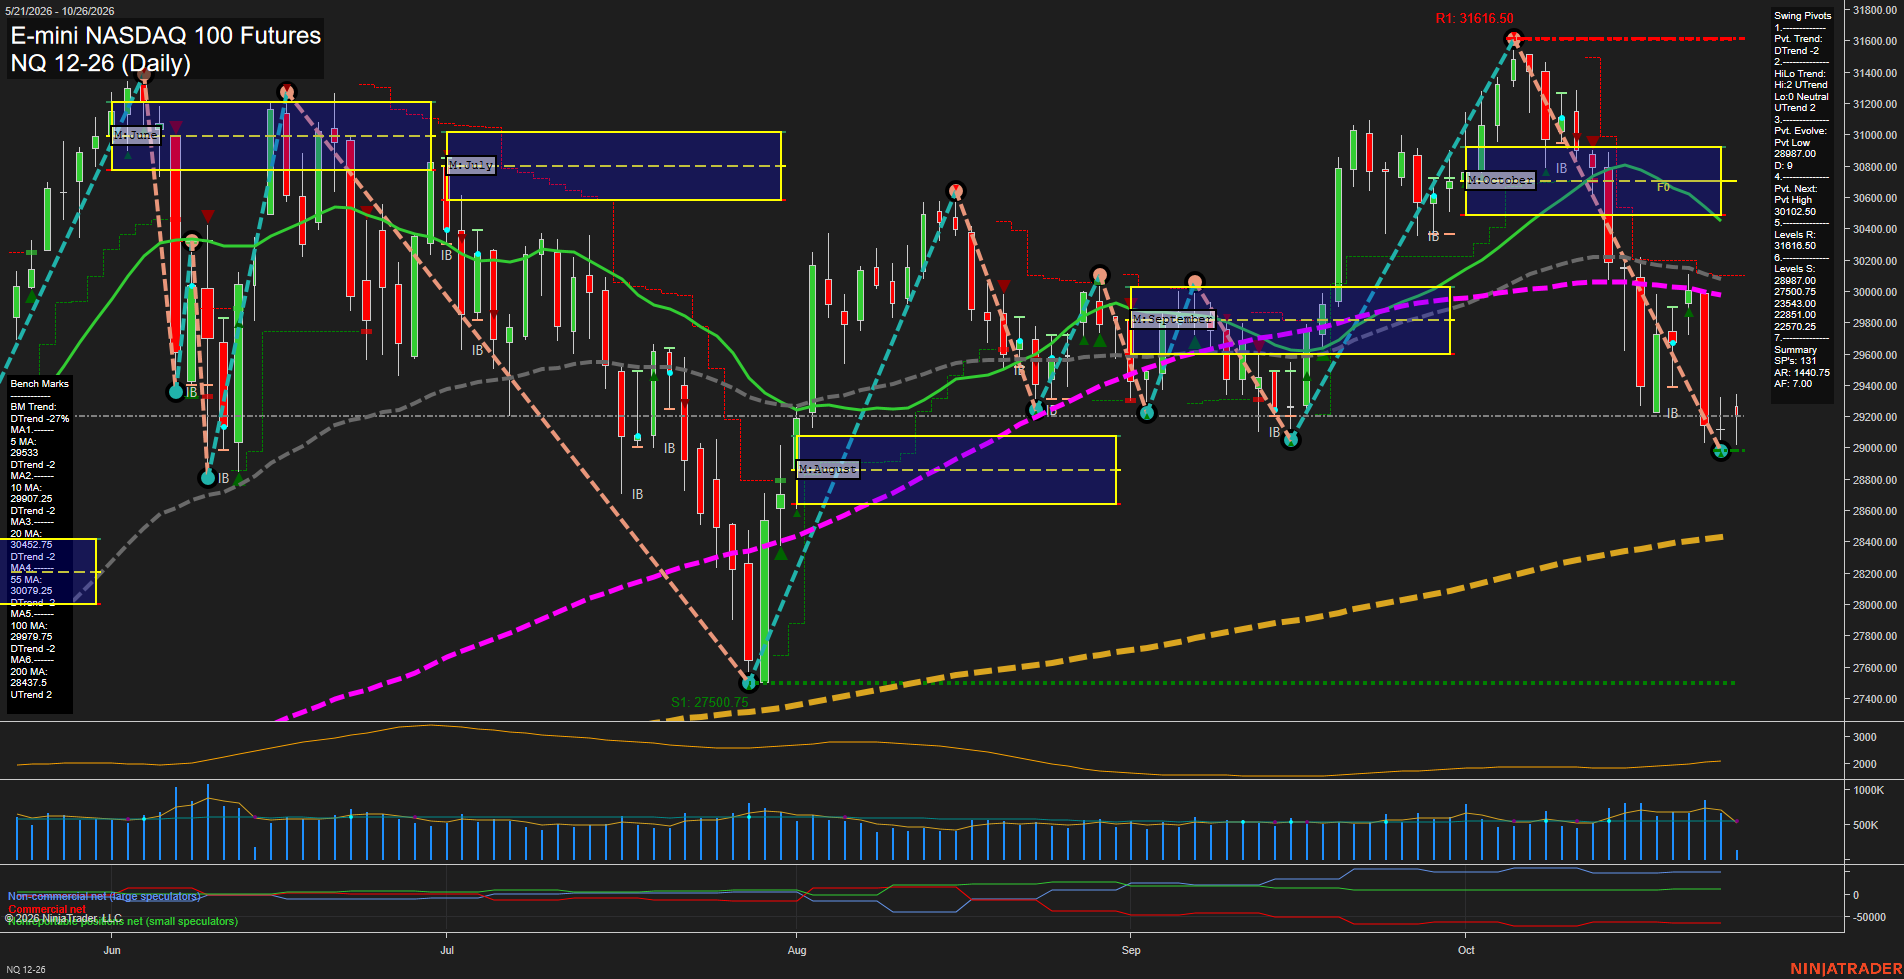
Price is rebounding from the 28987 swing-low area, but the daily pivot structure remains in a DTrend and price remains beneath the 5, 20, 55, and 100-day benchmarks. The October MSFG remains decisively below F0%, defining the decline from the 31618.50 pivot high as an intermediate-term pullback. The weekly and yearly grids retain upward bias, while the rising 200-day benchmark near 28437.5 preserves the longer-cycle bullish foundation. The 30102.50 pivot-next level and clustered 55-to-100-day averages form the principal overhead retracement zone; 28987.00 is the immediate swing support defining the current rebound attempt.
View charts on: AlphaWebTrader HTF Charts
USO Daily View
Overall Rating
- Short-Term: Bullish
- Intermediate-Term: Bullish
- Long-Term: Bullish.
Key Insights Summary
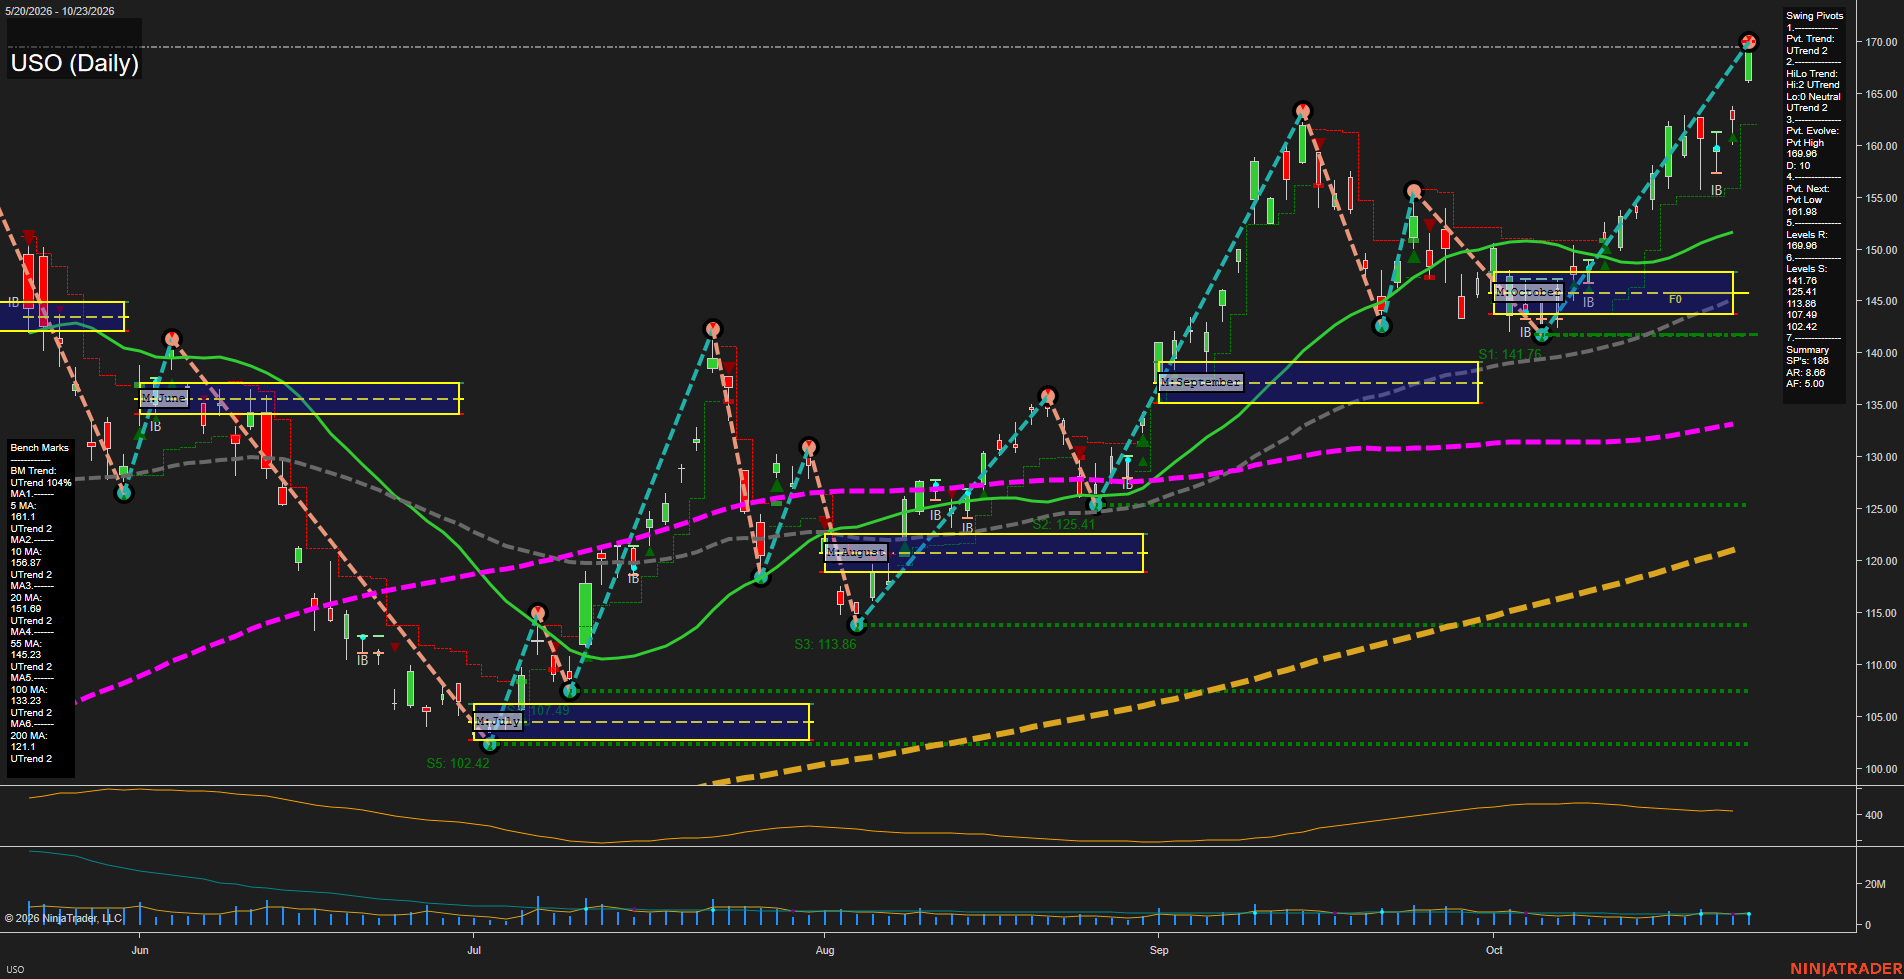
USO remains in a broad futures-style swing advance, with price holding above every benchmark average and the moving-average structure positively aligned from 5-day through 200-day. The recent advance has carried price toward the 169.98 pivot-high resistance area after a sequence of higher highs and higher lows. Short-term momentum is fast, while the current pullback from the recent high is contained near the 5-day average and the 161.98 pivot-reversal level. The October monthly grid is beneath current price, reinforcing an intermediate-term upside bias; 154.61 is the nearest meaningful structural support beneath the current swing range.
View charts on: AlphaWebTrader HTF Charts
CL Daily View
Overall Rating
- Short-Term: Bullish
- Intermediate-Term: Bullish
- Long-Term: Bullish.
Key Insights Summary
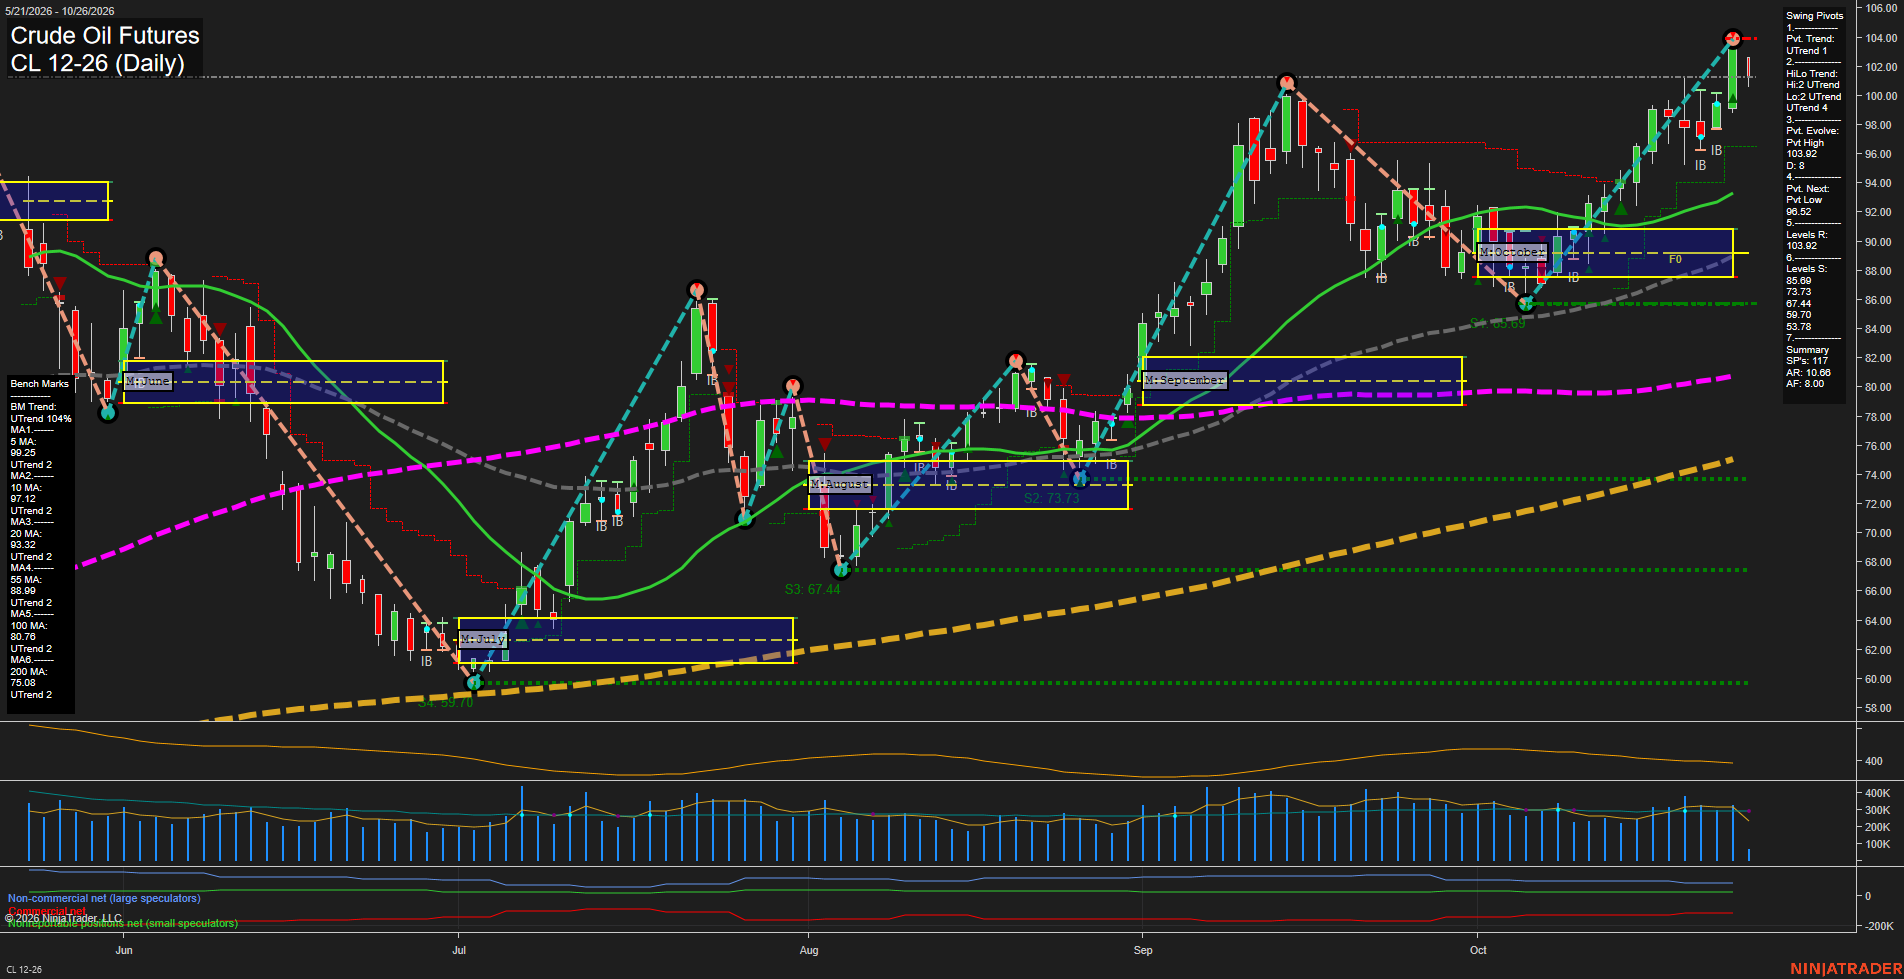
Crude oil remains in a broadly aligned daily upswing, with price holding above every benchmark moving average and both pivot structures confirming higher-high and higher-low behavior. The latest large red daily bar reflects a sharp rejection from the 103.92 pivot-high resistance area, creating a short-term countertrend pullback within the larger advance. The 99.25 to 97.12 short-term moving-average zone and the 96.52 next-pivot level define the nearest structural retracement area, while a recovery through 103.92 would re-establish breakout momentum. Monthly and yearly fib-grid positioning remain above their central reference areas, supporting the intermediate and long-term bullish trend backdrop.
View charts on: AlphaWebTrader HTF Charts
GLD Daily View
Overall Rating
- Short-Term: Bearish
- Intermediate-Term: Bearish
- Long-Term: Bearish.
Key Insights Summary
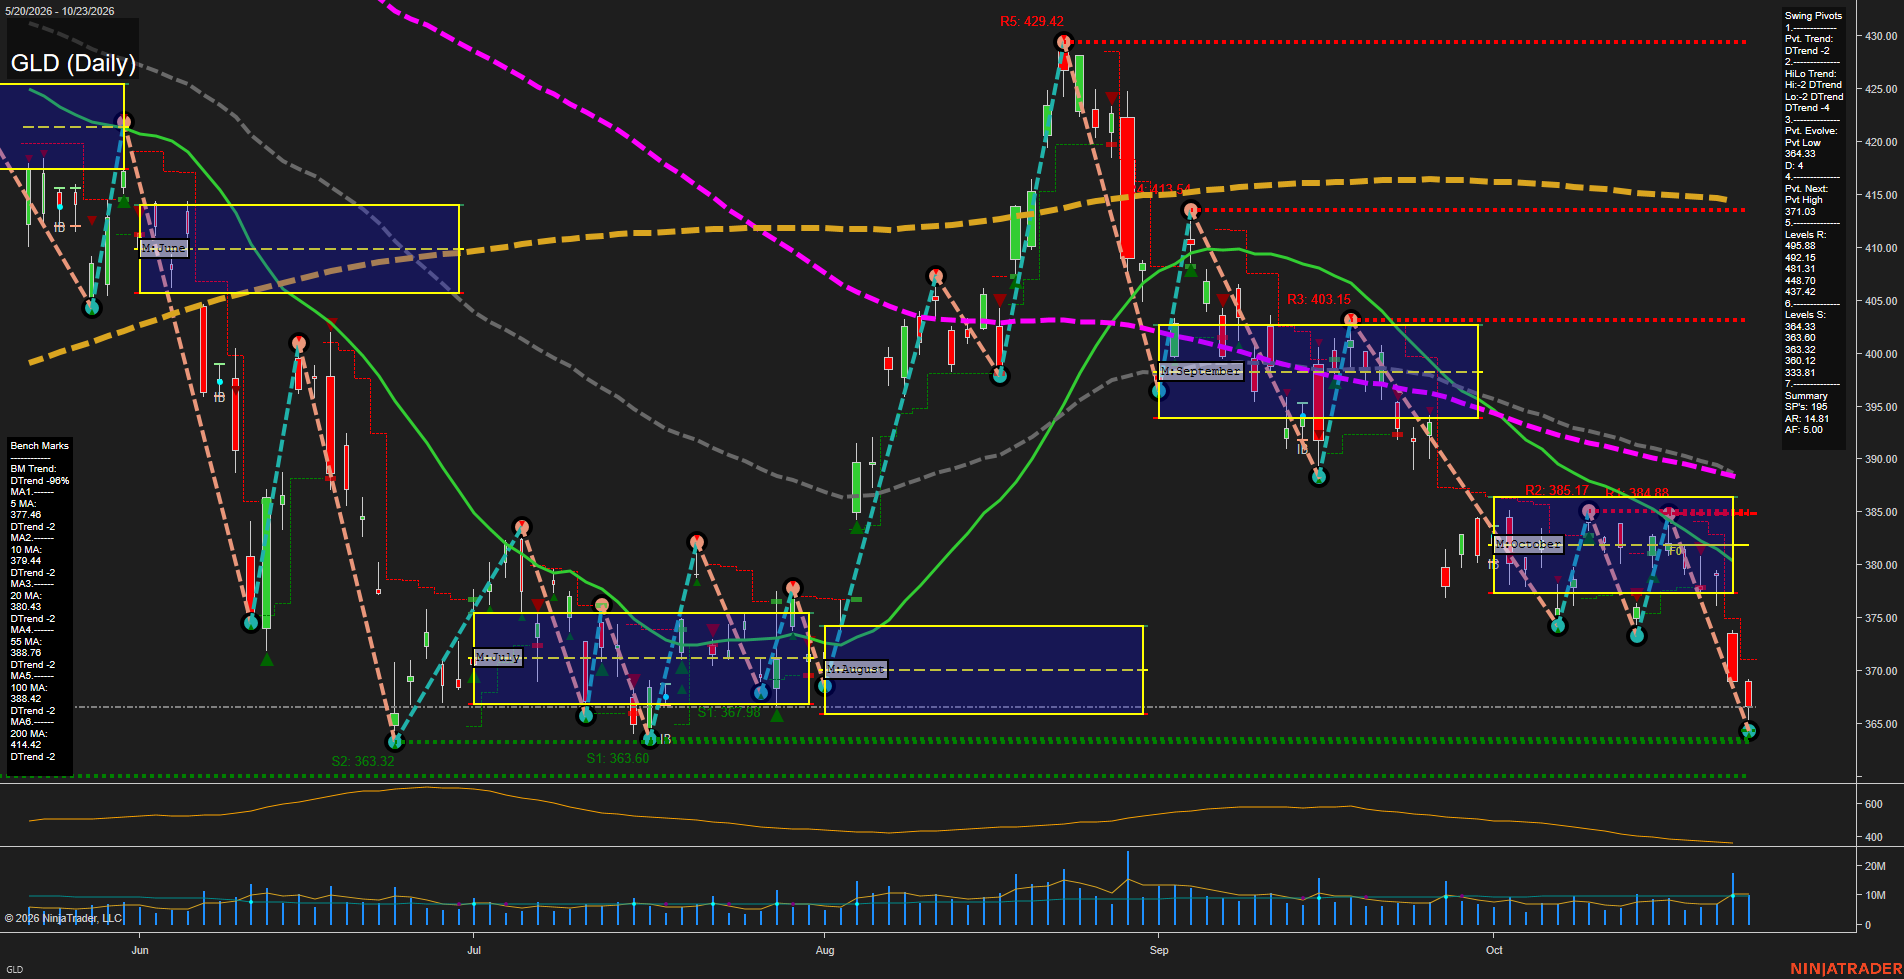
GLD reflects a broad futures-style liquidation phase: price has broken beneath the October monthly NTZ and all daily benchmark averages, while both pivot structures remain in DTrend alignment. The decline is accelerating with large bars and fast downside momentum, producing a fresh pivot low at 364.33 near clustered support at 363.60 to 360.12. The 371.03 pivot-reversal threshold is the nearest short-term structural reference overhead, followed by the declining 5-day and 10-day averages near 377.48 and 379.44. The broader structure remains defined by lower highs from the 429.42 peak and lower lows into late October, with the 200-day average at 414.42 emphasizing the extent of the long-term trend deterioration.
View charts on: AlphaWebTrader HTF Charts
GC Daily View
Overall Rating
- Short-Term: Bearish
- Intermediate-Term: Bearish
- Long-Term: Bearish.
Key Insights Summary
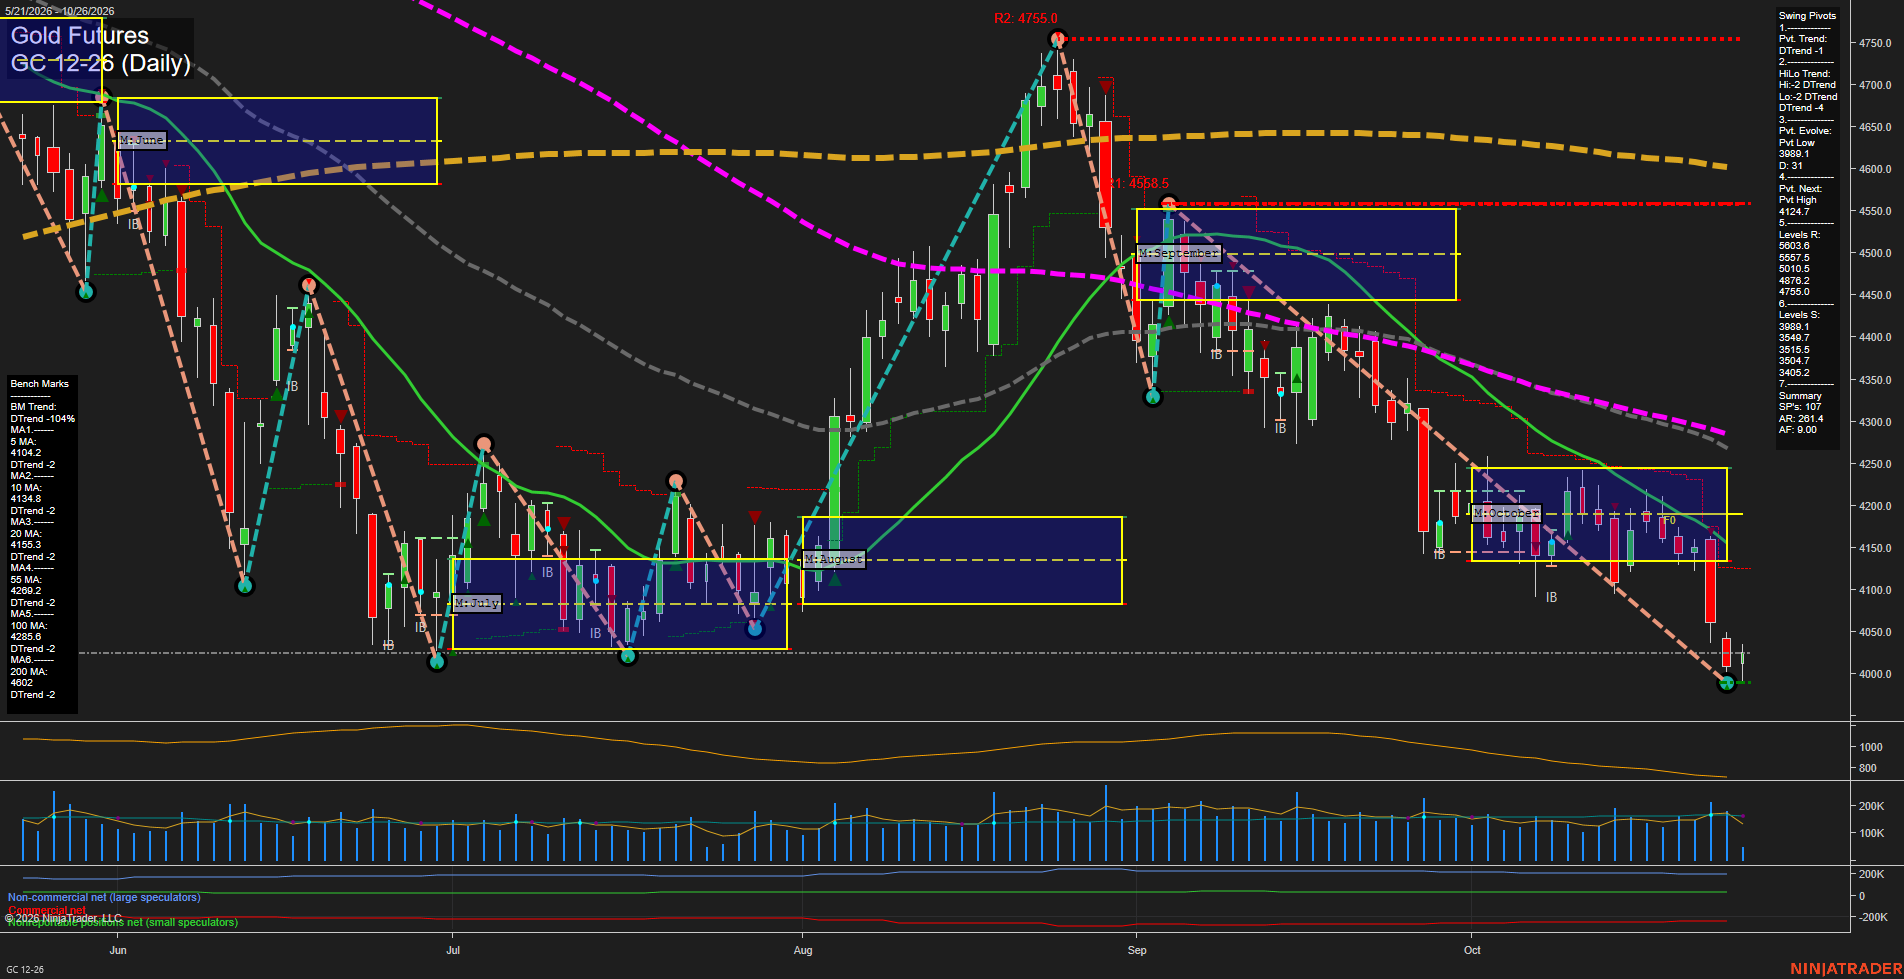
Gold futures remain in a broad bearish swing structure following the rejection from the 4755 pivot high. Fast downside momentum has driven price beneath every benchmark average and below the October MSFG balance area. The current low pivot at 3998.1 is being tested, while 4124.7 defines the next short-term pivot reversal threshold. The weekly grid remains marginally positive, indicating a countertrend condition inside a larger monthly and yearly decline; however, the sequence of lower highs, lower lows, and declining moving averages continues to define the dominant trend.
View charts on: AlphaWebTrader HTF Charts
ZB Daily View
Overall Rating
- Short-Term: Bullish
- Intermediate-Term: Bullish
- Long-Term: Bearish.
Key Insights Summary
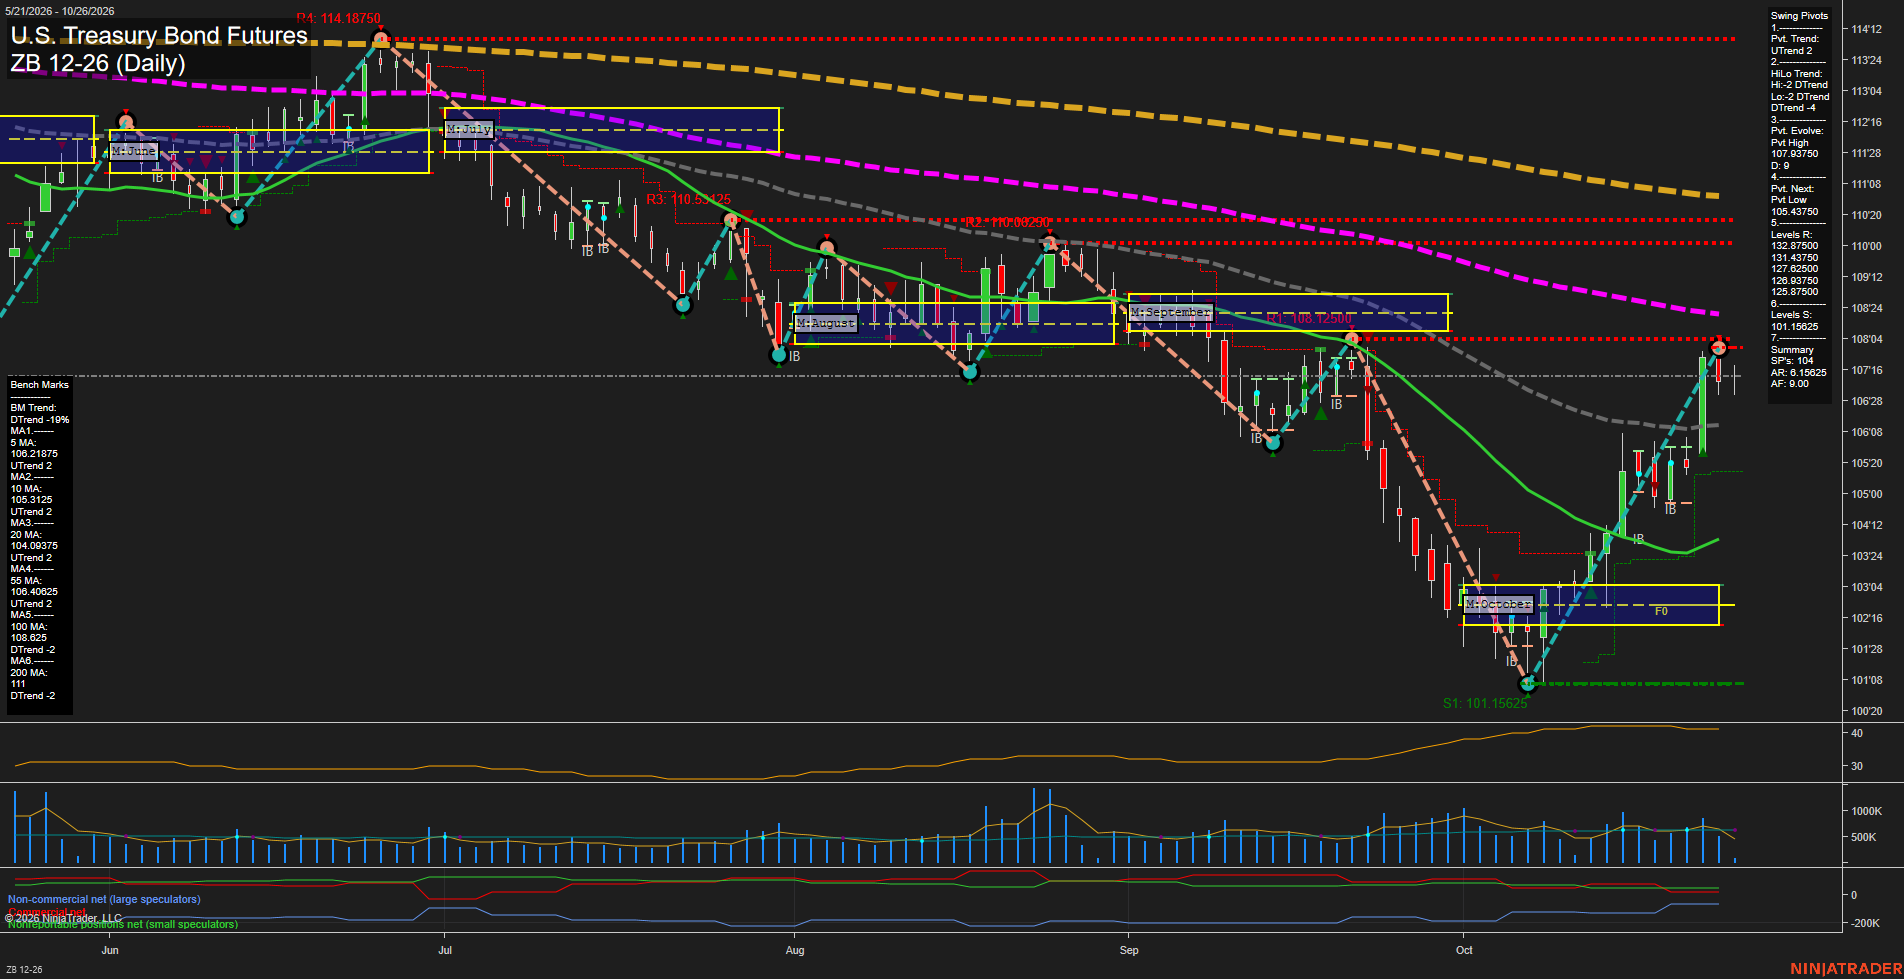
The daily structure shows a strong short-term recovery from the October 101.15625 swing low, with price above the weekly and monthly F0% areas and above all short-to-intermediate benchmark averages. The UTrend pivot condition and rising 5-, 10-, 20-, and 55-day averages confirm positive near-term momentum, although the latest small bars beneath the 107.93750 pivot high indicate consolidation after a fast advance. Intermediate structure has improved materially but remains countertrend relative to the broader HiLo DTrend. Long-term conditions remain bearish because price is below declining 100- and 200-day benchmarks and the annual fib-grid bias remains below F0%.
View charts on: AlphaWebTrader HTF Charts
Sentiment Summary: Coverage leans positive (35% positive versus 19% negative), but neutral reports dominate at 46%, with cloud growth, AI demand and Verizon’s raised outlook supporting sentiment. U.S. futures steadied or recovered modestly on October 26 after last week’s tech selloff, while AI financing constraints and heavy capital spending remained key counterweights to earnings optimism. Alphabet’s October 28 report and Amazon’s October 29 after-close release remain ahead, alongside this week’s Fed decision, with rates widely expected to hold following September’s hike despite persistent inflation.
Conclusion: Concentrated mega-cap earnings exposure and unresolved AI funding concerns frame the index-futures backdrop.