
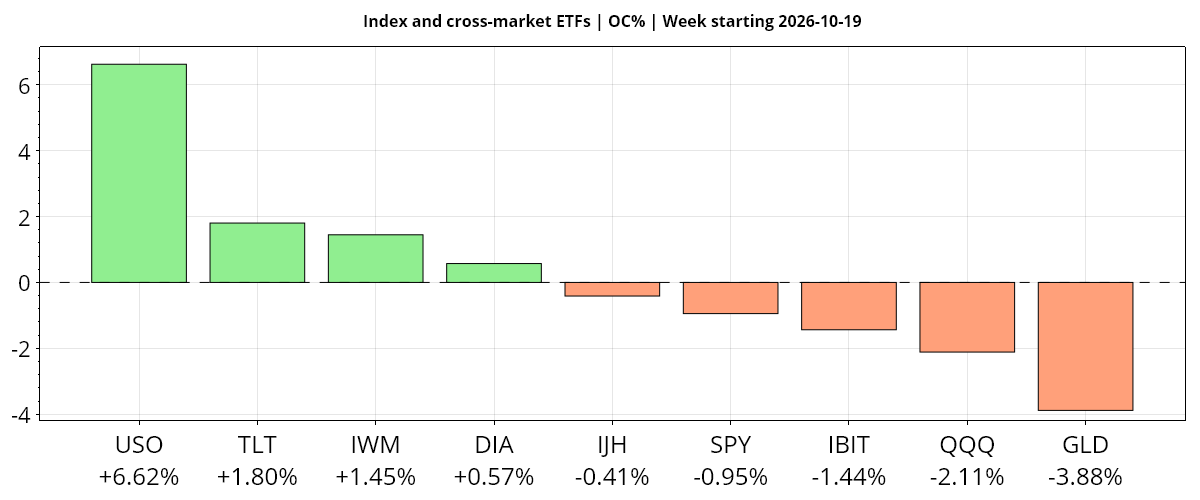
Markets ended a volatile week divided as AI earnings optimism gave way to renewed financing concerns, while Middle East supply disruptions lifted oil and intensified inflation worries. SPY fell 0.43% and QQQ lost 0.76%, but small caps outperformed, with IWM up 1.96% and DIA gaining 0.44%. USO rose 4.80%, far-term Treasuries gained 1.61%, and gold fell 4.03%.
Fundamentals: Stocks and technology ended the week lower as AI funding concerns outweighed a midweek earnings-led rally. Oil rose amid attacks on Middle East shipping and infrastructure, while gold fell and bonds gained over the week despite Friday’s decline. September producer prices exceeded forecasts, and final October consumer sentiment hit a five-month low. The October 28 Fed decision remained ahead, as did GDP, income and spending releases.
Technicals: S&P 500 and Nasdaq-100 ETFs finished the week with bearish ratings, falling 0.43% and 0.76%, respectively. Small caps outperformed, gaining 1.96% with a bullish rating. Tesla rose 4.93%, while Meta and Alphabet fell 9.40% and 5.98%. Across assets, the bullish oil fund gained 4.80%, the bearish gold fund lost 4.03%, and bullish far-term Treasury bonds rose 1.61%.
Weekly Market Recap: weekly ETF and stock performance, daily session commentary, economic releases, earnings and market news, with a whole-week summary.
As of: October 24, 2026 01:25 CT
Earnings Radar Week Recap
Monitoring for earnings releases by the Magnificent 7, AI-tech-related firms, and major financial institutions.
| Date/Day | Impact | Company / Symbol | Time | EPS | Revenue | ||||||||
|---|---|---|---|---|---|---|---|---|---|---|---|---|---|
| 2026-10-20 – Tuesday | High | SpaceX (SPCX) | After close |
|
| ||||||||
| 2026-10-21 – Wednesday | Medium | International Business Machines (IBM) | After close |
|
| ||||||||
| 2026-10-21 – Wednesday | High | Meta Platforms (META) | After close |
|
| ||||||||
| 2026-10-21 – Wednesday | High | Tesla (TSLA) | After close |
|
|
For full details visit: Yahoo Earnings Calendar
EcoNews Radar U.S. Events Week Recap
| Date/Day | Impact | Event | Time | Actual | Forecast | Previous | Info |
|---|---|---|---|---|---|---|---|
| 2026-10-21 – Wednesday | Low | EIA Crude Oil Stocks Change | 10:30 | -3.06M | -0.80M | -8.56M | Measures weekly changes in commercial crude inventories, offering clues about petroleum supply and demand that traders monitor for energy-sector earnings and inflation pressures. |
| 2026-10-22 – Thursday | Medium | Initial Jobless Claims | 08:30 | 194K | 200K | 199K | Counts new applications for unemployment benefits, providing a timely gauge of layoffs that traders monitor for labor-market conditions and monetary-policy expectations. |
| 2026-10-22 – Thursday | Medium | 4-Week Bill Auction · $110B | 11:30 | 3.945% | — | 4% | Reports the yield and demand for short-term government funding; traders monitor auction pricing for signals about cash-market conditions and near-term interest-rate expectations. |
| 2026-10-22 – Thursday | Medium | 8-Week Bill Auction · $105B | 11:30 | — | — | — | Shows pricing and investor demand for short-dated Treasury debt, helping traders assess money-market conditions and the expected path of policy rates. |
| 2026-10-22 – Thursday | High | 5-Year TIPS Auction · $26B | 13:00 | 2.367% | — | 1.955% | Reveals real yields and demand for inflation-protected government debt, which traders monitor for equity valuation pressures and, alongside nominal yields, inflation compensation. |
| 2026-10-22 – Thursday | Medium | 10-Day Bill Auction · $25B | 13:00 | — | — | — | Shows the cost and demand for very short-term government borrowing, offering traders insight into immediate liquidity conditions and cash-market pricing. |
| 2026-10-23 – Friday | High | S&P Global Manufacturing PMI | 09:45 | 56 | 55.6 | 55.9 | Surveys factory business conditions, including output, orders and employment; traders monitor it for growth momentum, corporate earnings prospects and price pressures. |
| 2026-10-23 – Friday | High | S&P Global Services PMI | 09:45 | 57.9 | 57.9 | 58.8 | Surveys service-sector business activity, providing insight into a large share of economic output that traders monitor for growth, earnings and monetary-policy implications. |
| 2026-10-23 – Friday | Medium | S&P Global Composite PMI | 09:45 | 57.6 | — | 58.4 | Combines manufacturing and services survey activity into a broad business-cycle gauge, helping traders assess overall growth momentum and its implications for earnings and interest rates. |
| 2026-10-23 – Friday | Medium | Michigan Consumer Sentiment Index | 10:00 | 48 | 46.3 | 46.3 | Gauges households’ views of personal finances and economic conditions, which traders monitor for clues about consumer spending and the outlook for corporate revenues. |
| 2026-10-23 – Friday | Medium | UoM 1-year Consumer Inflation Expectations | 10:00 | 4.7 | 4.7 | 4.7 | Measures households’ expected inflation over the coming year, which traders monitor for potential spending behavior, wage pressures and monetary-policy implications. |
| 2026-10-23 – Friday | Medium | Michigan Consumer Expectations Index | 10:00 | 48.8 | — | 47.3 | Measures households’ outlook for finances, business conditions and employment, offering traders a forward-looking signal of consumer demand and economic confidence. |
| 2026-10-23 – Friday | Medium | UoM 5-year Consumer Inflation Expectation | 10:00 | 3.5 | 3.5 | 3.5 | Measures households’ longer-term inflation outlook, helping traders assess whether expectations remain anchored and what that could imply for monetary policy and bond yields. |
Summary: The calendar centers on U.S. growth, household attitudes, inflation expectations and government funding conditions.
For full details visit: Forex Factory EcoNews
Market Technical Analysis
Analysis of completed-week VIX volatility, major ETFs and mega-cap tech stocks, futures snapshots, higher-time-frame analysis and weekly charts.
VIX — Market Fear Gauge Weekly
| Level | Open | High | MaxVix | Low | MinVix | WNC% | WOC% | VR | MaxVR | MinVR |
|---|---|---|---|---|---|---|---|---|---|---|
| 19.45 | 18.37 | 20.66 | 22.31 | 16.51 | 13.80 | -2.70% | +5.88% | -6.29 | 17.64 | -19.11 |
VIX fell 2.70% versus the previous weekly close. Open-to-close change: 5.88%. VIX is 66.4% up the recent 12-week range (13.80–22.31), in the 60–70% band.
VR: Weekly VR: SPY and VIX moved in the same direction. VR is in the lower part of its preceding 12-week VR range (-19.11 to 17.64), in the 30–40% band. VR fell 23.92 points from the previous week, a large shift relative to that range.
Range lookback: preceding 12 completed weeks.
Major ETFs and Mega Cap Tech Stocks Weekly
ETF, Mag7, and Cross-Market ETF Weekly Insights
Overall Tone
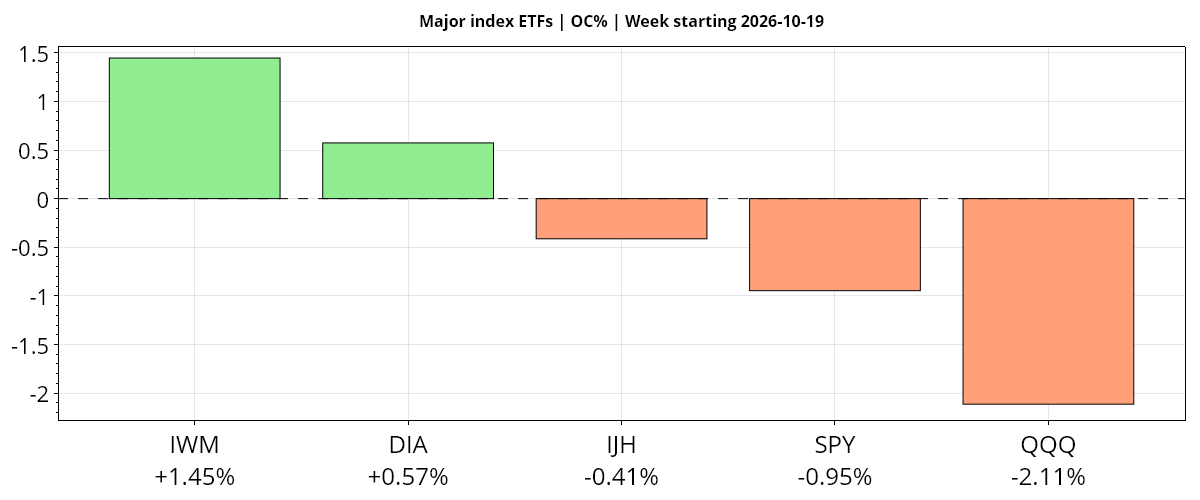
For the completed week beginning 2026-10-19, most assets declined from the week open, indicating a selective, uneven risk tone rather than broad strength.
| Instrument | Bias | Date | WNC% | WOC% | O | H | L | C | VWAP | Vol | Mon | Tue | Wed | Thu | Fri |
|---|---|---|---|---|---|---|---|---|---|---|---|---|---|---|---|
| ▲ IWM | ▲ ▲ ▲ | 2026-10-19 | ▲ +1.96% | ▲ +1.45% | 271.82 | 277.70 | 270.71 | 275.75 | ▲ 274.90 | 108,507,763 | +0.31% | +1.66% | +0.25% | +0.07% | -0.33% |
| ▲ DIA | ▲ ▲ ▼ | 2026-10-19 | ▲ +0.44% | ▲ +0.57% | 518.40 | 528.45 | 517.75 | 521.37 | ▼ 523.48 | 14,382,546 | -0.03% | +1.05% | +0.64% | +0.04% | -1.24% |
| ▲ IJH | ▲ ▼ ▼ | 2026-10-19 | ▲ +0.03% | ▼ -0.41% | 72.67 | 73.67 | 71.87 | 72.37 | ▼ 72.74 | 36,715,936 | +0.04% | +0.98% | +0.41% | -0.80% | -0.59% |
| ▼ SPY | ▼ ▼ ▼ | 2026-10-19 | ▼ -0.43% | ▼ -0.95% | 767.23 | 774.44 | 758.68 | 759.97 | ▼ 766.37 | 193,173,852 | +0.42% | +0.34% | +0.53% | -1.18% | -0.52% |
| ▼ QQQ | ▼ ▼ ▼ | 2026-10-19 | ▼ -0.76% | ▼ -2.11% | 719.61 | 727.95 | 701.16 | 704.40 | ▼ 713.95 | 195,205,871 | +1.21% | -0.10% | +1.05% | -2.86% | -0.01% |
| AVG/Sum | — | — | +0.25% | -0.29% | — | — | — | — | — | 547,985,968 | +0.39% | +0.78% | +0.58% | -0.95% | -0.54% |
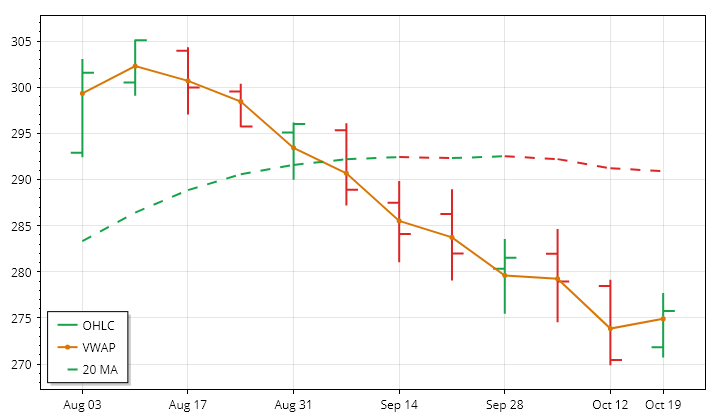
IWM · Weekly · 2026-10-19 | WNC% ▲ +1.96% WOC% ▲ +1.45%
IWM – Small Cap Technicals Summary
IWM’s completed week beginning 19 October 2026 closed at 275.75, gaining 1.96% from the prior weekly close and 1.45% from the open. The opening gap up remained unfilled, and the finish above weekly VWAP supported the positive weekly result. However, the entire week stayed within the previous week’s range, so the advance remained contained rather than establishing a broader price breakout.
The rebound contrasted with the near-term downtrend and the declining price tendency across the preceding 12 completed weeks. Intermediate-term positioning remained mixed because price was below a rising benchmark, while the far-term uptrend persisted. The latest range was below average despite expanding ranges over the lookback; volume was essentially average against an increasing volume trend. PSAR and the ATR-median measure remained bearish despite the gain. A next-week high above 282.7728 would conditionally trigger a PSAR buy reversal.
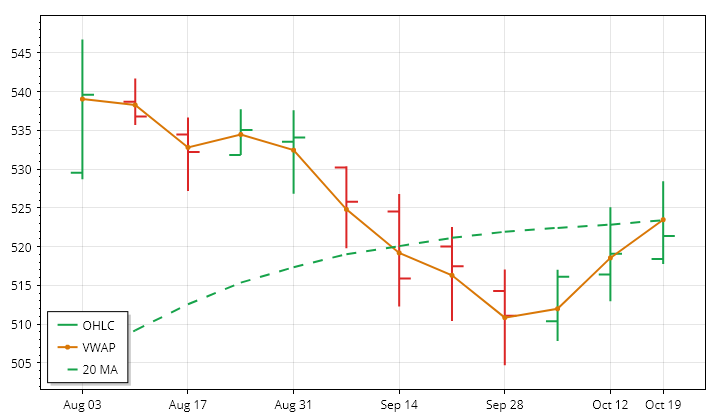
DIA · Weekly · 2026-10-19 | WNC% ▲ +0.44% WOC% ▲ +0.57%
DIA – Dow Jones Technicals Summary
DIA’s completed week beginning 19 October 2026 closed at 521.37, up 0.44% from the prior weekly close and 0.57% from the open. It recovered an opening gap down and formed a higher high and higher low, yet finished within the previous week’s range. The close also remained below weekly VWAP, tempering the positive return with a less convincing position relative to the week’s trading activity.
The gain did not resolve the broader conflict. Price stood above a falling near-term benchmark, while intermediate- and far-term averages continued rising beneath it. Across the preceding 12 completed weeks, the price trend was downward and net directional progress was negligible, indicating substantial back-and-forth movement. The latest range was slightly below average and volume was subdued, consistent with the lookback’s contraction and declining volume. PSAR was long, but the ATR-median trend remained bearish; a next-week low below 504.7 would conditionally reverse PSAR.
IJH · Weekly · 2026-10-19 | WNC% ▲ +0.03% WOC% ▼ -0.41%
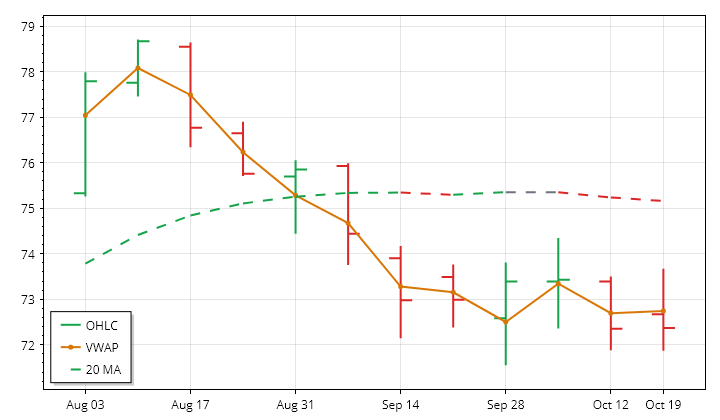
IJH – Mid Cap Technicals Summary
IJH’s completed week beginning 19 October 2026 finished at 72.37, effectively unchanged with a 0.03% gain from the prior weekly close, but down 0.41% from the open. The opening gap up was filled, and an outside bar ultimately closed inside the previous week’s range. Finishing below weekly VWAP showed that the marginal weekly gain did not translate into a strong closing position.
Near- and far-term downtrends remained aligned with the downward price tendency across the preceding 12 completed weeks. The intermediate-term picture was mixed: its benchmark was rising, but price remained below it. The latest range was slightly below average, consistent with contracting lookback ranges, while above-average volume accompanied the broader increase in participation. That additional activity produced little net weekly progress. PSAR and the ATR-median trend remained bearish; a next-week high above 73.9121 would conditionally trigger a PSAR buy reversal.
SPY · Weekly · 2026-10-19 | WNC% ▼ -0.43% WOC% ▼ -0.95%
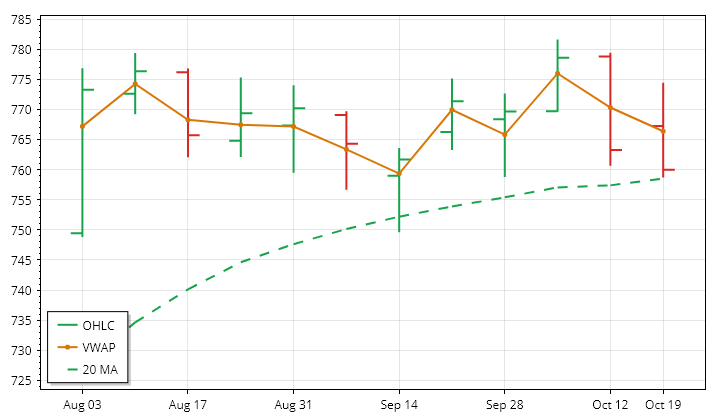
SPY – S&P 500 Technicals Summary
SPY’s completed week beginning 19 October 2026 closed at 759.97, down 0.43% from the prior weekly close and 0.95% from the open after its opening gap up was filled. A lower high and lower low ended below the previous week’s low and near the latest low. The finish below weekly VWAP reinforced the weak weekly result.
Price remained below a rising near-term benchmark but above rising intermediate- and far-term benchmarks. This left shorter-term weakness within a broader upward structure, while the preceding 12 completed weeks showed only modest upward price progress. The latest range was slightly above average, contrasting with contracting lookback ranges; below-average volume followed the broader decline in participation. PSAR and the ATR-median trend remained bullish. However, the close was near the PSAR threshold: a next-week low below 758.68 would trigger a sell reversal, which was not yet confirmed.
QQQ · Weekly · 2026-10-19 | WNC% ▼ -0.76% WOC% ▼ -2.11%
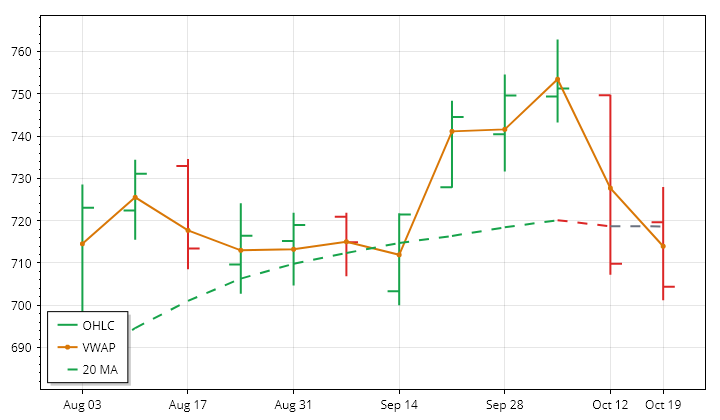
QQQ – Nasdaq 100 Technicals Summary
QQQ’s completed week beginning 19 October 2026 closed at 704.4, losing 0.76% versus the prior weekly close and 2.11% from the open after surrendering an opening gap up. Lower highs and lows culminated in a close below the preceding week’s low and near the latest low. Price also finished below weekly VWAP and in the first lower volatility-band zone, reinforcing the weak closing structure.
Near-term positioning remained mixed because price was below a rising benchmark, while intermediate- and far-term uptrends persisted. The latest decline thus conflicted with the modest upward price tendency across the preceding 12 completed weeks. A second consecutive large-range week came with above-average volume, contrasting with the lookback’s contracting ranges and declining participation. PSAR remained bearish, whereas the ATR-median trend was still bullish. A next-week high above 759.775 would conditionally trigger a PSAR buy reversal.
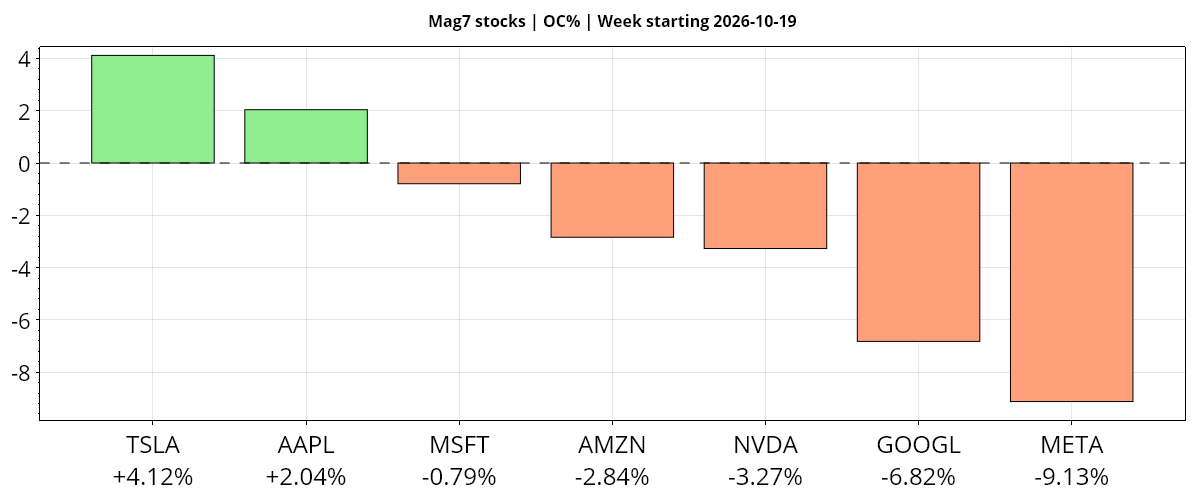
| Instrument | Bias | Date | WNC% | WOC% | O | H | L | C | VWAP | Vol | Mon | Tue | Wed | Thu | Fri |
|---|---|---|---|---|---|---|---|---|---|---|---|---|---|---|---|
| ▲ TSLA | ▲ ▲ ▼ | 2026-10-19 | ▲ +4.93% | ▲ +4.12% | 357.50 | 388.86 | 354.47 | 372.22 | ▼ 376.51 | 207,306,064 | +3.76% | +1.54% | +3.41% | -3.08% | -0.63% |
| ▲ AAPL | ▲ ▲ ▲ | 2026-10-19 | ▲ +1.24% | ▲ +2.04% | 340.77 | 351.73 | 338.70 | 347.73 | ▲ 344.46 | 193,576,448 | -0.15% | -1.00% | +1.32% | +1.23% | -0.14% |
| ▼ AMZN | ▼ ▼ ▼ | 2026-10-19 | ▼ -0.80% | ▼ -2.84% | 255.25 | 265.34 | 246.45 | 248.00 | ▼ 257.58 | 196,777,667 | +4.98% | +0.07% | -0.10% | -4.57% | -0.95% |
| ▼ MSFT | ▼ ▼ ▼ | 2026-10-19 | ▼ -0.86% | ▼ -0.79% | 528.70 | 535.57 | 515.70 | 524.51 | ▼ 528.40 | 81,503,241 | +0.84% | -0.31% | +0.20% | -2.23% | +0.66% |
| ▼ NVDA | ▼ ▼ ▼ | 2026-10-19 | ▼ -1.48% | ▼ -3.27% | 218.09 | 222.19 | 210.18 | 210.96 | ▼ 215.90 | 471,543,815 | +1.38% | -0.29% | +2.54% | -4.40% | -0.59% |
| ▼ GOOGL | ▼ ▼ ▼ | 2026-10-19 | ▼ -5.98% | ▼ -6.82% | 343.67 | 346.58 | 320.18 | 320.21 | ▼ 332.98 | 113,287,838 | +1.05% | -1.13% | -1.62% | -3.15% | -1.24% |
| ▼ META | ▼ ▼ ▼ | 2026-10-19 | ▼ -9.40% | ▼ -9.13% | 707.16 | 713.22 | 633.27 | 642.62 | ▼ 676.28 | 118,028,133 | -0.55% | -1.59% | +0.47% | -6.98% | -0.96% |
| AVG/Sum | — | — | -1.76% | -2.39% | — | — | — | — | — | 1,382,023,206 | +1.62% | -0.39% | +0.89% | -3.31% | -0.55% |
Mag7 Stocks
Negative confluence: average WOC% -2.38% from the week open, WNC% -1.76% versus the prior weekly close. Only TSLA and AAPL gained on both comparisons; TSLA led from the open despite closing below VWAP, while META lagged at -9.13% from the open and -9.40% versus the prior weekly close. AAPL retained aligned uptrends across horizons.
TSLA · Weekly · 2026-10-19 | WNC% ▲ +4.93% WOC% ▲ +4.12%
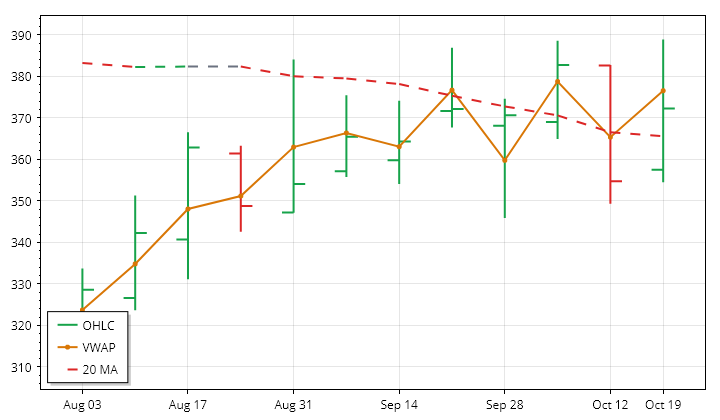
TSLA – Tesla Technicals Summary
TSLA’s completed week beginning 19 October 2026 closed at 372.22, advancing 4.93% from the prior weekly close and 4.12% from the open. Its opening gap up was filled before the stronger finish. A higher high and higher low improved the weekly structure, although the close remained inside the previous week’s range. Price also finished below weekly VWAP, tempering the otherwise positive return.
Near- and far-term uptrends aligned with the upward price tendency across the preceding 12 completed weeks, but the intermediate-term trend remained downward, leaving the broader structure divided. The latest range was roughly 34% above average, the second consecutive large-range week, consistent with expanding lookback ranges. Above-average volume contrasted with the broader decline in participation. PSAR and the ATR-median trend remained bullish. A next-week low below 349.33 would conditionally trigger a PSAR sell reversal rather than represent an already confirmed change.
AAPL · Weekly · 2026-10-19 | WNC% ▲ +1.24% WOC% ▲ +2.04%
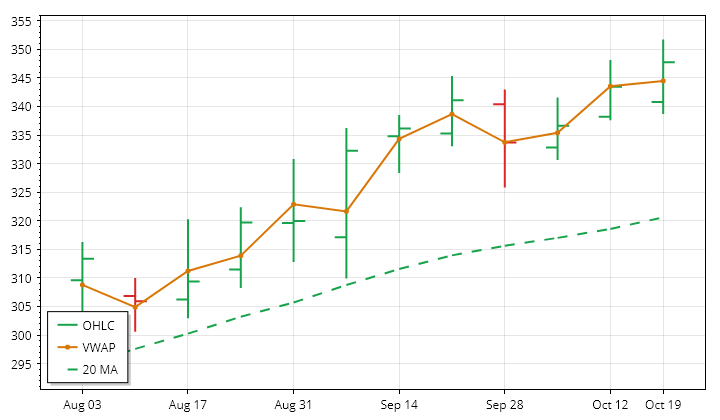
AAPL – Apple Technicals Summary
AAPL’s completed week beginning 19 October 2026 recovered from an opening gap down and closed at 347.725, gaining 1.24% from the prior weekly close and 2.04% from the open. A higher high and higher low improved the weekly structure, but the close remained inside the previous week’s range. Finishing above weekly VWAP reinforced the positive result without establishing a breakout beyond that prior range.
Near-, intermediate- and far-term uptrends remained aligned, consistent with the rising price trend over the preceding 12 completed weeks. That advance was nevertheless uneven, with limited net progress relative to total price movement. The latest range and volume were below average, continuing the lookback’s contraction in ranges and declining participation. PSAR and the ATR-median measure remained bullish; a next-week low below 334.5684 would trigger a conditional PSAR sell reversal.
AMZN · Weekly · 2026-10-19 | WNC% ▼ -0.80% WOC% ▼ -2.84%
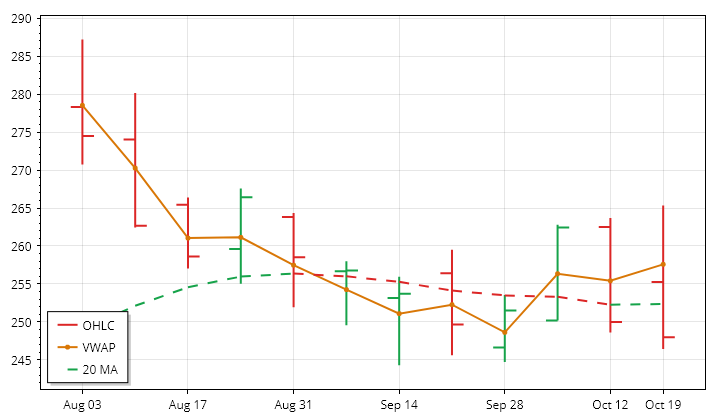
AMZN – Amazon Technicals Summary
AMZN’s completed week beginning 19 October 2026 reversed an opening gap up, closing at 248. The loss was 0.80% versus the prior weekly close but 2.84% from the open, showing a considerably larger retreat within the week. An outside bar breached both prior-week boundaries before closing below the previous low and near the week’s low. The finish below weekly VWAP reinforced that weak closing position.
This decline extended the 12-week downward price tendency, although the longer moving-average structure remained more constructive. Price was below a still-rising near-term benchmark, while intermediate- and far-term trends remained upward. The latest range expanded above average and volume was slightly above average, contrasting with contracting ranges and declining volume across the lookback. PSAR was in a short state and the ATR-median trend remained bearish. A next-week high above 287.2 would conditionally trigger a PSAR buy reversal.
MSFT · Weekly · 2026-10-19 | WNC% ▼ -0.86% WOC% ▼ -0.79%
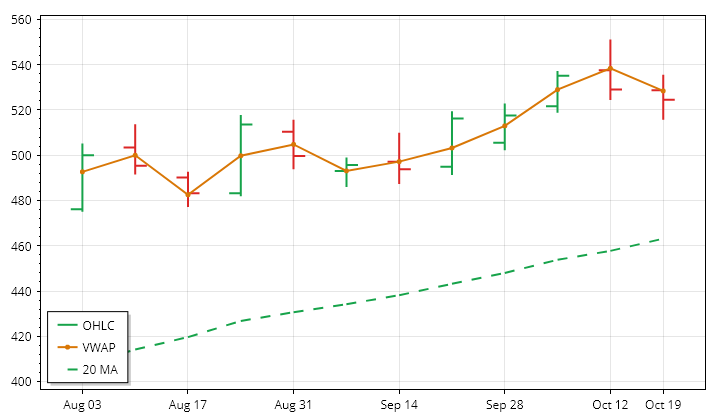
MSFT – Microsoft Technicals Summary
MSFT’s completed week beginning 19 October 2026 closed at 524.51, down 0.86% from the prior weekly close and 0.79% from the open. The small opening gap down was filled, but a lower high and lower low left the close inside the previous week’s range. Finishing below weekly VWAP added a modestly weak closing feature without changing the broader moving-average alignment.
Near-, intermediate- and far-term trends all remained upward, with price above rising benchmarks. The latest decline therefore contrasted with the preceding 12 completed weeks’ upward price trend rather than confirming a wider trend reversal. The range was below average and volume was especially light, at roughly 62% of average, continuing the lookback’s contracting ranges and falling participation. PSAR and the ATR-median trend remained bullish. A next-week low below 515.2575 would conditionally trigger a PSAR sell reversal.
NVDA · Weekly · 2026-10-19 | WNC% ▼ -1.48% WOC% ▼ -3.27%
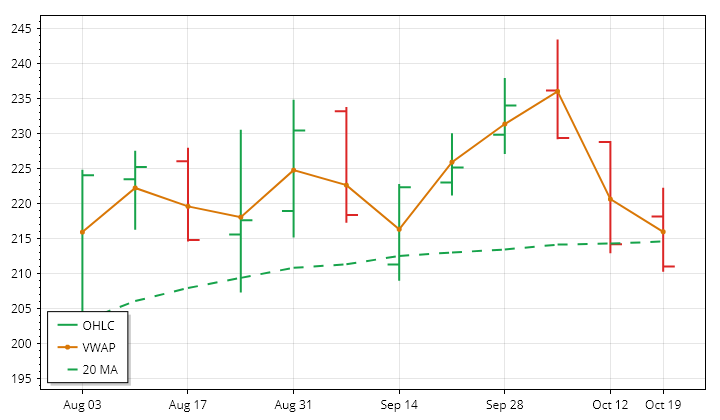
NVDA – Nvidia Technicals Summary
NVDA’s completed week beginning 19 October 2026 reversed an opening gap up and closed at 210.96. It fell 1.48% versus the prior weekly close and 3.27% from the open. A lower high and lower low ended with price below the previous week’s low and near the latest low. The close below weekly VWAP and in the first lower volatility-band zone strengthened the weak weekly finish.
The broader structure was uneven rather than uniformly bearish. Price remained above a rising intermediate-term benchmark, but below rising near- and far-term benchmarks. Across the preceding 12 completed weeks, the price trend was upward, although net progress was small relative to total movement. Below-average range and volume continued the lookback’s contraction and declining participation. PSAR was short while the ATR-median trend remained bullish. A next-week high above 243.37 would conditionally trigger a PSAR buy reversal.
GOOGL · Weekly · 2026-10-19 | WNC% ▼ -5.98% WOC% ▼ -6.82%
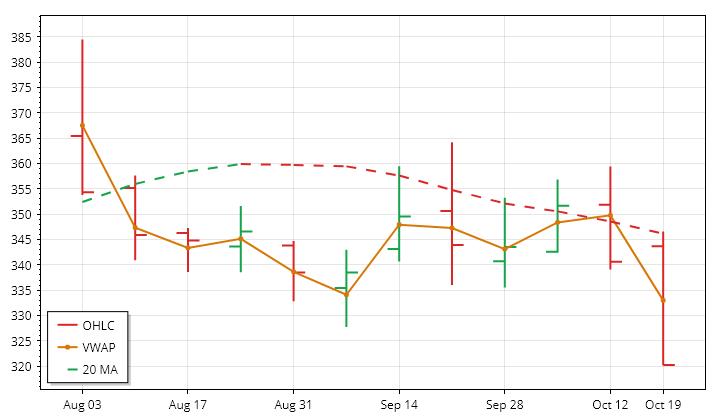
GOOGL – Alphabet Technicals Summary
GOOGL’s completed week beginning 19 October 2026 surrendered an opening gap up and closed at 320.21, down 5.98% versus the prior weekly close and 6.82% from the open. Lower highs and lows led to a finish below the preceding week’s low and near the latest low. The close was also below weekly VWAP and in the first lower volatility-band zone, reinforcing the week’s weak closing structure.
The move aligned with the near-term downtrend and the lookback’s downward price tendency. Intermediate-term positioning was mixed because price lay below a still-rising benchmark, while the far-term uptrend persisted. The range was roughly 38% above average, interrupting the preceding 12 weeks’ contracting-range pattern, but volume remained below average alongside its declining trend. PSAR stayed bearish and the ATR-median measure crossed bearish during this week. A next-week high above 369.0711 would conditionally trigger a PSAR buy reversal.
META · Weekly · 2026-10-19 | WNC% ▼ -9.40% WOC% ▼ -9.13%
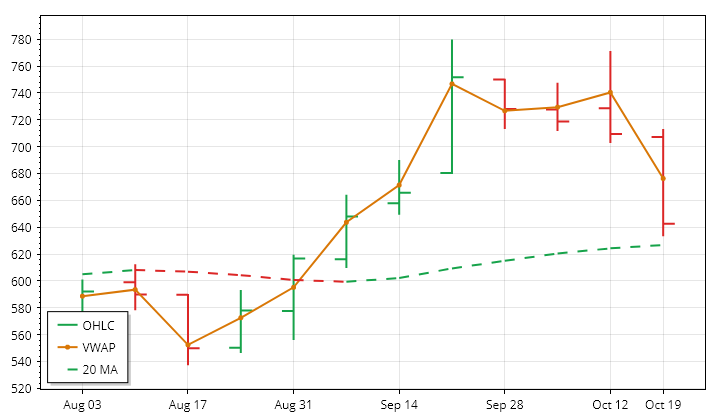
META – Meta Platforms Technicals Summary
META’s completed week beginning 19 October 2026 closed at 642.62, losing 9.40% from the prior weekly close and 9.13% from the open. A lower high and lower low produced a close below the previous week’s low and near the latest low. The finish below weekly VWAP and in the first lower volatility-band zone reinforced the severity of the retreat.
The selloff conflicted with the upward price trend across the preceding 12 completed weeks. Price dropped below its still-rising near-term benchmark, but remained above rising intermediate- and far-term benchmarks. The latest range was about 45% above average, marking a second consecutive large-range week despite slight lookback contraction. Above-average volume aligned with the broader increase in participation. Signals diverged: PSAR was short while the ATR-median trend remained bullish. A next-week high above 779.8192 would conditionally trigger a PSAR buy reversal.
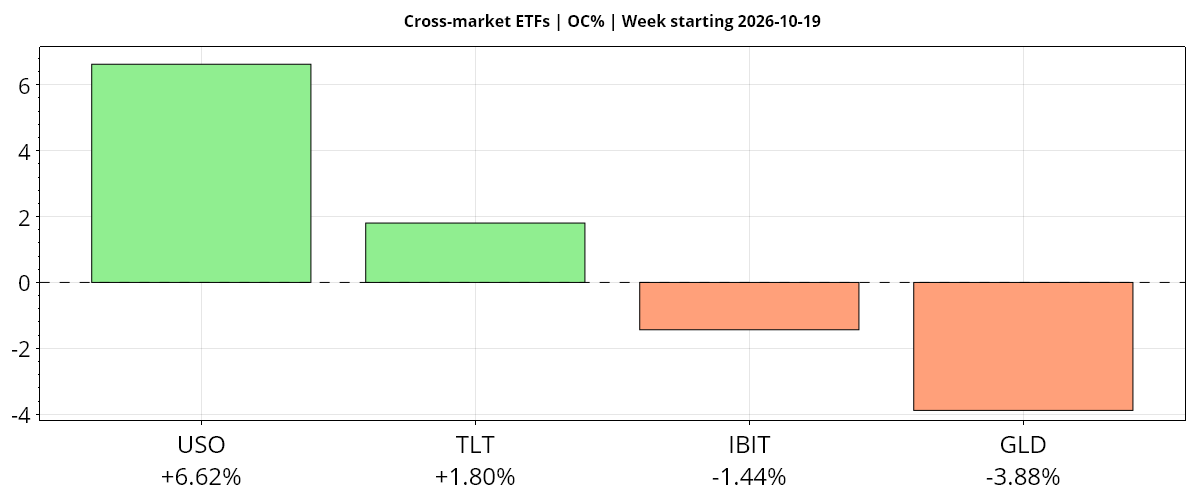
| Instrument | Bias | Date | WNC% | WOC% | O | H | L | C | VWAP | Vol | Mon | Tue | Wed | Thu | Fri |
|---|---|---|---|---|---|---|---|---|---|---|---|---|---|---|---|
| ▲ USO | ▲ ▲ ▲ | 2026-10-19 | ▲ +4.80% | ▲ +6.62% | 159.00 | 169.96 | 155.75 | 169.53 | ▲ 161.79 | 28,169,238 | -0.59% | -0.12% | -0.50% | +1.70% | +4.32% |
| ▲ TLT | ▲ ▲ ▲ | 2026-10-19 | ▲ +1.61% | ▲ +1.80% | 79.90 | 81.92 | 79.34 | 81.34 | ▲ 80.75 | 195,969,145 | -0.74% | +0.84% | +0.14% | +1.87% | -0.49% |
| ▼ IBIT | ▼ ▼ ▼ | 2026-10-19 | ▼ -0.41% | ▼ -1.44% | 46.63 | 48.07 | 45.71 | 45.96 | ▼ 46.71 | 187,561,532 | +0.33% | +0.89% | +2.42% | -3.72% | -0.22% |
| ▼ GLD | ▼ ▼ ▼ | 2026-10-19 | ▼ -4.03% | ▼ -3.88% | 381.43 | 381.93 | 364.33 | 366.61 | ▼ 372.87 | 45,683,347 | -0.61% | -0.54% | +0.34% | -2.63% | -0.65% |
| AVG/Sum | — | — | +0.49% | +0.78% | — | — | — | — | — | 457,383,262 | -0.40% | +0.27% | +0.60% | -0.70% | +0.74% |
Cross-Market ETFs
Positive confluence: average WOC% +0.78% from the week open, WNC% +0.49% versus the prior weekly close. Oil led and bonds gained on both comparisons, diverging from equity weakness; gold lagged and bitcoin declined. Oil retained aligned uptrends, whereas bonds’ weekly advance coexisted with longer-term downtrends.
USO · Weekly · 2026-10-19 | WNC% ▲ +4.80% WOC% ▲ +6.62%
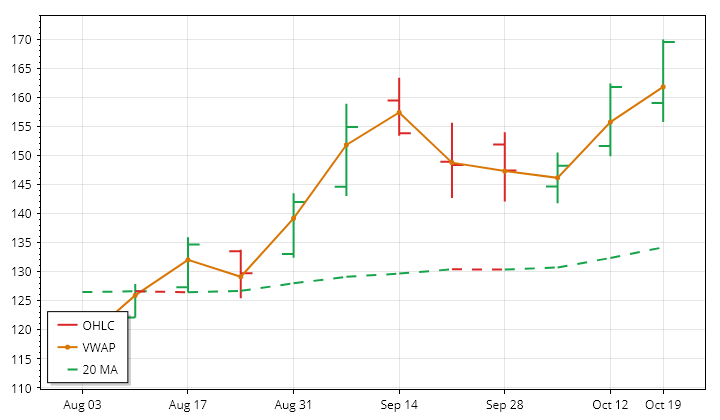
USO – Oil Technicals Summary
USO’s completed week beginning 19 October 2026 recovered an opening gap down and closed at 169.53, up 4.80% from the prior weekly close and 6.62% from the open. A higher high and higher low led to a finish above the previous week’s high and near the latest high. The close was above weekly VWAP, in the first upper volatility-band zone and just below the 52-week high.
Near-, intermediate- and far-term uptrends remained aligned with the preceding 12 completed weeks’ rising price tendency. The latest range was about 33% above average, extending a second consecutive large-range week and matching the lookback’s expanding ranges. Volume was modestly above average despite its broader declining trend, distinguishing the latest participation from the longer pattern. PSAR and the ATR-median trend remained bullish. A next-week low below 147.4 would conditionally trigger a PSAR sell reversal.
Oil News and Fundamentals
United States Oil Fund shares pulled back on October 20 after an early rally as crude oil reversed course and fell more than 2%. Oil’s initial gains had followed Houthi attacks on Saudi facilities and reports of ships coming under fire in the Gulf.
TLT · Weekly · 2026-10-19 | WNC% ▲ +1.61% WOC% ▲ +1.80%
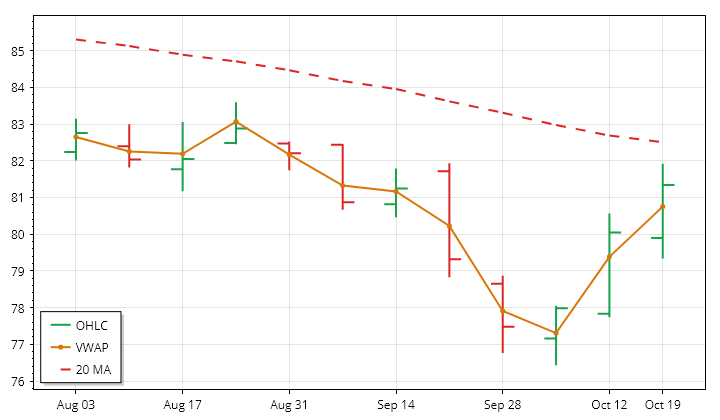
TLT – Long-Term Treasury Bonds Technicals Summary
TLT’s completed week beginning 19 October 2026 recovered an opening gap down and closed at 81.34, gaining 1.61% from the prior weekly close and 1.80% from the open. A higher high and higher low culminated in a close above the previous week’s high. Finishing above weekly VWAP and in the first upper volatility-band zone reinforced the strength of the latest advance.
The rebound nevertheless ran against the downward price tendency across the preceding 12 completed weeks and the intermediate- and far-term downtrends. Near-term positioning was mixed, with price above a still-falling benchmark. The latest range was about 45% above average, extending a sequence of five large-range weeks and fitting the lookback’s expanding ranges. Volume was approximately average against a rising volume trend. PSAR was long while the ATR-median trend remained bearish; a next-week low below 76.43 would conditionally trigger a PSAR sell reversal.
Treasury Bonds News and Fundamentals
Treasury yields remained elevated, but the 10-year yield fell sharply on October 22 amid signs that debt issuance from AI hyperscalers may be easing. Investors were increasingly hopeful that the Treasury sell-off was finding a bottom. The November 4 Treasury refunding is an upcoming catalyst; commentary identified unchanged coupon sizes and increased buybacks as potential supports for a reversal in long-duration bonds.
IBIT · Weekly · 2026-10-19 | WNC% ▼ -0.41% WOC% ▼ -1.44%
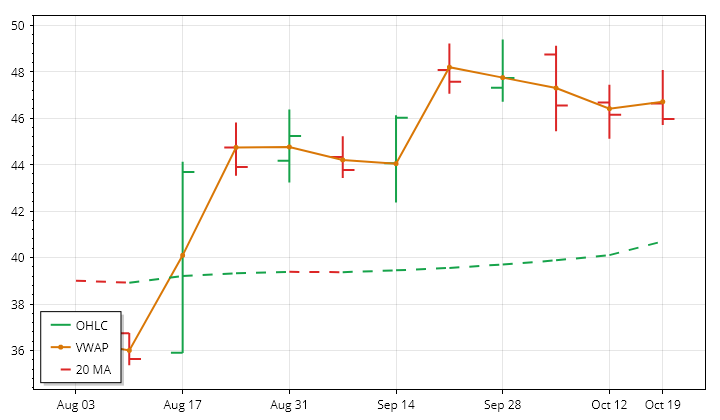
IBIT – Bitcoin Technicals Summary
IBIT’s completed week beginning 19 October 2026 closed at 45.96, down 0.41% from the prior weekly close and 1.44% from the open after an opening gap up was filled. Despite a higher high and higher low, the close remained inside the previous week’s range and near the latest week’s low. Its position below weekly VWAP added a weak finishing element to an otherwise improved high-low structure.
The pullback contrasted with the upward price trend over the preceding 12 completed weeks. Near-term positioning was mixed, with price just below a rising benchmark; intermediate-term positioning was also mixed, with price above a falling benchmark. No far-term trend was supplied. The latest range was below average despite expanding lookback ranges, while subdued volume followed the broader decline in participation. PSAR and the ATR-median trend remained bullish. A next-week low below 45.11 would conditionally trigger a PSAR sell reversal.
GLD · Weekly · 2026-10-19 | WNC% ▼ -4.03% WOC% ▼ -3.88%
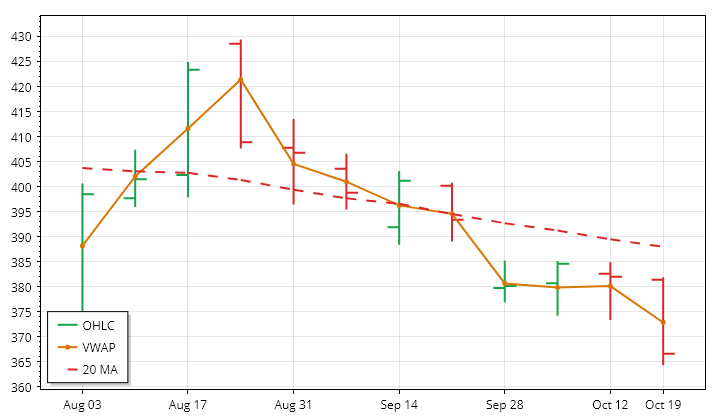
GLD – Gold Technicals Summary
GLD’s completed week beginning 19 October 2026 closed at 366.61, falling 4.03% from the prior weekly close and 3.88% from the open. Its opening gap down remained unfilled. A lower high and lower low culminated in a close below the previous week’s low and near the latest week’s low. Finishing below weekly VWAP further underscored the weakness, with price only 1.80% above its 52-week low.
The decline aligned with the intermediate-term downtrend and the downward price tendency across the preceding 12 completed weeks. Near-term positioning was also weak despite a still-rising benchmark, whereas the far-term uptrend remained intact. The latest range exceeded average even as the lookback showed contracting ranges; volume was modestly below average, consistent with declining participation. Both PSAR and the ATR-median trend were bearish. A next-week high above 403.1214 would be required to trigger a conditional PSAR buy reversal.
Glossary: Instrument — ticker symbol; hover for the instrument or company name; Date — week-start date. WNC% — prior-week close to this week’s close; WOC% — weekly session open-to-close percentage change. O — open; H — high; L — low; C — close, all for the table’s daily or weekly session; VWAP — volume-weighted average price; its arrow shows whether the close is above or below VWAP. Vol — period trading volume. Mon–Fri — each day’s prior-close-to-close percentage change.
Bias — three directional readings, in order: WNC%, WOC%, then VWAP. ▲ positive/above; ▼ negative/below; — neutral or unavailable. Matching arrows show alignment; opposing arrows show mixed conditions. AVG/Sum — simple average of percentage changes and sum of reported volumes.
Futures Session Fib Grid Analysis – Snapshot
Session Fib Grids normalise market positioning as percentages, making direction and alignment comparable across different asset types.
Latest available snapshot for each instrument; Time(CT) shows the individual update date and time.
| Instrument | Bias | Time(CT) | YSFG | MSFG | WSFG | RSFG | SFG | TSI |
|---|---|---|---|---|---|---|---|---|
| ▲ ES | ▲ ▼ ― ▲ ▲ ▼ | 2026-10-23 11:31:52 | ▲ +51 | ▼ -25 | — 0 | ▲ +20 | ▲ +20 | ▼ -15 |
| ▲ NQ | ▲ ▼ ― ▲ ▲ ▲ | 2026-10-23 11:31:50 | ▲ +59 | ▼ -78 | — 0 | ▲ +31 | ▲ +31 | ▲ +55 |
| ▼ YM | ▲ ▲ ▲ ▼ ▼ ▼ | 2026-10-23 11:31:52 | ▲ +34 | ▲ +55 | ▲ +39 | ▼ -3 | ▼ -3 | ▼ -21 |
| ▲ EMD | ▲ ▲ ▲ ▲ ▲ ▲ | 2026-10-23 11:31:50 | ▲ +26 | ▲ +3 | ▲ +8 | ▲ +19 | ▲ +19 | ▲ +38 |
| ▲ RTY | ▲ ▼ ▲ ▲ ▲ ▲ | 2026-10-23 11:31:50 | ▲ +31 | ▼ -30 | ▲ +65 | ▲ +20 | ▲ +20 | ▲ +56 |
| ▼ FDAX | ▲ ▲ ▼ ▼ ▲ ▲ | 2026-10-23 11:31:43 | ▲ +6 | ▲ +5 | ▼ -66 | ▼ -64 | ▲ +17 | ▲ +26 |
| ▲ NKD | ▲ ▼ ▼ ▲ ▲ ▲ | 2026-10-23 11:31:14 | ▲ +144 | ▼ -83 | ▼ -16 | ▲ +27 | ▲ +29 | ▲ +73 |
| Instrument | Bias | Time(CT) | YSFG | MSFG | WSFG | RSFG | SFG | TSI |
|---|---|---|---|---|---|---|---|---|
| ▼ BTC | ▼ ▼ ▼ ▼ ▼ ▼ | 2026-10-23 16:00:00 | ▼ -36 | ▼ -24 | ▼ -21 | ▼ -32 | ▼ -19 | ▼ -57 |
| ▼ GC | ▼ ▼ ▼ ▼ ▼ ▼ | 2026-10-23 11:31:46 | ▼ -142 | ▼ -51 | ▼ -121 | ▼ -38 | ▼ -39 | ▼ -30 |
| ▲ CL | ▲ ▲ ▲ ▲ ▲ ▲ | 2026-10-23 11:31:48 | ▲ +193 | ▲ +92 | ▲ +49 | ▲ +57 | ▲ +46 | ▲ +214 |
| ▼ 6E | ▼ ▼ ▼ ▼ ▼ ▼ | 2026-10-23 11:31:45 | ▼ -57 | ▼ -70 | ▼ -8 | ▼ -2 | ▼ -7 | ▼ -108 |
| ▼ ZB | ▼ ▲ ▲ ▼ ▼ ▲ | 2026-10-21 09:39:59 | ▼ -39 | ▲ +77 | ▲ +6 | ▼ -3 | ▼ -2 | ▲ +29 |
Glossary: YSFG — yearly; MSFG — monthly; WSFG — weekly; RSFG — regular trading hours (RTH); SFG — the current session, including pre-market or other sessions. TSI indicates trend strength and power.
Bias shows trend alignment across these six readings. The arrows follow the column order: YSFG, MSFG, WSFG, RSFG, SFG and TSI. Matching arrows show alignment; opposing arrows show mixed conditions.
Data, Market and System
Market Weekly Recap Summary
AI investment and earnings shaped equities throughout the week. Monday’s positioning ahead of mega-cap results paired selective technology resilience with concern about financing costs and investment-led growth. Tuesday’s resilient corporate earnings supported participation beyond technology, even as debt-funded AI expansion remained under scrutiny. AI-related earnings then lifted stocks Wednesday, although weak breadth exposed the rally’s concentration. That optimism reversed sharply Thursday as capital-spending, cash-flow and credit concerns drove a technology-led selloff. Friday’s selective semiconductor buying offered only partial relief. Weekly outcomes reflected substantial dispersion: Tesla gained 4.93% and Apple rose 1.24%, while Nvidia lost 1.48%, Alphabet fell 5.98% and Meta dropped 9.40%.
Energy risk persisted despite early reversals. Monday’s oil pullback gave way to Tuesday’s rebound as vessel attacks and threats to Saudi facilities renewed supply concerns. Inventory draws reinforced the tight-supply backdrop, although Wednesday’s larger-than-expected draw did not prevent a lower oil-ETF close. Reported tanker damage in the Strait of Hormuz and rising shipping costs intensified the shock Thursday; oil climbed further Friday amid renewed regional violence. The resulting inflation pressure kept borrowing costs and the approaching Federal Reserve decision central to the market narrative.
Inflation concerns were already prominent early in the week, with hotter CPI and PPI readings sustaining tightening fears. Thursday’s documented producer-price release strengthened that concern: September prices rose 1.3% month over month versus a 0.5% forecast. Bonds nevertheless rallied as investors sought safety, before retreating Friday as oil rose; TLT still finished higher for the week. Gold diverged from Treasuries: an early decline under dollar and yield pressure briefly reversed Wednesday, but sharp subsequent losses overwhelmed that rebound. Weak housing signals and Friday’s subdued consumer sentiment added softer-growth counterpoints to the inflation-heavy backdrop.
| Chart | Summary |
|---|---|
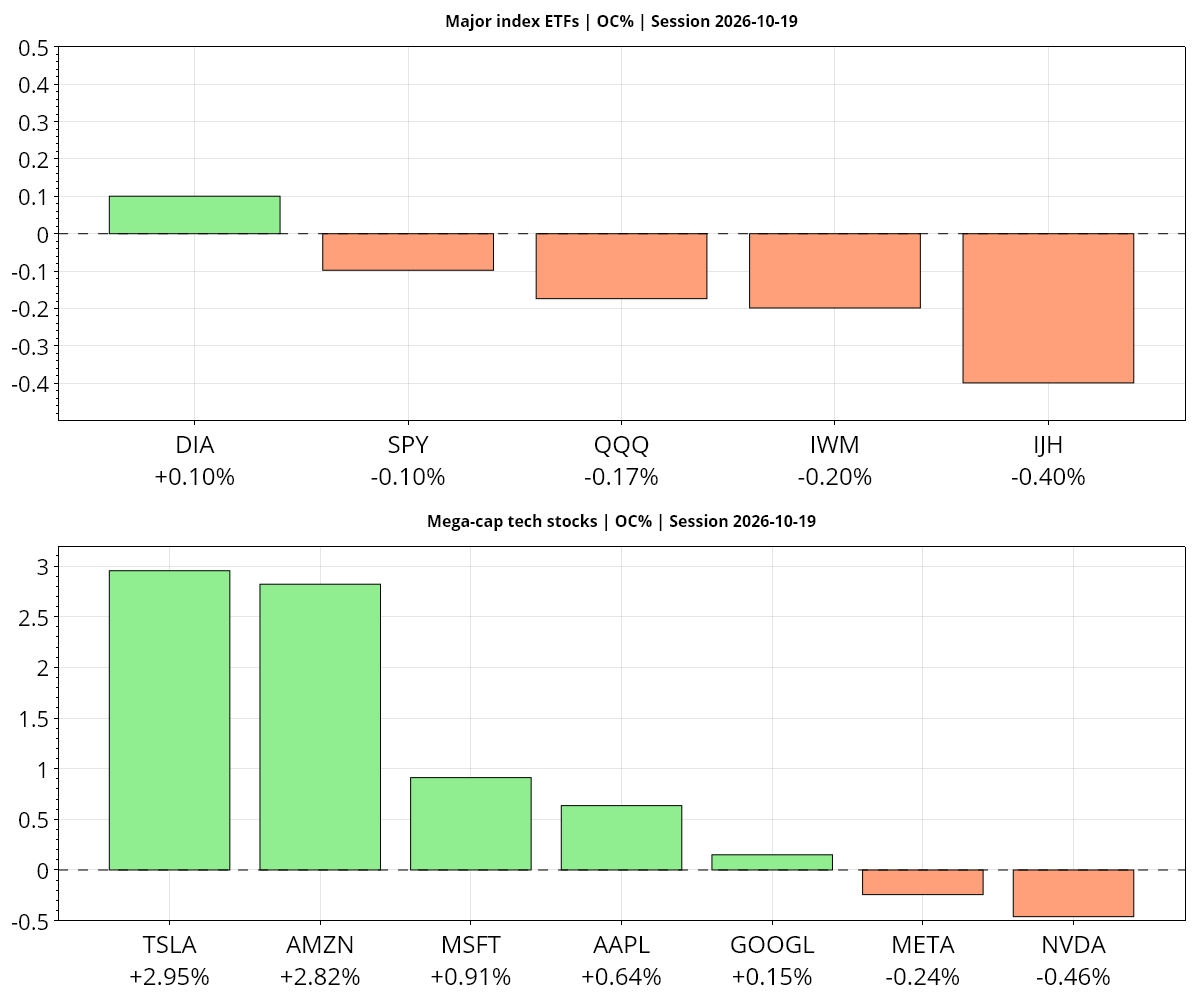 | U.S. equities finished with a cautious, divided tone as technology and semiconductor pressure contrasted with relative strength in energy, defensive and value shares. Selective gains in Amazon, Tesla and Nvidia provided pockets of resilience, while easing AI credit concerns helped some technology shares rebound. Rising Treasury yields and positioning ahead of mega-cap earnings remained central influences, with demand for downside protection lifting the VIX to 20. The divergence left markets balancing AI earnings expectations against concerns about financing costs and the durability of investment-led growth. Inflation remained a key constraint. Hotter CPI and PPI readings continued to revive rate-hike concerns, while Treasury yields resumed rising after the previous week’s decline. Firmer growth expectations sat alongside the prospect of higher yields for longer, keeping pressure on rate-sensitive assets. Treasury financing anxiety and mixed signals from riskier junk bonds added to credit-market strain. Higher mortgage rates also kept homebuyers sidelined and prompted some builders to cut prices, weighing on housing margins. For AI-linked equities, the earnings focus was particularly important: AI investment accounted for a large share of S&P 500 earnings growth, even as capital-spending projections pointed to a substantial slowdown from 2026 levels by 2028. Energy markets reflected competing supply support and pullback pressure. WTI approached $100 resistance following an 8.6 million-barrel U.S. crude inventory draw and stronger refinery runs, while Brent attracted buyers near $107. Low U.S. strategic petroleum reserve stocks and geopolitical disruptions kept supply risks prominent. The Iran war and Iran-backed Houthi attacks on Saudi infrastructure, including the Shaybah oil field and airports, reinforced concerns about energy availability and higher food and household costs. Nevertheless, oil also experienced a pullback, and USO declined. Gold weakened under the combined weight of persistent inflation, a stronger dollar and rising interest rates, although interest in the metal as an alternative asset persisted amid inflation and banking concerns. Silver and platinum gained ground, while TLT declined. Technical conditions remained uneven: S&P 500, Dow and DAX futures retained broadly constructive longer-term structures despite corrective pressure, whereas Nasdaq, mid-cap and Russell futures showed weaker short-term or daily conditions. Moving-average alignment and key pivot levels underscored the volatile backdrop. |
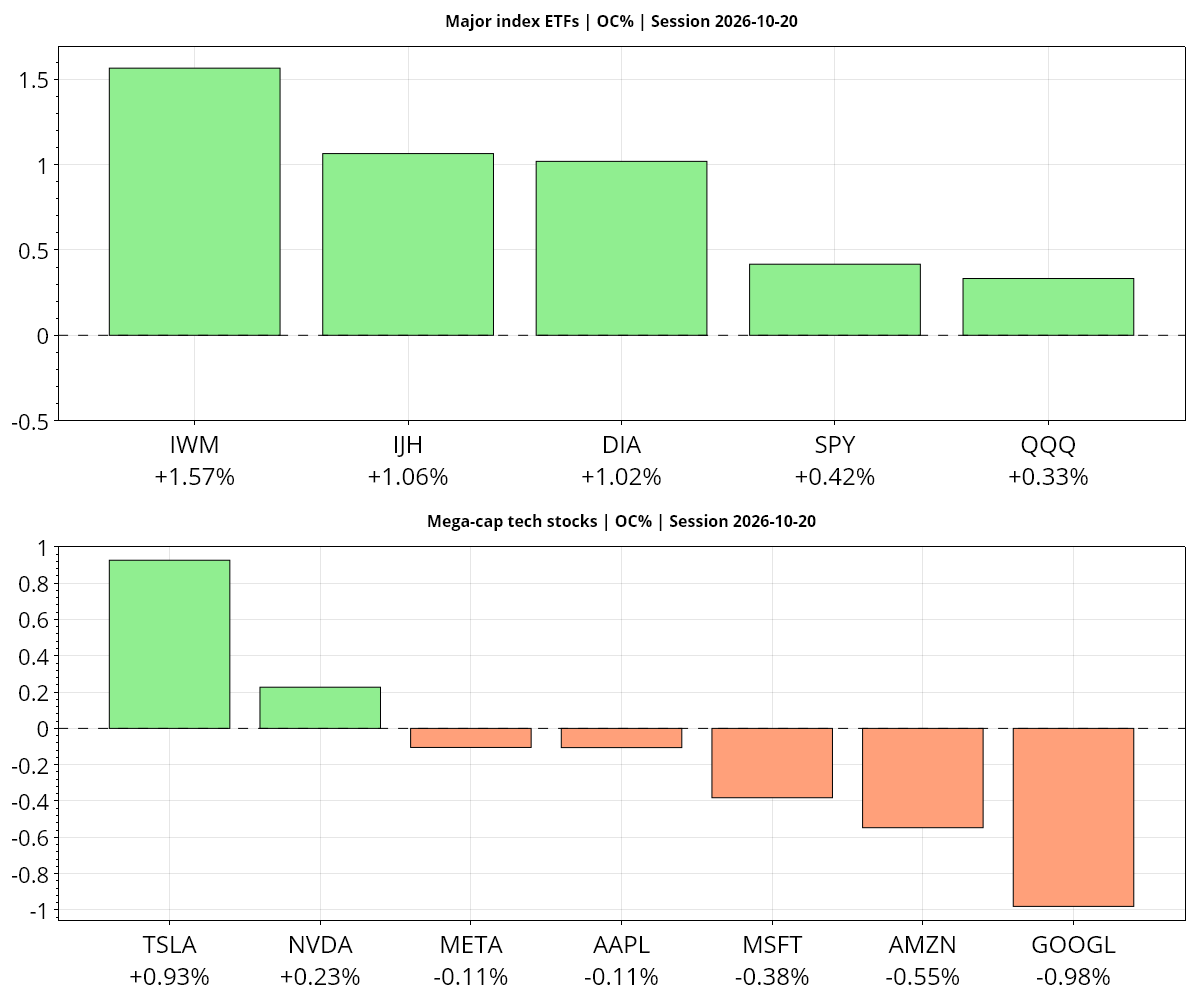 |
U.S. equities finished mixed as resilient earnings and gains beyond technology offset concerns about debt-funded artificial-intelligence investment. The Dow advanced and the Nasdaq finished flat, while SPY gained 0.34% from its previous close and QQQ slipped 0.10%. Gains in 3M, Northrop Grumman and Hasbro supported broader participation as technology shares stabilized, although General Motors fell after warning of a difficult 2027. Asian equities subsequently rebounded after a multiday technology selloff, with the Nikkei up 1.8% in early trading. Energy supply risks returned to the foreground as crude rebounded from the previous session’s losses. Hopes for U.S.-Iran diplomacy had accompanied an earlier oil pullback, but reports of vessel attacks near the Strait of Hormuz and attacks targeting Saudi facilities renewed concern about Middle East supply. Recovering regional oil exports provided a counterweight, while a reported 4.93-million-barrel API inventory draw added to the supply backdrop. The renewed rise in crude brought energy-driven inflation risks back into focus, linking geopolitical uncertainty with concerns about interest rates and monetary tightening. Treasury yields edged higher in Asian trading, reversing the prior session’s long-end decline following weak U.S. housing data. Expectations of further Federal Reserve tightening remained prominent, with one report citing 94% odds of a December hike. Gold declined in late U.S. trading and remained under pressure in early Asia as higher crude prices reinforced inflation and rate concerns. Record gold ETF holdings contrasted with that pressure. Silver initially rose in late U.S. trading, though subsequent trading brought pressure on both metals. Weakening housing activity offered a softer growth signal alongside Jamie Dimon’s positive assessment of the U.S. economy. AI financing remained a significant equity-market cross-current. CoreWeave’s reported premarket decline of more than 3% highlighted concerns over borrowing costs and heavy debt, even as data-center projects supported warehouse demand and rents. China’s condemnation of the U.S. exclusion of DeepSeek products from government systems added technology-policy friction. Technical conditions were similarly mixed: SPY and QQQ both rose from their session opens, but daily and weekly futures charts retained short-term corrective pressure within several longer-term bullish structures. |
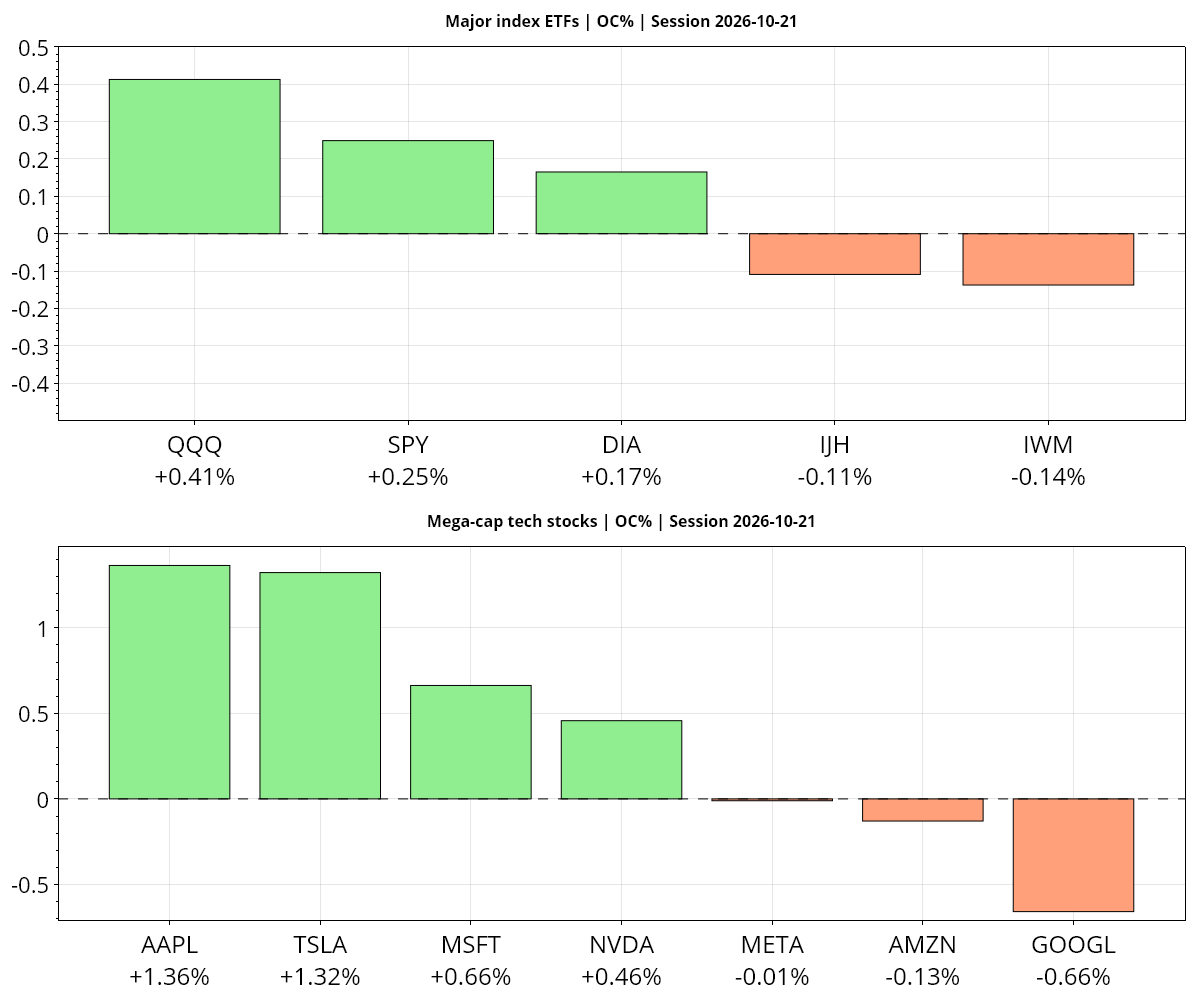 |
Stocks closed higher as AI-related earnings revived demand for technology shares, lifting the Nasdaq 1.05%. The positive close nevertheless came with weak market breadth, leaving the advance concentrated rather than broadly shared. Earnings support for AI-linked businesses was the principal driver, but the concentration of AI spending remained a risk alongside the uneven participation in the equity rally. Technical conditions also tempered the stronger close. The S&P 500 and Nasdaq-100 ETFs gained 0.25% and 0.41%, respectively, from their opens, while Nasdaq futures remained in a corrective phase within a longer-term uptrend. Semiconductor support tests stayed in focus, underscoring the tension between renewed enthusiasm for technology earnings and unresolved technical weakness. Dow futures showed a stronger daily recovery, offering a firmer signal outside the Nasdaq, though the broader breadth concerns persisted. Energy markets balanced a larger-than-expected inventory draw against lingering supply risks. U.S. crude inventories fell by 3.1 million barrels, far more than expected, while Gulf oil flows continued to face potential disruption. Those developments did not translate into a higher close for the oil ETF: it rose 0.24% from its open but finished 0.50% below its prior close. The distinction left energy with a modest recovery during the session but a negative day overall. Gold rebounded as the dollar softened, although higher bond yields remained a headwind. Both gold and long-term Treasury ETFs slipped from their opens yet finished above their prior closes. The cross-market picture therefore paired an earnings-led equity advance with a rebound in gold, while yield pressure, energy supply uncertainty and technical fragility remained important counterweights. |
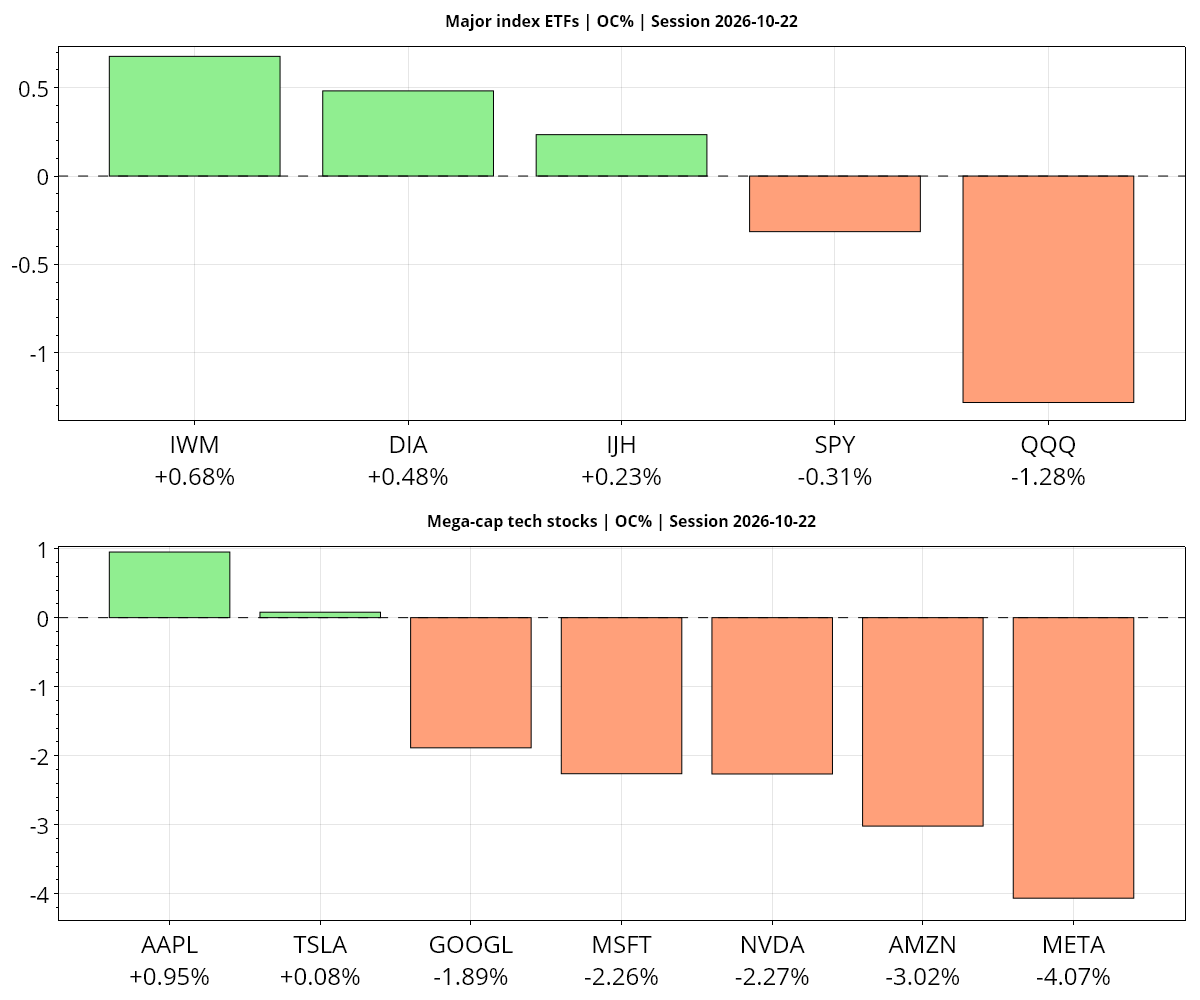 |
U.S. stocks weakened as concerns over AI capital spending and cash flow drove a technology-led selloff, with the Nasdaq dropping 2.6%. The risk-off tone extended to corporate credit, where widening AI-related credit default swap spreads and elevated borrowing costs signaled growing stress. Selling was uneven, however: midday S&P 500 breadth remained positive, and Dow and small-cap ETFs gained from their opens even as technology-heavy benchmarks retreated. Energy supplied the other major pressure point. Tehran reported that seven oil tankers had caught fire or sustained damage in the Strait of Hormuz following attacks or encounters with naval mines. Disruptions and rising shipping rates intensified supply concerns, pushing crude to a five-month high near $100 and reinforcing inflation worries. President Trump ruled out negotiations with Iran as concerns increased over renewed U.S.-Israeli attacks and a broader regional conflict. He also invoked the Defense Production Act for oil production and refining. The oil ETF eased 0.48% from its open but still finished 1.70% above its previous close, reflecting the persistence of the energy shock. Inflation and monetary policy remained central despite a rally in government bonds. September producer prices rose 1.3% month over month against a 0.5% forecast, while the annual increase of 6.3% exceeded expectations of 5.3%. That surprise, compounded by higher energy costs, sharpened attention on the October FOMC decision and the risk of additional tightening. Treasury yields nevertheless dropped below 5% as investors sought safety, and the far-term Treasury bond ETF gained 0.91% from its open. Gold fell sharply despite declining yields, erasing its summer gains and testing $4,000 an ounce. Silver futures settled 4.6% lower at $54.764, their lowest close since November 2025. Technical conditions remained weak for technology, with Nasdaq futures retaining bearish short- and medium-term daily trends. The S&P 500 and Nasdaq 100 ETFs declined 0.31% and 1.28%, respectively, from their opens. Broader strains included falling Japanese equities, an eleven-week losing streak in Chinese stocks, French ten-year yields reaching 5%, and record-low pending U.S. home sales. Upcoming GDP, personal income and consumer spending releases remained on the macro calendar alongside the Fed decision. |
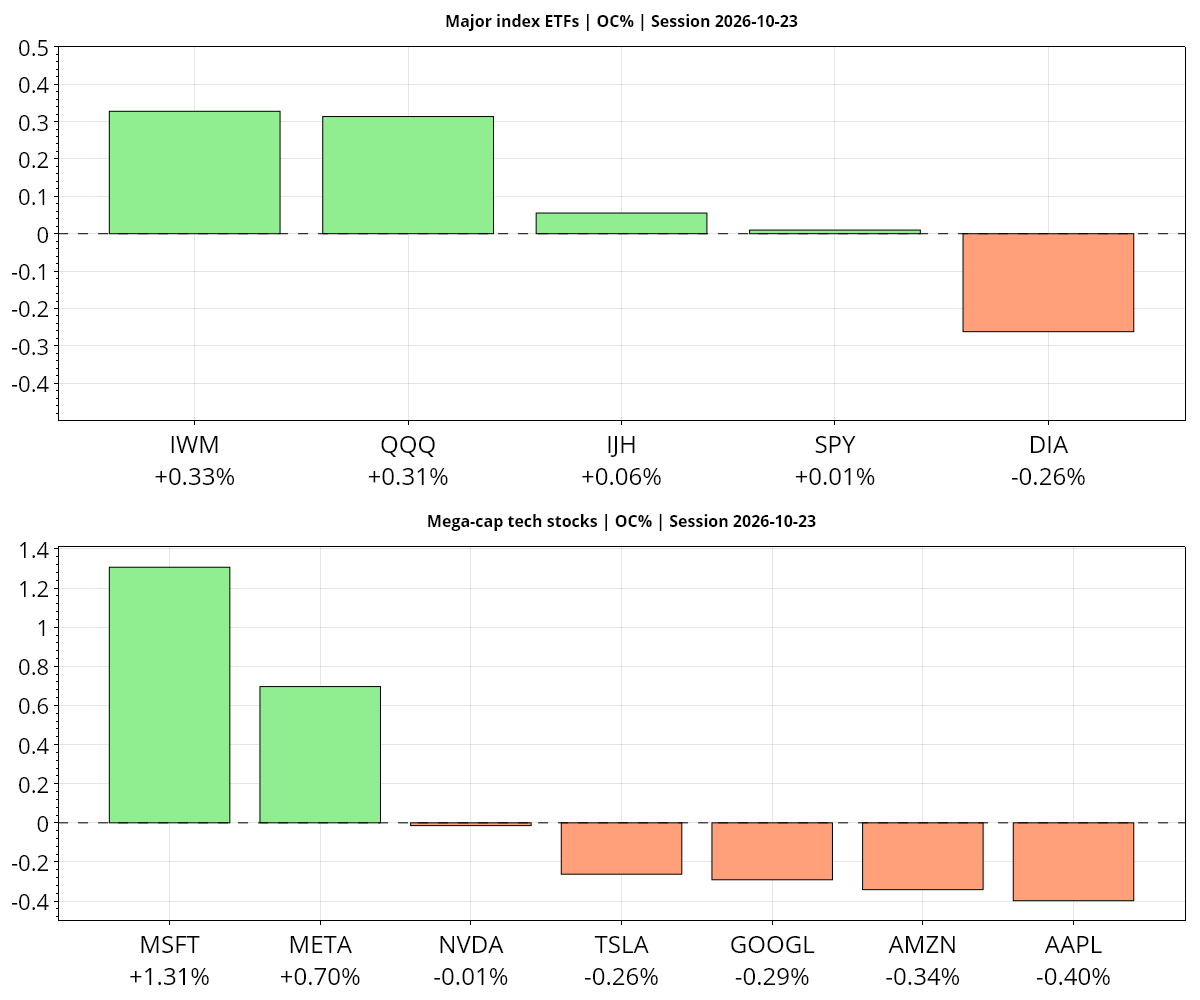 |
U.S. stocks fell into Friday’s close, ending a volatile week lower as rising oil prices revived inflation concerns ahead of the October 28 Federal Reserve decision. Selective semiconductor buying helped the Nasdaq hold up better than the broader market, but did not overcome the risk-averse tone. The S&P 500 ETF finished 0.52% below its previous close, while the Nasdaq 100 ETF was nearly unchanged, down 0.01%. Both closed above their opening levels, underscoring the mixed technical backdrop rather than a broad recovery. Energy was the principal pressure point. Brent crude topped $116, with later coverage placing oil at a five-month high, as renewed Middle East violence threatened global supplies. Reports discussing further U.S. and Israeli strikes on Iran added uncertainty heading into the weekend, although those additional strikes were not confirmed. Oil’s resurgence weighed on both equities and bonds by renewing concerns about inflation and borrowing costs. The approaching Fed decision kept policy expectations central to attention, while elevated financing costs continued to challenge premium equity valuations and the funding of AI expansion. Treasury markets remained unsettled after yields fell sharply on Thursday amid signs of easing AI-related debt supply. Friday’s oil rally put bonds back under pressure, with far-term Treasuries losing 0.54%. Gold failed to sustain support from lower yields: after initially rebounding around $4,000, it broke below that level despite the U.S. 10-year yield dropping below 5%. Gold fell 0.63%, and $3,942 emerged as the next technical support level under pressure. Concerns over AI funding and investment returns also persisted despite pockets of strength in semiconductors and a 1.31% gain in Microsoft from the open. The consumer backdrop added to the cautious mood. Final October University of Michigan sentiment slipped to 48 from September’s 48.1, a five-month low, although it exceeded both the preliminary reading and all surveyed estimates. High prices and rising interest rates continued to depress morale, while recession concerns extended into labor and credit markets and American Express announced a 5% headcount reduction. Technical conditions remained uneven: Nasdaq futures retained a far-term bullish structure, but their near- and medium-term signals stayed bearish. |
Futures Higher Time Frame Analysis
Summary of the current state of US Indices Futures based on higher time-frame (HTF) technical analysis as of: 2026-10-24: 13:27 CT.
US Indices Futures
- ES: YSFG upward, MSFG below F0%, WSFG unspecified, below 5–55-day benchmarks, daily DTrend, support 7648.50, pivot reversal 7809.00, resistance 7906.25–7936.25.
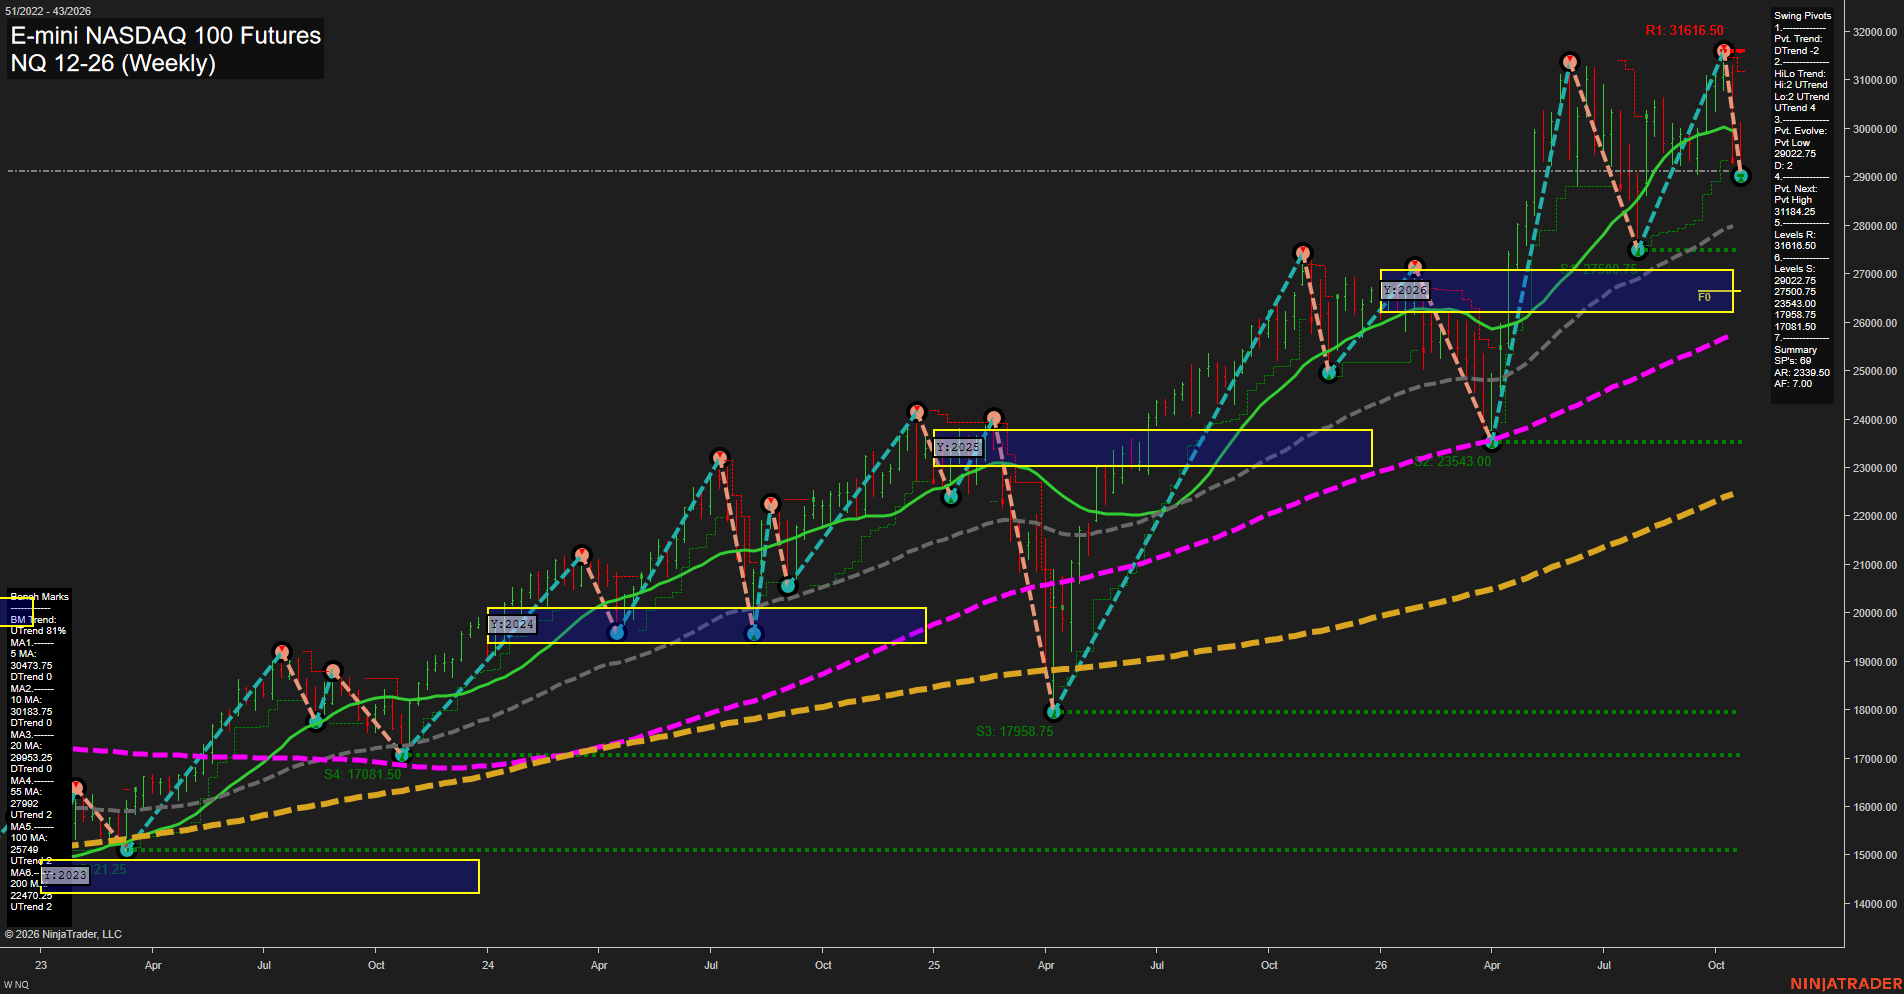
- NQ: YSFG upward, MSFG below F0%, WSFG unspecified, below short/intermediate benchmarks, DTrend, support 28987 then 27500.75, resistance 31150–31616.50.
- YM: YSFG/MSFG/WSFG above F0%, daily benchmarks rising, daily UTrend versus weekly DTrend, benchmark support 52350–52488, daily reversal 51970, resistance 52648–53116.
- EMD: YSFG/MSFG/WSFG above F0%, below all daily benchmarks, daily lower-high downtrend, support 3600.3–3604.1, resistance 3706.5–3737.8, weekly reversal 3794.7.
- RTY: YSFG upward, MSFG below F0%, WSFG above F0%, below declining 20–100-day benchmarks, DTrend, support 2723.3–2723.7, resistance 2808.7–2887.2, weekly reversal 2888.9.
- FDAX: YSFG/MSFG upward, below WSFG F0%, below 5/10/55/100-day benchmarks, rising 200-day, DTrend, support 25169 then 24847, daily reversal 25725, resistance 25833.
Overall State
- Short-Term: Bearish
- Intermediate-Term: Neutral
- Long-Term: Bullish
Conclusion
Short-term downside structures are broadly correlated, with recent short signals in ES, NQ, YM, and FDAX. Intermediate conditions diverge: ES, NQ, and RTY remain below monthly F0% references, while YM, EMD, and FDAX retain upward monthly-grid structures. YM shows relative structural strength through its daily UTrend and rising benchmarks; EMD shows broader daily weakness below every benchmark despite intact higher-timeframe grids. Yearly grids and predominantly upward weekly structures retain the broader bullish context, with EMD’s bearish daily long-term rating and RTY’s neutral daily long-term rating marking divergences. Listed swing supports and pivot-reversal resistance levels define the current structural boundaries.
Note: Intra-day counter-trend pullbacks or retracements may occur, HTF is context for informational usage and market structure. Glossary: Session Fib Grids periods of YSFG:’Yearly’, MSFG:’Monthly’, WSFG:’Weekly’
For full details visit: AlphaWebTrader Technicals
SPY Weekly View
Overall Rating
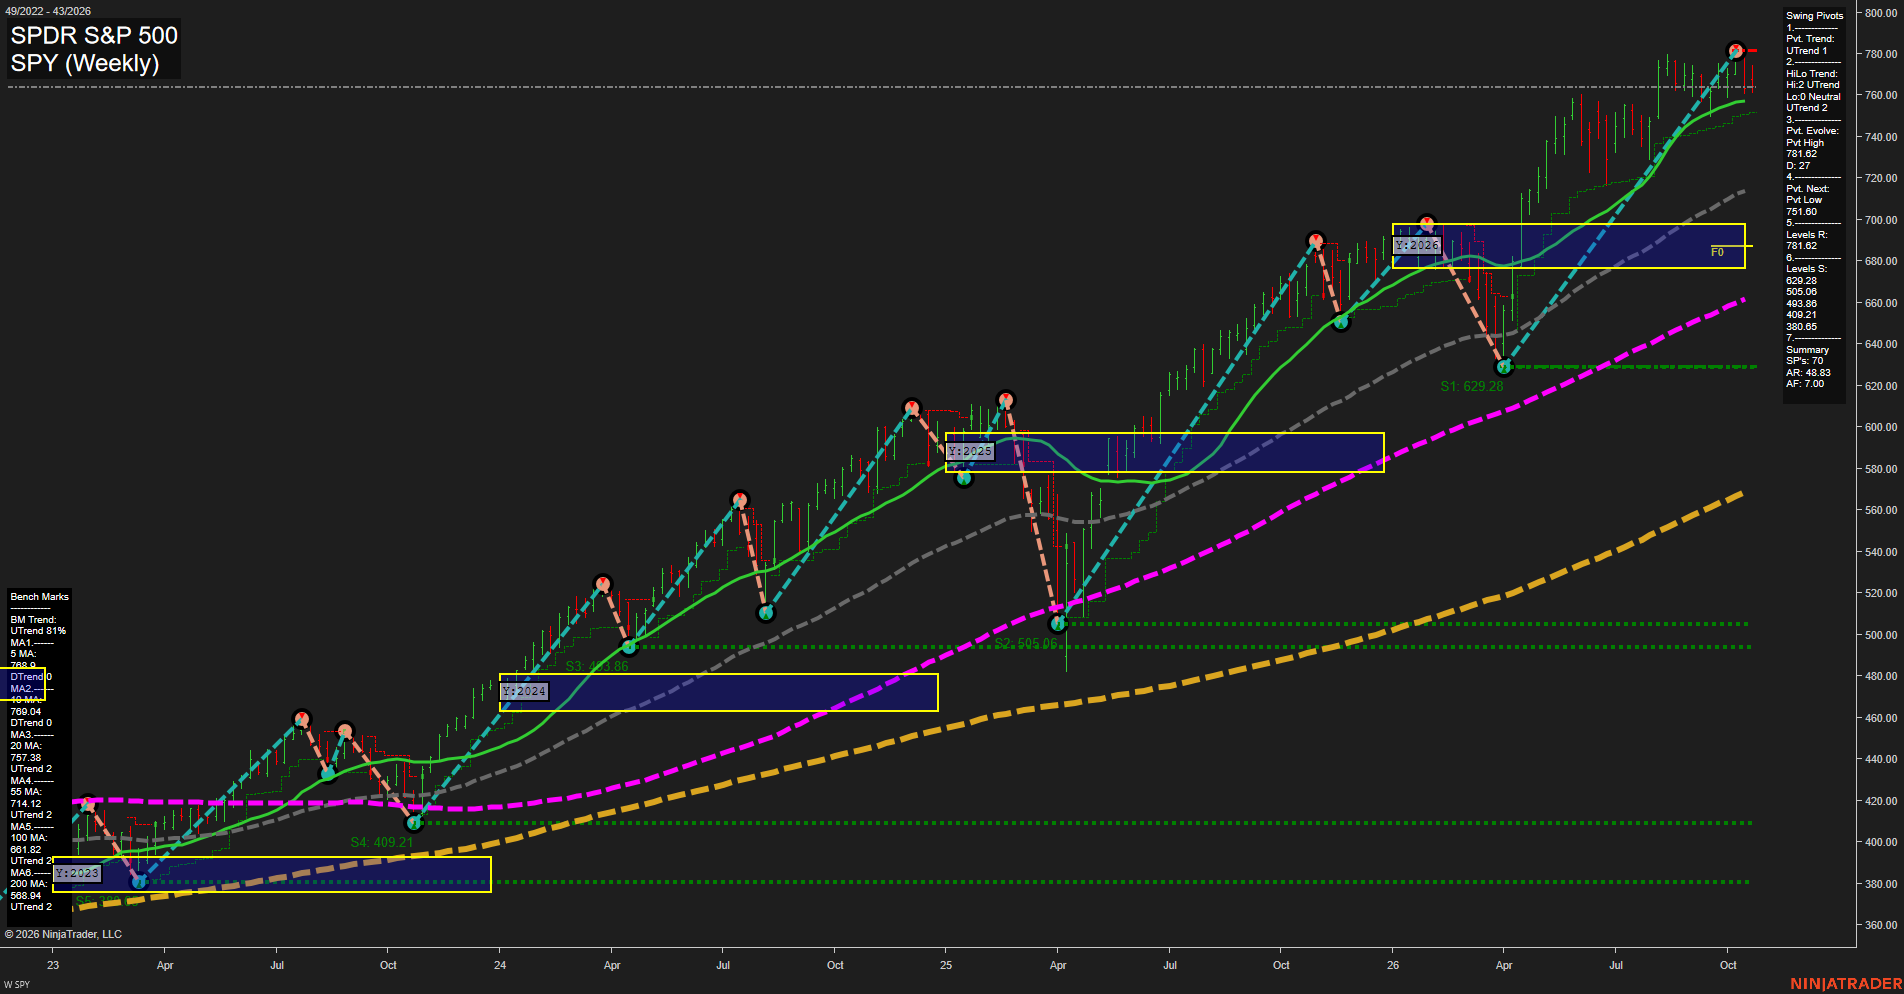
- Short-Term: Neutral
- Intermediate-Term: Bullish
- Long-Term: Bullish.
Key Insights Summary
From a futures swing-trader perspective, the corresponding equity-index futures structure remains broadly bullish: price is pressing the 781.62 pivot-high resistance area while holding well above rising 20, 55, 100, and 200-period weekly benchmarks. The immediate condition is more mixed because the 5- and 10-period benchmarks are declining and price has accelerated into a prior high, consistent with a mature fast-momentum leg and potential short-term consolidation. The intermediate and long-term structure retains higher-high and higher-low characteristics, with 757.38 and 751.60 representing nearby structural reference zones beneath the current high. A confirmed pivot above 781.62 would extend the established advance, while rejection there would frame the move as an upper-range test within the larger uptrend.
View charts on: AlphaWebTrader HTF Charts
ES Weekly View
Overall Rating
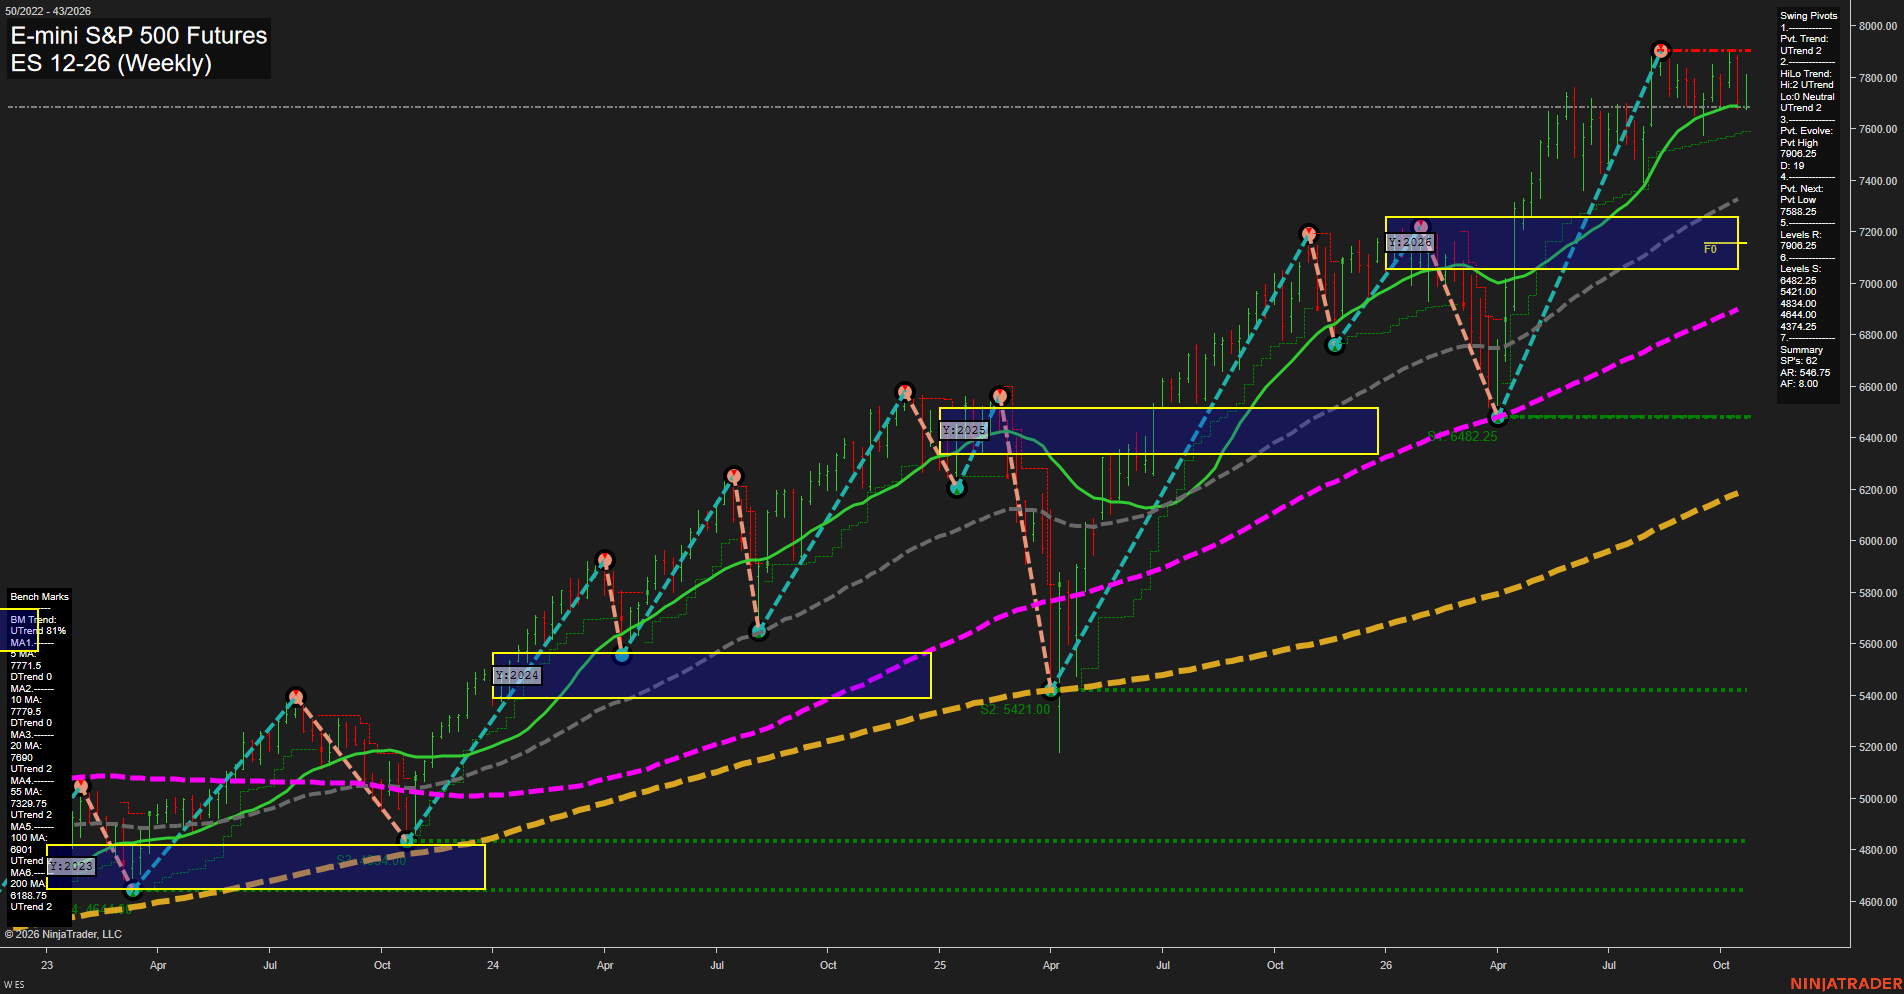
- Short-Term: Bearish
- Intermediate-Term: Neutral
- Long-Term: Bullish.
Key Insights Summary
The weekly structure remains broadly constructive, with higher-order pivot trends, yearly Fib positioning, and rising 20-, 55-, 100-, and 200-period benchmarks supporting the long-term advance. Short-term action has softened beneath the 5- and 10-period benchmarks following rejection from the 7906.25 pivot high, creating a pullback/consolidation phase. The 7588.25 pivot-next level defines the immediate downside swing threshold, while 7906.25 remains the key overhead pivot resistance. The monthly Fib condition is counter-trend down, producing a mixed intermediate-term backdrop despite the intact higher-low structure.
View charts on: AlphaWebTrader HTF Charts
QQQ Weekly View
Overall Rating
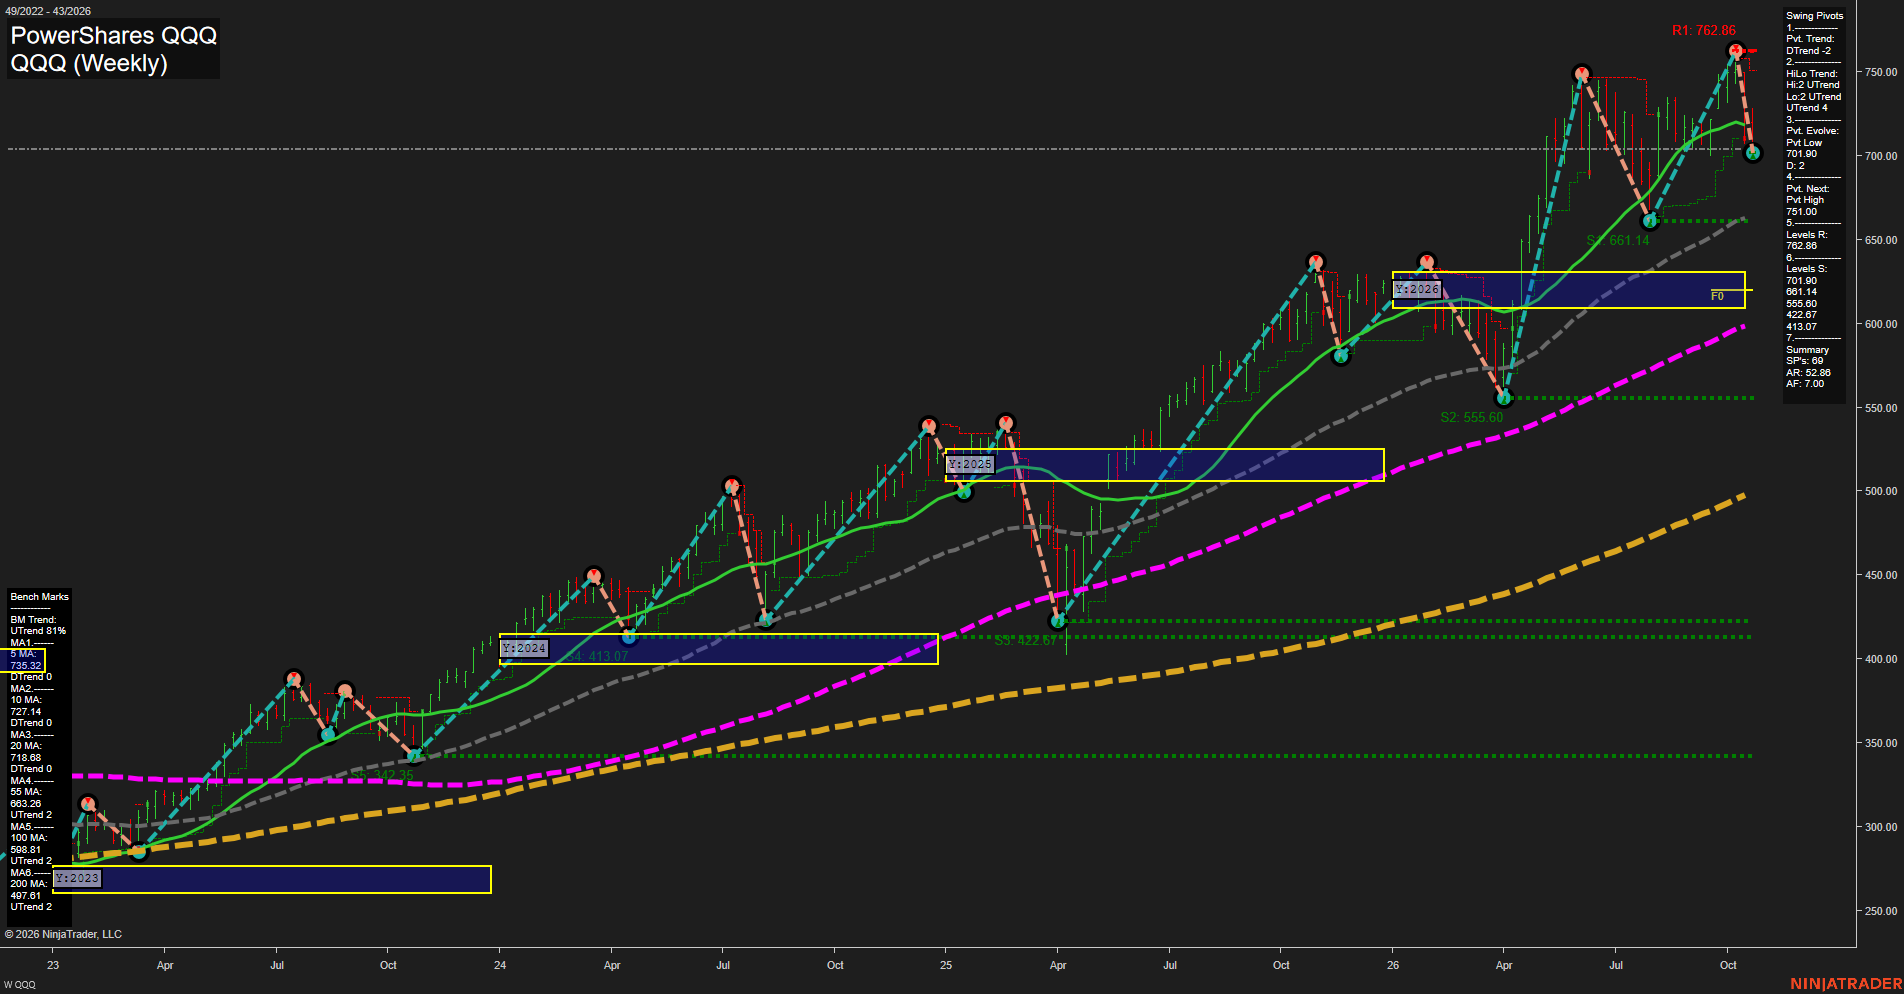
- Short-Term: Bearish
- Intermediate-Term: Bullish
- Long-Term: Bullish.
Key Insights Summary
QQQ presents a corrective, high-volatility weekly downswing within a broader futures-equity index uptrend. The large decline from the 762.86 pivot-high resistance area pushed price beneath the 5-, 10-, and 20-week benchmarks, confirming fast short-term downside momentum and a DTrend pivot condition. The intermediate HiLo structure remains UTrend because the larger sequence of higher swing lows is intact, with 661.14 representing the principal nearby structural support. Price remains materially above rising 55-, 100-, and 200-week benchmarks, preserving the long-term bullish trend backdrop. For futures swing context, the market is characterized as a countertrend pullback below short-term averages rather than a confirmed intermediate-term trend reversal; 751.00 is the defined pivot-reversal threshold and 762.86 remains the major overhead swing-high reference.
View charts on: AlphaWebTrader HTF Charts
NQ Weekly View
Overall Rating
- Short-Term: Bearish
- Intermediate-Term: Bearish
- Long-Term: Bullish.
Key Insights Summary
Weekly price action has shifted into a fast downside swing, trading below the 5, 10, and 20-week benchmarks and below both weekly and monthly Fib-grid centers. The short-term pivot structure is down, while the intermediate HiLo trend remains up, defining the decline as a substantial pullback within a still-bullish yearly structure. The 29022.75 pivot low is the immediate support reference; 27500.75 is the next major lower swing level. A recovery would encounter layered benchmark resistance from 29959.25 through 30473.75, followed by the 31184.25 pivot reversal level and 31616.50 major resistance.
View charts on: AlphaWebTrader HTF Charts
USO Weekly View
Overall Rating
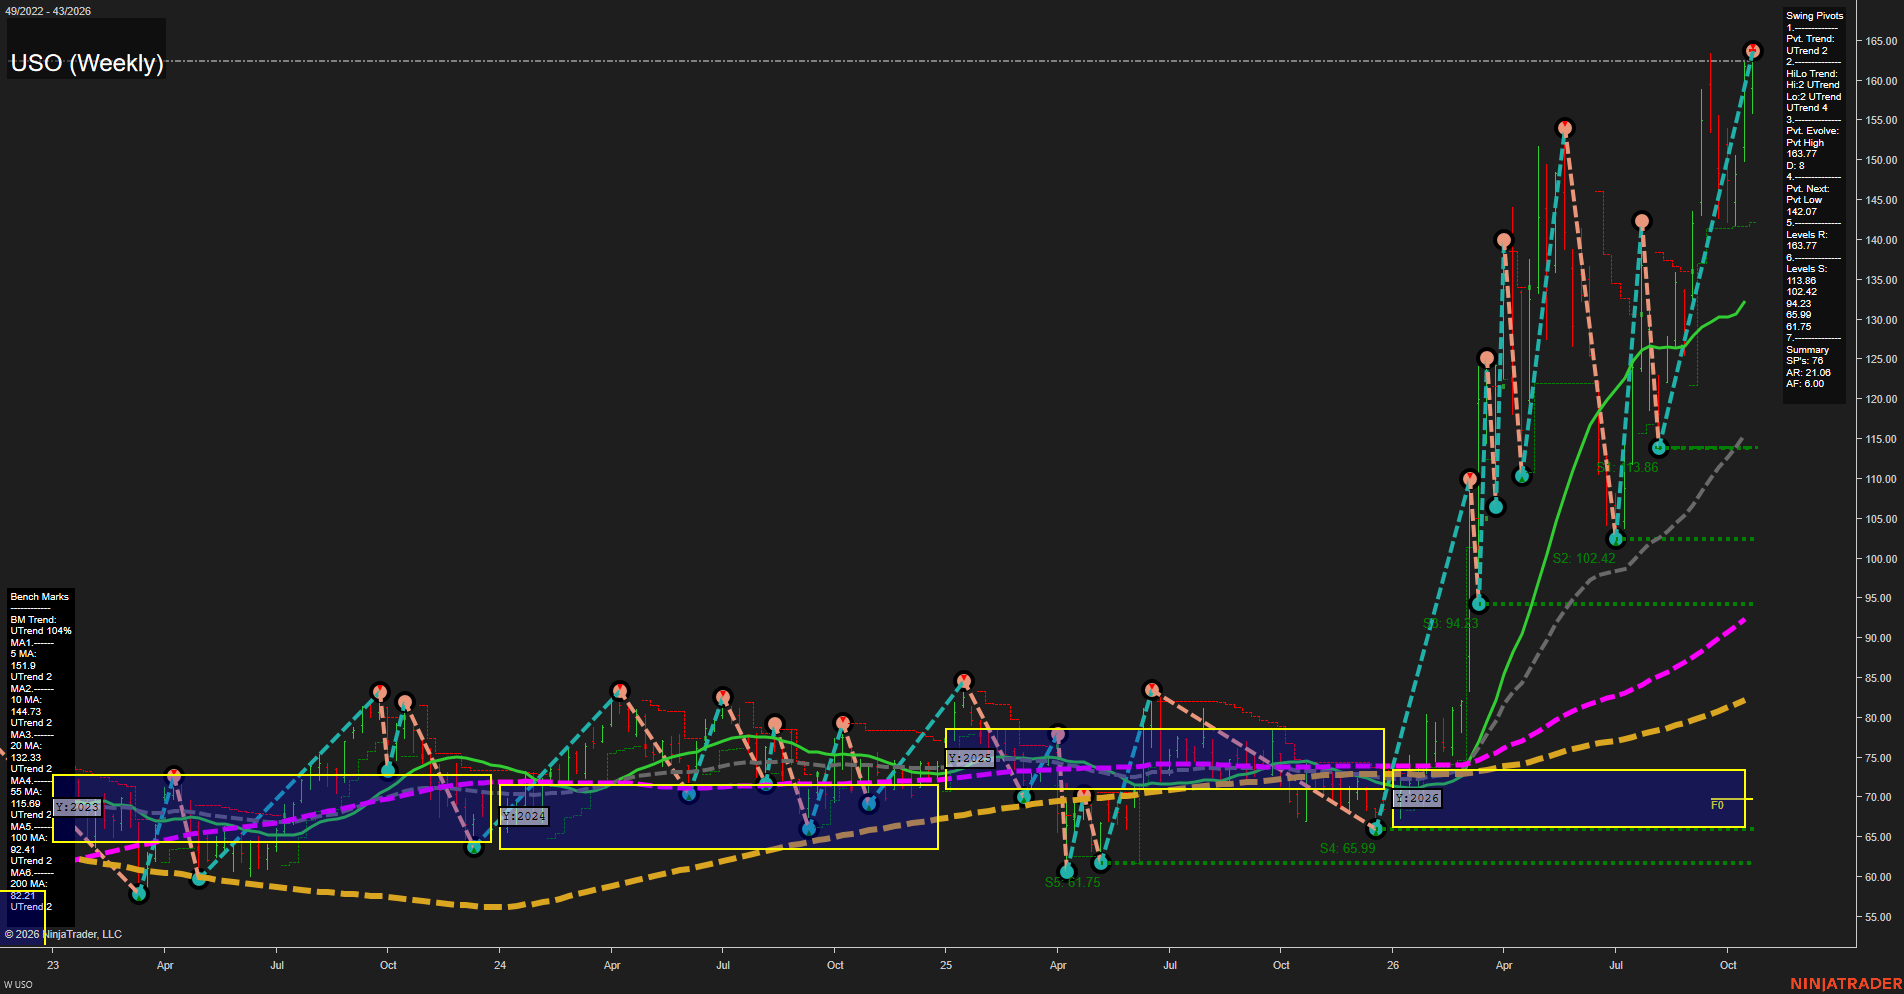
- Short-Term: Bullish
- Intermediate-Term: Bullish
- Long-Term: Bullish.
Key Insights Summary
USO reflects a powerful futures-style momentum expansion, with price accelerating to a new 163.77 pivot high and trading materially above every weekly benchmark. The pivot structure is aligned upward across short- and intermediate-term horizons, while the wide separation above the 20-, 55-, 100-, and 200-period averages confirms an extended long-term advance. Large weekly ranges and the steep, near-vertical advance indicate elevated directional volatility rather than a balanced consolidation. The 142.07 pivot-next level defines the nearest structural reversal threshold, while 113.86 is the principal established swing-support level beneath the current advance.
View charts on: AlphaWebTrader HTF Charts
CL Weekly View
Overall Rating
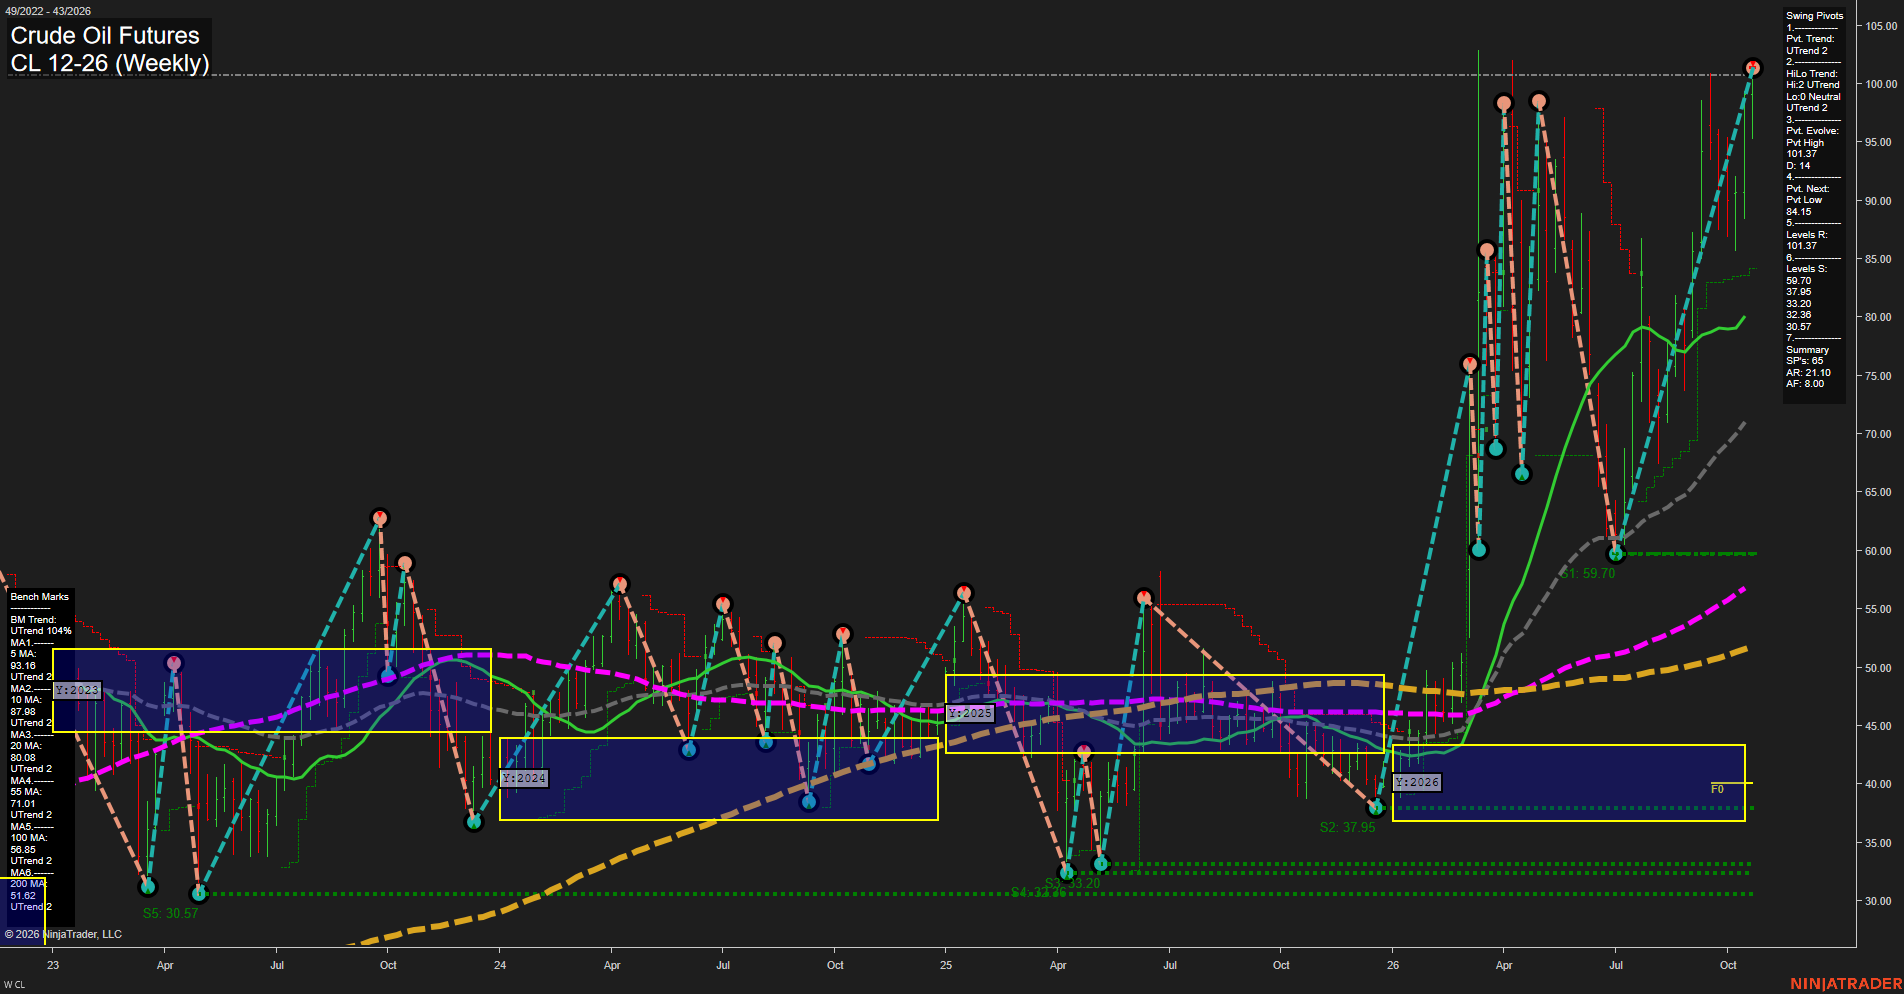
- Short-Term: Bullish
- Intermediate-Term: Bullish
- Long-Term: Bullish.
Key Insights Summary
CL is in a broad multi-timeframe advance, with price extended above all rising benchmark averages and above the yearly F0%/NTZ structure. Large weekly bars and the rapid push into 101.37 reflect fast upside momentum and elevated volatility. The pivot structure remains higher-high/higher-low bullish, although 101.37 is the active pivot-high resistance and 84.15 defines the next swing-pivot reversal reference. The move has the character of a strong breakout continuation following the 2026 recovery from the 37.95 area, with the 93.16 and 87.98 short-term benchmarks marking the nearest underlying trend structure.
View charts on: AlphaWebTrader HTF Charts
GLD Weekly View
Overall Rating
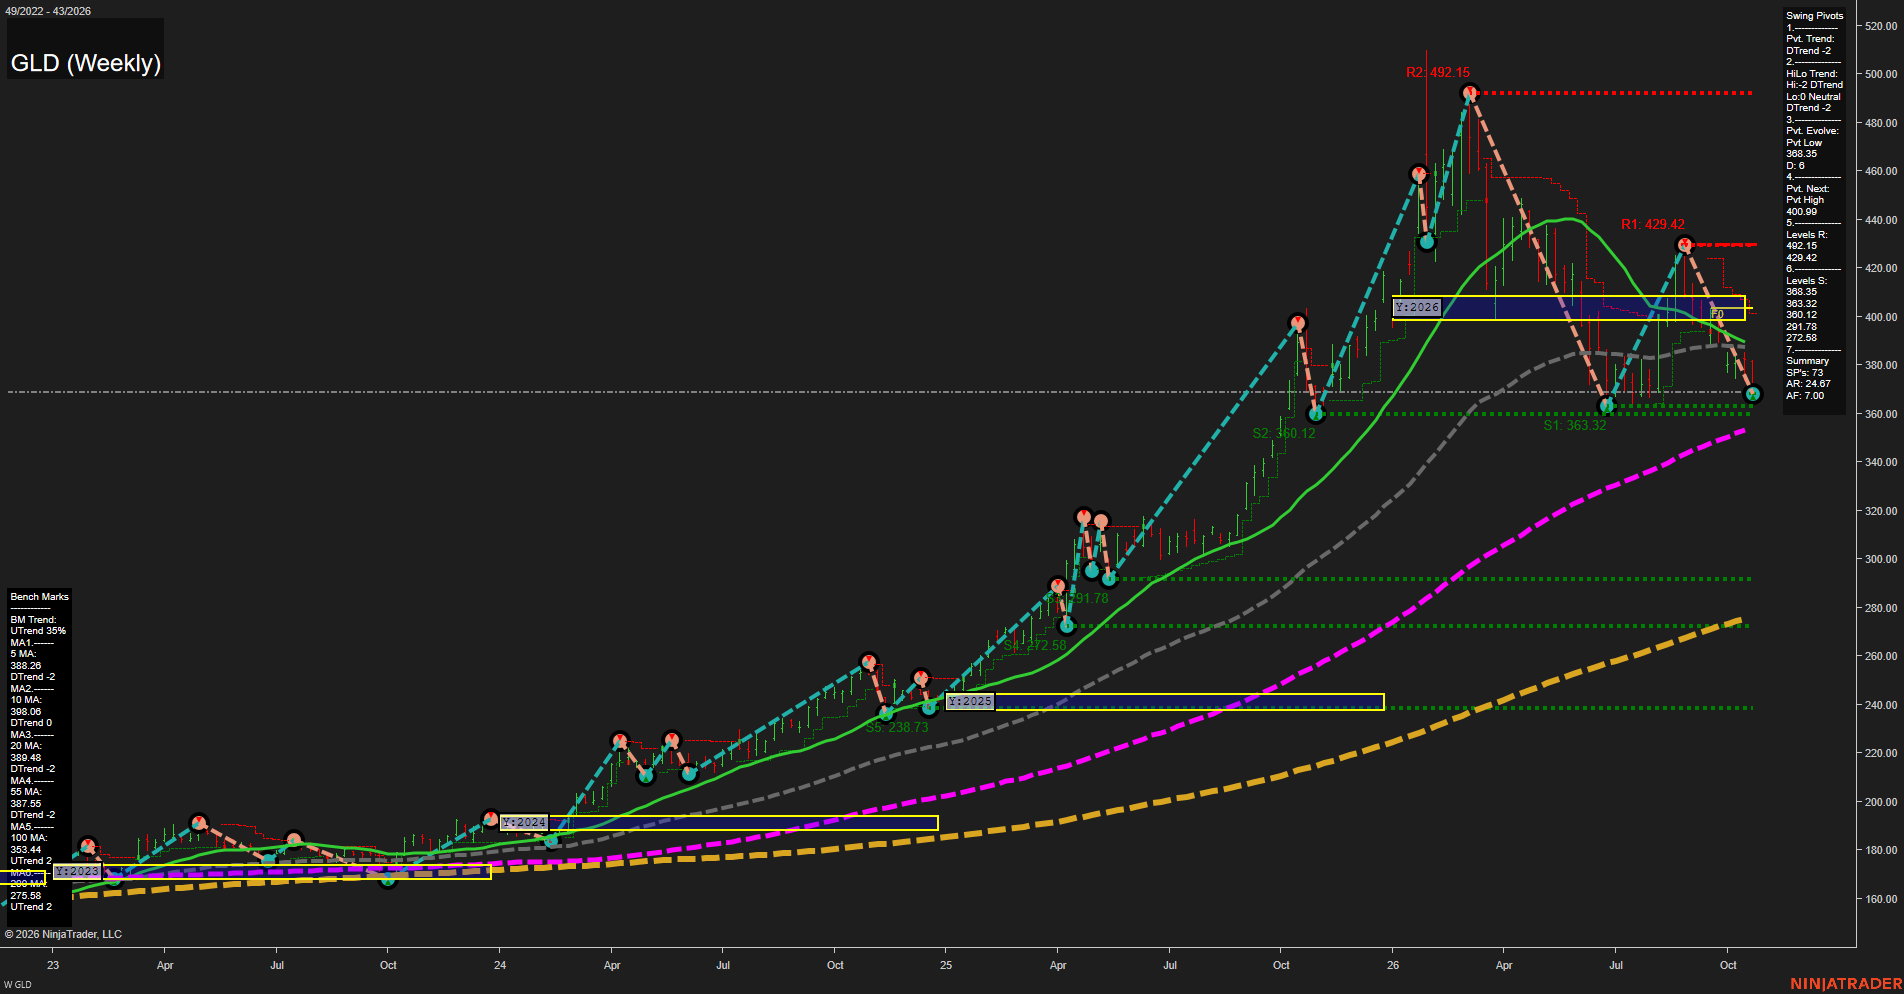
- Short-Term: Bearish
- Intermediate-Term: Bearish
- Long-Term: Bullish.
Key Insights Summary
GLD is in a pronounced weekly corrective phase following the 492.15 peak, with lower highs and lower lows confirming both the short-term pivot and intermediate HiLo downtrends. Price is below the clustered 5, 10, 20, and 55-week benchmarks near 387.55 to 398.06 and remains beneath the 2026 F0%/NTZ area near 400, defining that band as the primary countertrend recovery zone. The 368.35 pivot low is being tested alongside nearby 363.32 and 360.12 supports; this creates an active downside swing structure, while 400.99 is the pivot-reversal threshold for the next confirmed swing high. From a futures swing-trader perspective, the weekly structure is bearish and volatile in the near term, but the long-term trend remains constructive because price is still above the rising 100 and 200-week benchmarks.
View charts on: AlphaWebTrader HTF Charts
GC Weekly View
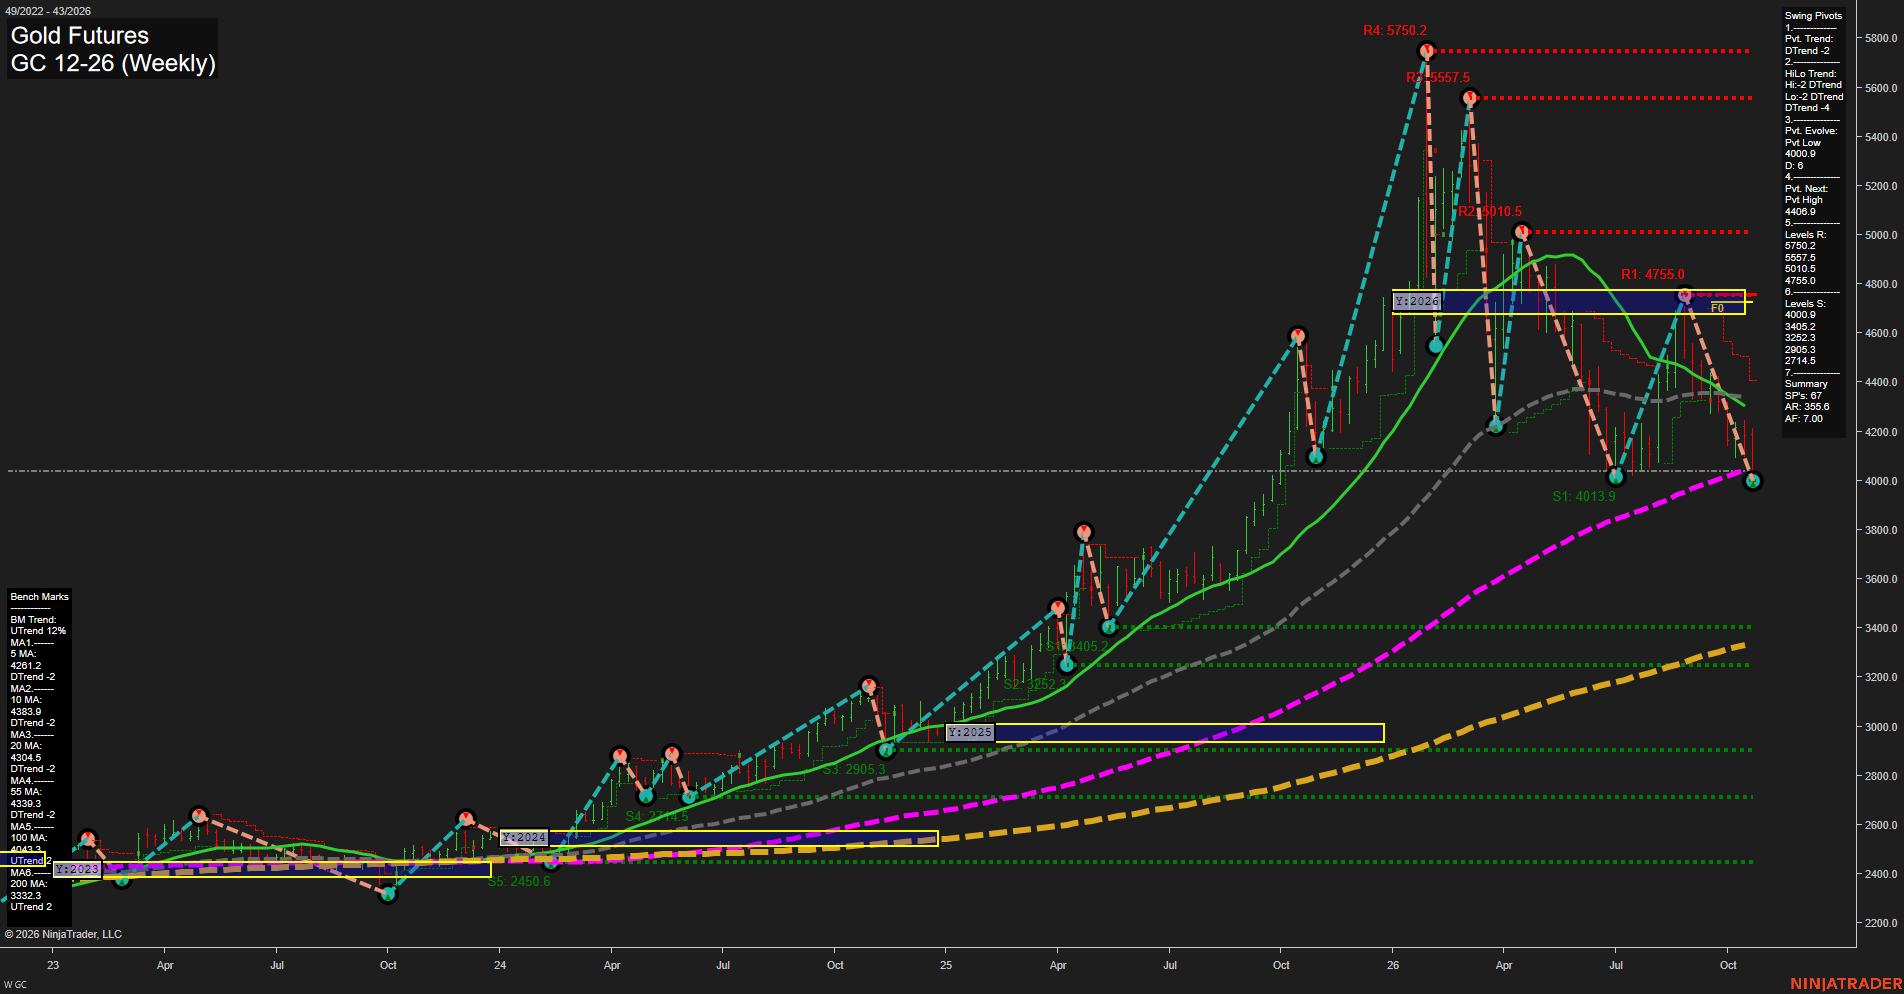
Overall Rating
- Short-Term: Bearish
- Intermediate-Term: Bearish
- Long-Term: Bullish.
Key Insights Summary
Price action has accelerated lower into a new 4000.9 pivot low, confirming a short-term and intermediate-term lower-high/lower-low structure. Price is below the weekly, monthly, and yearly F0%/NTZ areas and beneath the 5, 10, 20, 55, and 100-period benchmarks, reflecting broad counter-trend selling pressure against the still-rising 200-period major trend. The 4755.0 to 5010.5 pivot-resistance band defines the overhead recovery area, while 4000.9 is the immediate pivot support and 3405.2 is the next major structural support. The market retains a long-term uptrend foundation above the 200-period average, but the current weekly swing cycle is a fast downside retracement.
View charts on: AlphaWebTrader HTF Charts
ZB Weekly View
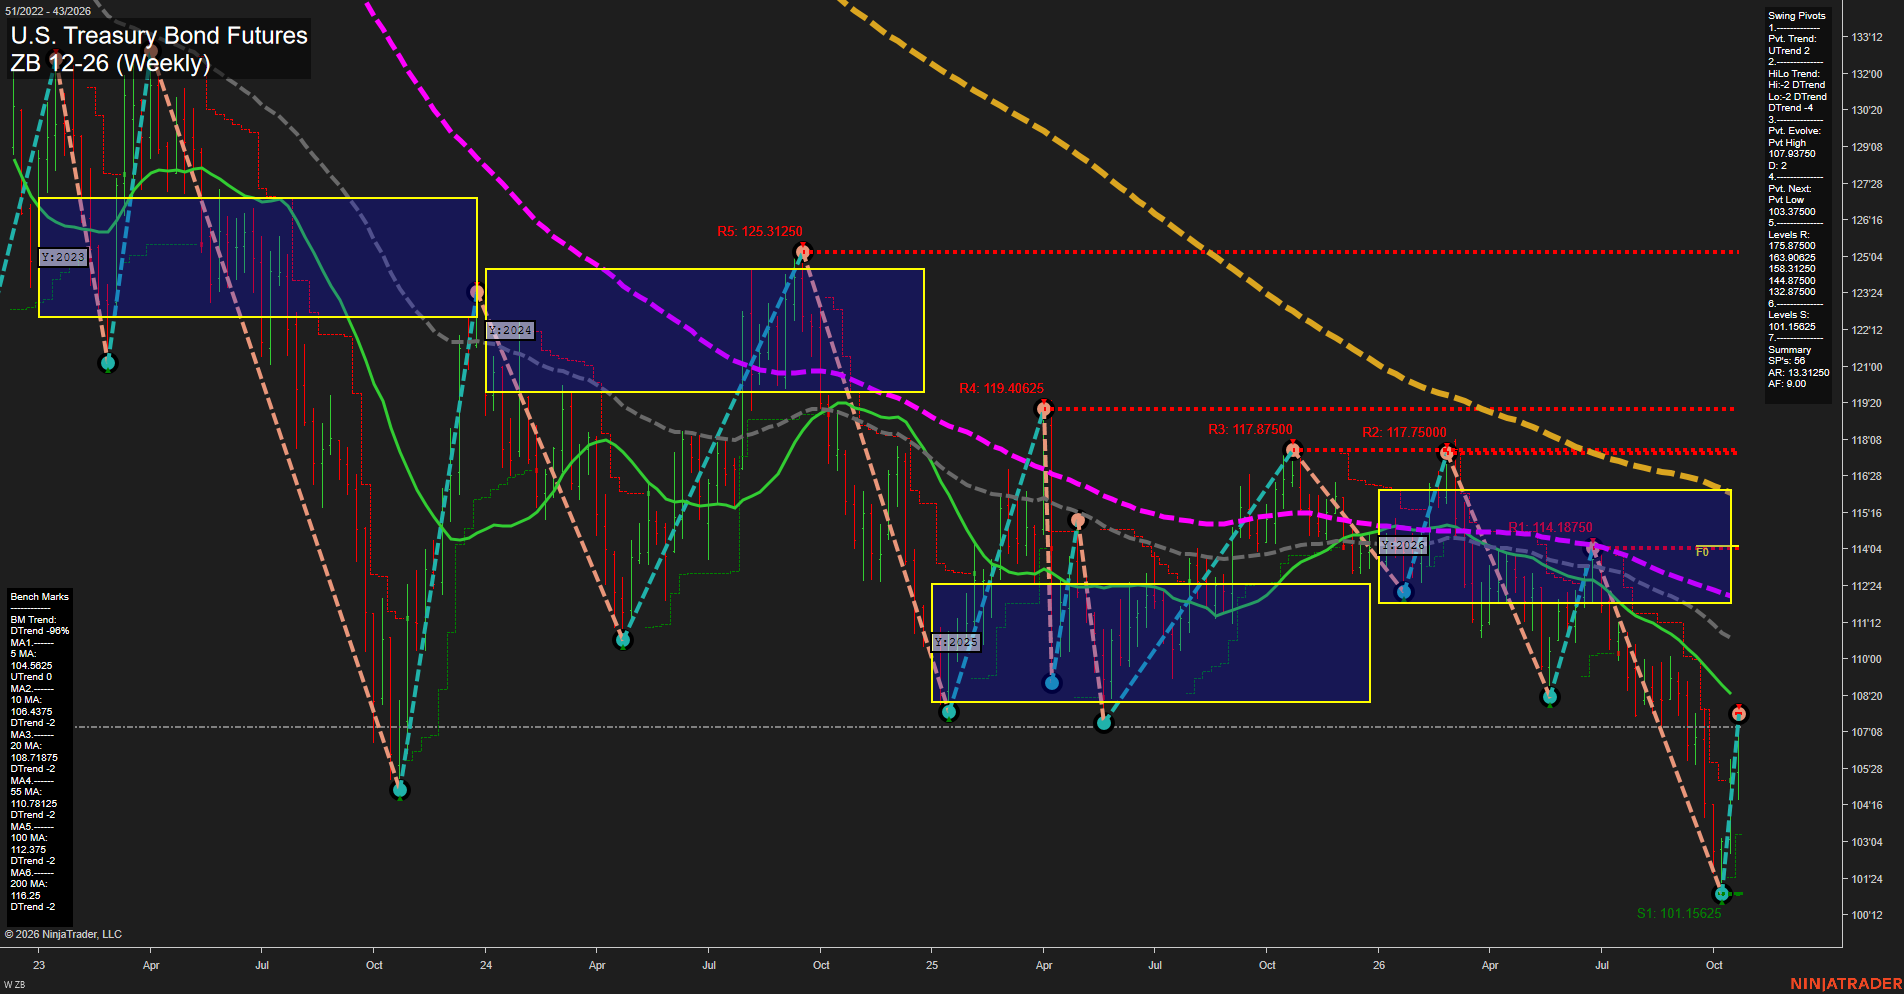
Overall Rating
- Short-Term: Bullish
- Intermediate-Term: Neutral
- Long-Term: Bearish.
Key Insights Summary
ZB has produced a sharp V-style rebound from the 101'05 support pivot, lifting the short-term pivot structure into UTrend and moving price above the weekly F0% level. The recovery has fast momentum, but price remains below the declining 20, 55, 100, and 200-period benchmarks, preserving the broader lower-high and lower-low structure. The 107'15 to 108'23 area, including the evolving pivot high and 20-period benchmark, defines the first meaningful rebound-resistance zone; the yearly grid remains bearish while price holds below its F0% level.
View charts on: AlphaWebTrader HTF Charts
Index ETFs
Mixed: average WOC% -0.29% from the week open, WNC% +0.25% versus the prior weekly close. Two of five index ETFs gained from the open, led by IWM; QQQ lagged, while DIA advanced and IJH slipped. Three finished above the prior weekly close, led by IWM, although its near-term downtrend persisted.