
U.S. stocks ended a volatile week lower as oil climbed on supply risks, gold fell below $4,000 and bonds weakened ahead of the October 28 Fed decision.
Fundamentals: U.S. stocks fell into Friday’s close and ended a volatile week lower, despite selective semiconductor buying supporting the Nasdaq relative to the broader market. Brent crude topped $116 as Middle East supply risks renewed inflation concerns and pressured bonds ahead of the October 28 Federal Reserve decision. Gold broke below $4,000, while concerns over AI funding and investment returns persisted.
Technicals: The S&P 500 and Nasdaq 100 ETFs rose 0.01% and 0.31% from the open, respectively, but finished 0.52% and 0.01% below their prior closes. Microsoft gained 1.31% from the open. Oil rose 2.02%, while gold fell 0.63% and far-term Treasury bonds lost 0.54%. Nasdaq futures remained bearish over near and medium horizons, despite an intact far-term bullish structure.
After Market Close daily snapshot: market news summary and sentiment, major ETFs, Magnificent 7 analysis, Indices Futures Higher Time Frame Analysis, and E-mini S&P500, Nasdaq 100, NYMEX Crude, Gold Futures Daily Chart analysis.
As of: October 23, 2026 05:00 CT
EcoNews Radar U.S. Events Day Recap
| Date/Day | Impact | Event | Time | Forecast | Previous | Info |
|---|---|---|---|---|---|---|
| 2026-10-23 – Friday | Medium | Flash Manufacturing PMI | 09:45 | 55.4 | 57.0 | An early survey of factory business conditions, covering output, orders and employment. Traders monitor it for signals about economic momentum, corporate earnings and interest-rate expectations. |
| 2026-10-23 – Friday | Medium | Flash Services PMI | 09:45 | 57.9 | 58.7 | An early survey of business conditions across service industries. Traders monitor it to gauge momentum in a large share of the economy and assess implications for earnings and monetary policy. |
| 2026-10-23 – Friday | Medium | Revised UoM Consumer Sentiment | 10:00 | 46.3 | 46.3 | An updated survey of households’ views on their finances and the economy. Traders monitor it for clues about consumer spending, a key driver of growth and corporate revenues. |
| 2026-10-23 – Friday | Medium | Revised UoM Inflation Expectations | 10:00 | — | 4.7% | An updated survey of households’ expected price increases over the next year. Traders monitor it for signs of inflation expectations becoming entrenched and implications for Federal Reserve policy. |
Summary: The calendar focuses on U.S. business conditions and household perceptions of the economy and inflation.
Conclusion: The releases are concentrated in a short morning window.
For full details visit: Forex Factory EcoNews
Market News Summary:
U.S. equities ended a volatile week lower as rising oil prices renewed inflation concerns ahead of the Federal Reserve decision, while AI investment returns remained under scrutiny.
Primary Drivers & Risks:
- Primary Driver: Oil surge pressures stocks and bonds
- Primary Risk: Inflation concerns ahead of Fed decision
Tone:
Risk-averse, with energy inflation and AI funding concerns outweighing selective semiconductor support.
Data, Market and System
Geopolitical:
A flare-up in Middle East violence threatened global oil supplies. Reports discussing further U.S. and Israeli strikes on Iran added weekend uncertainty; those additional strikes were not reported as confirmed events.
Oil / Energy:
Brent crude topped $116, with later coverage placing oil at a five-month high. The resurgence weighed on equities and bonds through renewed inflation concerns. Separately, Cheniere secured 4 million tonnes per annum in long-term LNG agreements with QatarEnergy through 2054, while Germany obtained additional winter gas supplies amid lagging storage.
Gold / Metals:
Gold initially rebounded around $4,000 as Treasury yields declined, then broke below that level ahead of the weekend despite the U.S. 10-year yield dropping below 5%. Later coverage identified $3,942 as the next support level under pressure. Precious metals remained weak alongside the oil rally.
Fed / Financials:
The October 28 Federal Reserve rate decision remained the central upcoming policy event. Treasury yields had fallen sharply on Thursday amid signs of easing AI-related debt supply, but Friday’s oil resurgence pressured bonds. Elevated borrowing costs continued to challenge premium equity valuations and financing for AI expansion.
Macro / Other:
Final October University of Michigan consumer sentiment slipped to 48 from 48.1 in September, a five-month low, while exceeding the preliminary reading and all surveyed estimates. High prices and rising interest rates depressed morale. Separate commentary highlighted recession concerns spreading from consumers into labor and credit markets, while American Express announced a 5% headcount reduction.
Conclusion:
Rising oil prices and renewed inflation concerns drove the late-session decline in stocks and pressure on bonds. The approaching Fed decision kept interest rates central to market attention.
AI financing and return concerns added pressure, despite pockets of semiconductor buying. Middle East supply risks and weak consumer sentiment added uncertainty, while gold’s break below $4,000 showed that falling Treasury yields did not provide sustained support.
Market News Sentiment
Sentiment Bias shows the balance of positive and negative news coverage sampled from 2026-10-22 19:03 to 2026-10-23 17:46 ET, covering stocks, energy and gold.
| Coverage | Info | ||||||||||
|---|---|---|---|---|---|---|---|---|---|---|---|
▼ Market news
| Sentiment Summary: Coverage leaned negative, with 31% negative, 17% positive and 52% neutral articles producing a -13% sentiment bias, as concerns over AI investment returns and financing competed with resilient economic activity and strength outside technology. Thursday’s technology selloff carried into lower U.S. futures early Friday and overnight Japanese weakness; scrutiny of Meta’s spending and cash flow, chip-equipment declines and hedge-fund losses reinforced pressure on the AI trade. Friday afternoon showed changing leadership: selective chip buying initially cushioned the Nasdaq while defensive sectors and the Dow weakened, although late-session coverage still had the Dow heading toward a third weekly gain before stocks ended lower. Friday’s S&P business surveys reported strong demand and hiring alongside rising prices, while the University of Michigan’s final October sentiment reading slipped to 48 from September’s 48.1, but exceeded the preliminary reading and economists’ estimates. Surging oil, record October ship attacks in the Strait of Hormuz and European gas prices at their highest since late 2022 added energy-supply and inflation concerns, alongside commentary linking higher rates to valuation compression. Counterweights included reported Treasury gains, the equal-weight S&P 500’s 4.1% gain since October began, American Express’s higher profit forecast and AI-linked power demand, leaving much of the neutral coverage focused on sector divergence rather than broad strength. Conclusion: The coverage describes uneven equity weakness, with AI financing concerns and energy-related inflation pressure offset by | ||||||||||
▼ GLD / Gold
| Sentiment Summary: Gold coverage was predominantly negative, with 64% negative versus 21% positive articles and a -43% sentiment bias, as selling continued from Thursday into Friday despite temporary stabilization. Early Asian coverage reported easing selling pressure but insufficient buying interest; subsequent reports linked renewed Middle East and Hormuz tensions, rising crude prices and oil-driven inflation concerns to expectations of restrictive Federal Reserve policy, including December hike risk. Friday’s completed releases added mixed context: stable manufacturing and services activity was reported as reducing gold’s safe-haven demand, while final October University of Michigan consumer sentiment was 48, above the 46.3 consensus but slightly below September’s 48.1, alongside higher inflation expectations. Falling Treasury yields provided a counterweight and supported a midday rebound around $4,000, although elevated real yields continued to limit upside; late coverage reported a renewed break below $4,000 even with the 10-year Treasury yield below 5%. Reports also described stocks selling off while Treasuries rallied and gold declined, highlighting divergent defensive-asset performance rather than a uniform haven response. Conclusion: For indices futures day traders, the supported cross-market context combines equity weakness with oil-led inflation pressure and persistent rate concerns, despite lower Treasury yields. The October 28 Fed decision remained an upcoming catalyst, while gold’s late-session loss of $4,000 underscored the fragility of its earlier stabilization. | ||||||||||
▼ USO / Oil
| Sentiment Summary: Oil coverage was slightly negative overall, with 35% negative, 30% positive and 35% neutral sentiment; positive crude-price coverage contrasted with reported pressure on equities and fuel-sensitive sectors. After an Asian-session pullback reported Thursday evening, Friday’s coverage emphasized renewed U.S.–Iran conflict risk, threats to Gulf oil and technology facilities, and claimed Houthi attacks on Saudi infrastructure; Brent subsequently reached $116.26, up 2.7% and more than 10% for the week. Falling U.S. crude inventories also supported prices, while important supply counterweights included largely recovered Middle East crude flows near 24 million barrels per day and Friday’s authorization of an emergency U.S. strategic-reserve release of up to 400,000 barrels, although regional refined-product flows remained 50% below prewar levels. Equity reports linked the oil surge and AI-spending concerns to a 700-point Dow decline, while American Airlines fell 4% and Delta and United slid 3%, reversing airline-sector relief after earnings. Cross-market coverage described a technology-led flight into Treasuries before the yield decline eased Friday morning, alongside oil-related rate concerns pressuring gold; record refining margins offered a positive earnings counterweight for oil majors ahead of quarterly results. Conclusion: The coverage describes an equity risk-off backdrop alongside strong crude prices, rather than uniformly negative energy fundamentals. Recovering crude exports and emergency supply measures provided counterweights, but reported infrastructure |
Glossary: Sentiment Bias = (positive articles − negative articles) ÷ total articles × 100. It ranges from −100% negative to +100% positive. A reading near zero indicates little directional bias. Neutral articles reduce the score’s strength. ▲ positive; ▼ negative; — balanced. These readings describe news coverage, not market-price direction.
Market Technical Analysis
Analysis of VIX volatility, the completed session in major ETFs and mega-cap tech stocks, and futures snapshots and higher-time-frame analysis.
VIX — Market Fear Gauge Daily
| Level | Open | High | MaxVix | Low | MinVix | DNC% | DOC% | VR | MaxVR | MinVR |
|---|---|---|---|---|---|---|---|---|---|---|
| 19.45 | 20.10 | 20.66 | 22.31 | 18.88 | 14.77 | +2.21% | -3.23% | 4.23 | 41.30 | -2.03 |
VIX fell 3.23% from the session's opening level. VIX rose 2.21% versus the previous session close. Expected volatility eased from the period open. VIX is 62.1% up the recent 15-session range (14.77–22.31), in the 60–70% band.
VR: ATN Volatility Ratio (VR): 4.23 – Stocks fell while expected volatility rose. VR is in the lower part of its preceding 15-session VR range (-2.03 to 41.30), in the 10–20% band. VR fell 7.70 points from the previous session, a moderate shift relative to that range.
Range lookback: preceding 15 completed sessions.
Major ETFs and Mega Cap Tech Stocks
U.S. stocks fell into the close after earlier Dow weakness and selective chip buying supported the Nasdaq relative to the broader market. Defensive sectors also weakened. AI shares traded more quietly after the previous session’s slump, but concerns about capital spending, funding needs, and investment returns persisted. Bullish leveraged semiconductor ETF positions suffered losses despite record inflows the prior week. Earnings releases added report-driven volatility.
ETF, Mag7, and Cross-Market ETF Insights
Overall Tone
Daily risk tone was broadly defensive, though intraday resilience and a sharp oil advance made the retreat uneven.
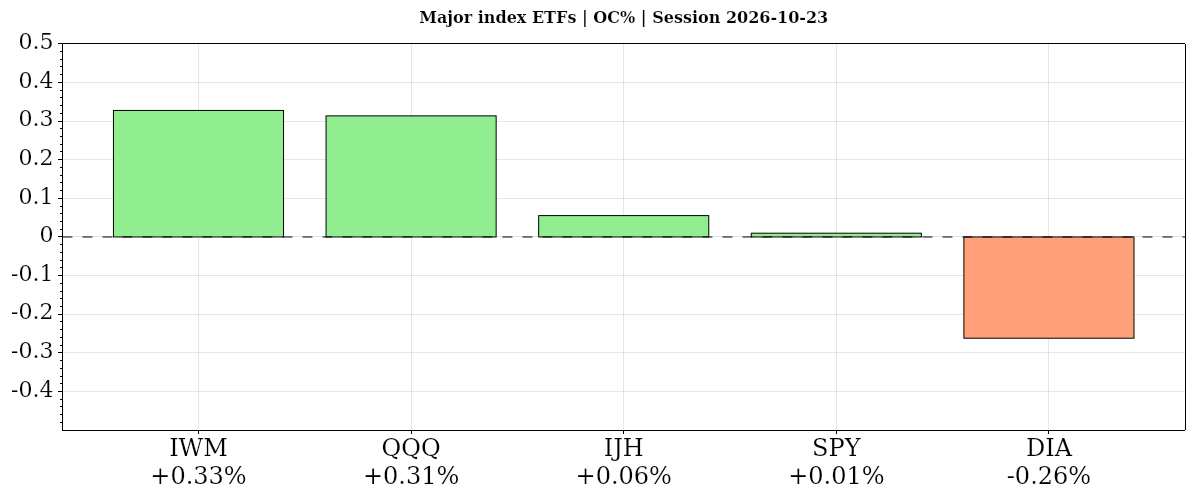
| Instrument | Bias | Date | DNC% | DOC% | O | H | L | C | VWAP | Vol |
|---|---|---|---|---|---|---|---|---|---|---|
| ▲ IWM | ▼ ▲ ▲ | 2026-10-23 | ▼ -0.33% | ▲ +0.33% | 274.85 | 276.24 | 273.35 | 275.75 | ▲ 275.29 | 20,819,392 |
| ▲ QQQ | ▼ ▲ ▼ | 2026-10-23 | ▼ -0.01% | ▲ +0.31% | 702.20 | 709.30 | 701.16 | 704.40 | ▼ 705.42 | 29,638,600 |
| ▲ IJH | ▼ ▲ ▲ | 2026-10-23 | ▼ -0.59% | ▲ +0.06% | 72.33 | 72.62 | 71.87 | 72.37 | ▲ 72.35 | 5,355,035 |
| ▲ SPY | ▼ ▲ ▼ | 2026-10-23 | ▼ -0.52% | ▲ +0.01% | 759.90 | 763.47 | 758.68 | 759.97 | ▼ 760.77 | 33,112,524 |
| ▼ DIA | ▼ ▼ ▼ | 2026-10-23 | ▼ -1.24% | ▼ -0.26% | 522.74 | 523.70 | 519.88 | 521.37 | ▼ 522.02 | 2,857,655 |
| AVG/Sum | — | — | -0.54% | +0.09% | — | — | — | — | — | 91,783,206 |
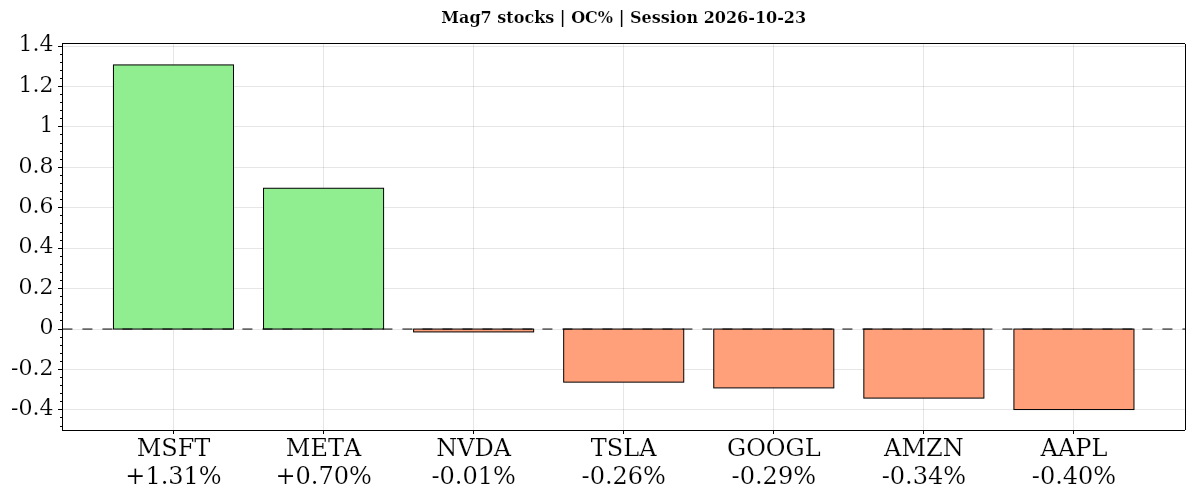
| Instrument | Bias | Date | DNC% | DOC% | O | H | L | C | VWAP | Vol |
|---|---|---|---|---|---|---|---|---|---|---|
| ▲ MSFT | ▲ ▲ ▲ | 2026-10-23 | ▲ +0.66% | ▲ +1.31% | 517.75 | 525.77 | 515.70 | 524.51 | ▲ 523.31 | 13,396,359 |
| ▲ META | ▼ ▲ ▼ | 2026-10-23 | ▼ -0.96% | ▲ +0.70% | 638.17 | 648.04 | 633.27 | 642.62 | ▼ 643.25 | 14,706,091 |
| ▼ NVDA | ▼ ▼ ▼ | 2026-10-23 | ▼ -0.59% | ▼ -0.01% | 210.99 | 213.85 | 210.18 | 210.96 | ▼ 211.91 | 78,096,384 |
| ▼ TSLA | ▼ ▼ ▲ | 2026-10-23 | ▼ -0.63% | ▼ -0.26% | 373.20 | 377.32 | 365.27 | 372.22 | ▲ 371.86 | 34,782,708 |
| ▼ GOOGL | ▼ ▼ ▼ | 2026-10-23 | ▼ -1.24% | ▼ -0.29% | 321.14 | 324.53 | 320.18 | 320.21 | ▼ 321.89 | 17,590,246 |
| ▼ AMZN | ▼ ▼ ▼ | 2026-10-23 | ▼ -0.95% | ▼ -0.34% | 248.85 | 250.01 | 246.45 | 248.00 | ▼ 248.45 | 25,419,607 |
| ▼ AAPL | ▼ ▼ ▼ | 2026-10-23 | ▼ -0.14% | ▼ -0.40% | 349.12 | 351.73 | 345.75 | 347.73 | ▼ 348.03 | 40,020,875 |
| AVG/Sum | — | — | -0.55% | +0.10% | — | — | — | — | — | 224,012,270 |
Mag7 Stocks
Microsoft alone gained versus the prior close, rising 0.66% and advancing 1.31% from the open, with all directional measures aligned positively. Alphabet was the largest daily laggard, while Apple, Amazon and Nvidia also showed consistently negative direction. Meta rebounded 0.70% from the open but remained down 0.96% versus the prior close; Tesla also declined despite a positive VWAP bias.
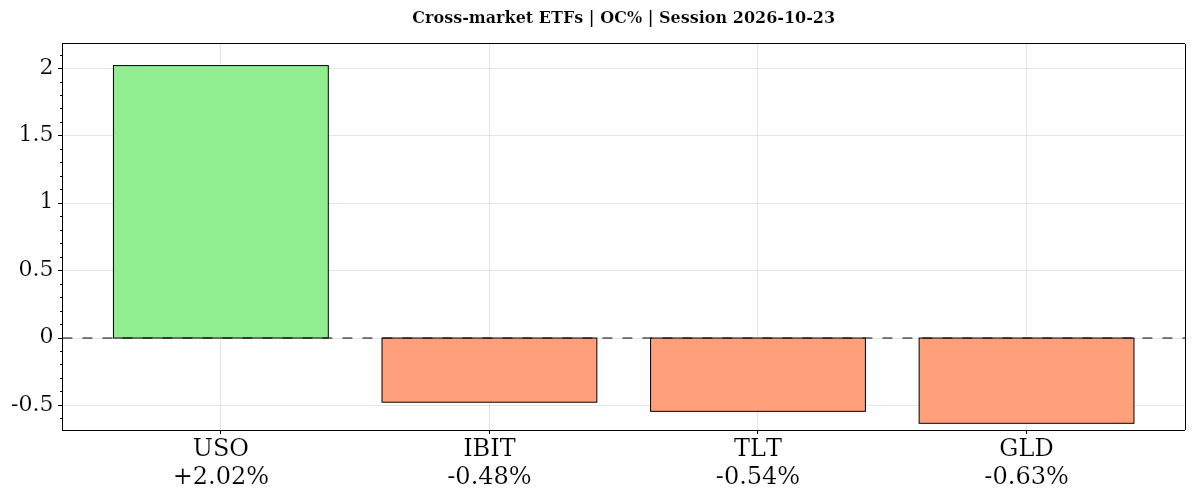
| Instrument | Bias | Date | DNC% | DOC% | O | H | L | C | VWAP | Vol |
|---|---|---|---|---|---|---|---|---|---|---|
| ▲ USO | ▲ ▲ ▲ | 2026-10-23 | ▲ +4.32% | ▲ +2.02% | 166.17 | 169.96 | 166.04 | 169.53 | ▲ 168.13 | 6,331,989 |
| ▼ IBIT | ▼ ▼ ▼ | 2026-10-23 | ▼ -0.22% | ▼ -0.48% | 46.18 | 46.41 | 45.81 | 45.96 | ▼ 46.12 | 22,744,158 |
| ▼ TLT | ▼ ▼ ▼ | 2026-10-23 | ▼ -0.49% | ▼ -0.54% | 81.78 | 81.80 | 81.27 | 81.34 | ▼ 81.44 | 34,576,600 |
| ▼ GLD | ▼ ▼ ▲ | 2026-10-23 | ▼ -0.65% | ▼ -0.63% | 368.94 | 369.25 | 364.33 | 366.61 | ▲ 366.59 | 9,921,237 |
| AVG/Sum | — | — | +0.74% | +0.09% | — | — | — | — | — | 73,573,984 |
Cross-Market ETFs
Oil diverged sharply from equities: USO rose 4.32% versus the prior close and 2.02% from the open. Long-duration Treasuries, gold and bitcoin ETFs instead declined on both comparisons, offering no positive daily offset; gold’s positive VWAP bias contrasted with its losses.
Glossary: Instrument — ticker symbol; hover for the instrument or company name; Date — session date. DNC% — prior-session close to this session’s close; DOC% — daily session open-to-close percentage change. O — open; H — high; L — low; C — close, all for the table’s daily or weekly session; VWAP — volume-weighted average price; its arrow shows whether the close is above or below VWAP. Vol — period trading volume.
Bias — three directional readings, in order: DNC%, DOC%, then VWAP. ▲ positive/above; ▼ negative/below; — neutral or unavailable. Matching arrows show alignment; opposing arrows show mixed conditions. AVG/Sum — simple average of percentage changes and sum of reported volumes.
Futures Session Fib Grid Analysis – Snapshot
Session Fib Grids normalise market positioning as percentages, making direction and alignment comparable across different asset types.
Latest available snapshot for each instrument; Time(CT) shows the individual update date and time.
| Instrument | Bias | Time(CT) | YSFG | MSFG | WSFG | RSFG | SFG | TSI |
|---|---|---|---|---|---|---|---|---|
| ▲ ES | ▲ ▼ ― ▲ ▲ ▼ | 2026-10-23 11:31:52 | ▲ +51 | ▼ -25 | — 0 | ▲ +20 | ▲ +20 | ▼ -15 |
| ▲ NQ | ▲ ▼ ― ▲ ▲ ▲ | 2026-10-23 11:31:50 | ▲ +59 | ▼ -78 | — 0 | ▲ +31 | ▲ +31 | ▲ +55 |
| ▼ YM | ▲ ▲ ▲ ▼ ▼ ▼ | 2026-10-23 11:31:52 | ▲ +34 | ▲ +55 | ▲ +39 | ▼ -3 | ▼ -3 | ▼ -21 |
| ▲ EMD | ▲ ▲ ▲ ▲ ▲ ▲ | 2026-10-23 11:31:50 | ▲ +26 | ▲ +3 | ▲ +8 | ▲ +19 | ▲ +19 | ▲ +38 |
| ▲ RTY | ▲ ▼ ▲ ▲ ▲ ▲ | 2026-10-23 11:31:50 | ▲ +31 | ▼ -30 | ▲ +65 | ▲ +20 | ▲ +20 | ▲ +56 |
| ▼ FDAX | ▲ ▲ ▼ ▼ ▲ ▲ | 2026-10-23 11:31:43 | ▲ +6 | ▲ +5 | ▼ -66 | ▼ -64 | ▲ +17 | ▲ +26 |
| ▲ NKD | ▲ ▼ ▼ ▲ ▲ ▲ | 2026-10-23 11:31:14 | ▲ +144 | ▼ -83 | ▼ -16 | ▲ +27 | ▲ +29 | ▲ +73 |
| Instrument | Bias | Time(CT) | YSFG | MSFG | WSFG | RSFG | SFG | TSI |
|---|---|---|---|---|---|---|---|---|
| ▲ BTC | ▼ ▼ ▼ ▲ ▼ ▼ | 2026-10-23 11:31:28 | ▼ -33 | ▼ -19 | ▼ -6 | ▲ +2 | ▼ -2 | ▼ -18 |
| ▼ GC | ▼ ▼ ▼ ▼ ▼ ▼ | 2026-10-23 11:31:46 | ▼ -142 | ▼ -51 | ▼ -121 | ▼ -38 | ▼ -39 | ▼ -30 |
| ▲ CL | ▲ ▲ ▲ ▲ ▲ ▲ | 2026-10-23 11:31:48 | ▲ +193 | ▲ +92 | ▲ +49 | ▲ +57 | ▲ +46 | ▲ +214 |
| ▼ 6E | ▼ ▼ ▼ ▼ ▼ ▼ | 2026-10-23 11:31:45 | ▼ -57 | ▼ -70 | ▼ -8 | ▼ -2 | ▼ -7 | ▼ -108 |
| ▼ ZB | ▼ ▲ ▲ ▼ ▼ ▲ | 2026-10-21 09:39:59 | ▼ -39 | ▲ +77 | ▲ +6 | ▼ -3 | ▼ -2 | ▲ +29 |
Glossary: YSFG — yearly; MSFG — monthly; WSFG — weekly; RSFG — regular trading hours (RTH); SFG — the current session, including pre-market or other sessions. TSI indicates trend strength and power.
Bias shows trend alignment across these six readings. The arrows follow the column order: YSFG, MSFG, WSFG, RSFG, SFG and TSI. Matching arrows show alignment; opposing arrows show mixed conditions.
Futures Higher Time Frame Analysis
Summary of the current state of US Indices Futures based on higher time-frame (HTF) technical analysis as of: 2026-10-23: 17:01 CT.
US Indices Futures
- ES YSFG bullish, MSFG below F0%, WSFG above F0%, declining daily benchmarks, pivot DTrend, support 7672.75–7676.00, reversal 7824.00, resistance 7897.50–7906.25.
- NQ YSFG bullish, MSFG/WSFG below F0%, below benchmarks through 100-day, pivot DTrend, support 29022.75–29027.75, rising 200-day 28425.25, reversal 30114.50.
- YM YSFG/MSFG/WSFG above F0%, rising longer-term benchmarks, daily pivot UTrend, below 100-day 52854, support 51970/50859, resistance 53118/54259–54294.
- EMD YSFG/MSFG/WSFG above F0%, below daily 5–200-day benchmarks, pivots DTrend, support 3600.3–3609.1, reversal 3708.7, resistance 3737.8.
- RTY YSFG/WSFG above F0%, MSFG below F0%, declining intermediate daily benchmarks, pivot DTrend, support 2723.2–2723.3, reversal 2803.7, resistance 2887.2.
- FDAX YSFG/MSFG bullish, WSFG below F0%, below 5/10/20-week benchmarks, rising 55/100/200-week benchmarks, pivot DTrend, support 24925, reversal 26255, resistance 26847.
Overall State
- Short-Term: Bearish
- Intermediate-Term: Neutral
- Long-Term: Bullish
Conclusion
Short-term downside pivot alignment spans ES, NQ, EMD, RTY, and FDAX; YM leads with a daily UTrend and all three Fib grids above F0%. NQ lags with both MSFG and WSFG below F0% and price below benchmarks through the 100-day. ES and RTY retain bearish monthly positioning despite holding above weekly F0%. EMD’s grid alignment contrasts with daily benchmark and pivot weakness. Broad yearly structures and rising longer-term weekly benchmarks preserve the long-term bullish context, while intermediate conditions remain mixed. Recent RTY rebound momentum has not reversed its daily DTrend; YM’s rejection below 53118 remains a retracement within its daily UTrend.
Note: Intra-day counter-trend pullbacks or retracements may occur, HTF is context for informational usage and market structure. Glossary: Session Fib Grids periods of YSFG:’Yearly’, MSFG:’Monthly’, WSFG:’Weekly’
For full details visit: AlphaWebTrader Technicals
SPY Daily View
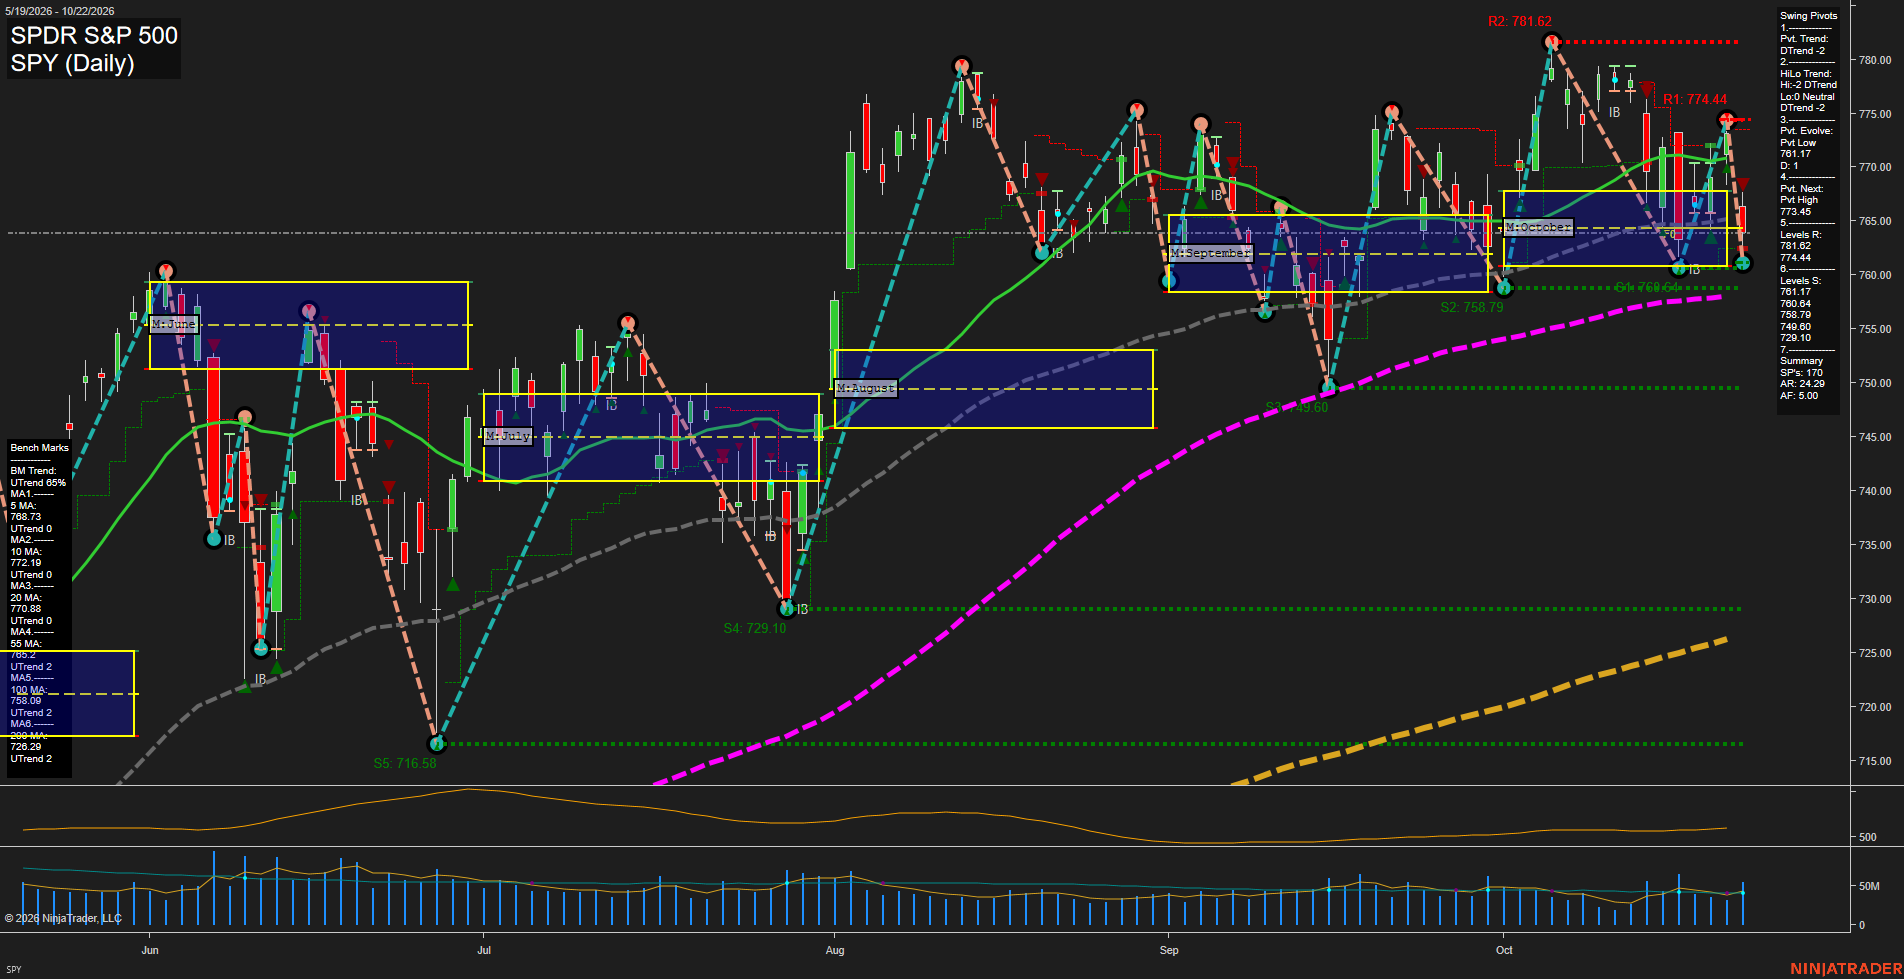
Overall Rating
- Short-Term: Bearish
- Intermediate-Term: Bearish
- Long-Term: Bullish.
Key Insights Summary
The SPY proxy for index futures reflects a sharp short-term downside rotation, with the large decline closing below the 5, 10, 20, and 55-day benchmarks. The active pivot structure is a DTrend and the next upside pivot threshold is 773.45, while 761.17 and 760.64 define the immediate downside pivot/support cluster. For a futures swing-trader market read, this is a countertrend pullback within a still-positive long-term moving-average structure: price remains above the rising 100-day and 200-day benchmarks. The 774.44 to 781.62 resistance zone marks the prior swing-high supply area, while a sustained break beneath the 758.79 to 749.60 support band would extend the intermediate corrective sequence.
View charts on: AlphaWebTrader HTF Charts
ES Daily View
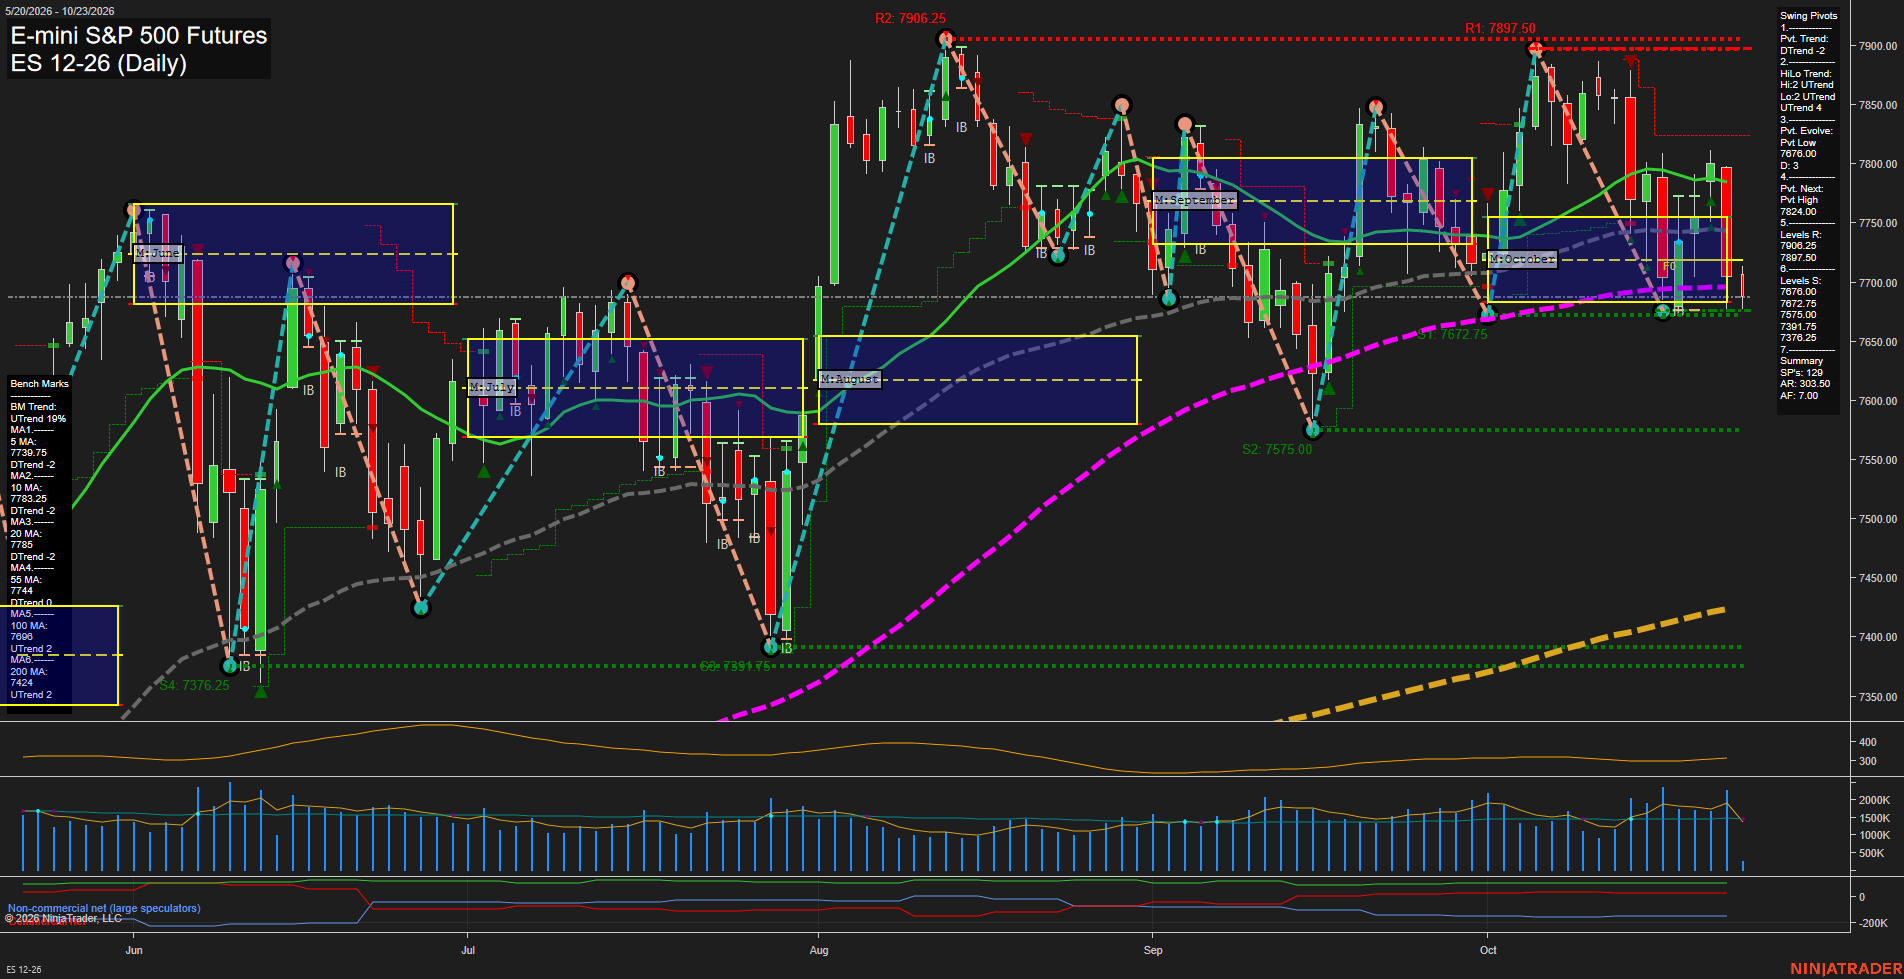
Overall Rating
- Short-Term: Neutral
- Intermediate-Term: Bearish
- Long-Term: Bullish.
Key Insights Summary
Price is consolidating below the declining 10, 20, and 55-day benchmarks after rejection from the early-October high zone near 7900. The short-term pivot sequence remains in DTrend, although price is holding above the weekly F0% area and the 7676.00 to 7672.75 support cluster. Intermediate structure is corrective as the October MSFG remains below F0%, while the annual grid and rising 100-day and 200-day averages preserve the broader bullish trend. The chart reflects a choppy retracement within a larger uptrend, with 7824.00 as the next pivot reversal level and 7897.50 to 7906.25 as major overhead resistance.
View charts on: AlphaWebTrader HTF Charts
QQQ Daily View
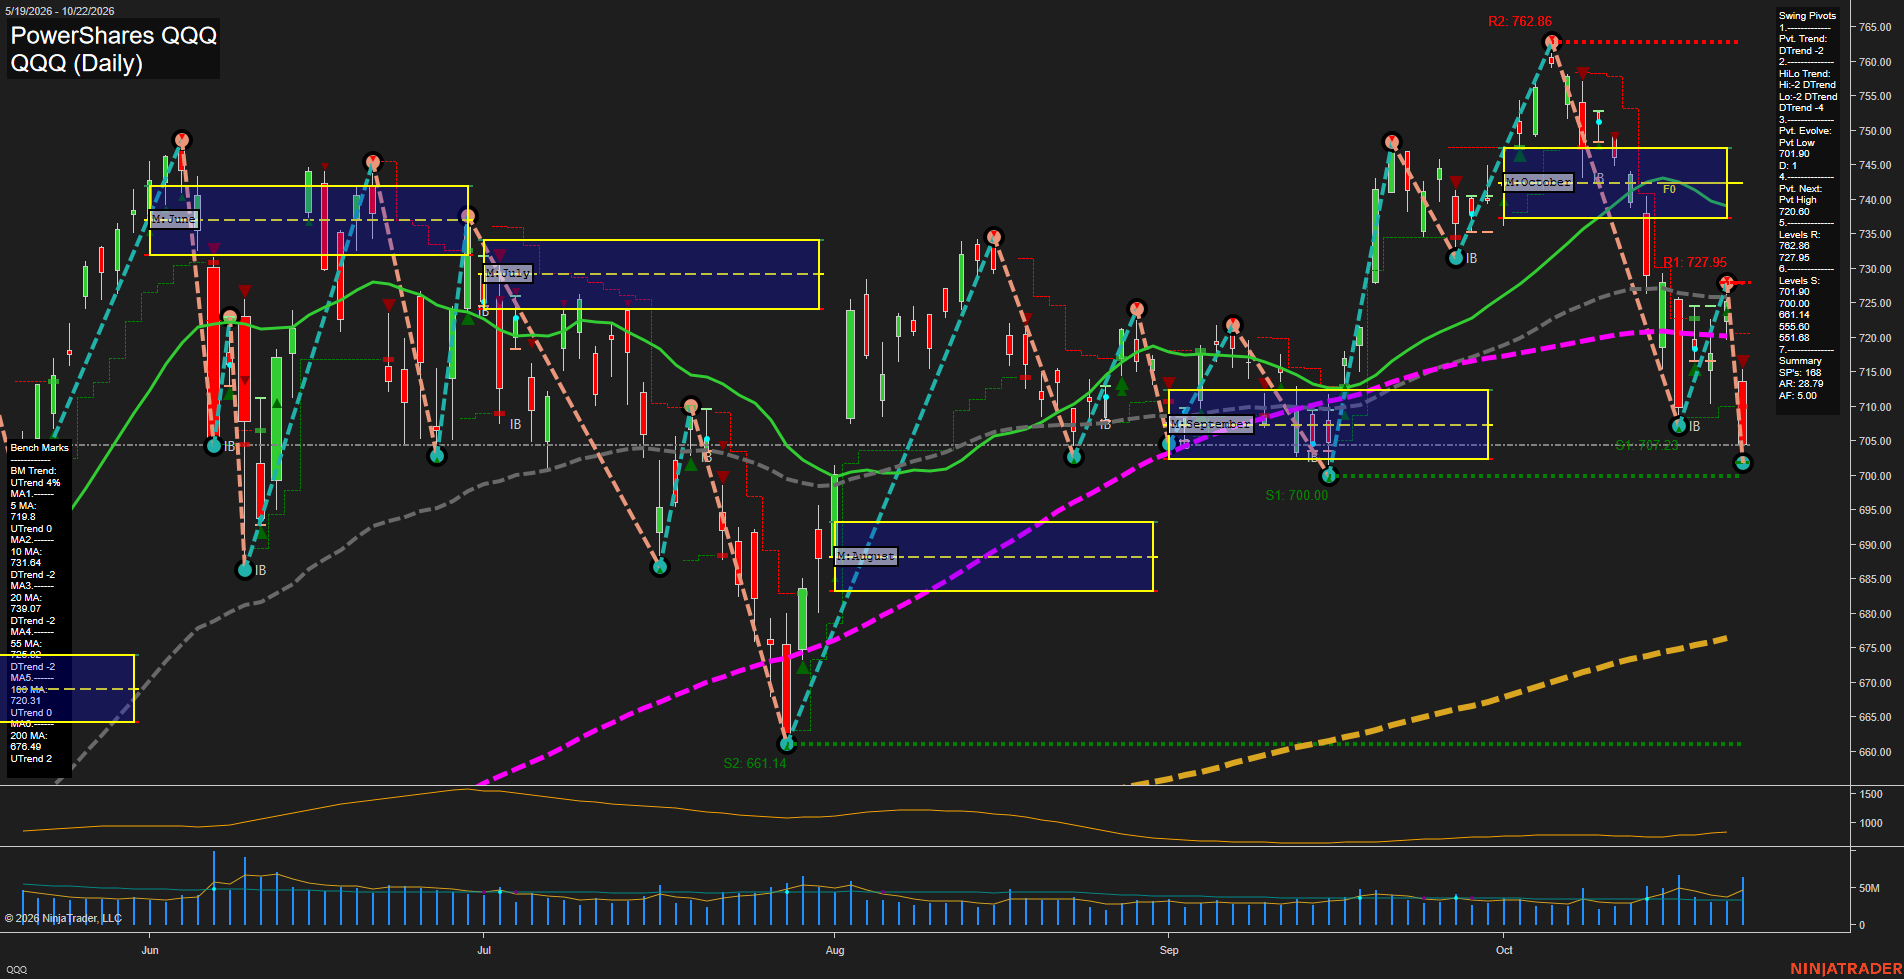
Overall Rating
- Short-Term: Bearish
- Intermediate-Term: Bearish
- Long-Term: Bullish.
Key Insights Summary
QQQ, as a liquid proxy for Nasdaq futures swing conditions, shows a fast downside impulse with a large red daily bar pressing the 701.90 pivot-low support. Both the short-term pivot trend and intermediate HiLo trend are down, while price remains beneath the declining 10-, 20-, and 55-day benchmarks. The 720.60 pivot-high reversal threshold and 727.95 resistance define the overhead countertrend zone. Long-term structure remains positive because the rising 100- and 200-day averages are materially below price, framing the current action as a sharp intermediate pullback within a broader long-term uptrend.
View charts on: AlphaWebTrader HTF Charts
NQ Daily View
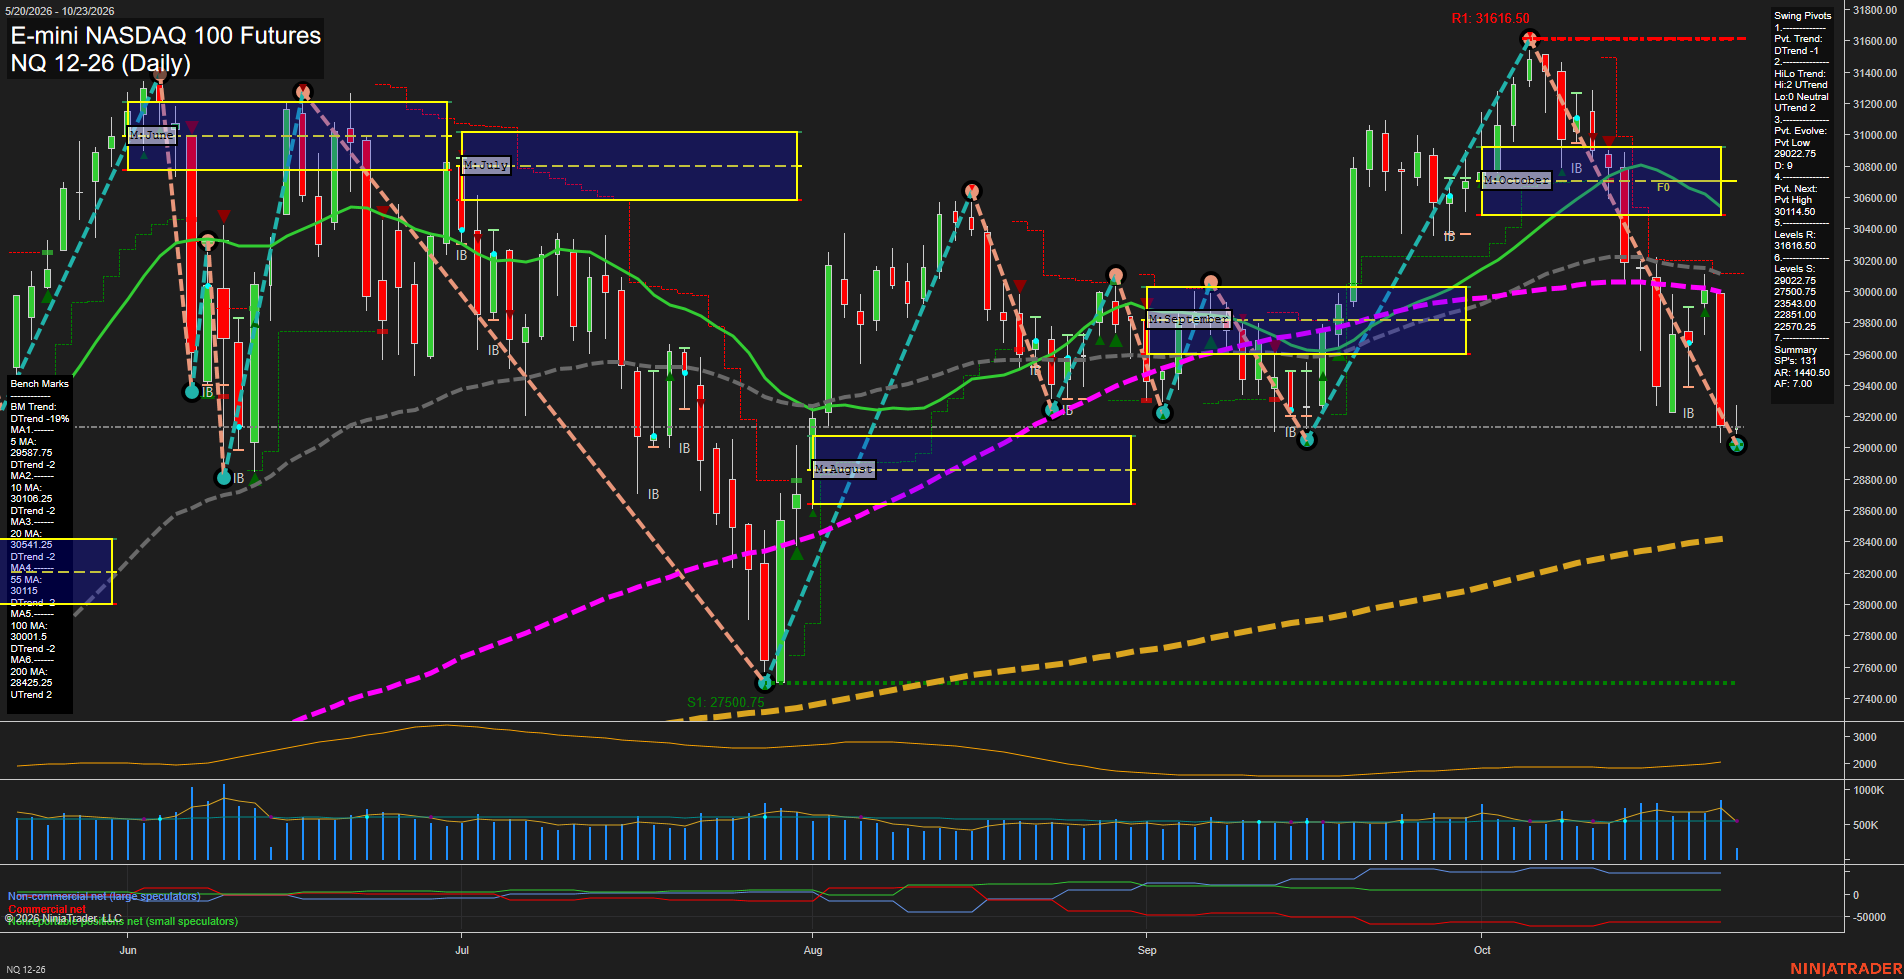
Overall Rating
- Short-Term: Bearish
- Intermediate-Term: Bearish
- Long-Term: Bullish.
Key Insights Summary
Price is in a fast, high-range decline from the October swing high near 31616.50 and has reached the active 29027.75 swing-low support. Short-term structure is bearish, with price below every benchmark through the 100-day average and both weekly and monthly Fib-grid readings below their F0% levels. The intermediate HiLo trend remains upward, creating a countertrend condition within the larger 2026 advance; however, the current decline has produced lower highs and lower lows. The 200-day average remains rising beneath price near 28425.25, while the next lower structural support is 27500.75. A recovery through 30114.50 would establish the next short-term pivot-high reversal threshold.
View charts on: AlphaWebTrader HTF Charts
USO Daily View
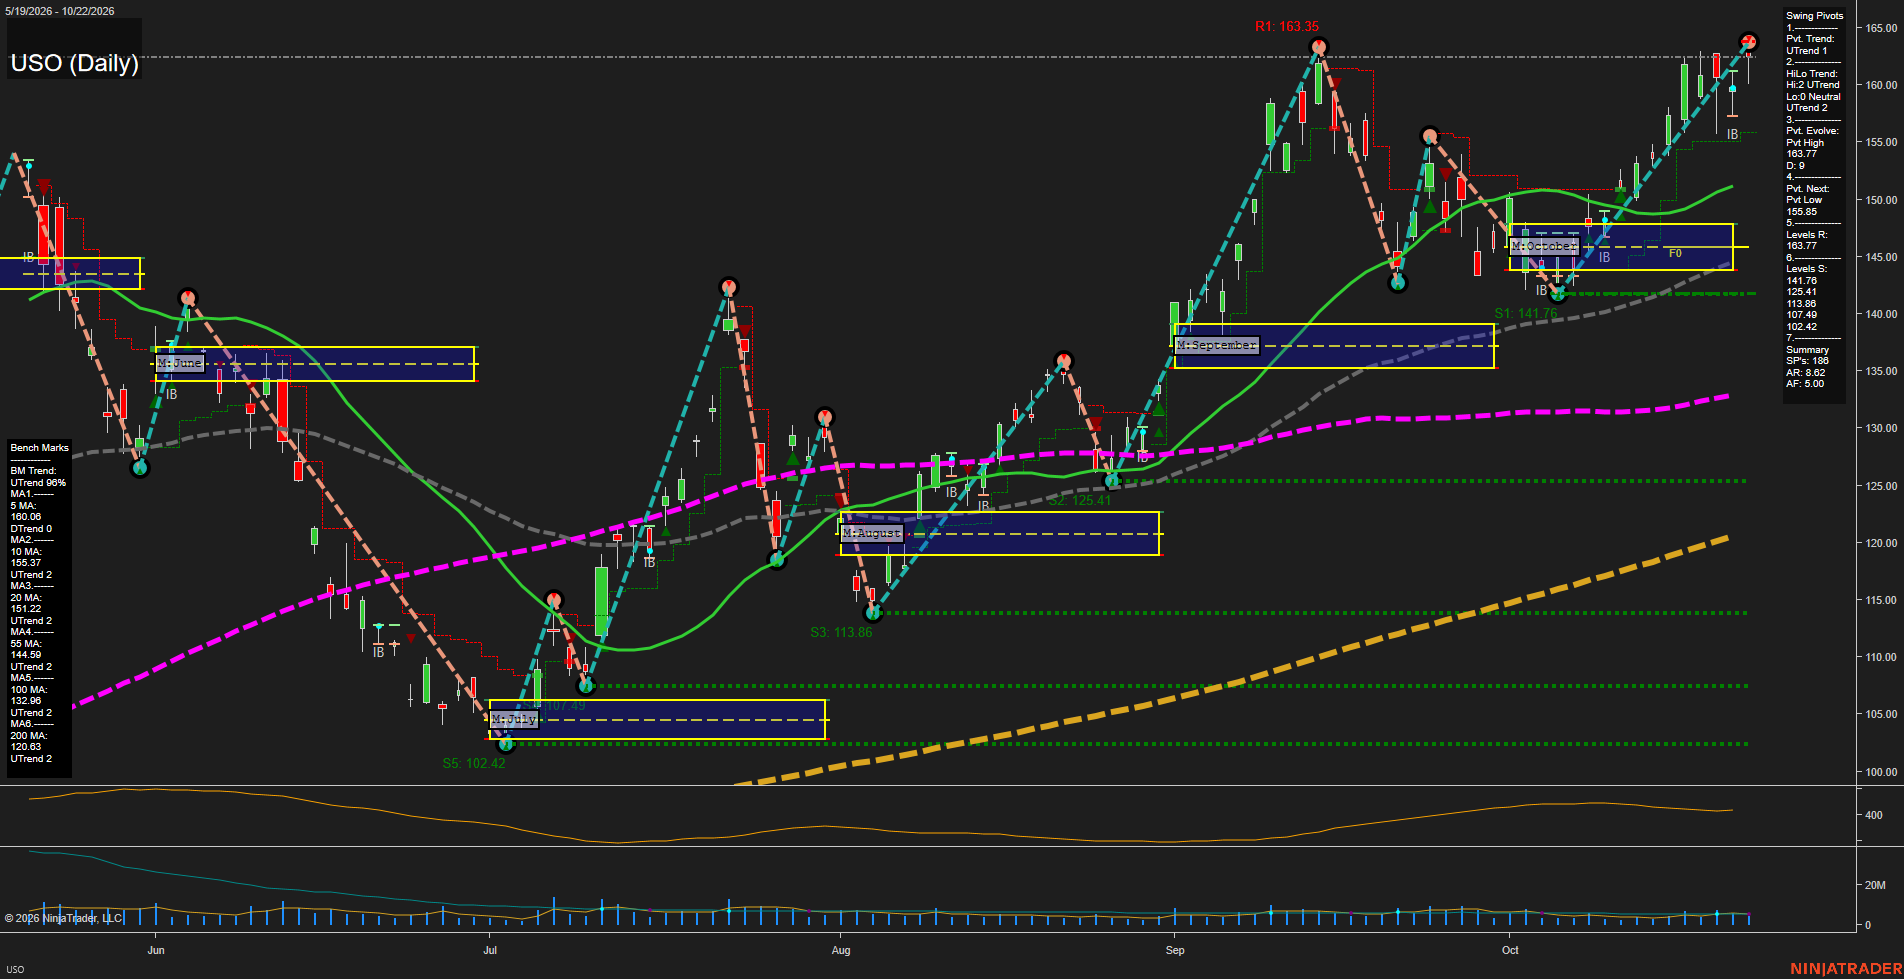
Overall Rating
- Short-Term: Bullish
- Intermediate-Term: Bullish
- Long-Term: Bullish.
Key Insights Summary
USO is in a broad daily-chart advance, with price holding above every benchmark average and the moving-average structure positively aligned from the 5-day through 200-day measures. The latest rally has produced higher highs and higher lows, while the pivot structure remains in UTrend on both short- and intermediate-term measures. Price is pressing the 163.77 pivot-high resistance area after a fast upside leg from the October NTZ, making the current phase extended relative to the 5-day and 10-day averages. The 155.85 next-pivot level defines the nearest swing retracement reference, while the October MSFG and 20-day average near 151.22 provide the principal intermediate trend zone. Rising ATR reflects expanded daily range and an active crude-oil volatility cycle.
View charts on: AlphaWebTrader HTF Charts
CL Daily View
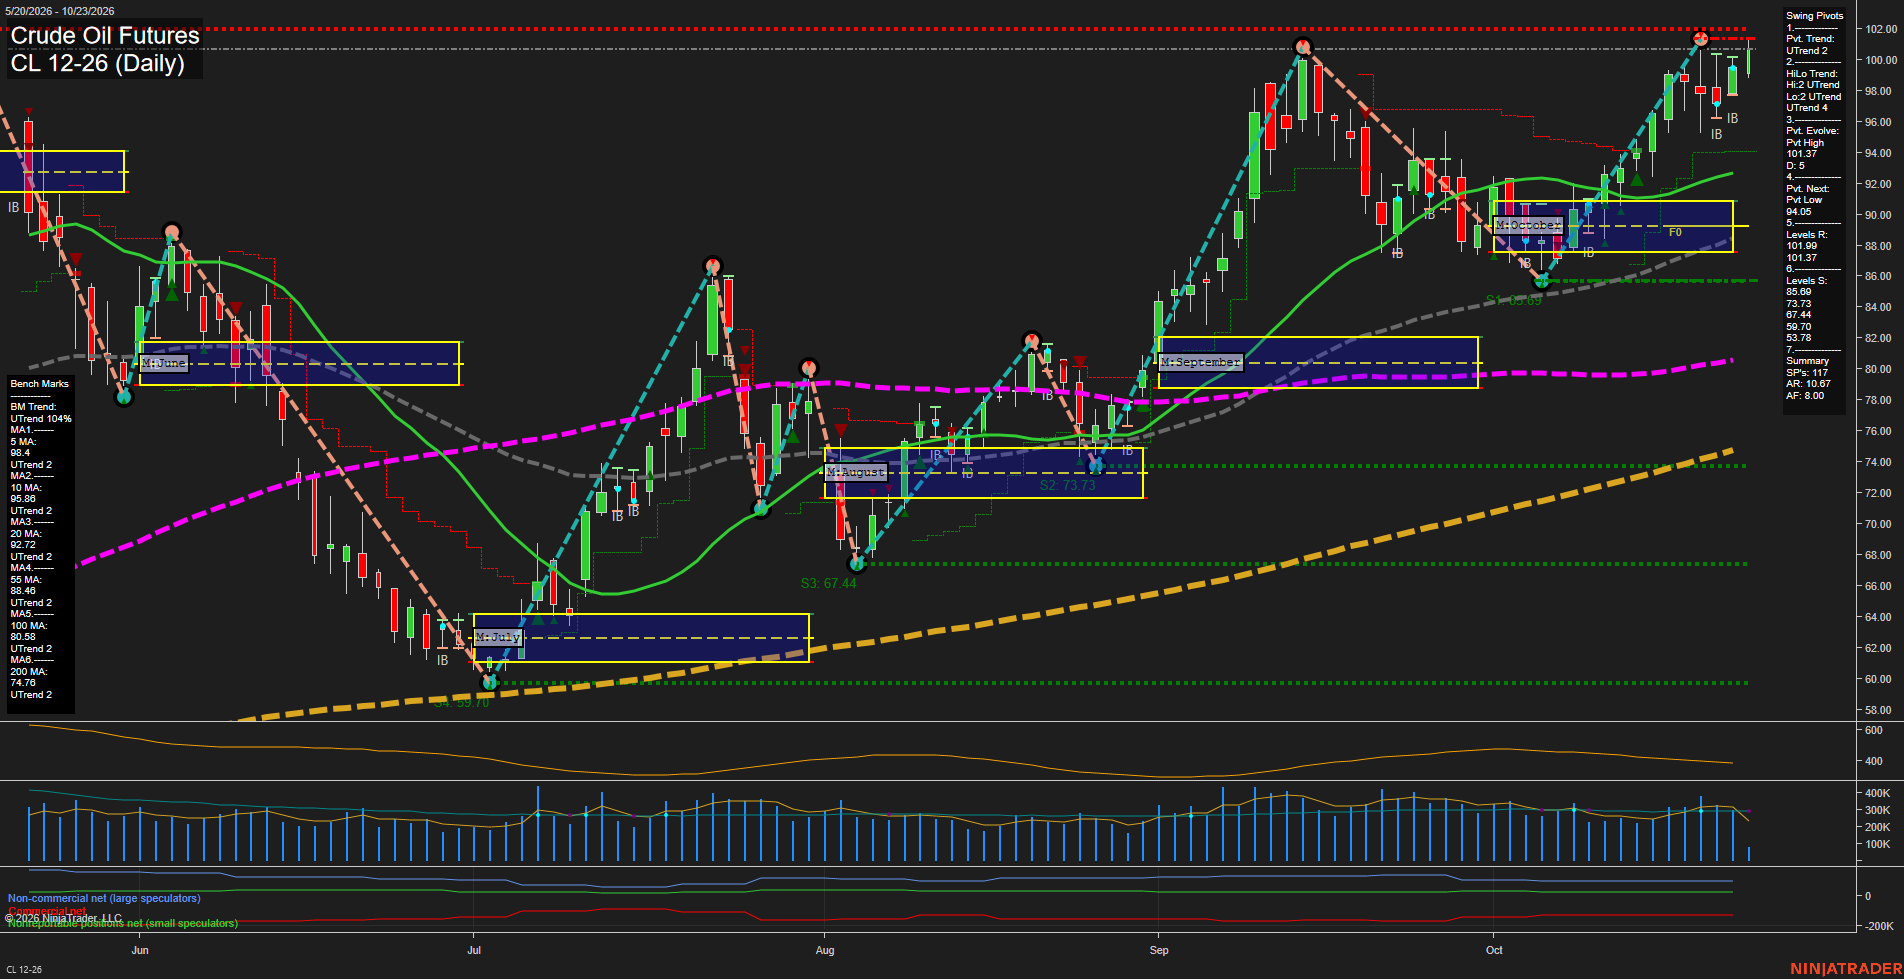
Overall Rating
- Short-Term: Bullish
- Intermediate-Term: Bullish
- Long-Term: Bullish.
Key Insights Summary
CL remains in a broad daily-chart advance, with price above every benchmark moving average and all benchmark trends aligned upward. The recent decline from the 101.37 pivot high appears as a pullback within that larger uptrend, followed by a rebound that has restored price above the weekly and monthly Fib-grid centers. Near-term action remains below the 101.37 pivot resistance, while 94.05 defines the next swing-pivot reversal level. The current structure shows higher-level trend strength with moderate momentum rather than an extended high-velocity breakout.
View charts on: AlphaWebTrader HTF Charts
GLD Daily View
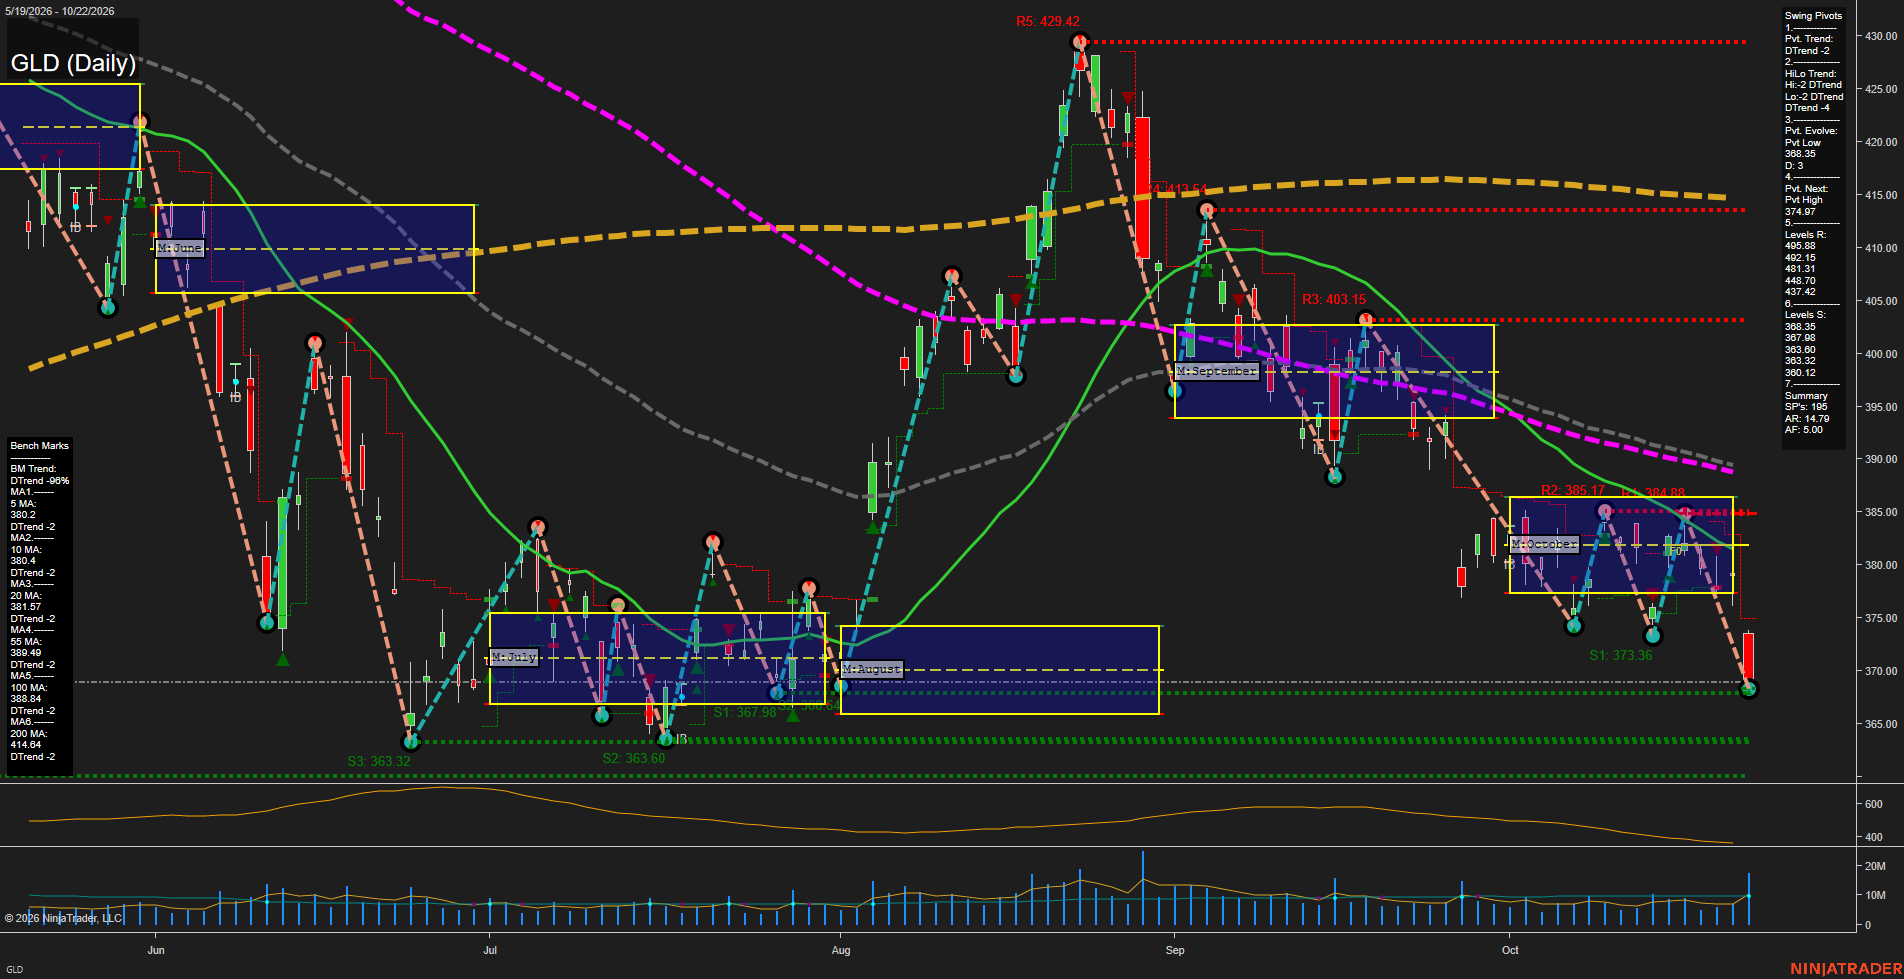
Overall Rating
- Short-Term: Bearish
- Intermediate-Term: Bearish
- Long-Term: Bearish.
Key Insights Summary
GLD reflects a broad futures-style downside swing structure: price has broken below the October monthly NTZ and all six daily benchmark averages, while both pivot trend measures remain in DTrend. The latest decline expanded into the 368.35 pivot-low area with large, fast-momentum bars, establishing 368.35 to 367.98 as the immediate downside test zone. A rebound would initially be characterized as countertrend while price remains beneath the 374.97 next-pivot threshold and the clustered 5-to-20 day averages near 380 to 382. The larger structure retains lower highs from the 429.42 peak, with the 389 to 403 area representing the prior breakdown and overhead resistance region.
View charts on: AlphaWebTrader HTF Charts
GC Daily View
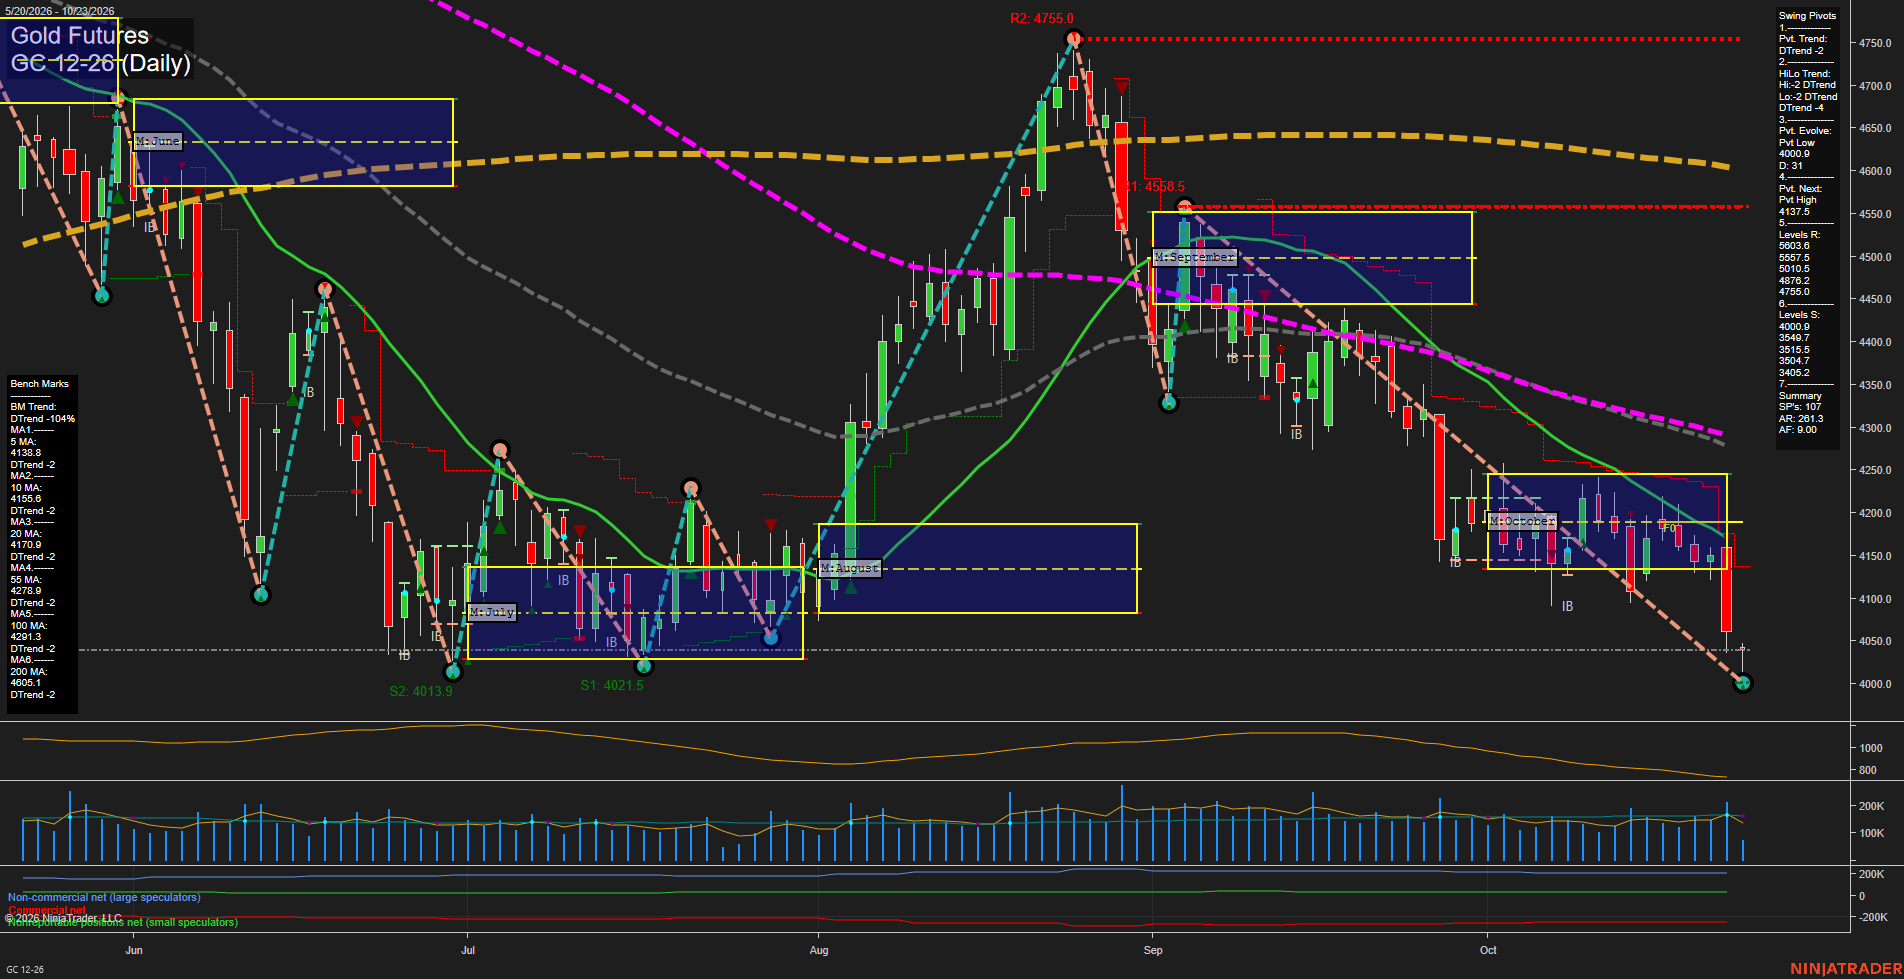
Overall Rating
- Short-Term: Bearish
- Intermediate-Term: Bearish
- Long-Term: Bearish.
Key Insights Summary
Gold futures remain in a broad multi-timeframe decline, with price below every benchmark average and beneath the weekly, monthly, and yearly Fib-grid centers. The large bearish daily bar shows accelerated downside momentum following October consolidation, while the pivot structure remains in DTrend with 4137.5 defining the next pivot-high reversal level. The 4000.9 pivot low is the nearest structural support; a break beneath it extends the established lower-high, lower-low pattern. Elevated ATR reflects a volatile selloff phase rather than a quiet consolidation.
View charts on: AlphaWebTrader HTF Charts
ZB Daily View
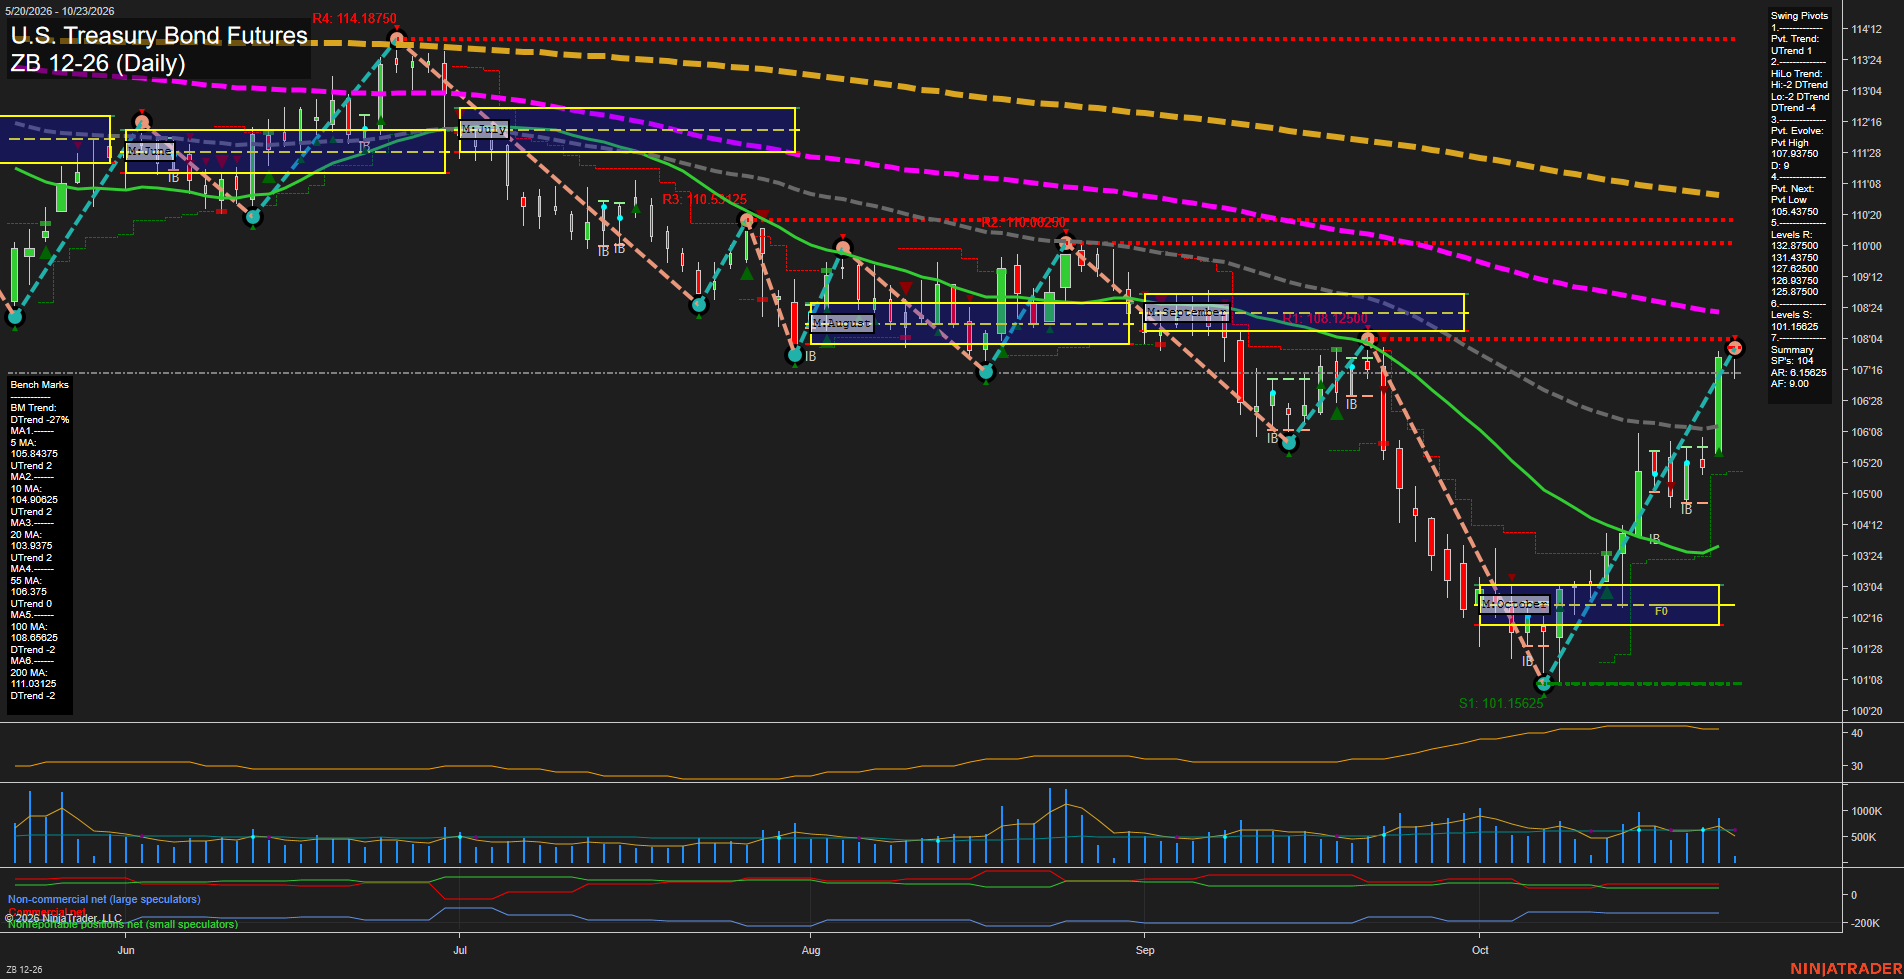
Overall Rating
- Short-Term: Bullish
- Intermediate-Term: Neutral
- Long-Term: Bearish.
Key Insights Summary
The daily structure shows a sharp V-style recovery from the October low, with fast upside momentum, an active short-term UTrend, and price holding above the rising 5-, 10-, and 20-day benchmarks. The advance has reached the 107'16 to 108'04 area and is testing the recent pivot-high region near 107.9750, while the declining 55-day average remains overhead. Intermediate conditions are mixed: the monthly grid is positive, but the HiLo pivot trend remains down. The broader backdrop remains bearish as price stays below declining 100- and 200-day averages and the yearly grid remains below its F0% reference.
View charts on: AlphaWebTrader HTF Charts
Index ETFs
QQQ led on a relative basis, nearly unchanged versus the prior close despite gaining 0.31% from the open; DIA lagged, falling 1.24% close to close. SPY, mid-caps and small-caps also finished below prior closes, although all three edged higher from their opens.