Stocks enter the week pressured ahead of earnings: Alphabet and Microsoft Wednesday after close; Amazon and Intel Thursday after close. far-term uptrends hold.
Fundamentals: Tech earnings feature prominently in the coming week: Vertiv reports before the open on October 28, followed by Alphabet and Microsoft after the close; Amazon and Intel report after the close on October 29. These scheduled reports are relevant to broad-index sentiment. Wednesday also brings the Fed rate decision and press conference, ahead of Thursday’s concentrated releases on GDP, PCE inflation, income and spending.
Technicals: Stocks and tech enter the coming week with S&P 500 and Nasdaq futures bearish over near and medium horizons but still bullish longer term. Dow and DAX futures retain constructive broader trends despite near-term pullbacks. Mid-cap futures remain bearish across daily time frames, while small-cap futures are attempting to stabilize beneath key averages without reversing their medium downtrend.
Market Week Ahead – Trading 360° view Market Radar for: holidays, earnings, eco-news, and ETF SPY S&P500, QQQ Tech, USO Oil, GLD Gold Weekly Chart analysis
As of: October 25, 2026 06:15 CT
Weekly Earnings Radar
Monitoring for earnings releases by the Magnificent 7, AI-tech-related firms, and major financial institutions.
| Date/Day | Impact | Company / Symbol | Time | EPS | Revenue | ||||
|---|---|---|---|---|---|---|---|---|---|
| 2026-10-28 – Wednesday | High | Alphabet (GOOGL) | After close |
|
| ||||
| 2026-10-28 – Wednesday | High | Microsoft (MSFT) | After close |
|
| ||||
| 2026-10-28 – Wednesday | Medium | Vertiv (VRT) | Before open |
|
| ||||
| 2026-10-29 – Thursday | High | Amazon (AMZN) | After close |
|
| ||||
| 2026-10-29 – Thursday | Medium | Intel (INTC) | After close |
|
|
Conclusion: Upcoming earnings include VRT before market open and GOOGL/MSFT after market close on October 28, followed by AMZN/INTC after market close on October 29. No October 25 releases or published actual results are provided. These MAG7, AI infrastructure, and semiconductor reports are relevant to broad-index sentiment; market momentum and volume can slow ahead of major earnings releases.
For full details visit: Yahoo Earnings Calendar
Weekly EcoNews Radar U.S. Events
| Date/Day | Impact | Event | Time | Actual | Forecast | Previous | Info |
|---|---|---|---|---|---|---|---|
| 2026-10-26 – Monday | Medium | 13-Week Bill Auction · $95B | 11:30 | — | — | 4.095% | Reports the yield and demand for short-term Treasury funding; traders monitor money-market conditions and their implications for financing costs. |
| 2026-10-26 – Monday | Medium | 26-Week Bill Auction · $82B | 11:30 | — | — | 4.22% | Shows demand and clearing yields for short-term government debt, helping traders assess funding conditions and expectations for near-term interest rates. |
| 2026-10-26 – Monday | High | 2-Year Note Auction · $69B | 13:00 | — | — | 4.787% | Reveals demand for policy-sensitive Treasury debt; auction pricing can inform front-end yield conditions relevant to equity valuations. |
| 2026-10-27 – Tuesday | Medium | ADP Employment Change 4-week average | 08:15 | — | — | 18K | Tracks average private-sector employment changes over a rolling window, offering a labor-demand signal relevant to growth and monetary-policy expectations. |
| 2026-10-27 – Tuesday | Medium | Durable Goods Orders ex Transportation | 08:30 | — | 0.6 | 0.3 | Measures orders for long-lived manufactured goods excluding transportation equipment, helping traders assess underlying demand without volatile aircraft and vehicle orders. |
| 2026-10-27 – Tuesday | Medium | Durable Goods Orders | 08:30 | — | 0.6 | 0 | Measures new orders for long-lived manufactured products, providing a signal of manufacturing demand and potential production activity relevant to corporate earnings. |
| 2026-10-27 – Tuesday | Medium | Durable Goods Orders ex Defense | 08:30 | — | — | 0.1 | Tracks long-lived goods orders excluding defense purchases, helping traders assess demand outside government military procurement. |
| 2026-10-27 – Tuesday | Medium | Nondefense Capital Goods Orders ex Aircraft | 08:30 | — | — | 1.6% | Measures orders for business equipment excluding defense and aircraft, serving as a gauge of investment intentions and future productive capacity. |
| 2026-10-27 – Tuesday | Medium | Housing Price Index (MoM) | 09:00 | — | 0.1 | 0.3 | Tracks monthly changes in residential property prices, informing assessments of housing conditions, household wealth and broader economic resilience. |
| 2026-10-27 – Tuesday | Medium | Consumer Confidence | 10:00 | — | 80.5 | 81.9 | Surveys households’ views of current conditions and future prospects; traders monitor sentiment for clues about consumption and labor-market perceptions. |
| 2026-10-27 – Tuesday | Medium | New Home Sales Change (MoM) | 10:00 | — | — | 6.4 | Measures the monthly change in newly built home sales, providing insight into housing demand and interest-rate sensitivity across construction-related industries. |
| 2026-10-27 – Tuesday | Medium | 52-Week Bill Auction · $54B | 11:30 | — | — | 4.4% | Shows investor demand and yields for government funding across a longer bill horizon, informing assessments of money-market pricing and policy expectations. |
| 2026-10-27 – Tuesday | Medium | 6-Week Bill Auction · $95B | 11:30 | — | — | — | Reveals demand and yields at the very short end of Treasury borrowing, helping traders monitor liquidity and near-term funding conditions. |
| 2026-10-27 – Tuesday | High | 5-Year Note Auction · $70B | 13:00 | — | — | 5.033% | Shows demand for intermediate-maturity Treasury debt; traders monitor auction pricing for implications for benchmark yields and equity discount rates. |
| 2026-10-27 – Tuesday | Low | API Weekly Crude Oil Stock | 16:30 | — | — | -4.93M | Provides an industry estimate of weekly crude inventory changes, offering clues about petroleum balances relevant to energy shares and inflation expectations. |
| 2026-10-28 – Wednesday | Low | EIA Crude Oil Stocks Change | 10:30 | — | -0.30M | -3.06M | Measures weekly changes in commercial crude inventories, helping traders assess petroleum supply-demand balances and their relevance to energy-sector earnings. |
| 2026-10-28 – Wednesday | High | 2-Year FRN Auction · $30B | 11:30 | — | — | — | Reveals demand and pricing spreads for floating-rate government debt, offering insight into investor appetite for instruments whose coupons adjust with short-term rates. |
| 2026-10-28 – Wednesday | Medium | 17-Week Bill Auction | 11:30 | — | — | — | Reports demand and clearing yields for short-term Treasury borrowing, helping traders assess cash-market liquidity and funding costs. |
| 2026-10-28 – Wednesday | High | Fed Interest Rate Decision | 14:00 | — | 4.00% | 4% | Sets the central bank’s policy-rate stance; traders assess implications for borrowing costs, equity discount rates and the economic outlook. |
| 2026-10-28 – Wednesday | High | FOMC Press Conference | 14:30 | — | — | — | Explains policymakers’ assessment of growth, inflation and risks, helping traders interpret the policy decision and possible future rate path. |
| 2026-10-29 – Thursday | High | Advance GDP q/q | 08:30 | — | 3.2% | 1.5% | Provides an initial estimate of quarterly real economic growth, helping traders assess aggregate demand and the backdrop for corporate earnings. |
| 2026-10-29 – Thursday | High | Core Personal Consumption Expenditures – Price Index (MoM) | 08:30 | — | 0.3 | 0.2 | Measures monthly consumer-price changes excluding food and energy, providing a key signal of underlying inflation relevant to Federal Reserve policy. |
| 2026-10-29 – Thursday | High | Gross Domestic Product Price Index | 08:30 | — | 3.5% | 6.1 | Measures price changes across domestically produced final goods and services, helping traders distinguish nominal growth from inflation and assess broad price pressures. |
| 2026-10-29 – Thursday | Medium | Initial Jobless Claims | 08:30 | — | 196K | 194K | Counts new applications for unemployment benefits, offering a timely signal of layoffs and labor-market conditions relevant to growth and policy expectations. |
| 2026-10-29 – Thursday | Medium | Personal Income (MoM) | 08:30 | — | 0.3 | 0.2 | Measures changes in household income from wages and other sources, helping traders assess consumers’ capacity to sustain spending. |
| 2026-10-29 – Thursday | Medium | Personal Spending | 08:30 | — | 0.3 | 0.9 | Tracks household consumption expenditures, providing insight into the economy’s main demand engine and the revenue backdrop for consumer-facing companies. |
| 2026-10-29 – Thursday | High | Core Personal Consumption Expenditures – Price Index (YoY) | 08:30 | — | 3.1 | 3 | Measures annual consumer inflation excluding food and energy, helping traders assess persistent price pressures against the central bank’s inflation objective. |
| 2026-10-29 – Thursday | Medium | Core Personal Consumption Expenditures (QoQ) | 08:30 | — | — | 3.3 | Tracks quarterly consumer-price inflation excluding food and energy, helping traders assess underlying price momentum within the broader growth report. |
| 2026-10-29 – Thursday | High | Gross Domestic Product Annualized | 08:30 | — | 3.2 | 2.2 | Expresses real economic output growth at an annualized pace, helping traders evaluate economic momentum and its implications for earnings and interest rates. |
| 2026-10-29 – Thursday | Medium | Personal Consumption Expenditures – Price Index (MoM) | 08:30 | — | 0.5 | 0.3 | Measures monthly price changes in household purchases, including food and energy, providing a broad gauge of consumer inflation relevant to monetary policy. |
| 2026-10-29 – Thursday | Medium | Personal Consumption Expenditures – Price Index (YoY) | 08:30 | — | 3.6% | 3.4 | Tracks annual price changes across household consumption, helping traders assess the broad inflation trend against the Federal Reserve’s target. |
| 2026-10-29 – Thursday | Medium | Personal Consumption Expenditures Prices (QoQ) | 08:30 | — | — | 5 | Measures quarterly price changes across household consumption, helping traders evaluate inflation pressures alongside the economy’s growth performance. |
| 2026-10-29 – Thursday | Medium | 4-Week Bill Auction | 11:30 | — | — | 3.945% | Shows demand and yields for very short-term government debt, offering insight into cash availability and immediate funding conditions. |
| 2026-10-29 – Thursday | Medium | 8-Week Bill Auction | 11:30 | — | — | — | Reports demand and pricing for short-term Treasury securities, helping traders assess liquidity conditions and money-market interest rates. |
| 2026-10-29 – Thursday | High | 7-Year Note Auction · $44B | 13:00 | — | — | 5.085% | Reveals demand for intermediate-duration government debt; traders monitor auction pricing for signals about Treasury yields and valuation-sensitive equity sectors. |
| 2026-10-30 – Friday | Medium | Employment Cost Index q/q | 08:30 | — | 0.8% | 0.9% | Measures quarterly changes in employers’ wage and benefit costs, helping traders assess labor-cost pressures and potential inflation persistence. |
| 2026-10-30 – Friday | Medium | Employment Cost Index | 08:30 | — | 0.8 | 0.9 | Tracks employer compensation costs while controlling for shifts in occupational and industry composition, providing a signal of wage pressure relevant to margins and monetary policy. |
| 2026-10-30 – Friday | Medium | Chicago PMI | 09:45 | — | 55.9 | 58.8 | Surveys regional business activity, including orders, output and employment, offering a timely signal of economic momentum relevant to earnings expectations. |
| 2026-10-30 – Friday | Medium | Fed’s Musalem speech | 12:30 | — | — | — | Provides a policymaker’s views on economic conditions and monetary policy; traders monitor comments for insight into the rate outlook and policy debate. |
Summary: The calendar centers on U.S. monetary policy, growth and inflation, alongside labor, consumer, housing and Treasury financing indicators.
Conclusion: The densest cluster of major macroeconomic releases falls on Thursday, following Wednesday’s policy announcement.
Weekly Market News Sentiment
Sentiment Bias shows the balance of positive and negative news coverage sampled from 2026-10-25 00:00 to 2026-10-25 16:33 ET, covering stocks, energy and gold.
Week-ahead news sentiment based on collected articles available as of publication, highlighting relevant upcoming events and risks.
▲ Market news
- Bias
- ▲ +9.09%
- Articles
- 44
- Positive
- ▲ 29.55%
- Neutral
- — 50.00%
- Negative
- ▼ 20.45%
▲ GLD / Gold
- Bias
- ▲ +100.00%
- Articles
- 1
- Positive
- ▲ 100.00%
- Neutral
- — 0.00%
- Negative
- — 0.00%
Sentiment Summary: The October 25 publication snapshot is positive on GLD, with its sole article highlighting a $162,713 gain on a hypothetical $300,000 sale of holdings bought five years earlier. The main counterweight is tax treatment: although GLD trades like a stock, the article explains that gains are taxed as collectibles rather than stocks, potentially leaving investors with a substantially larger tax bill.
Conclusion: For the coming week, the supported context is gold-investment gains tempered by an after-tax return risk, rather than a broad market-direction signal.
— USO / Oil
- Bias
- — 0.00%
- Articles
- 2
- Positive
- ▲ 50.00%
- Neutral
- — 0.00%
- Negative
- ▼ 50.00%
Sentiment Summary: Coverage is evenly split between AI-stock optimism and oil-linked inflation concerns heading into the week of October 26. Dale Smothers identifies Nvidia, Marvell and CoreWeave as opportunities and projects the S&P 500 reaching 8,000 by year-end 2026; these are his views, not confirmed market outcomes. The counterweight is a report linking elevated oil and strong AI spending to persistent inflation and expectations of a December Fed rate hike, rather than an announced policy decision.
Conclusion: The central index-futures context is tension between optimism toward AI shares and inflation-related interest-rate risk.
Glossary: Sentiment Bias = (positive articles − negative articles) ÷ total articles × 100. It ranges from −100% negative to +100% positive. A reading near zero indicates little directional bias. Neutral articles reduce the score’s strength. ▲ positive; ▼ negative; — balanced. These readings describe news coverage, not market-price direction.
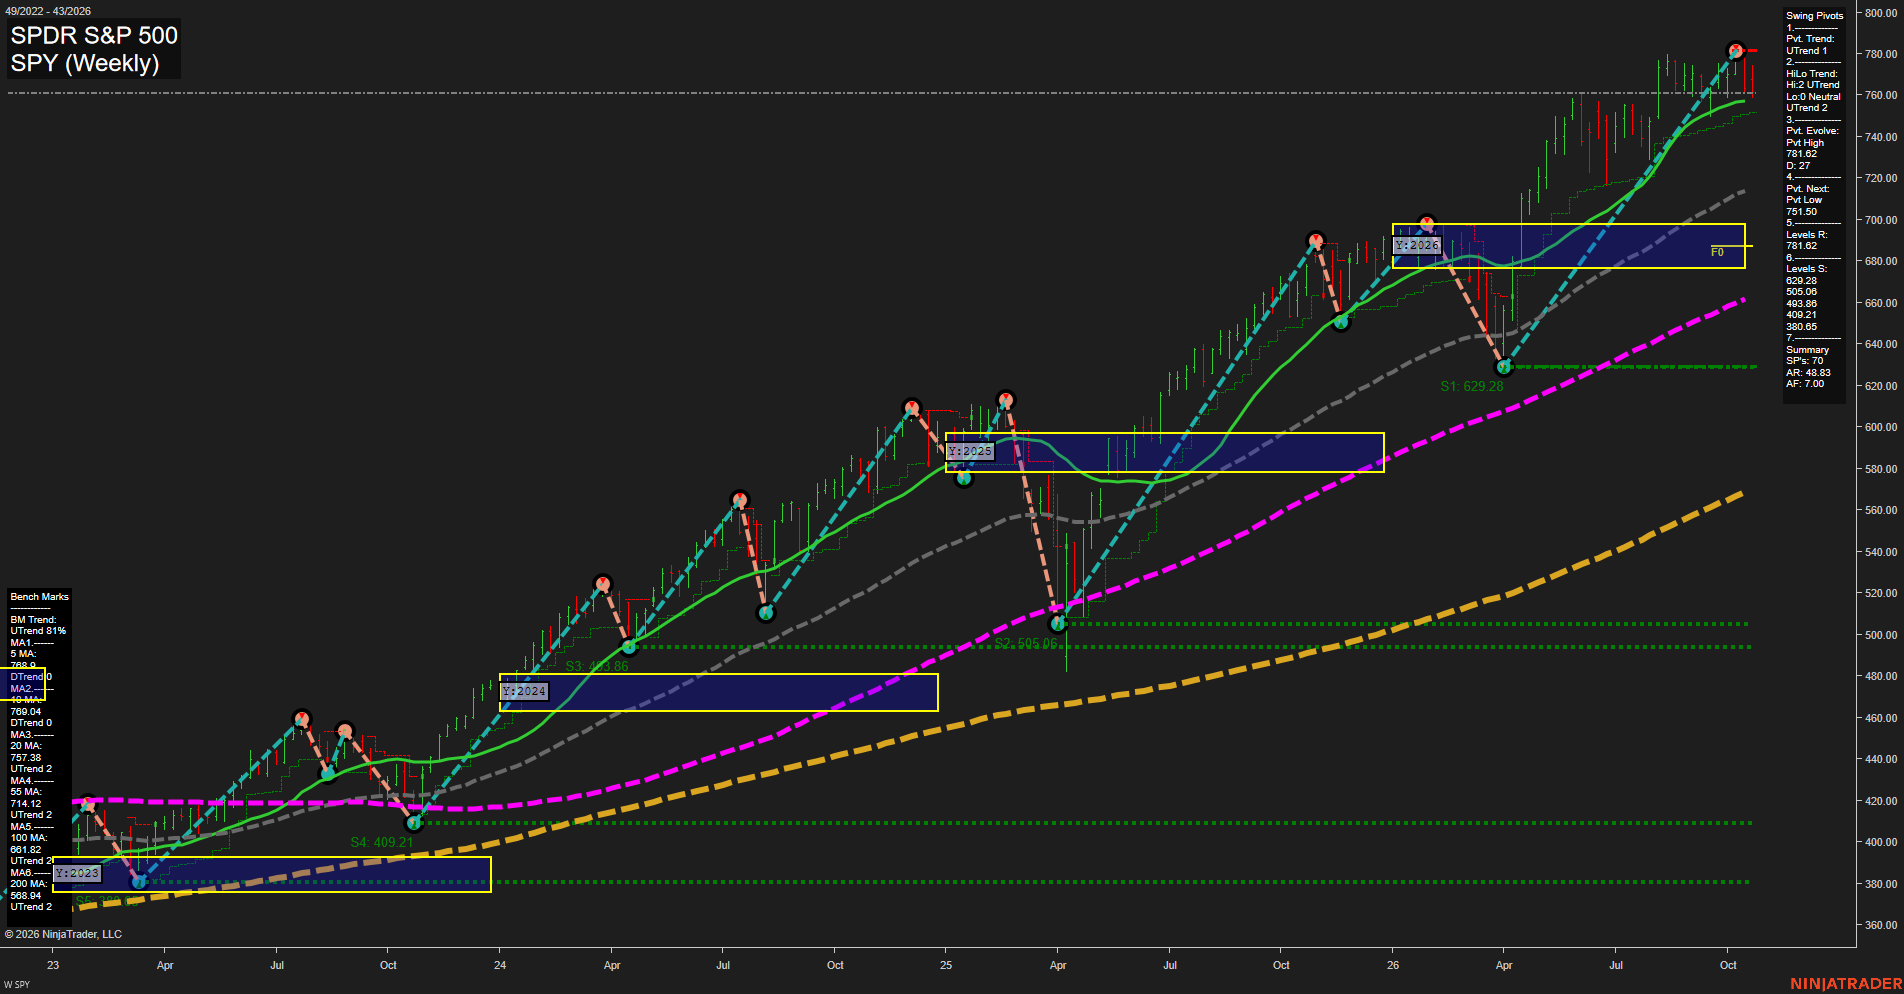
SPY Weekly View
Overall Rating
- Short-Term: Bullish
- Intermediate-Term: Bullish
- Long-Term: Bullish.
Key Insights Summary
SPY remains in a broad weekly higher-high and higher-low structure, which translates to a constructive index-futures swing backdrop. Price is holding above the rising 20, 55, 100, and 200-period benchmarks and is materially above the 2026 yearly NTZ/F0% zone near the upper-680s to mid-690s. Short-term action is extended toward the 781.62 pivot-high resistance while the 5-period average remains above price and declining, reflecting near-term consolidation beneath the recent high. The active UTrend pivot structure remains intact unless the 751.50 opposite-pivot level is reached; beneath that level, the chart’s first major structural support remains far lower at 629.28. The prevailing technical character is a mature but persistent upside trend with fast momentum and potential two-way rotation near the record-high pivot area.
View charts on: AlphaWebTrader HTF Charts
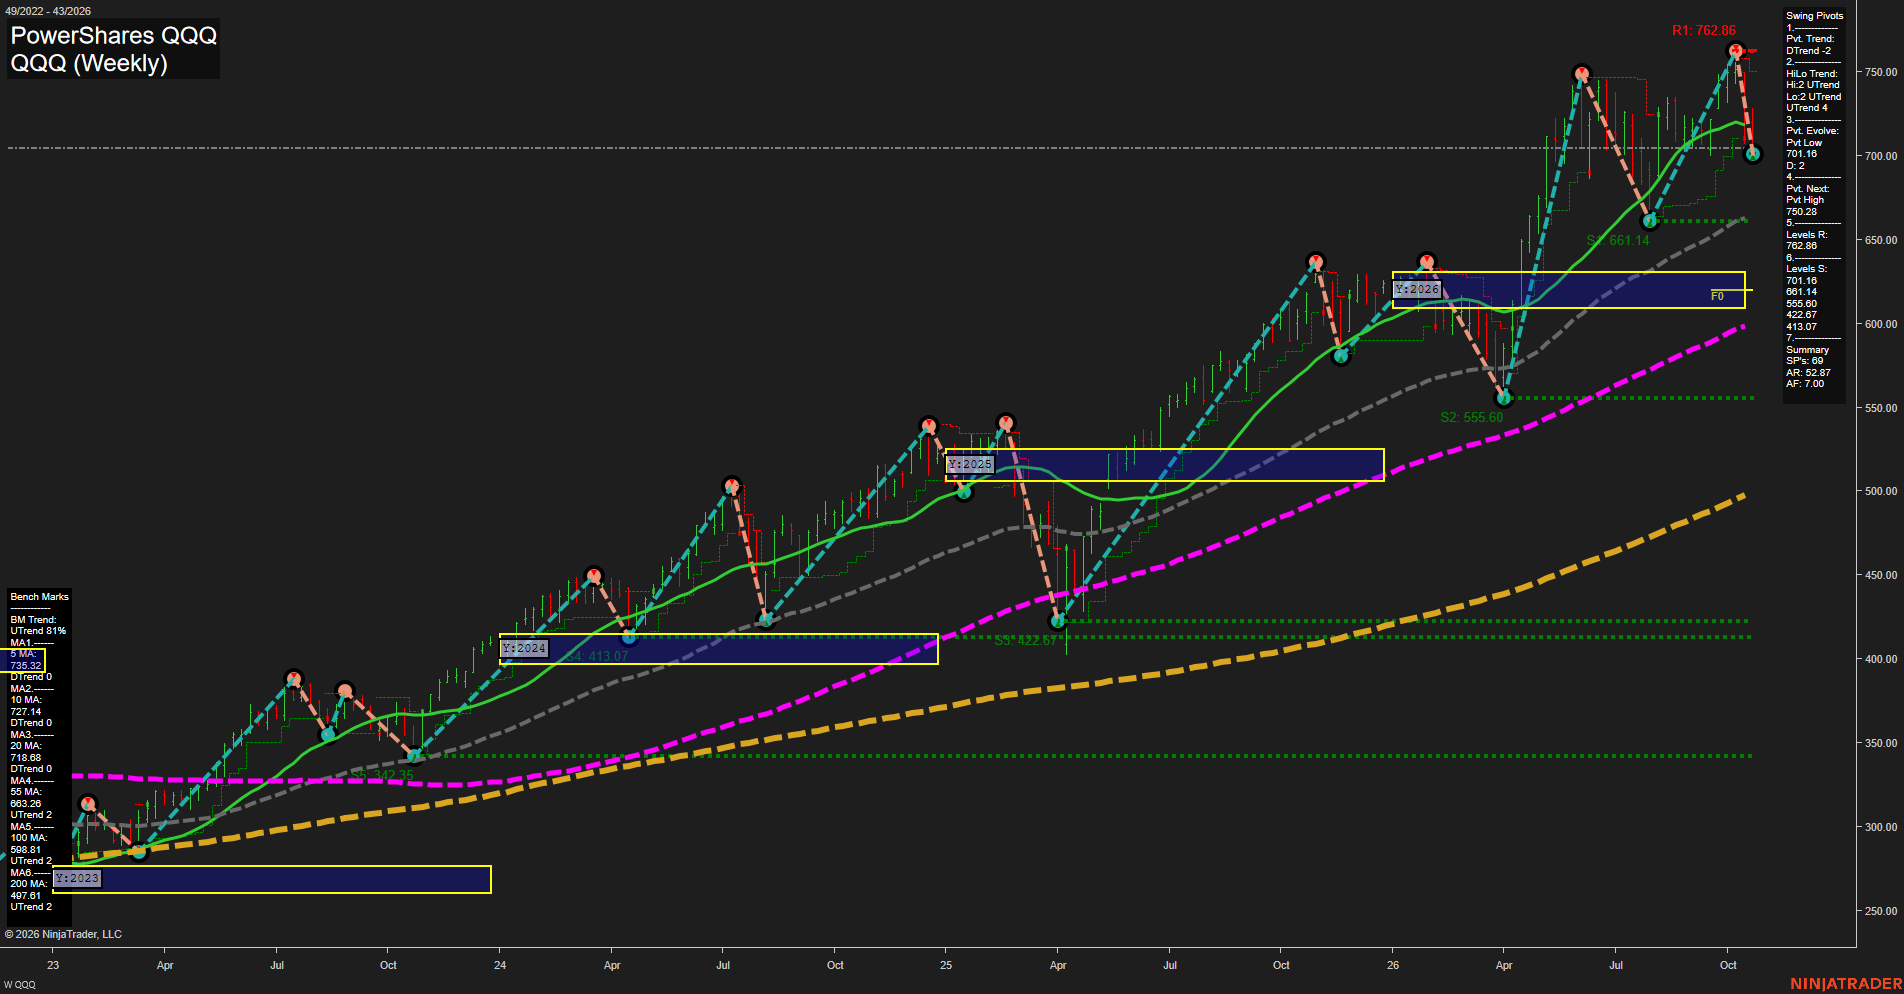
QQQ Weekly View
Overall Rating
- Short-Term: Bearish
- Intermediate-Term: Bullish
- Long-Term: Bullish.
Key Insights Summary
QQQ, a useful proxy for Nasdaq futures swing conditions, remains in a broad bullish structure with all benchmark averages rising and price materially above the 55-, 100-, and 200-week benchmarks. The near-term structure is corrective: the pivot trend has shifted to DTrend after rejection from 762.86, with fast downside momentum carrying price beneath the 5-, 10-, and 20-week benchmarks. The 701.18 pivot low is the immediate short-term reference, while 661.14 is the principal intermediate support. A recovery through the clustered 718.68 to 735.21 benchmark area would characterize a rebound within the larger uptrend; 750.28 and 762.86 remain the overhead pivot resistance sequence.
View charts on: AlphaWebTrader HTF Charts
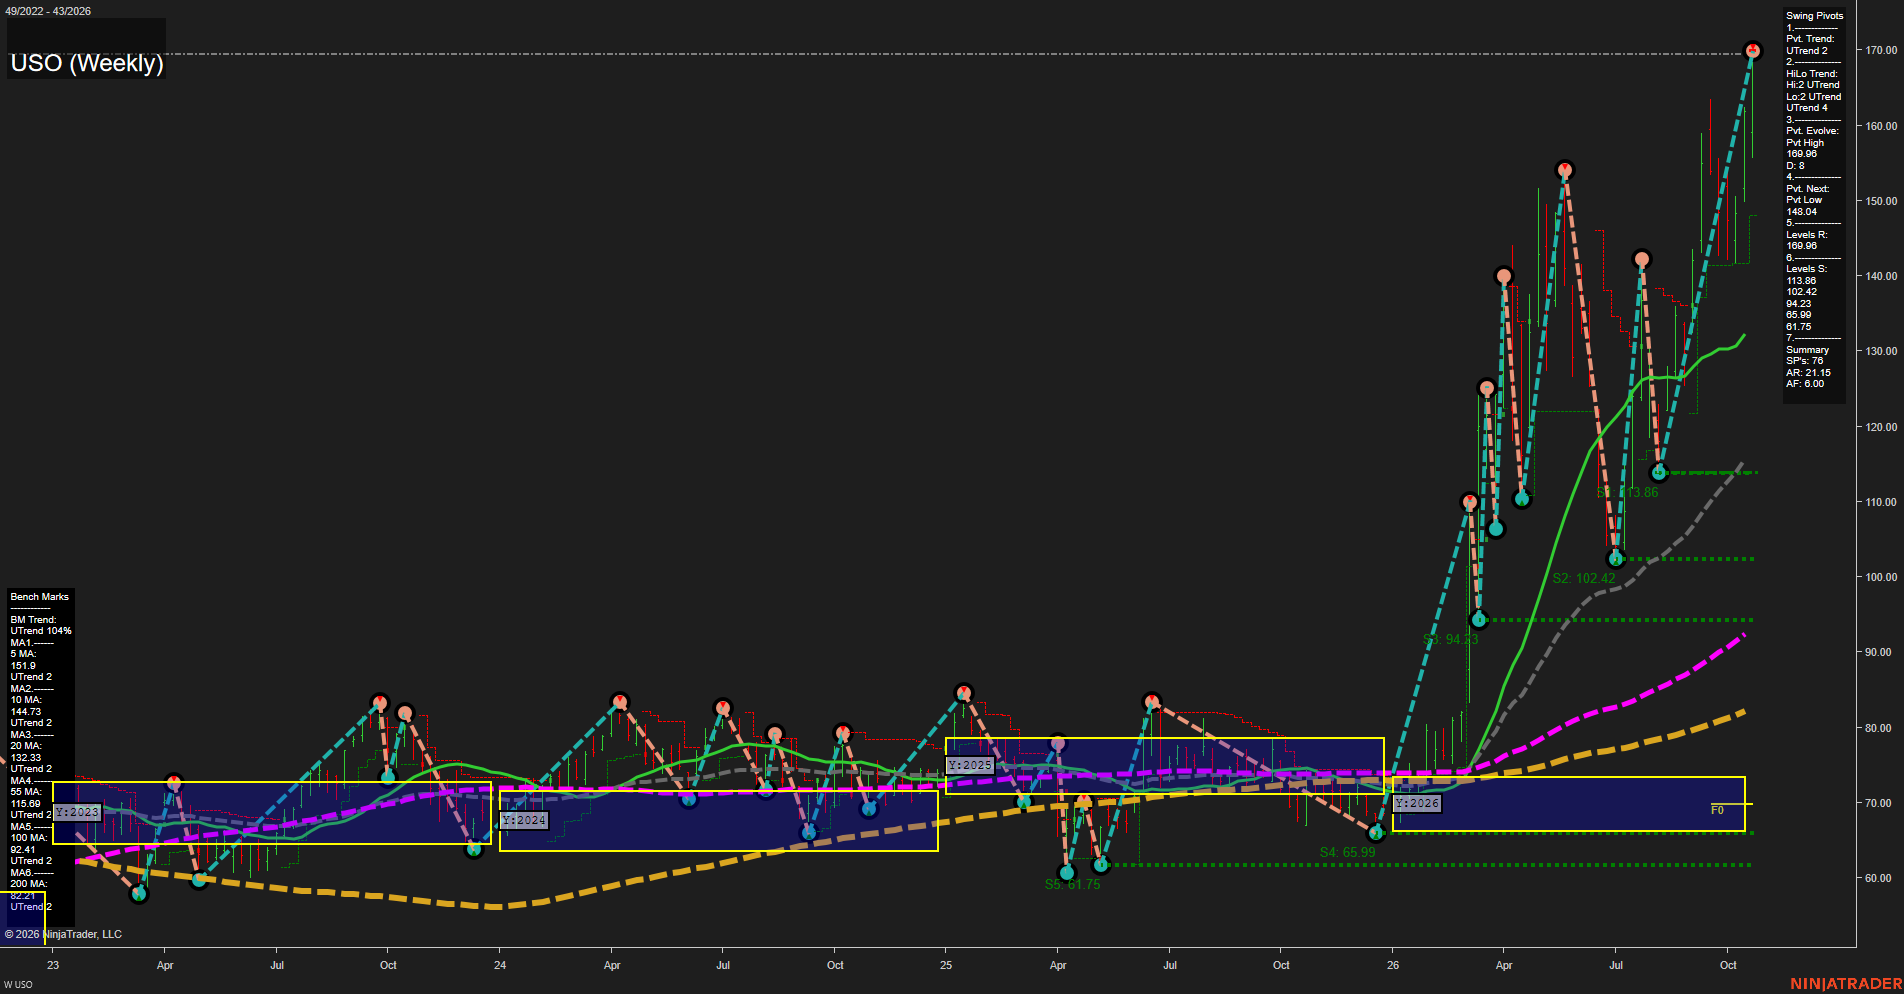
USO Weekly View
Overall Rating
- Short-Term: Bullish
- Intermediate-Term: Bullish
- Long-Term: Bullish.
Key Insights Summary
USO is in a broad, fast upside expansion from the 2026 base near the yearly F0% area. The weekly swing structure is decisively constructive, with both pivot trend measures in UTrend and price holding well above every rising benchmark. The current 169.98 pivot high is the immediate structural resistance, while 148.04 defines the next opposite-pivot threshold. The wide separation above the 20-, 55-, 100-, and 200-period benchmarks reflects strong trend persistence, although the large weekly range also characterizes an elevated-volatility, momentum-driven advance rather than a mature consolidation.
View charts on: AlphaWebTrader HTF Charts
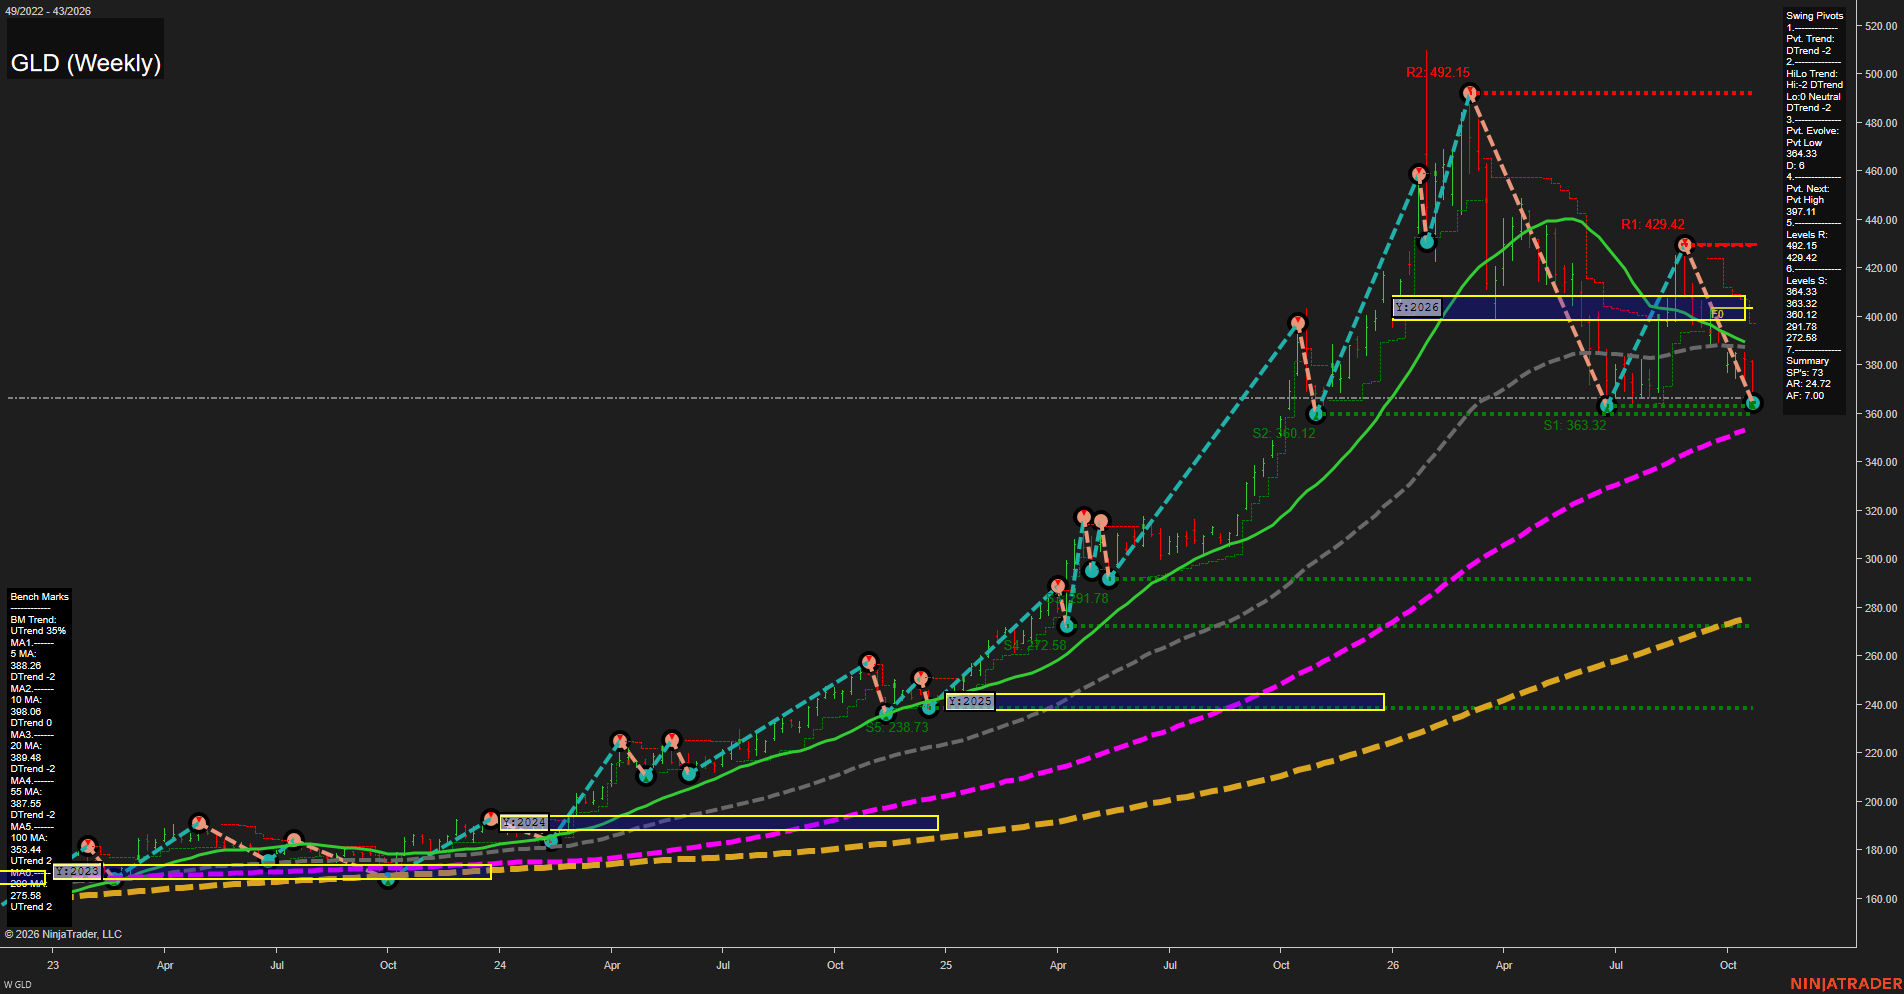
GLD Weekly View
Overall Rating
- Short-Term: Bearish
- Intermediate-Term: Bearish
- Long-Term: Bullish.
Key Insights Summary
GLD’s weekly structure reflects a sharp counter-trend liquidation from the 492.15 peak, with lower highs and a fresh 364.33 pivot low confirming bearish short- and intermediate-term control. Price is below the 5-, 10-, 20-, and 55-week benchmarks and below the 2026 yearly NTZ, while 397.11, the yearly grid area, and 429.42 define the overhead recovery structure. The 100- and 200-week averages remain rising beneath price, preserving the broader secular uptrend despite the current high-volatility retracement. From a futures swing-trader perspective, the chart is in a fast bearish downswing inside a still-bullish long-term cycle, with 364.33 as the immediate structural low and 303.32 as the next major lower support reference.
View charts on: AlphaWebTrader HTF Charts
ZB Weekly View
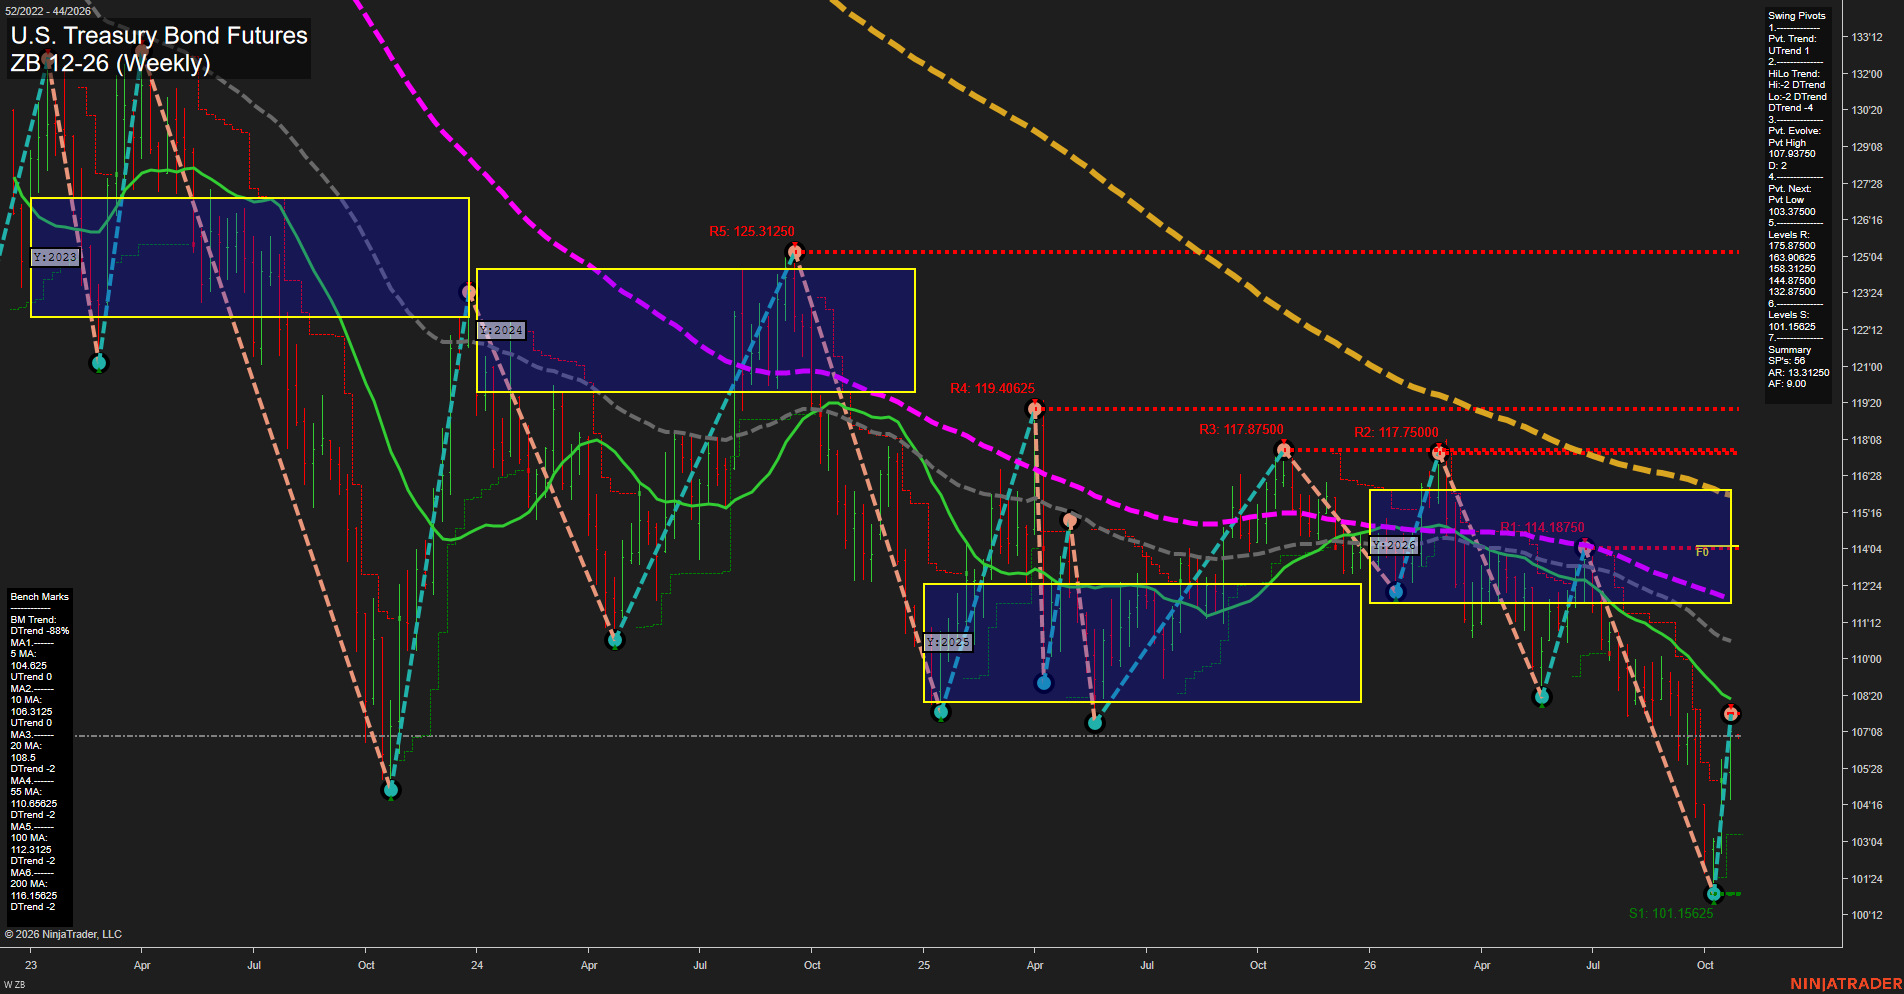
Overall Rating
- Short-Term: Bullish
- Intermediate-Term: Bearish
- Long-Term: Bearish.
Key Insights Summary
The weekly chart shows a fast, large-bar rebound from the 101.15625 swing low, restoring the short-term pivot and weekly-grid structure to an upward phase. Price remains beneath the declining 20-, 55-, 100-, and 200-period benchmarks and below the yearly F0% area near 114'04, framing the recovery as a countertrend bounce within a broader bearish structure. The 107.93750 evolving pivot high and 108.3125 20-period benchmark define the nearby overhead transition zone, while 103.37500 is the next pivot-reversal reference beneath the current advance.
View charts on: AlphaWebTrader HTF Charts
Sentiment Summary: Coverage is mildly positive but predominantly neutral (50%), with AI/cloud growth and improving S&P 500 breadth offset by scrutiny of AI spending returns, inflation and recent technology weakness. The Nasdaq 100 was reported about 8% below its yearly peak, underscoring the counterweight to upbeat company-growth coverage. For the coming week, scheduled catalysts include the Fed decision on Wednesday, October 28, GDP and new-home sales data, and major earnings including Amazon on October 29 after the close; a Fed pause is an expectation, not a confirmed outcome.
Conclusion: Index-futures context centers on concentrated earnings and policy-event risk rather than broad directional conviction.