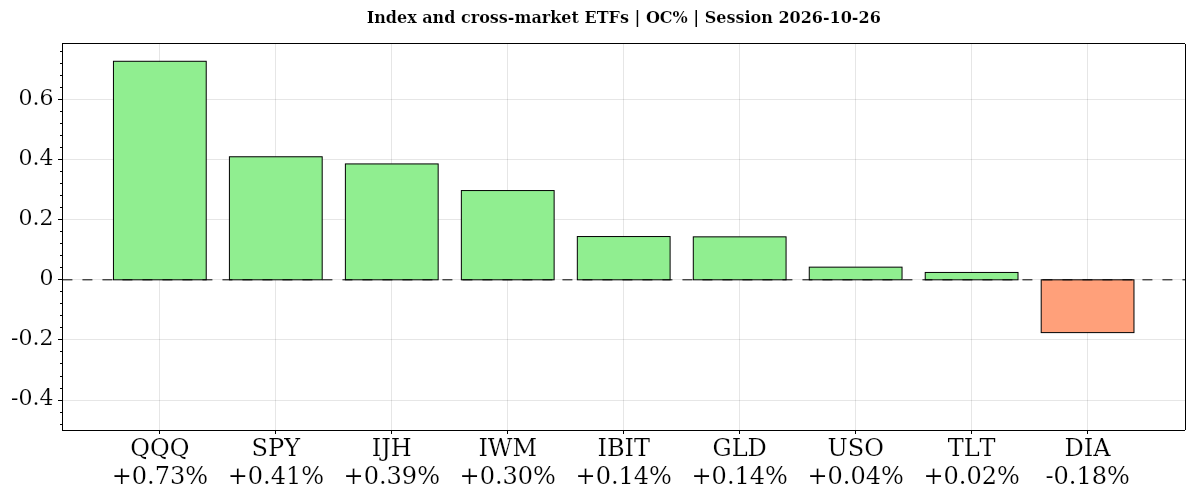
Monday’s bill auctions at 11:30 a.m. ET and 2-year sale at 1 p.m. ET accompanied stock gains from the open despite lingering near-term weakness.
Fundamentals: Monday’s Treasury calendar featured 13- and 26-week bill auctions at 11:30 a.m. ET and a 2-year note auction at 1 p.m. ET. AI spending and monetization concerns shaped cautious technology sentiment ahead of major earnings reports. Oil retreated, gold sentiment remained cautious and the October Treasury rally stalled. Wednesday’s Fed decision remained a key policy backdrop.
Technicals: The S&P 500 and Nasdaq-100 ETFs rose 0.41% and 0.73% from Monday's open, respectively, though both retained near-term weakness within rising longer-term structures. Tesla, Nvidia and Microsoft advanced, while Alphabet and Meta fell. The oil ETF edged up 0.04% from its open but finished 1.95% below its prior close. Gold gained 0.14% from the open despite falling moving averages, while far-term Treasury bonds added 0.02%.
After Market Close daily snapshot: market news summary and sentiment, major ETFs, Magnificent 7 analysis, Indices Futures Higher Time Frame Analysis, and E-mini S&P500, Nasdaq 100, NYMEX Crude, Gold Futures Daily Chart analysis.
As of: October 26, 2026 05:00 CT
EcoNews Radar U.S. Events Day Recap
| Date | Impact | Event, Prev, Forecast, Actual | Info |
|---|---|---|---|
| 2026-10-26 Monday 11:30 | Medium | 13-Week Bill Auction · $95B Prev: 4.095% Forecast: — Actual: 4.05% | Reveals short-term Treasury funding costs and investor demand for cash-like assets; traders monitor the yield for signals about money-market conditions and near-term interest-rate expectations. |
| 2026-10-26 Monday 11:30 | Medium | 26-Week Bill Auction · $82B Prev: 4.22% Forecast: — Actual: 4.21% | Shows Treasury borrowing costs and demand further along the bill curve; traders watch for shifts in expected policy rates and short-term funding conditions. |
| 2026-10-26 Monday 13:00 | High | 2-Year Note Auction · $69B Prev: 4.787% Forecast: — Actual: — | Reveals demand and financing costs at a policy-sensitive Treasury maturity; traders monitor the outcome for implications for front-end yields and equity valuation discount rates. |
Summary: The calendar centers on Treasury financing conditions and interest-rate expectations relevant to index futures.
Market News Summary:
AI investment scrutiny, major technology earnings previews and the October 28 Fed decision dominate the supplied market coverage.
Primary Drivers & Risks:
- Primary Driver: AI spending and megacap earnings scrutiny
- Primary Risk: Persistent inflation and tighter financing conditions
Tone:
Cautious, with AI growth optimism offset by financing, valuation and policy concerns.
Data, Market and System
Geopolitical:
- The Iran war remains unresolved, with the continuing Middle East conflict featuring in cautious gold-market commentary.
Oil / Energy:
- Oil prices retreated ahead of Fed, ECB and BOJ decisions amid lingering inflation risks.
- Energy-sector coverage identifies Bloom Energy and Solaris Energy as beneficiaries of demand for power from AI developers.
Gold / Metals:
- Gold sentiment has become more cautious in the second half of 2026 after central-bank demand helped lift prices above $5,600 an ounce earlier in the year.
Fed / Financials:
- Fed previews center on an October 28 hold at 3.75–4.00%, while market pricing assigns nearly a 78% probability to a December rate hike.
- Inflation remains above 3%, while weaker job growth and rising financial pressures complicate monetary policy deliberations.
- The October bond rally has stalled with 10-year Treasury yields below 5%.
- European bonds recovered ahead of central-bank decisions, while EUR/USD consolidated near 1.12.
Conclusion:
AI spending, monetization and upcoming megacap earnings are the central equity themes. Semiconductor selling and the S&P 500’s technology concentration connect those concerns to broad-index exposure.
The October 28 Fed decision, December hike pricing and the stalled Treasury rally form the main policy and rates cross-currents. Lower oil prices contrast with persistent inflation concerns, while tighter AI financing adds another source of pressure.
Market News Sentiment
Sentiment Bias shows the balance of positive and negative news coverage sampled from 2026-10-25 16:00 to 2026-10-26 15:44 ET, covering stocks, energy and gold.
▲ Market news
- Bias
- ▲ +12.43%
- Articles
- 185
- Positive
- ▲ 34.59%
- Neutral
- — 43.24%
- Negative
- ▼ 22.16%
▼ GLD / Gold
- Bias
- ▼ -21.43%
- Articles
- 14
- Positive
- ▲ 21.43%
- Neutral
- — 35.71%
- Negative
- ▼ 42.86%
Sentiment Summary: Gold coverage leaned negative (43% negative versus 21% positive), with reports citing oil-driven inflation concerns, uncertainty surrounding the Iran war and pressure ahead of this week’s Federal Reserve meeting. After trading below $4,000 late October 25, gold rebounded to about $4,014 early October 26 as softer oil eased tightening concerns; later coverage still described $4,000 as contested support despite Treasury yields below 5%. Falling real yields provided a counterweight, but analysts remained cautious about a near-term recovery.
Conclusion: The main cross-market context is tension between oil-linked inflation pressure and easing yields ahead of the Fed decision.
▼ USO / Oil
- Bias
- ▼ -26.32%
- Articles
- 19
- Positive
- ▲ 26.32%
- Neutral
- — 21.05%
- Negative
- ▼ 52.63%
Sentiment Summary: Negative coverage led positive coverage 53% to 26%, reflecting persistent Middle East supply risks and inflation concerns after Friday, October 23’s oil rally following Houthi attacks on Saudi Arabia. Oil retreated on Monday, October 26 as traders weighed U.S.-Iran diplomacy and demand concerns, while Saudi supply threats and refining constraints remained counterweights to the decline. Softer crude eased reported inflation and Fed-tightening concerns and supported gold above $4,000, although technology sentiment remained pressured by Elon Musk’s neocloud comments.
Conclusion: Indices futures face a mixed cross-market backdrop ahead of this week’s Fed decision, with oil-related inflation concerns still prominent.
Glossary: Sentiment Bias = (positive articles − negative articles) ÷ total articles × 100. It ranges from −100% negative to +100% positive. A reading near zero indicates little directional bias. Neutral articles reduce the score’s strength. ▲ positive; ▼ negative; — balanced. These readings describe news coverage, not market-price direction.
Market Technical Analysis
Analysis of VIX volatility, the completed session in major ETFs and mega-cap tech stocks, and futures snapshots and higher-time-frame analysis.
VIX — Market Fear Gauge Daily
| Level | Open | High | MaxVix | Low | MinVix | DNC% | DOC% | VR | MaxVR | MinVR |
|---|---|---|---|---|---|---|---|---|---|---|
| 18.39 | 18.74 | 18.95 | 22.31 | 17.79 | 14.77 | -3.26% | -1.87% | 4.59 | 41.30 | -2.03 |
VIX fell 1.87% from the session's opening level. VIX fell 3.26% versus the previous session close. Expected volatility eased from the period open. VIX is 48.0% up the recent 15-session range (14.77–22.31), in the 40–50% band.
VR: ATN Volatility Ratio (VR): 4.59 – Stocks rose while expected volatility eased. VR is in the lower part of its preceding 15-session VR range (-2.03 to 41.30), in the 10–20% band. VR rose 4.79 points from the previous session, a moderate shift relative to that range.
Range lookback: preceding 15 completed sessions.
Major ETFs and Mega Cap Tech Stocks
- The semiconductor ETF SMH has faced selling over the past two weeks amid concerns about AI overspending, investment returns and productivity gains.
- The S&P 500’s substantial technology and AI exposure puts sector concentration in focus.
- Microsoft and Alphabet earnings previews emphasize infrastructure spending and AI monetization, with Alphabet down 7.3% since its April earnings release.
- Microsoft offered voluntary buyouts to approximately 60,000 employees while continuing heavy AI investment, but cautioned that participation would be limited.
- Analyst coverage highlights Azure and Copilot demand at Microsoft and Meta’s $95 billion AI investment push.
- Tighter data-center financing and signs of stress in CoreWeave debt contrast with Nebius’s recent financing.
- Michael Burry cited stretched valuations while discussing potential reductions in long-held Walmart, Alphabet and Valero positions.
ETF, Mag7, and Cross-Market ETF Insights
Overall Tone
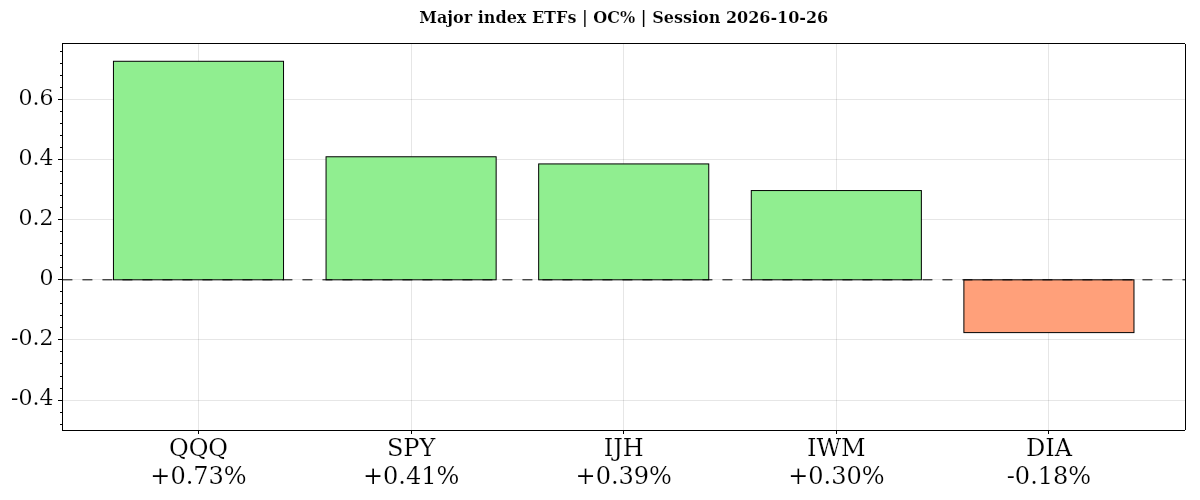
On October 26, 2026, gains from the open across most index ETFs suggested constructive daily risk tone, though mega-cap participation was uneven.
| Instrument | Bias | Date | DNC% | DOC% | O | H | L | C | VWAP | Vol |
|---|---|---|---|---|---|---|---|---|---|---|
| ▲ QQQ | ▲ ▲ ▲ | 2026-10-26 | ▲ +1.11% | ▲ +0.73% | 707.06 | 715.25 | 705.58 | 712.20 | ▲ 711.95 | 32,775,683 |
| ▲ SPY | ▲ ▲ ▲ | 2026-10-26 | ▲ +0.71% | ▲ +0.41% | 762.25 | 767.73 | 761.63 | 765.37 | ▲ 765.22 | 31,311,131 |
| ▲ IJH | ▲ ▲ ▼ | 2026-10-26 | ▲ +0.75% | ▲ +0.39% | 72.63 | 73.27 | 72.60 | 72.91 | ▼ 72.98 | 6,130,395 |
| ▲ IWM | ▲ ▲ ▼ | 2026-10-26 | ▲ +0.45% | ▲ +0.30% | 276.17 | 278.77 | 276.00 | 276.99 | ▼ 277.39 | 15,348,315 |
| ▼ DIA | ▲ ▼ ▼ | 2026-10-26 | ▲ +0.31% | ▼ -0.18% | 523.89 | 525.61 | 521.94 | 522.97 | ▼ 523.43 | 2,130,947 |
| AVG/Sum | — | — | +0.66% | +0.33% | — | — | — | — | — | 87,696,471 |
Index ETFs
Positive confluence: average DOC% +0.33% from the open; DNC% +0.67% versus the prior close. Four of five gained from the open, led by QQQ; DIA lagged, while all five rose versus the prior close. QQQ and SPY remained in near-term downtrends despite rising longer-term structures.
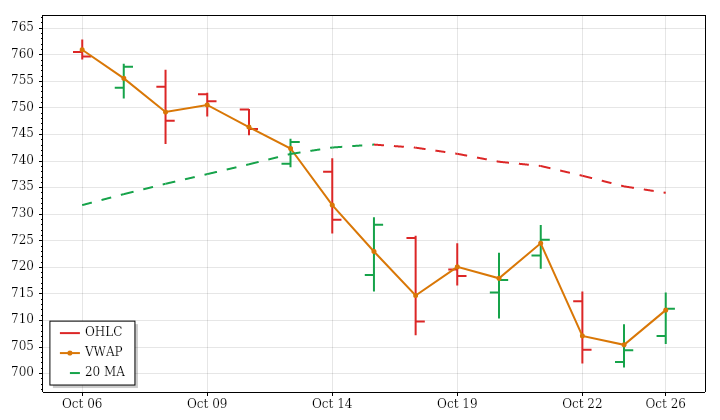
QQQ · D:2026-10-26 NC% ▲ +1.11% OC% ▲ +0.73%
QQQ – Nasdaq 100 Technicals Summary
QQQ’s completed daily session on October 26 advanced 1.11% from the prior close and 0.73% from the open to close at 712.20. Its opening gap up remained unfilled, and price formed a higher high and higher low. The close exceeded the previous day’s high and sat slightly above session VWAP, giving the latest daily action a positive tone.
That improvement still opposed the near-term downtrend and negative prior 15-session price trend. Price remained below a falling near-term average and below a rising intermediate-term average, while staying above the rising far-term average. The result was a rebound within a divided trend structure. Range was approximately average amid expanding lookback ranges, but volume was below average despite increasing lookback activity. PSAR and ATR-median remained bearish; a next-session high above 718.3056 would conditionally trigger a bullish PSAR reversal.
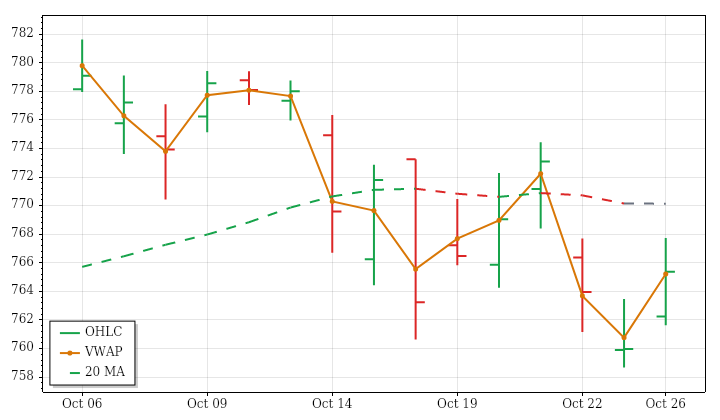
SPY · D:2026-10-26 NC% ▲ +0.71% OC% ▲ +0.41%
SPY – S&P 500 Technicals Summary
SPY’s completed daily session on October 26 closed at 765.37, gaining 0.71% against the prior close and 0.41% from the open. The opening gap up stayed unfilled. A higher high and higher low accompanied a close above the previous day’s high and marginally above session VWAP, marking a constructive session without resolving the wider trend conflict.
Price remained below a falling near-term average and below a rising intermediate-term average, while the far-term uptrend stayed intact. The daily advance therefore contrasted with shorter-term weakness and the modestly negative prior 15-session price trend. Range was near average, unlike the expanding range trend across that lookback, and volume was below average despite increasing lookback activity. PSAR and ATR-median remained bearish; a next-session high above 773.652 would conditionally trigger a bullish PSAR reversal.
IJH · D:2026-10-26 NC% ▲ +0.75% OC% ▲ +0.39%
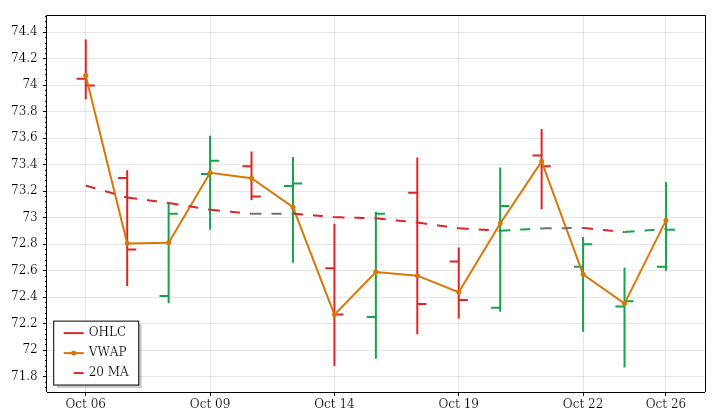
IJH – Mid Cap Technicals Summary
IJH’s completed daily session on October 26 advanced 0.75% from the prior close and 0.39% from the open to finish at 72.91. Its opening gap up remained unfilled, and a higher high and higher low culminated in a close above the previous day’s high. Nevertheless, the close was below session VWAP, tempering the otherwise constructive daily price action.
The gain left the near-term structure mixed: price was slightly above an average that was still falling. The intermediate-term trend remained downward, while the far-term structure was mixed because price remained below a rising average. Thus, the advance did not establish broad trend alignment. Below-average range continued the prior 15 sessions’ contraction, while below-average volume contrasted with a marginally increasing volume trend. PSAR remained bearish; a next-session high above 73.4284 would conditionally trigger an upward reversal.
IWM · D:2026-10-26 NC% ▲ +0.45% OC% ▲ +0.30%
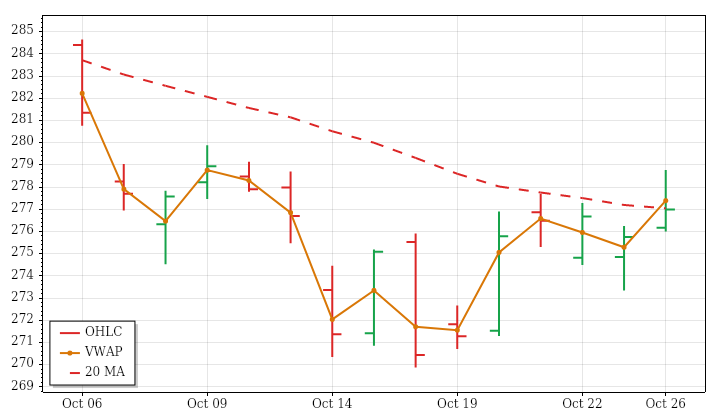
IWM – Small Cap Technicals Summary
IWM’s completed daily session on October 26 closed at 276.99, up 0.45% from the prior close and 0.30% from the open. The opening gap up stayed unfilled, and price established a higher high and higher low before closing above the previous day’s high. The finish nevertheless remained below session VWAP, showing that the daily advance did not carry through every intraday measure.
Price stood above a falling near-term average, leaving that horizon mixed, while the intermediate-term trend remained down. The far-term structure was also mixed, with price beneath a slightly rising average. The session’s below-average range contrasted with expanding ranges over the prior 15 sessions; especially light volume continued the declining activity trend. Bullish PSAR conflicted with bearish ATR-median. A next-session low below 271.0445 would conditionally reverse PSAR downward.
DIA · D:2026-10-26 NC% ▲ +0.31% OC% ▼ -0.18%
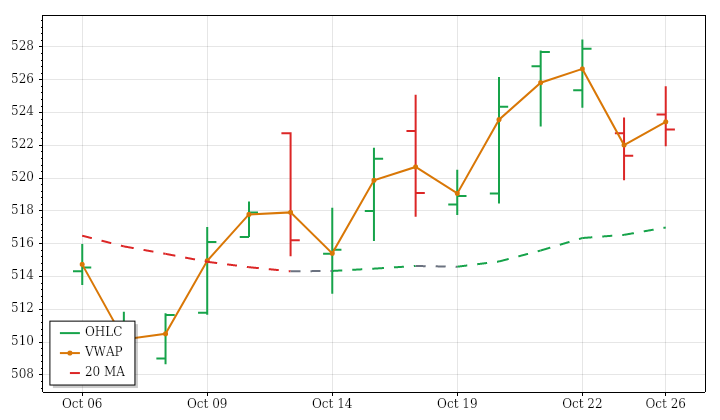
DIA – Dow Jones Technicals Summary
DIA’s completed daily session on October 26 closed at 522.97, gaining 0.31% versus the prior close while losing 0.18% from the open. Its opening gap up remained unfilled, but the intraday retreat left the close within the previous day’s range and below session VWAP. Higher daily highs and lows therefore coexisted with a less constructive finish.
The trend structure remained uneven. Price was slightly below a rising near-term average, above a falling intermediate-term average, and above a rising far-term average. This preserved longer-term strength without full alignment across horizons. The session’s below-average range contrasted with expanding ranges over the prior 15 sessions, while notably light volume continued the declining volume trend. PSAR remained bearish while ATR-median stayed positive; a next-session high above 528.0215 would conditionally trigger a bullish PSAR reversal.
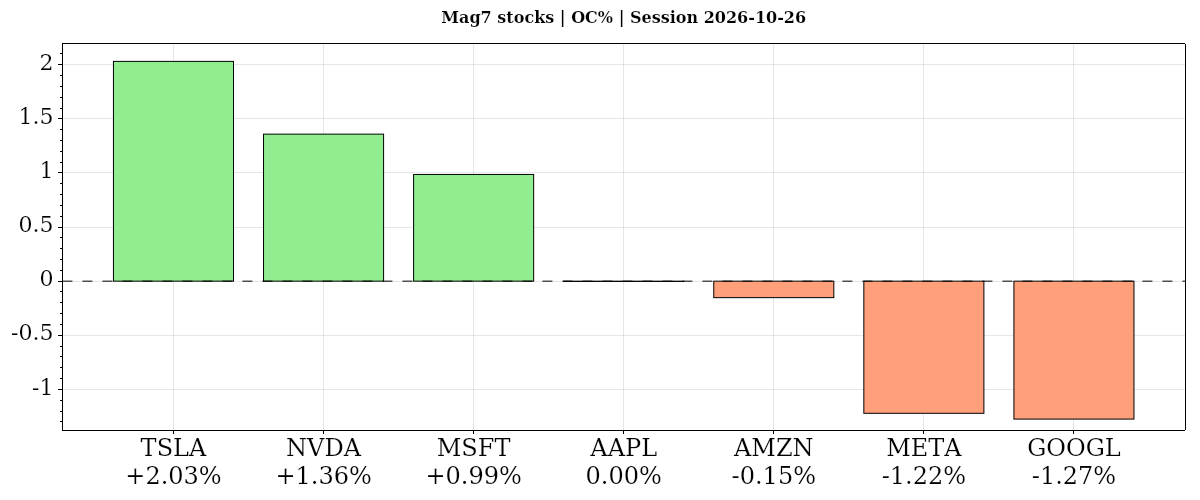
| Instrument | Bias | Date | DNC% | DOC% | O | H | L | C | VWAP | Vol |
|---|---|---|---|---|---|---|---|---|---|---|
| ▲ TSLA | ▲ ▲ ▼ | 2026-10-26 | ▲ +5.21% | ▲ +2.03% | 383.82 | 397.27 | 383.73 | 391.62 | ▼ 393.35 | 53,043,818 |
| ▲ NVDA | ▲ ▲ ▲ | 2026-10-26 | ▲ +2.39% | ▲ +1.36% | 213.10 | 217.75 | 212.61 | 216.00 | ▲ 215.83 | 90,659,399 |
| ▲ MSFT | ▲ ▲ ▲ | 2026-10-26 | ▲ +1.54% | ▲ +0.99% | 527.40 | 533.25 | 521.69 | 532.60 | ▲ 530.51 | 18,162,929 |
| ▼ AAPL | ▼ ▼ ▼ | 2026-10-26 | ▼ -1.10% | ▼ 0.00% | 343.92 | 347.09 | 341.03 | 343.91 | ▼ 344.01 | 42,392,152 |
| ▼ AMZN | ▲ ▼ ▼ | 2026-10-26 | ▲ +0.44% | ▼ -0.15% | 249.47 | 250.79 | 247.23 | 249.09 | ▼ 249.18 | 31,659,007 |
| ▼ META | ▼ ▼ ▼ | 2026-10-26 | ▼ -1.88% | ▼ -1.22% | 638.36 | 647.69 | 627.80 | 630.56 | ▼ 634.43 | 30,829,189 |
| ▼ GOOGL | ▼ ▼ ▼ | 2026-10-26 | ▼ -1.06% | ▼ -1.27% | 320.89 | 321.48 | 316.60 | 316.80 | ▼ 318.31 | 23,955,258 |
| AVG/Sum | — | — | +0.79% | +0.25% | — | — | — | — | — | 290,701,752 |
Mag7 Stocks
Positive confluence: average DOC% +0.25% from the open; DNC% +0.79% versus the prior close. Tesla led both comparisons, gaining 2.03% and 5.21%, respectively, but closed below VWAP; Alphabet lagged from the open, Meta versus the prior close, and Apple was essentially flat from the open. Microsoft’s moving-average uptrends remained aligned.
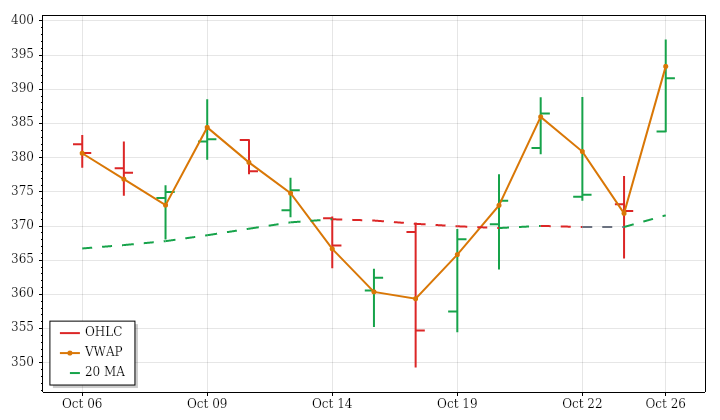
TSLA · D:2026-10-26 NC% ▲ +5.21% OC% ▲ +2.03%
TSLA – Tesla Technicals Summary
TSLA’s completed daily session on October 26 rose 5.21% from the prior close and 2.03% from the open, ending at 391.62. A substantial opening gap up remained unfilled, while further intraday gains produced a higher high and higher low and a close above the previous day’s high. The finish nevertheless remained below session VWAP, qualifying the strength of the daily advance.
Near- and intermediate-term uptrends were aligned, but the far-term structure remained mixed because price was above an average still falling. The prior 15-session price trend was slightly negative with very little net directional efficiency, contrasting with the latest surge. Both range and volume were well above average, consistent with expanding ranges and increasing activity across that lookback. PSAR and ATR-median were positive; a next-session low below 359.2826 would conditionally trigger a bearish PSAR reversal.
Tesla News and Fundamentals
Tesla’s third-quarter results were mixed, while Full Self-Driving subscriptions continued growing. The company reported $1.53 billion in free cash flow last week. Separate analysis highlighted pressure from declining regulatory credits and stagnant deliveries, with services gross profit exceeding total company operating income. Barclays cited a potential SpaceX merger when changing its outlook, but that remains analyst speculation rather than an announced transaction.
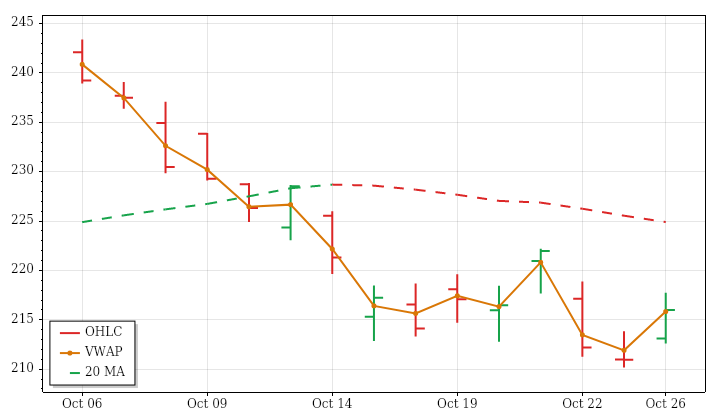
NVDA · D:2026-10-26 NC% ▲ +2.39% OC% ▲ +1.36%
NVDA – Nvidia Technicals Summary
NVDA’s completed daily session on October 26 gained 2.39% from the prior close and 1.36% from the open, ending at 216.00. The opening gap up remained unfilled. Higher daily highs and lows, a close above the previous day’s high, and a finish slightly above session VWAP made the latest session constructive despite the weaker recent backdrop.
The rebound did not eliminate the near-term downtrend: price remained just below its falling average. The intermediate-term structure was mixed because price was below a rising average, while the far-term uptrend remained intact. This left shorter-term weakness within a stronger long-term framework. Range was approximately average despite expanding ranges over the prior 15 sessions, and below-average volume continued the declining activity trend. PSAR and ATR-median remained bearish; a next-session high above 220.4486 would conditionally reverse PSAR upward.
Nvidia News and Fundamentals
Nvidia’s Vera Rubin chips are in production shipments, with purchase orders from major customers. Its CFO said the revenue opportunity per gigawatt has increased from about $18 billion for Hopper to $25 billion for Blackwell and $40 billion for Vera Rubin. Nvidia is also undergoing a sales and marketing leadership transition as veterans retire, creating openings for internal successors and outside hires.
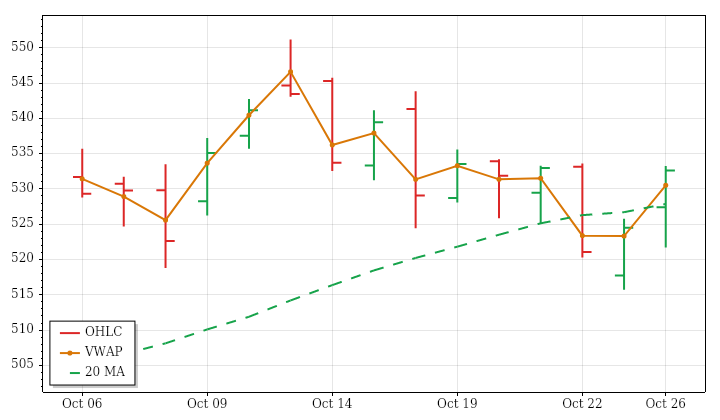
MSFT · D:2026-10-26 NC% ▲ +1.54% OC% ▲ +0.99%
MSFT – Microsoft Technicals Summary
MSFT’s completed daily session on October 26 rose 1.54% from the prior close and 0.99% from the open to finish at 532.60. The opening gap up was filled, but price subsequently closed above the previous day’s high, near the session high and above VWAP. Higher daily highs and lows accompanied a range moderately larger than average.
Near-, intermediate- and far-term uptrends were aligned, with price above rising averages throughout. That structure contrasted with the slightly negative, low-efficiency price trend across the prior 15 sessions, indicating that the lookback had been choppy rather than steadily advancing. Expanding ranges continued, but below-average volume matched a declining volume trend. PSAR and ATR-median still carried bearish states. A next-session high above the nearby 533.25 threshold would conditionally trigger a bullish PSAR reversal; proximity alone was not confirmation.
Microsoft News and Fundamentals
Microsoft offered voluntary buyouts to roughly 60,000 employees, about 27% of its global workforce, as it reshapes staffing and controls costs amid heavy AI investment. Eligible workers include selected employees in the U.S., U.K., Canada and India, generally outside data centers, sales and marketing. The company cautioned that it did not expect many employees to accept. Its upcoming fiscal first-quarter report will update Azure and Copilot growth alongside rising infrastructure spending.
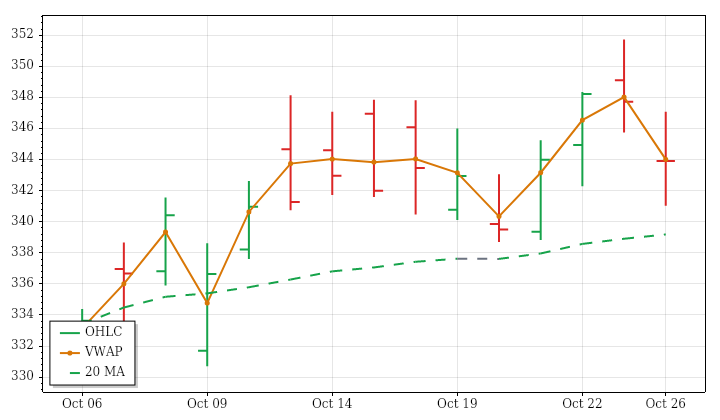
AAPL · D:2026-10-26 NC% ▼ -1.10% OC% ▼ 0.00%
AAPL – Apple Technicals Summary
AAPL’s completed daily session on October 26 closed at 343.91, down 1.10% from the prior close but essentially unchanged from the open. The loss therefore reflected the unfilled opening gap down rather than a sustained open-to-close decline. Price traded on both sides of the open, formed a lower high and lower low, and finished below the previous day’s low and slightly below session VWAP.
That weakness interrupted, rather than erased, the broader rising structure. Price slipped just below a rising near-term average, leaving that horizon mixed, while intermediate- and far-term uptrends remained intact. The session’s slightly above-average range and volume fit the prior 15 sessions’ expanding ranges and increasing activity. PSAR moved into a short state despite the positive ATR-median trend; a next-session high above 351.73 would conditionally trigger a bullish PSAR reversal.
Apple News and Fundamentals
Apple is navigating strong early demand for its first foldable iPhone, the iPhone Duo, alongside softer iPhone 18 Pro demand. Analysts warned that manufacturing constraints could limit the benefits of the foldable-led upgrade cycle. Shares reached a record $351.73 on Friday before closing at $347.73. Apple is also managing a leadership handoff and an AI rollout. Fiscal fourth-quarter results are due Nov. 2 after the market closes.
AMZN · D:2026-10-26 NC% ▲ +0.44% OC% ▼ -0.15%
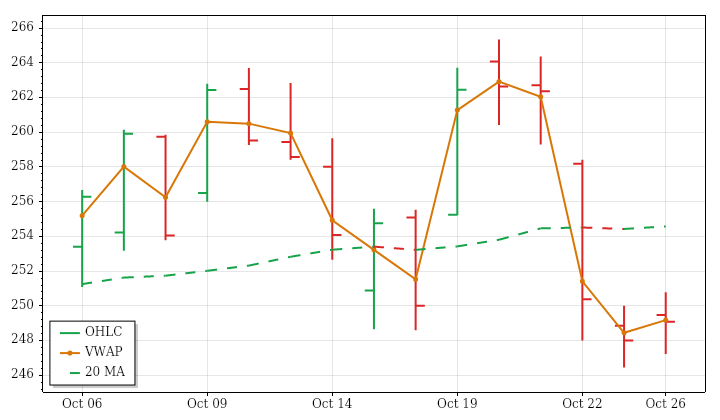
AMZN – Amazon Technicals Summary
AMZN’s completed daily session on October 26 gained 0.44% from the prior close to finish at 249.09, although it slipped 0.15% from the open. The opening advance was retraced to the prior-close reference before the session ended higher. A higher high and higher low offered some improvement, but the close remained within the previous day’s range and just below session VWAP.
The advance did not resolve the broader trend conflict. Price remained below rising near- and intermediate-term averages, while holding above a rising far-term average. The prior 15-session price trend was slightly negative and highly uneven, consistent with limited directional progress. Both range and volume were below average despite expanding ranges and increasing volume across that lookback. Bearish PSAR and ATR-median readings persisted; a next-session high above 262.6009 would conditionally reverse PSAR upward.
Amazon News and Fundamentals
Amazon recently increased its capital-spending forecast as it expands AI infrastructure and works to convert AWS backlog into revenue. AWS sales growth has accelerated for five consecutive quarters, with reported capacity sold out through 2027 and a $496 billion backlog. Its upcoming third-quarter report will provide an update on cloud revenue conversion, backlog growth and the financial impact of the infrastructure buildout.
META · D:2026-10-26 NC% ▼ -1.88% OC% ▼ -1.22%
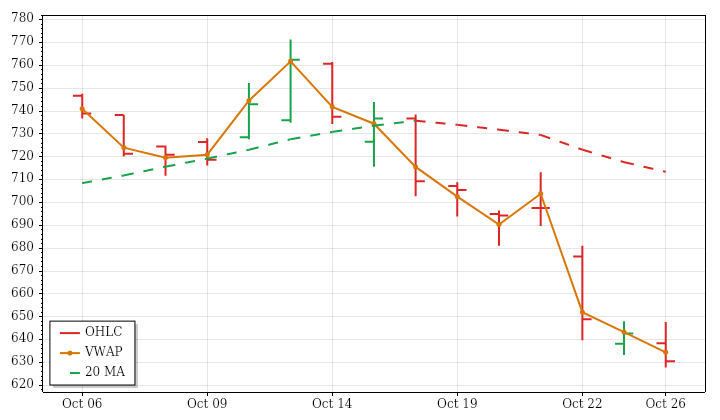
META – Meta Platforms Technicals Summary
META’s completed daily session on October 26 declined 1.88% from the prior close and 1.22% from the open, ending at 630.56. The opening gap down was filled, but that recovery did not hold. Price formed a lower high and lower low, closed beneath the previous day’s low, and finished near the session low and below VWAP.
The loss reinforced the near-term downtrend while exposing conflict in the longer horizons. Price remained below a rising intermediate-term average and slipped just beneath a rising far-term average, leaving both structures mixed rather than fully bearish. The daily range was below average despite expanding lookback ranges. Volume, however, reached roughly 160% of average, consistent with increasing activity over the prior 15 sessions. PSAR and ATR-median remained bearish; a next-session high above 694.7198 would conditionally reverse PSAR upward.
Meta News and Fundamentals
Meta announced plans to raise up to $95 billion to fund its AI expansion, with stock offerings potentially beginning as early as next year. A planned mandatory convertible preferred offering is expected to carry a 6%–6.5% dividend yield. Third-quarter revenue rose 26% year over year to $64.6 billion, supported by AI-enhanced advertising performance. Rising expenses and legal charges are pressuring margins, while elevated capital spending and potential share issuance raise dilution concerns.
GOOGL · D:2026-10-26 NC% ▼ -1.06% OC% ▼ -1.27%
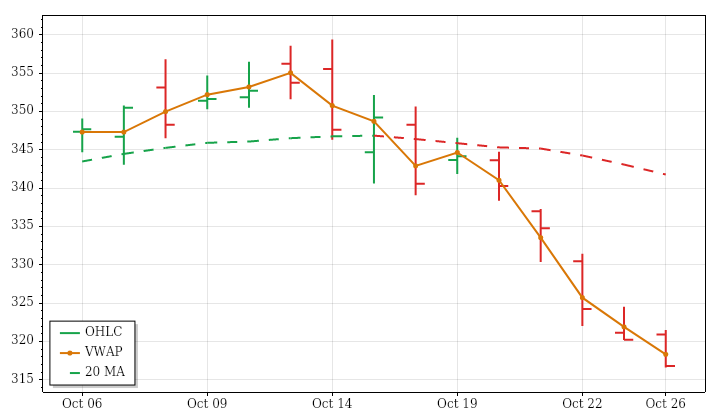
GOOGL – Alphabet Technicals Summary
GOOGL’s completed daily session on October 26 finished at 316.80, down 1.06% from the prior close and 1.27% from the open. An initial gap up was filled before price extended lower. The lower high and lower low, close beneath the previous day’s low, and finish near the session low reinforced the negative daily story. Price also ended below session VWAP.
This decline aligned with near-, intermediate- and far-term downtrends rather than conflicting with a stronger underlying structure. All three averages were falling with price beneath them, consistent with the negative prior 15-session trend. The daily range was substantially below average even though lookback ranges were expanding, while slightly above-average volume followed the increasing volume trend. PSAR and ATR-median remained bearish; a next-session high above 335.4792 would conditionally trigger a bullish PSAR reversal.
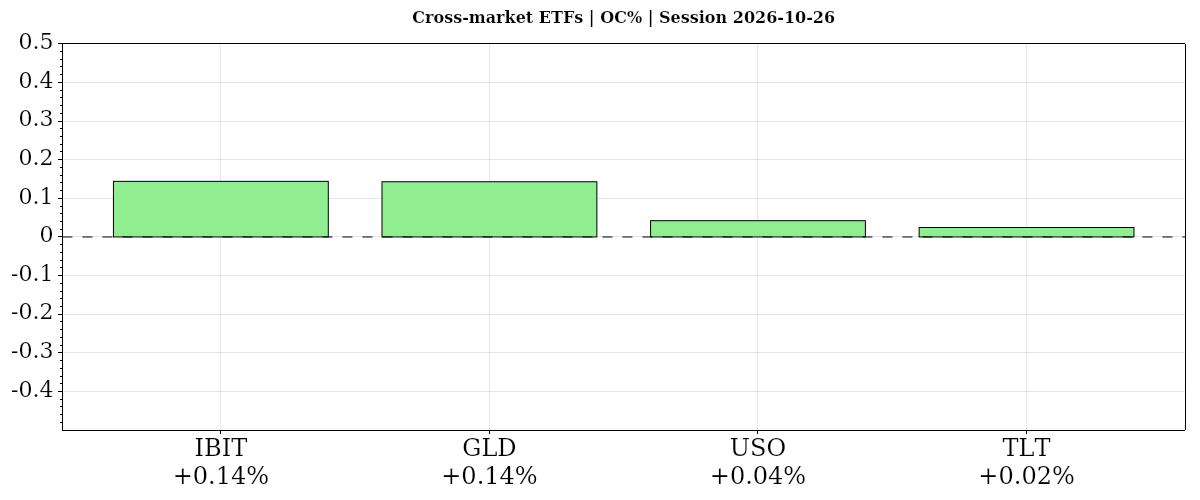
| Instrument | Bias | Date | DNC% | DOC% | O | H | L | C | VWAP | Vol |
|---|---|---|---|---|---|---|---|---|---|---|
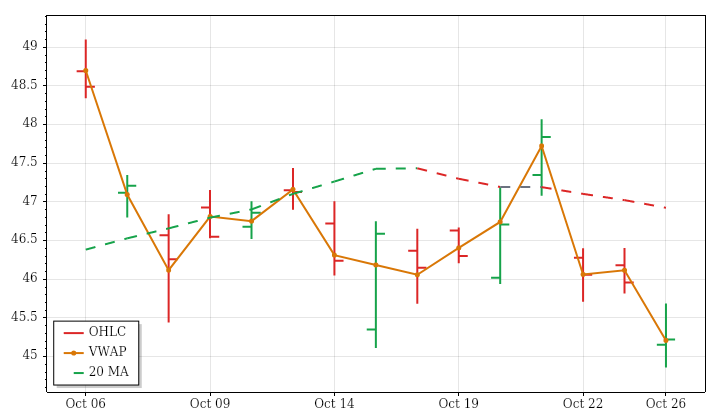
| ▲ IBIT | ▼ ▲ ▲ | 2026-10-26 | ▼ -1.61% | ▲ +0.14% | 45.16 | 45.69 | 44.86 | 45.22 | ▲ 45.21 | 30,212,967 |
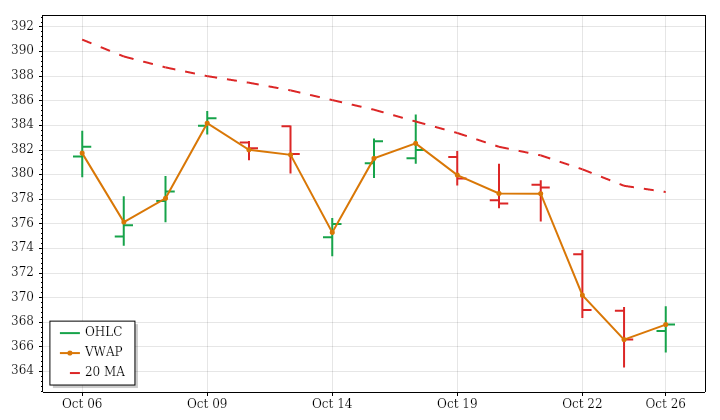
| ▲ GLD | ▲ ▲ ▲ | 2026-10-26 | ▲ +0.33% | ▲ +0.14% | 367.30 | 369.31 | 365.54 | 367.82 | ▲ 367.81 | 6,397,167 |
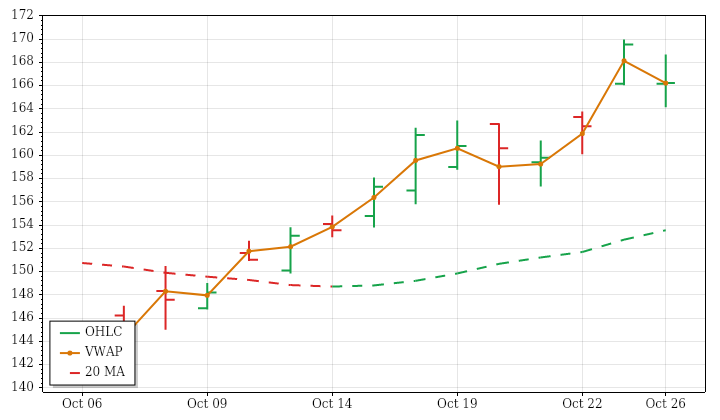
| ▲ USO | ▼ ▲ ▲ | 2026-10-26 | ▼ -1.95% | ▲ +0.04% | 166.16 | 168.68 | 164.14 | 166.23 | ▲ 166.21 | 5,545,866 |
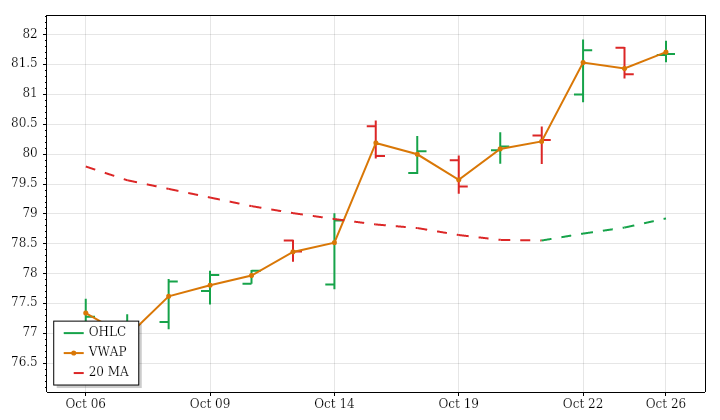
| ▲ TLT | ▲ ▲ ▼ | 2026-10-26 | ▲ +0.42% | ▲ +0.02% | 81.66 | 81.90 | 81.54 | 81.68 | ▼ 81.71 | 24,243,109 |
| AVG/Sum | — | — | -0.70% | +0.09% | — | — | — | — | — | 66,399,109 |
Cross-Market ETFs
Mixed: average DOC% +0.09% from the open; DNC% -0.70% versus the prior close. Gold and bitcoin led modest open-to-close gains; bonds and oil were nearly flat. Oil and bitcoin fell versus the prior close, diverging from equities despite closing above their opens; gold’s broader downtrends and oil’s broader uptrends persisted.
IBIT · D:2026-10-26 NC% ▼ -1.61% OC% ▲ +0.14%
IBIT – Bitcoin Technicals Summary
IBIT’s completed daily session on October 26 closed at 45.22, down 1.61% from the prior close despite gaining 0.14% from the open. The unfilled opening gap down accounted for the daily loss. Price formed a lower high and lower low and finished beneath the previous day’s low, although it held marginally above session VWAP after trading on both sides of the open.
Shorter-term weakness remained in conflict with the far-term uptrend. Price was below a falling near-term average and below a still-rising intermediate-term average, but above the rising far-term average. The daily range was slightly below average, consistent with mild range contraction over the prior 15 sessions. Volume was also below average, unlike its increasing lookback trend. Bearish PSAR and ATR-median states persisted; a next-session high above 48.07 would conditionally reverse PSAR upward.
GLD · D:2026-10-26 NC% ▲ +0.33% OC% ▲ +0.14%
GLD – Gold Technicals Summary
GLD’s completed daily session on October 26 rose 0.33% from the prior close and 0.14% from the open, finishing at 367.82. The opening gap up was filled, but price recovered enough to establish a higher high and higher low. The close remained inside the previous day’s range and only marginally above session VWAP, making this a modest daily improvement rather than evidence of a broader reversal.
Near-, intermediate- and far-term trends remained aligned downward, with price below falling averages across all three horizons. The latest gain therefore ran against both that structure and the negative prior 15-session price trend. Range was above average, consistent with expanding lookback ranges, but volume was below average despite an increasing lookback trend. PSAR and ATR-median remained bearish; a next-session high above 381.9003 would conditionally reverse PSAR upward.
Gold News and Fundamentals
Spot gold rose 0.50% to about $4,014.49 an ounce in early U.S. trading on Oct. 26. The rebound was attributed to declining crude prices easing inflation concerns and pressure on precious metals ahead of that week’s Federal Reserve meeting. Later reporting described gold struggling around $4,000 despite 10-year Treasury yields below 5%. Central-bank demand had helped lift gold above $5,600 earlier in 2026, but sentiment subsequently became more cautious amid the continuing Middle East conflict.
USO · D:2026-10-26 NC% ▼ -1.95% OC% ▲ +0.04%
USO – Oil Technicals Summary
USO’s completed daily session on October 26 closed at 166.23, down 1.95% from the prior close despite edging up 0.04% from the open. The daily loss primarily reflected an unfilled opening gap down. Price traded above and below the open, formed a lower high and lower low, and finished within the previous day’s range, marginally above session VWAP.
The setback contrasted with aligned near-, intermediate- and far-term uptrends, with price still above rising averages across all horizons. The strong positive price trend over the prior 15 sessions therefore remained distinct from the latest decline. Above-average range and volume were consistent with expanding ranges and increasing activity across that lookback, rather than a quiet pause. PSAR and ATR-median remained positive; a next-session low below 161.8768 would conditionally trigger a bearish PSAR reversal.
Oil News and Fundamentals
Oil prices eased on Oct. 26 ahead of monetary-policy decisions from the Federal Reserve, European Central Bank and Bank of Japan, with lingering inflation risks in focus.
TLT · D:2026-10-26 NC% ▲ +0.42% OC% ▲ +0.02%
TLT – Long-Term Treasury Bonds Technicals Summary
TLT’s completed daily session on October 26 gained 0.42% from the prior close but only 0.02% from the open, finishing at 81.68. Most of the gain therefore came from the unfilled opening gap up. Price established a higher high and higher low, yet closed inside the previous day’s range and slightly below session VWAP after moving on both sides of the open.
Near-term strength remained at odds with the longer-term structure. Price was above a rising near-term average and above a falling intermediate-term average, but below the falling far-term average. The positive prior 15-session price trend supported the recent recovery without resolving that conflict. Both range and volume were substantially below average despite expanding ranges and increasing activity across the lookback. PSAR and ATR-median remained positive; a next-session low below 80.5856 would conditionally reverse PSAR downward.
Glossary: Instrument — ticker symbol; hover for the instrument or company name; Date — session date. DNC% — prior-session close to this session’s close; DOC% — daily session open-to-close percentage change. O — open; H — high; L — low; C — close, all for the table’s daily or weekly session; VWAP — volume-weighted average price; its arrow shows whether the close is above or below VWAP. Vol — period trading volume.
Bias — three directional readings, in order: DNC%, DOC%, then VWAP. ▲ positive/above; ▼ negative/below; — neutral or unavailable. Matching arrows show alignment; opposing arrows show mixed conditions. AVG/Sum — simple average of percentage changes and sum of reported volumes.
Futures Higher Time Frame Analysis
Summary of the current state of US Indices Futures based on higher time-frame (HTF) technical analysis as of: 2026-10-26 16:00 -04:00 CT.
US Indices Futures
- ES YSFG upward, MSFG below F0%, weekly longer benchmarks rising, daily DTrend, recent short signals, support 7648.50/7595.75/7575.00, resistance 7809.00/7897.50–7906.25.
- NQ YSFG/WSFG upward, MSFG below F0%, daily/weekly DTrend, rising 200-day benchmark near 28437.5, support 28987, resistance 30102.50/31089.50/31616.50–31618.50.
- YM YSFG/MSFG/WSFG upward, weekly longer benchmarks rising, weekly DTrend, daily consolidation, support 51970/50859, resistance 53168–53195/53688/55316.
- EMD YSFG/MSFG/WSFG upward, daily below all declining benchmarks, DTrend, weekly long signals, support 3600.3–3604.1/3332.6, pivot thresholds 3699.6/3705.9, resistance 3737.8/3790.7.
- RTY YSFG upward, MSFG below F0%, daily/weekly DTrend, weekly longer benchmarks rising, daily 20–200 benchmarks declining, support 2723.0–2723.3, resistance 2803.7/2887.2–2887.7/3101.8.
- FDAX YSFG/MSFG upward, WSFG below F0%, DTrend, HiLo UTrend, below daily 5/10/55/100 benchmarks, support 25119–24897, pivot threshold 25725, resistance 25833/25990/26255/26847.
Overall State
- Short-Term: Bearish
- Intermediate-Term: Neutral
- Long-Term: Bullish
Conclusion
Short-term DTrend structures show correlated corrective pressure across the indices. Intermediate structure is divided: ES, NQ, and RTY remain below MSFG F0%, while YM, EMD, and FDAX retain upward monthly grids. Yearly grids and rising longer weekly benchmarks preserve the broader upward context, although EMD and RTY carry bearish daily long-term ratings. YM shows relative intermediate-term strength; EMD displays the broadest daily benchmark weakness. ES and FDAX short signals contrast with EMD weekly long signals. Listed swing supports and overhead pivot thresholds define the current retracement structures; NQ and YM retain upward WSFG readings while FDAX remains below weekly F0%.
Note: Intra-day counter-trend pullbacks or retracements may occur, HTF is context for informational usage and market structure. Glossary: Session Fib Grids periods of YSFG:’Yearly’, MSFG:’Monthly’, WSFG:’Weekly’
For full details visit: AlphaWebTrader Technicals
SPY Daily View
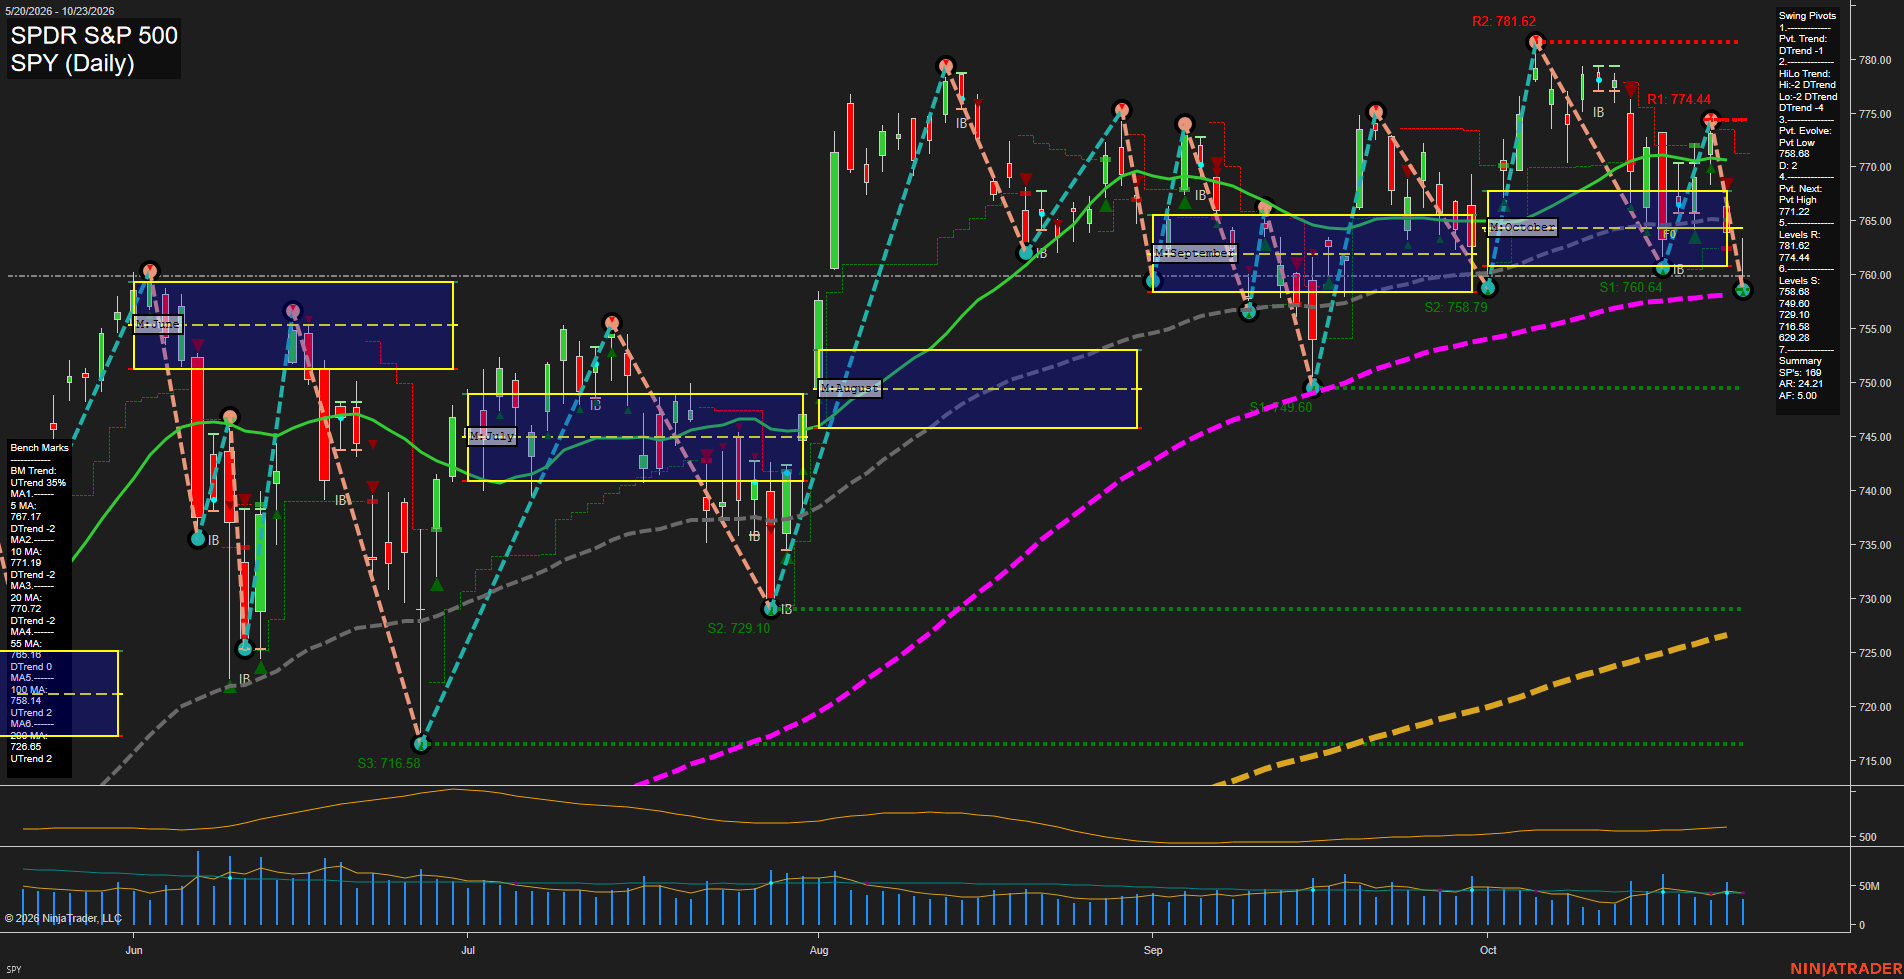
Overall Rating
- Short-Term: Bearish
- Intermediate-Term: Bearish
- Long-Term: Bullish.
Key Insights Summary
SPY’s futures-equivalent swing structure is in a fast downside rotation, with price closing at the active 758.68 pivot-low support after a sharp rejection from the 774.44 resistance area. The short-term pivot and intermediate HiLo structures are both DTrend, while price is below the 5-, 10-, 20-, and 55-day benchmark cluster. The 758.68 level is the immediate structural inflection point; lower supports are 749.60 and 728.10. A recovery through 771.22 would define the next pivot-high reversal threshold, with 774.44 and 781.62 the overhead swing resistance levels. Long-term structure remains constructive because the 100-day and 200-day benchmarks continue rising, placing the current decline within a longer-term bullish trend that is undergoing a pronounced intermediate-term pullback.
View charts on: AlphaWebTrader HTF Charts
ES Daily View
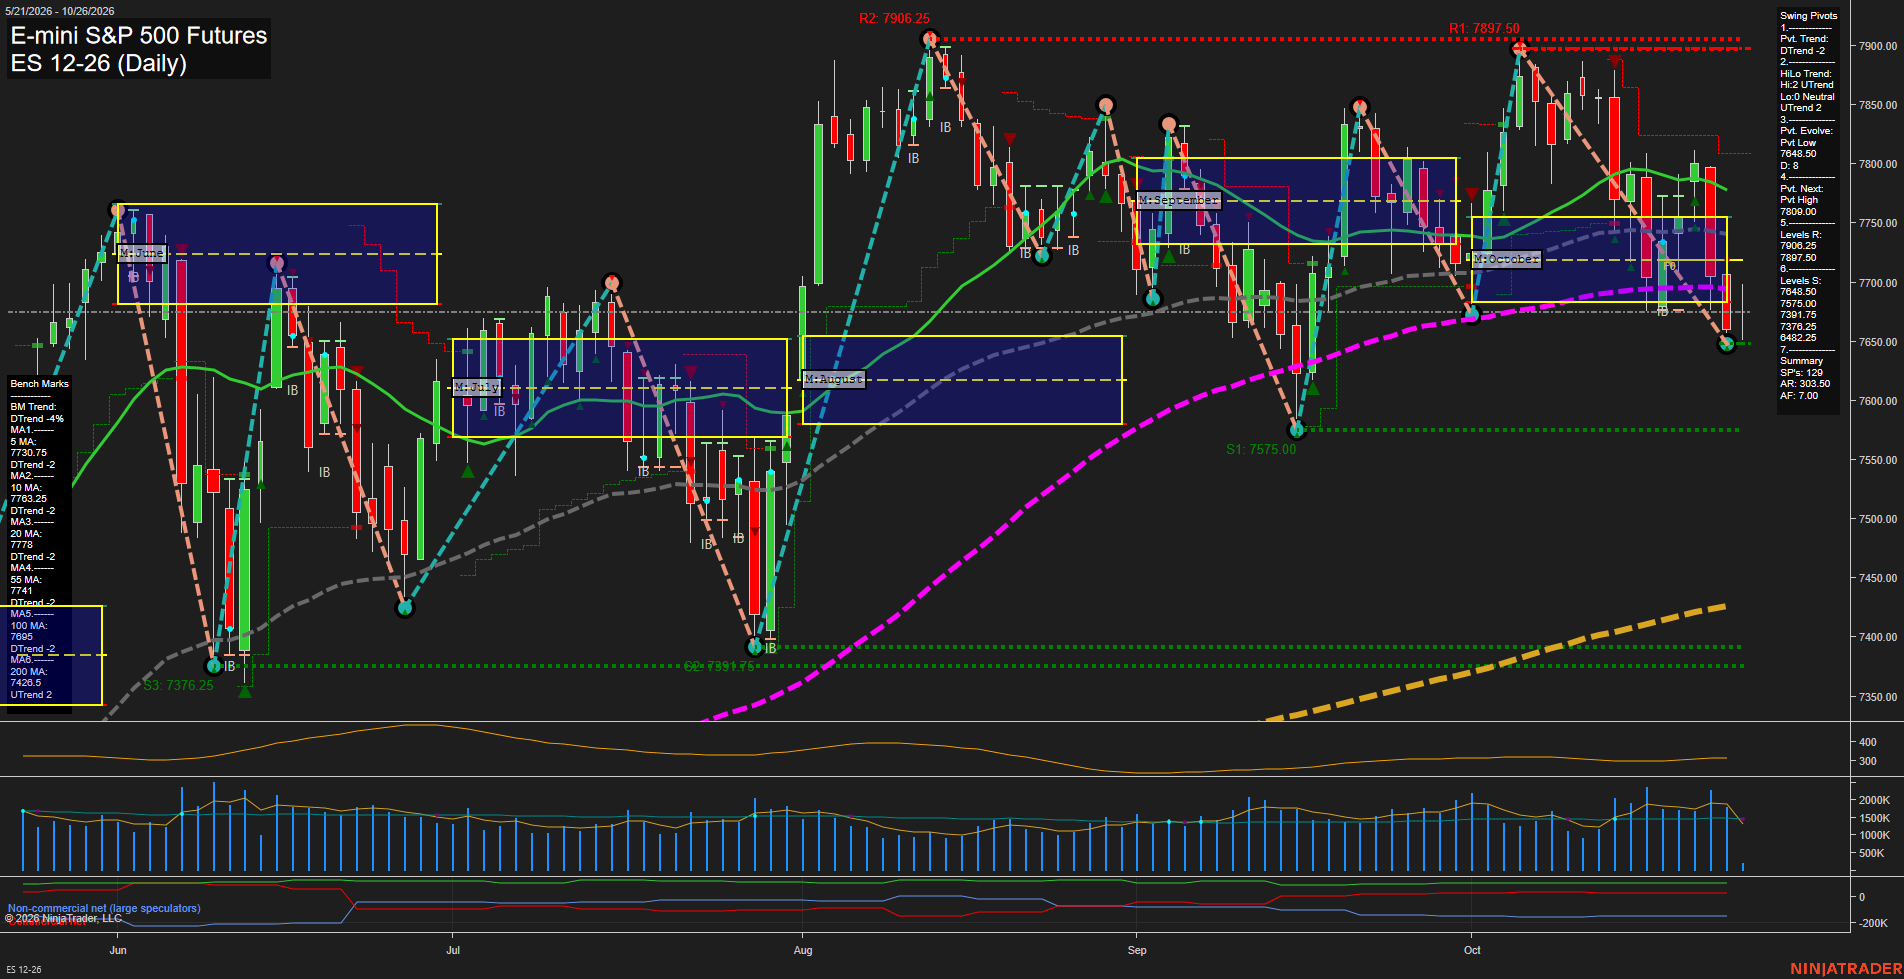
Overall Rating
- Short-Term: Bearish
- Intermediate-Term: Bearish
- Long-Term: Bullish.
Key Insights Summary
Price has accelerated lower from the October swing-high region near 7897.50, producing large-range bearish bars and a short-term DTrend pivot structure. The decline has broken beneath the 5-, 10-, 20-, 55-, and 100-day benchmarks, while the monthly grid remains below its F0% area, confirming intermediate-term downside pressure. The 7648.50 pivot-low area is the immediate structural support, with 7575.00 the next prominent downside reference. Despite the current selloff, the intermediate HiLo pivot trend and yearly grid remain upward, supported by the rising 200-day benchmark; this frames the present move as a sharp countertrend retracement within the broader long-term advance. Resistance is concentrated at 7809.00 and the 7897.50-7906.25 prior-high zone.
View charts on: AlphaWebTrader HTF Charts
QQQ Daily View
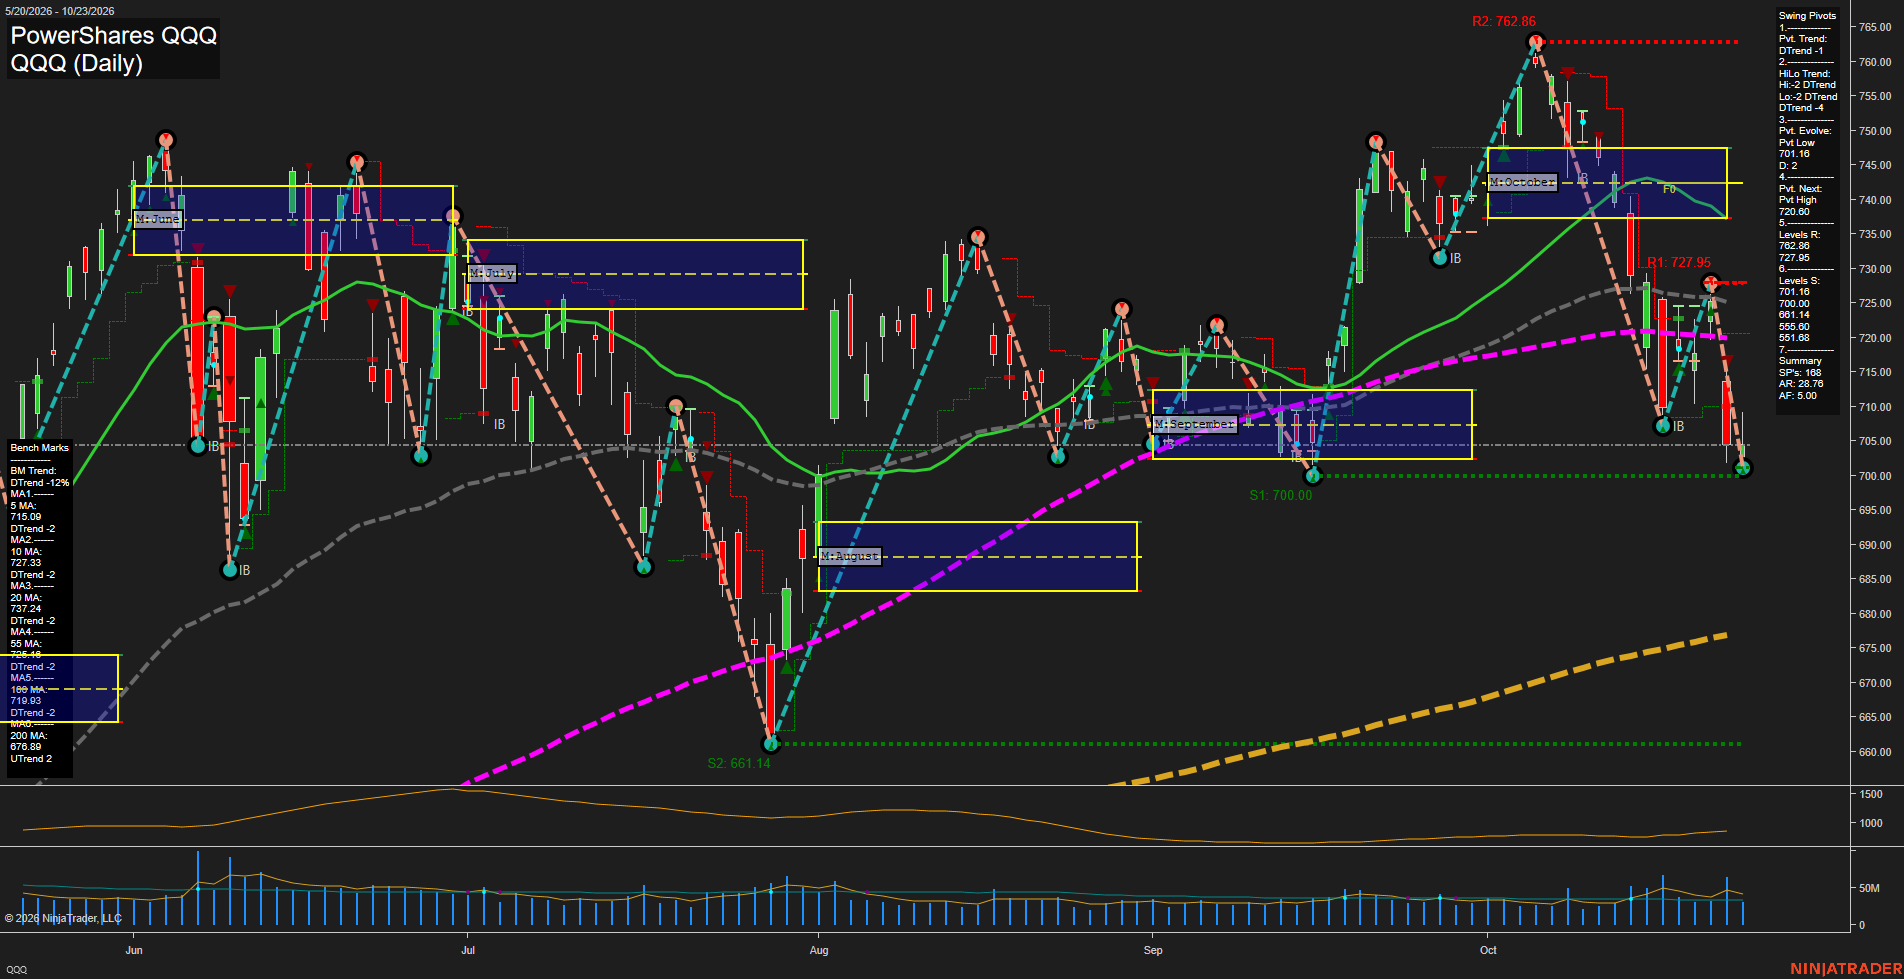
Overall Rating
- Short-Term: Bearish
- Intermediate-Term: Bearish
- Long-Term: Neutral.
Key Insights Summary
For a futures swing trader, QQQ reflects a sharp downside impulse from the October high near 765 into the 701 pivot-low area. Short-term and intermediate pivot structures are both in DTrend, while price is below every benchmark through the 100-day average. The 701.16 area is the immediate structural support; 727.95 is the nearest overhead pivot resistance, followed by the 720.60 pivot-reversal threshold. Large daily ranges and a 28.76 ATR indicate an expanded-volatility, fast-momentum selloff. The rising 200-day average near 676.89 preserves longer-term underlying support, but current price action remains a countertrend decline beneath the October monthly grid.
View charts on: AlphaWebTrader HTF Charts
NQ Daily View
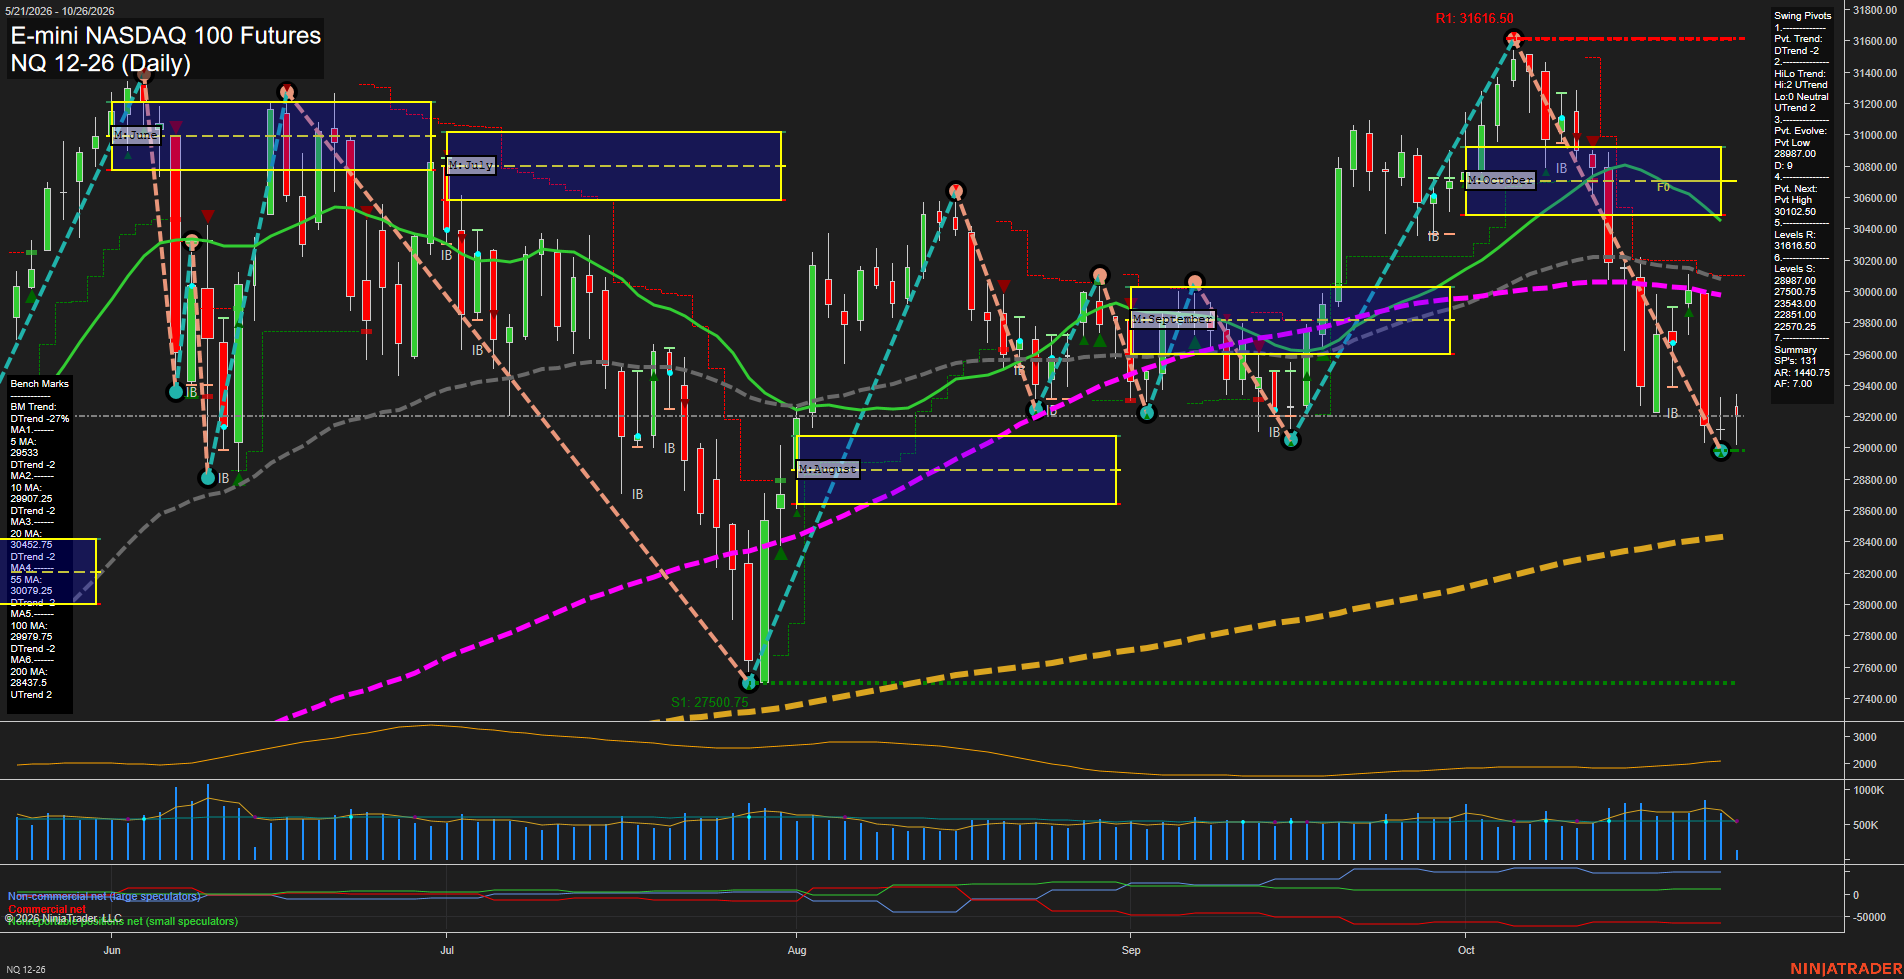
Overall Rating
- Short-Term: Bearish
- Intermediate-Term: Bearish
- Long-Term: Neutral.
Key Insights Summary
Price is rebounding from the 28987 swing-low area, but the daily pivot structure remains in a DTrend and price remains beneath the 5, 20, 55, and 100-day benchmarks. The October MSFG remains decisively below F0%, defining the decline from the 31618.50 pivot high as an intermediate-term pullback. The weekly and yearly grids retain upward bias, while the rising 200-day benchmark near 28437.5 preserves the longer-cycle bullish foundation. The 30102.50 pivot-next level and clustered 55-to-100-day averages form the principal overhead retracement zone; 28987.00 is the immediate swing support defining the current rebound attempt.
View charts on: AlphaWebTrader HTF Charts
USO Daily View
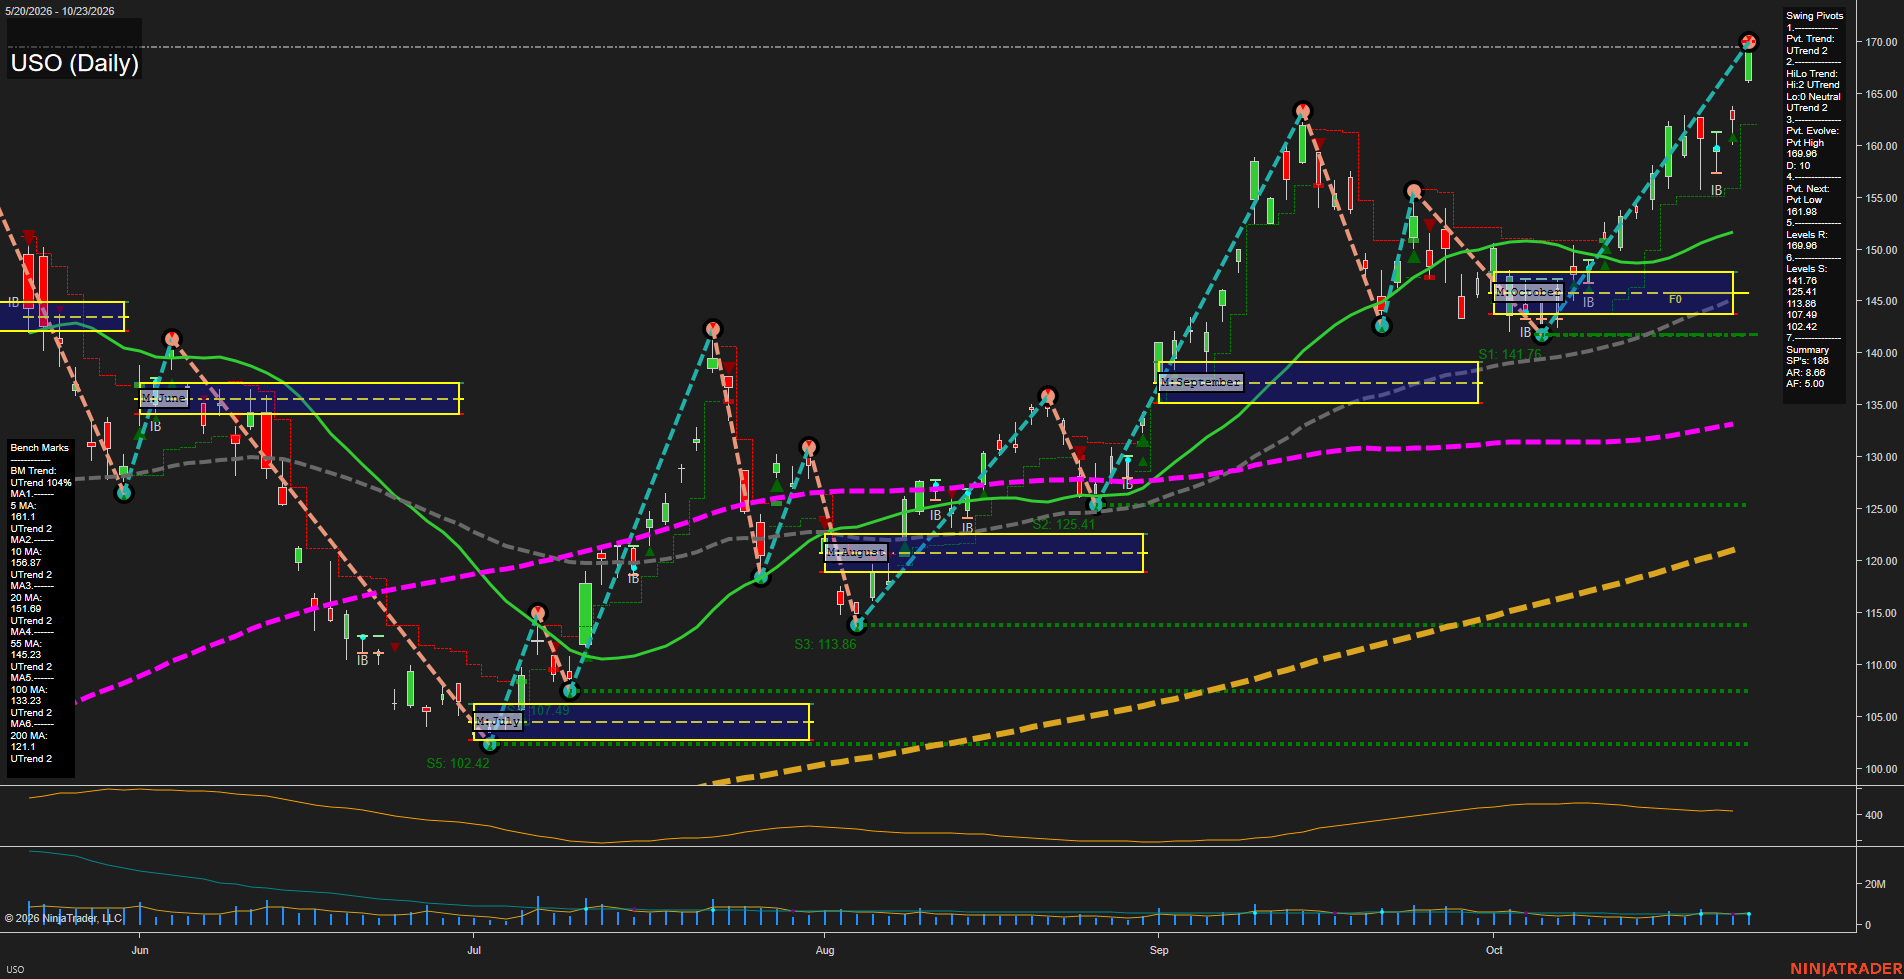
Overall Rating
- Short-Term: Bullish
- Intermediate-Term: Bullish
- Long-Term: Bullish.
Key Insights Summary
USO remains in a broad futures-style swing advance, with price holding above every benchmark average and the moving-average structure positively aligned from 5-day through 200-day. The recent advance has carried price toward the 169.98 pivot-high resistance area after a sequence of higher highs and higher lows. Short-term momentum is fast, while the current pullback from the recent high is contained near the 5-day average and the 161.98 pivot-reversal level. The October monthly grid is beneath current price, reinforcing an intermediate-term upside bias; 154.61 is the nearest meaningful structural support beneath the current swing range.
View charts on: AlphaWebTrader HTF Charts
CL Daily View
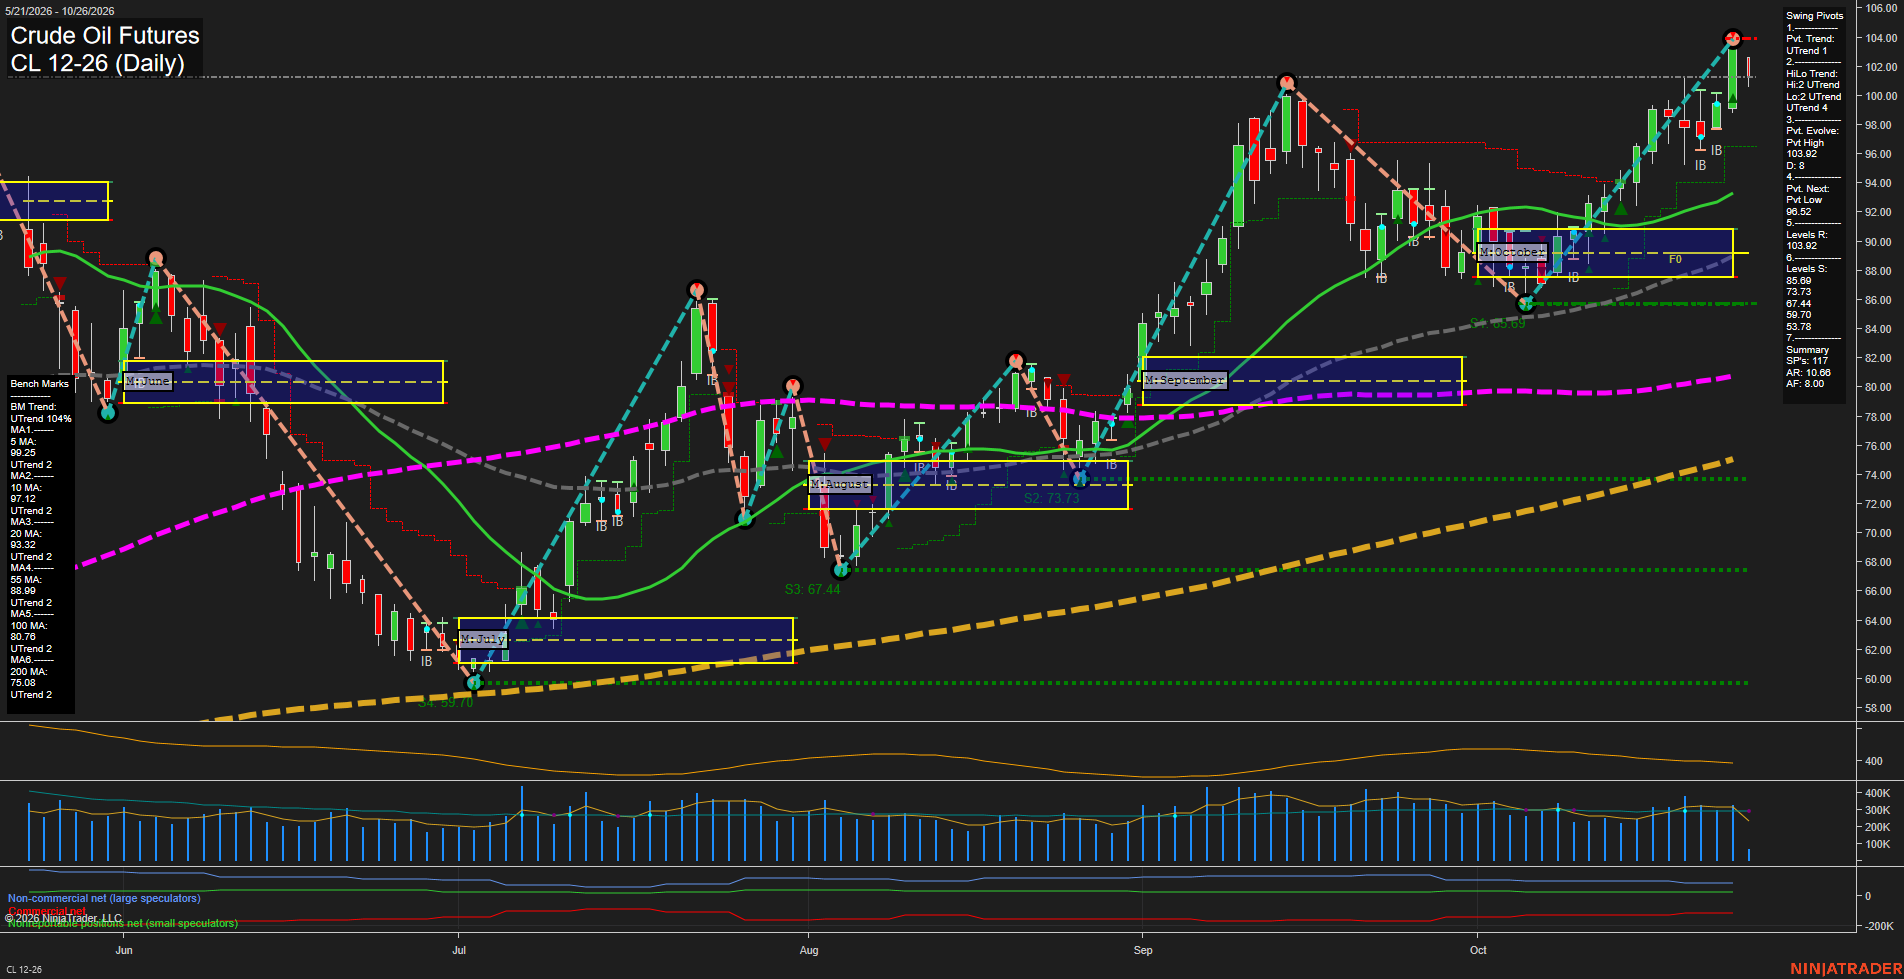
Overall Rating
- Short-Term: Bullish
- Intermediate-Term: Bullish
- Long-Term: Bullish.
Key Insights Summary
Crude oil remains in a broadly aligned daily upswing, with price holding above every benchmark moving average and both pivot structures confirming higher-high and higher-low behavior. The latest large red daily bar reflects a sharp rejection from the 103.92 pivot-high resistance area, creating a short-term countertrend pullback within the larger advance. The 99.25 to 97.12 short-term moving-average zone and the 96.52 next-pivot level define the nearest structural retracement area, while a recovery through 103.92 would re-establish breakout momentum. Monthly and yearly fib-grid positioning remain above their central reference areas, supporting the intermediate and long-term bullish trend backdrop.
View charts on: AlphaWebTrader HTF Charts
GLD Daily View
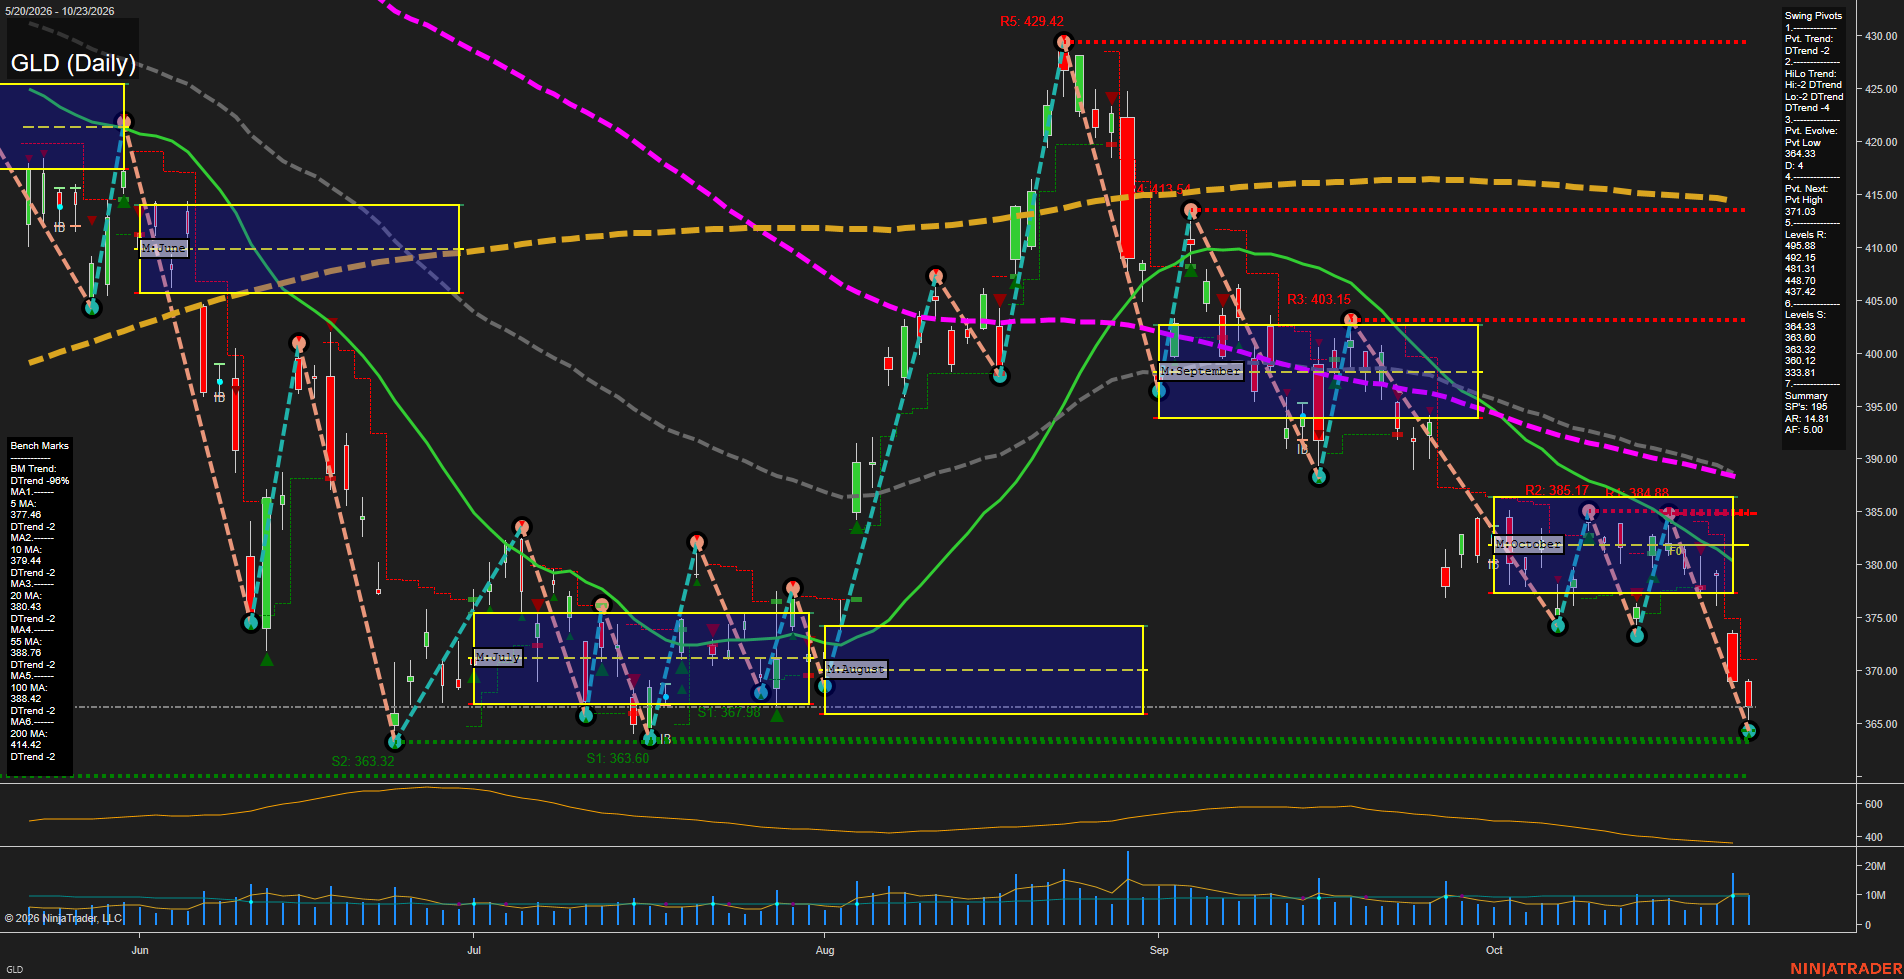
Overall Rating
- Short-Term: Bearish
- Intermediate-Term: Bearish
- Long-Term: Bearish.
Key Insights Summary
GLD reflects a broad futures-style liquidation phase: price has broken beneath the October monthly NTZ and all daily benchmark averages, while both pivot structures remain in DTrend alignment. The decline is accelerating with large bars and fast downside momentum, producing a fresh pivot low at 364.33 near clustered support at 363.60 to 360.12. The 371.03 pivot-reversal threshold is the nearest short-term structural reference overhead, followed by the declining 5-day and 10-day averages near 377.48 and 379.44. The broader structure remains defined by lower highs from the 429.42 peak and lower lows into late October, with the 200-day average at 414.42 emphasizing the extent of the long-term trend deterioration.
View charts on: AlphaWebTrader HTF Charts
GC Daily View
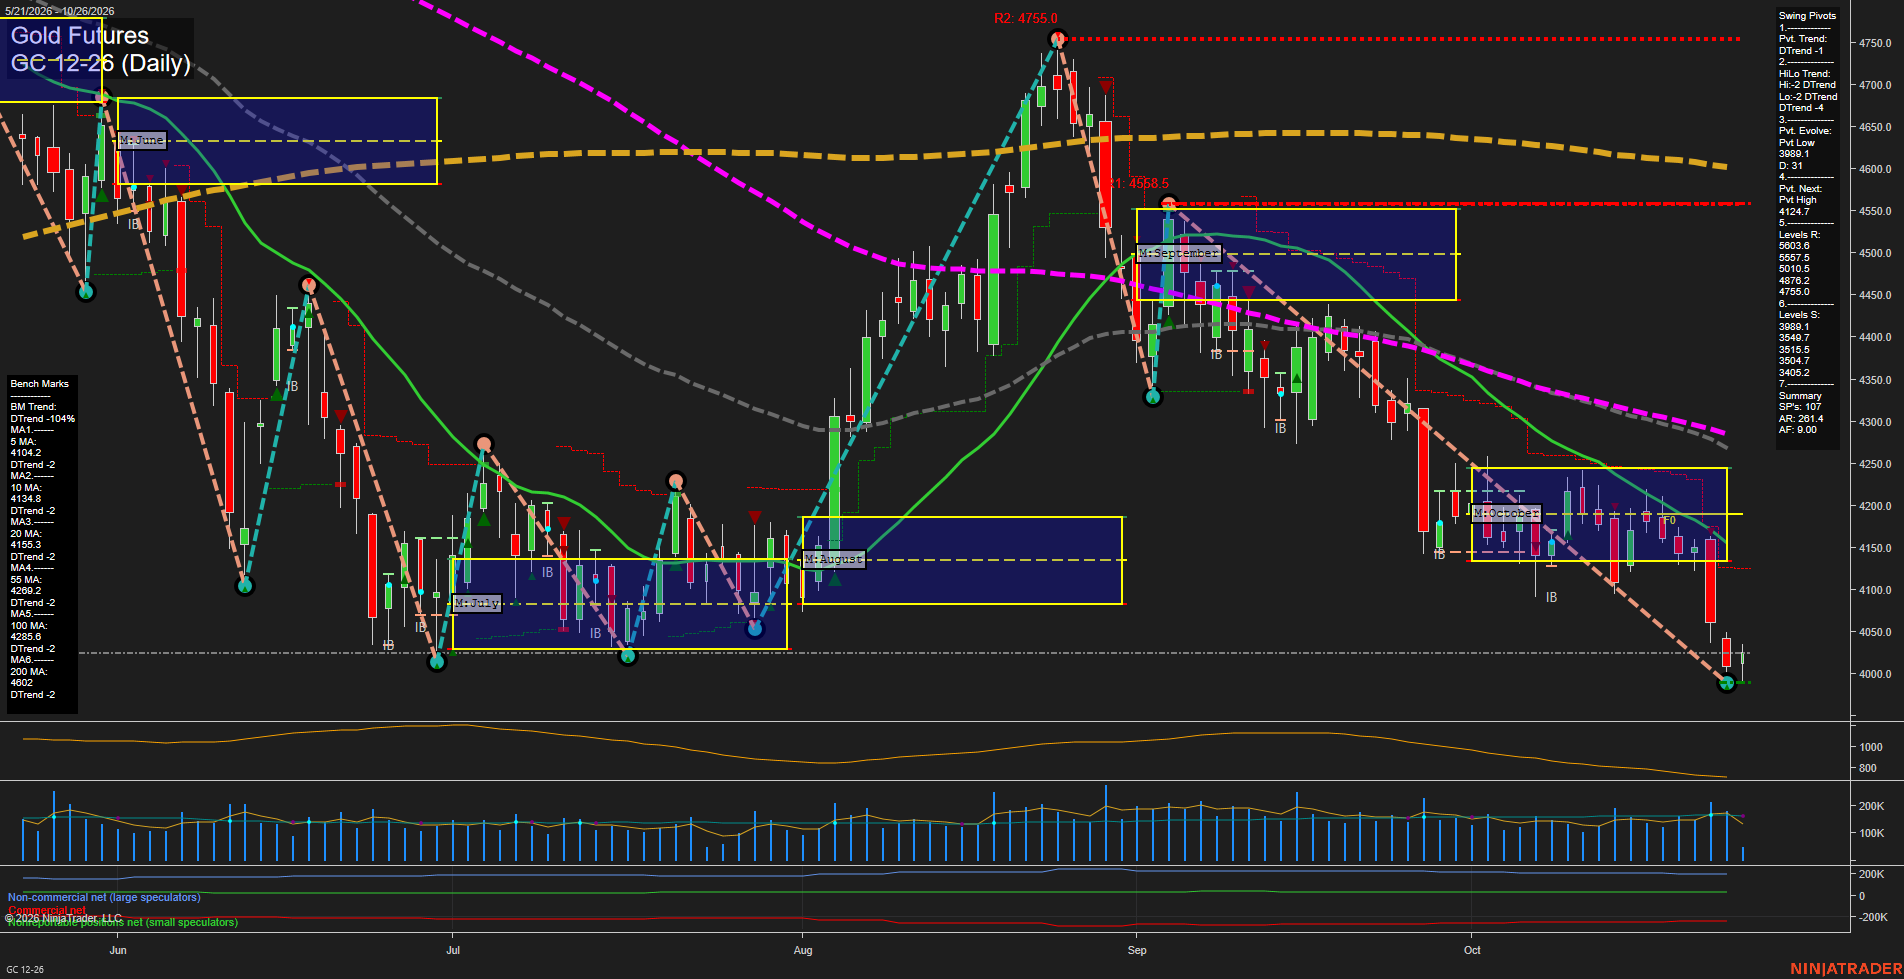
Overall Rating
- Short-Term: Bearish
- Intermediate-Term: Bearish
- Long-Term: Bearish.
Key Insights Summary
Gold futures remain in a broad bearish swing structure following the rejection from the 4755 pivot high. Fast downside momentum has driven price beneath every benchmark average and below the October MSFG balance area. The current low pivot at 3998.1 is being tested, while 4124.7 defines the next short-term pivot reversal threshold. The weekly grid remains marginally positive, indicating a countertrend condition inside a larger monthly and yearly decline; however, the sequence of lower highs, lower lows, and declining moving averages continues to define the dominant trend.
View charts on: AlphaWebTrader HTF Charts
ZB Daily View
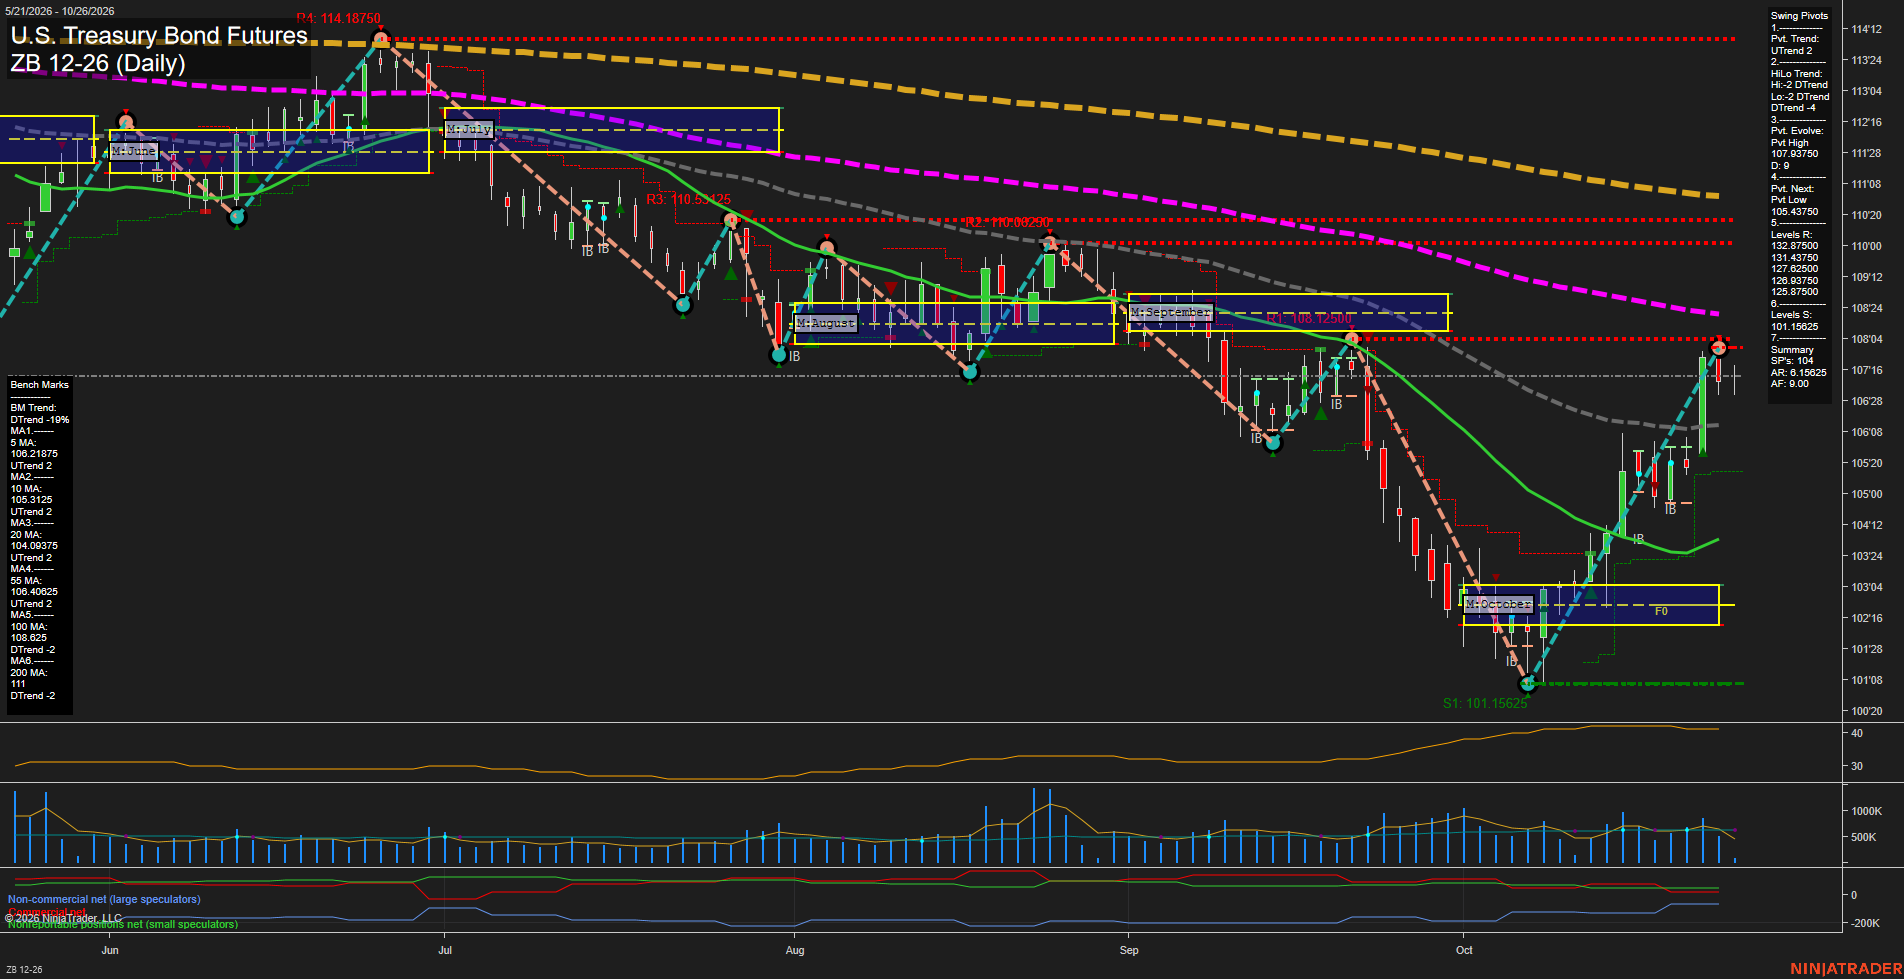
Overall Rating
- Short-Term: Bullish
- Intermediate-Term: Bullish
- Long-Term: Bearish.
Key Insights Summary
The daily structure shows a strong short-term recovery from the October 101.15625 swing low, with price above the weekly and monthly F0% areas and above all short-to-intermediate benchmark averages. The UTrend pivot condition and rising 5-, 10-, 20-, and 55-day averages confirm positive near-term momentum, although the latest small bars beneath the 107.93750 pivot high indicate consolidation after a fast advance. Intermediate structure has improved materially but remains countertrend relative to the broader HiLo DTrend. Long-term conditions remain bearish because price is below declining 100- and 200-day benchmarks and the annual fib-grid bias remains below F0%.
View charts on: AlphaWebTrader HTF Charts
Sentiment Summary: Coverage leaned positive (35% positive, 22% negative), but neutral articles led at 43%, reflecting attention to upcoming earnings and the Fed rather than a uniform directional view. Anthropic’s October 26 IPO filing and optimism around cloud and AI demand supported Nvidia and Microsoft, while Tesla rose following a Barclays upgrade. The counterweight was scrutiny of AI financing and returns, highlighted by Meta’s planned $95 billion capital raise and Microsoft’s buyout offers to 60,000 employees, ahead of the October 28 Fed decision and Microsoft and Alphabet earnings, followed by Amazon on October 29.
Conclusion: Mega-cap concentration makes this week’s earnings a material index-level event risk.