Nasdaq slips ahead of Thursday’s 8:30 ET GDP/PCE data, 11:30/13:00 ET Treasury auctions and Amazon and Intel earnings after the close; S&P 500 stays bullish.
Fundamentals: Nasdaq futures weaken ahead of Thursday's 8:30 ET GDP, PCE inflation, jobless claims, personal income and spending data, with Amazon and Intel reporting after the close. Treasury auctions follow at 11:30 ET for $115 billion in four-week bills and $110 billion in eight-week bills, then 13:00 ET for $44 billion in seven-year notes. Alphabet's earnings miss and AI spending concerns weigh on technology shares, contrasting with Microsoft's strong Azure growth.
Technicals: S&P 500 futures retain a bullish structure but remain below nearby resistance, while Nasdaq futures show a choppy recovery within a weaker medium trend. Dow futures are consolidating after their October rebound, and small- and mid-cap recoveries face overhead technical barriers. DAX futures have regained all displayed daily moving averages and are approaching pivot resistance after a strong late-October rally.
Pre-Market Trading 360° view Market Radar of: holidays, earnings, eco-news, market-news summary, news sentiment, prior session major ETFs, MAG7, Higher Time Frame Analysis Indices Futures Summary, and E-mini S&P500, Nasdaq 100, NYMEX Crude, Gold Futures Daily Chart analysis.
As of: October 29, 2026 07:16 CT
Earnings Radar
Monitoring for earnings releases by the Magnificent 7, AI-tech-related firms, and major financial institutions.
| Date/Day | Impact | Company / Symbol | Time | EPS | Revenue | ||||
|---|---|---|---|---|---|---|---|---|---|
| 2026-10-29 – Thursday | High | Amazon (AMZN) | After close |
|
| ||||
| 2026-10-29 – Thursday | Medium | Intel (INTC) | After close |
|
|
Conclusion: AMZN and INTC report after market close today, October 29; both releases remain ahead at publication time, with no actual results provided. AMZN’s MAG7 status and INTC’s semiconductor exposure give these reports broad index relevance; market momentum and volume can slow ahead of major tech earnings.
For full details visit: Yahoo Earnings Calendar
EcoNews Radar U.S. Events
| Date | Impact | Event, Prev, Forecast, Actual | Info |
|---|---|---|---|
| 2026-10-29 Thursday 08:30 | High | Advance GDP q/q Prev: 1.5% Forecast: 3.2% Actual: — | Provides an initial estimate of inflation-adjusted economic output growth. Index futures traders monitor it for implications for corporate earnings, economic momentum and interest-rate expectations. |
| 2026-10-29 Thursday 08:30 | High | Core Personal Consumption Expenditures – Price Index (MoM) Prev: 0.2 Forecast: 0.3 Actual: — | Measures monthly changes in consumer prices excluding food and energy. Traders watch this underlying inflation gauge for signals about Federal Reserve policy and equity valuations. |
| 2026-10-29 Thursday 08:30 | High | Gross Domestic Product Price Index Prev: 6.1 Forecast: 3.5 Actual: — | Measures price changes across domestically produced final goods and services. Traders use it to assess broad inflation pressures and distinguish nominal expansion from real growth. |
| 2026-10-29 Thursday 08:30 | Medium | Initial Jobless Claims Prev: 194K Forecast: 199K Actual: — | Counts new applications for unemployment benefits. Traders monitor this timely labor-market indicator for signs of changing layoffs, economic resilience and monetary-policy expectations. |
| 2026-10-29 Thursday 08:30 | Medium | Personal Income (MoM) Prev: 0.2 Forecast: 0.3 Actual: — | Tracks changes in household income from wages, investments and other sources. Traders assess its implications for consumers’ purchasing power, demand and corporate revenues. |
| 2026-10-29 Thursday 08:30 | Medium | Personal Spending Prev: 0.9 Forecast: 0.6 Actual: — | Measures household outlays on goods and services. Traders monitor consumer demand because it shapes economic growth and earnings prospects across consumer-sensitive sectors. |
| 2026-10-29 Thursday 08:30 | High | Core Personal Consumption Expenditures – Price Index (YoY) Prev: 3 Forecast: 3.1 Actual: — | Measures annual consumer inflation excluding food and energy. Traders monitor its persistence relative to the Federal Reserve’s inflation objective and implications for interest rates. |
| 2026-10-29 Thursday 08:30 | Medium | Core Personal Consumption Expenditures (QoQ) Prev: 3.3 Forecast: 2.4 Actual: — | Measures quarterly changes in consumer prices excluding food and energy. Traders use it to assess underlying inflation momentum and the potential monetary-policy outlook. |
| 2026-10-29 Thursday 08:30 | High | Gross Domestic Product Annualized Prev: 2.2 Forecast: 3.2 Actual: — | Expresses inflation-adjusted output growth at an annual rate. Traders monitor it to gauge economic momentum and reassess earnings and interest-rate expectations. |
| 2026-10-29 Thursday 08:30 | Medium | Personal Consumption Expenditures – Price Index (MoM) Prev: 0.3 Forecast: 0.5 Actual: — | Tracks monthly price changes across household consumption, including food and energy. Traders watch it for near-term inflation developments that can influence monetary-policy expectations. |
| 2026-10-29 Thursday 08:30 | Medium | Personal Consumption Expenditures – Price Index (YoY) Prev: 3.4 Forecast: 3.6 Actual: — | Tracks annual price changes across household consumption. As the Federal Reserve’s targeted inflation measure, it helps traders assess progress toward price stability and the policy outlook. |
| 2026-10-29 Thursday 08:30 | Medium | Personal Consumption Expenditures Prices (QoQ) Prev: 5 Forecast: 3.4 Actual: — | Measures quarterly price changes in household consumption, including food and energy. Traders monitor it for broad inflation trends and their implications for rates and equity valuations. |
| 2026-10-29 Thursday 11:30 | Medium | 4-Week Bill Auction · $115B Prev: 3.945% Forecast: — Actual: — | Reveals demand and the clearing yield for short-term Treasury funding. Traders monitor auction pricing for signals about money-market conditions and front-end interest rates. |
| 2026-10-29 Thursday 11:30 | Medium | 8-Week Bill Auction · $110B Prev: — Forecast: — Actual: — | Shows investor demand and the clearing yield for short-term government debt. Traders use the results to assess cash-market conditions and pricing across nearby Treasury maturities. |
| 2026-10-29 Thursday 13:00 | High | 7-Year Note Auction · $44B Prev: 5.085% Forecast: — Actual: — | Reveals investor demand and the clearing yield for intermediate-term Treasury debt. Traders monitor the outcome because Treasury yield changes can affect discount rates and equity valuations. |
| 2026-10-30 Friday 08:30 | Medium | Employment Cost Index Prev: 0.9 Forecast: 0.8 Actual: — | Measures changes in employers’ wage and benefit costs while controlling for employment composition. Traders watch it for persistent compensation pressures relevant to inflation and monetary policy. |
| 2026-10-30 Friday 09:45 | Medium | Chicago PMI Prev: 58.8 Forecast: 56.1 Actual: — | Surveys Chicago-area business conditions, including orders, production and employment. Traders use it as a regional signal of business momentum ahead of broader activity reports. |
| 2026-10-30 Friday 12:00 | Medium | Fed's Daly speech Prev: — Forecast: — Actual: — | Offers commentary from a Federal Reserve policymaker. Traders monitor remarks for clues about the economic outlook, inflation assessment and potential policy direction. |
| 2026-10-30 Friday 12:30 | Medium | Fed's Musalem speech Prev: — Forecast: — Actual: — | Provides a Federal Reserve policymaker’s perspective on economic conditions and monetary policy. Traders watch for guidance that could influence rate expectations and equity valuations. |
Summary: The calendar centers on U.S. growth and inflation, alongside household demand, labor conditions, Treasury financing and Federal Reserve commentary.
Conclusion: The main economic releases are concentrated today, with compensation data, a regional business survey and policymaker remarks following tomorrow.
NYSE Session Open Gap Radar
Session gaps compare the predicted opening price with the prior session’s close to predict the upcoming session’s opening gap pattern.
| Instrument | Gap | Prior Close | Predicted Open | Gap % |
|---|---|---|---|---|
| IWM | ▲ OGU | 281.29 | 281.79 | ▲ +0.18% |
| USO | ▼ IGU | 166.57 | 166.81 | ▲ +0.14% |
| IJH | ▲ IGD | 73.35 | 73.33 | ▼ -0.03% |
| DIA | ▲ IGD | 524.68 | 522.82 | ▼ -0.35% |
| SPY | ▼ OGD | 772.31 | 769.01 | ▼ -0.43% |
| TLT | ▼ OGD | 80.99 | 80.49 | ▼ -0.61% |
| GLD | ▲ IGD | 373.51 | 369.13 | ▼ -1.17% |
| QQQ | ▼ OGD | 725.61 | 716.36 | ▼ -1.27% |
Before the session opens, the table shows the predicted opening price and gap. Once the session opens, it uses the recorded opening price.
Glossary: IGU — Inside Gap Up: above the prior close, within the prior session’s range. IGD — Inside Gap Down: below the prior close, within that range. OGU — Outside Gap Up: above the prior session’s high. OGD — Outside Gap Down: below the prior session’s low.
As of: 2026-10-29 07:16 CT. Predicted gaps are best estimates as of publication and may change before the regular-session open, particularly when the session is still some time away.
Market News Summary:
Nasdaq futures weakened after Alphabet’s earnings disappointment renewed scrutiny of AI spending, while Microsoft’s results provided a contrasting source of strength.
Primary Drivers & Risks:
- Primary Driver: Alphabet earnings miss and AI spending concerns.
- Primary Risk: GDP and inflation data affecting rate expectations.
Tone:
Negative for technology shares, with mixed company results and renewed inflation concerns.
Market News Sentiment
Sentiment Bias shows the balance of positive and negative news coverage sampled from 2026-10-28 08:31 to 2026-10-29 07:32 ET, covering stocks, energy and gold.
▲ Market news
- Bias
- ▲ +6.92%
- Articles
- 260
- Positive
- ▲ 30.38%
- Neutral
- — 46.15%
- Negative
- ▼ 23.46%
▼ GLD / Gold
- Bias
- ▼ -35.71%
- Articles
- 14
- Positive
- ▲ 14.29%
- Neutral
- — 35.71%
- Negative
- ▼ 50.00%
Sentiment Summary: Gold coverage leaned negative (50% negative, 14% positive, 36% neutral), with rising Treasury yields pressuring metals before the October 28 Fed decision; the 10–2 hold at 3.75%–4.00%, with two officials favoring a hike, kept December tightening in focus. Gold steadied in late U.S. trading before declining in early Asian trading, while October 29 reports highlighted support around $4,000. The main counterweight was reported improvement in gold demand during a rebound, although technical coverage still described sellers as dominant.
Conclusion: The supported cross-market context is persistent rate pressure, reinforced by higher crude prices and inflation concerns following reported regional tensions.
▼ USO / Oil
- Bias
- ▼ -27.27%
- Articles
- 22
- Positive
- ▲ 13.64%
- Neutral
- — 45.45%
- Negative
- ▼ 40.91%
Sentiment Summary: Coverage leaned negative (41% negative, 45% neutral, 14% positive), as October 28 reports linked Middle East escalation risks and a fourth consecutive weekly U.S. crude inventory decline to elevated oil prices and inflation concerns. Oil fell early October 29 on reported U.S.-Iran diplomatic outreach, countering the prior session’s supply fears; stronger profits at Neste and YPF provided positive company-level offsets. The Fed held rates at 3.75%–4% on October 28 while signaling a possible December increase, with indices reportedly showing little reaction to the decision or rising crude.
Conclusion: Elevated crude and Treasury yields remained reported constraints on equity momentum despite strong earnings.
Glossary: Sentiment Bias = (positive articles − negative articles) ÷ total articles × 100. It ranges from −100% negative to +100% positive. A reading near zero indicates little directional bias. Neutral articles reduce the score’s strength. ▲ positive; ▼ negative; — balanced. These readings describe news coverage, not market-price direction.
Market Technical Analysis
Analysis of VIX volatility, prior-session major ETFs and mega-cap tech stocks, and real-time futures snapshots and higher-time-frame analysis.
VIX — Market Fear Gauge Daily
| Level | Open | High | MaxVix | Low | MinVix | DNC% | DOC% | VR | MaxVR | MinVR |
|---|---|---|---|---|---|---|---|---|---|---|
| 16.92 | 17.38 | 17.77 | 22.31 | 16.21 | 14.77 | -3.42% | -2.65% | 9.95 | 41.30 | -0.20 |
VIX fell 2.65% from the session's opening level. VIX fell 3.42% versus the previous session close. Expected volatility eased from the period open. VIX is 28.5% up the recent 15-session range (14.77–22.31), in the 20–30% band.
VR: ATN Volatility Ratio (VR): 9.95 – Stocks rose while expected volatility eased. VR is in the lower part of its preceding 15-session VR range (-0.20 to 41.30), in the 20–30% band. VR rose 1.51 points from the previous session, a small shift relative to that range.
Range lookback: preceding 15 completed sessions.
Major ETFs and Mega Cap Tech Stocks
- Nasdaq futures declined as Alphabet’s results and Samsung’s earnings renewed global concerns about AI profitability.
- Alphabet shares fell more than 10% in Wednesday’s after-hours trading after a profit miss, slower advertising growth and continued heavy AI spending.
- Alphabet’s search and other revenue rose 12% to roughly $63 billion but missed estimates for the second consecutive quarter.
- Google executives acknowledged that AI search generates less revenue than traditional search despite rising query volumes.
- AMD fell 3.3%, Intel declined 3.6% and Nvidia slipped 1% in Thursday’s early trading amid concerns about AI infrastructure costs.
- Microsoft shares rose more than 5% Wednesday afternoon after revenue and profit exceeded estimates, supported by 48% growth in Azure.
- Oracle gained 11% on Wednesday following its investor day, contrasting with Alphabet’s negative earnings reception.
- Amazon reports third-quarter results after Thursday’s close amid scrutiny of returns on AI capital spending.
- Tesla generated $1.5 billion in third-quarter free cash flow, with capital discipline offset by uncertainty around Optimus and Robotaxi timelines.
- Eli Lilly raised its outlook for the third time this year as Zepbound sales increased.
- Fortinet and ServiceNow shares fell after hours despite beating revenue estimates, alongside broader software-sector weakness.
Fed / Financials:
- The Fed held off on raising rates, and its policy update initially supported a market rally before Alphabet’s results shifted attention back to technology earnings.
- Inflation concerns remain central to the policy outlook, with further rate decisions tied to incoming economic data.
Macro / Other:
- GDP and inflation figures are scheduled for Thursday at 8:30 a.m. Eastern, or 7:30 a.m. at the report’s publication offset.
Conclusion:
Alphabet’s earnings miss, weaker search monetization and heavy AI spending dominate the negative Nasdaq futures backdrop. Semiconductor losses extend the earnings reaction beyond Alphabet.
Microsoft’s strong Azure growth and Oracle’s gains provide contrasting evidence of investor support for demonstrated AI returns. The imminent GDP and inflation releases add a separate policy-sensitive catalyst after the Fed left rates unchanged.
ETF, Mag7, and Cross-Market ETF prior day Insights
Overall Tone
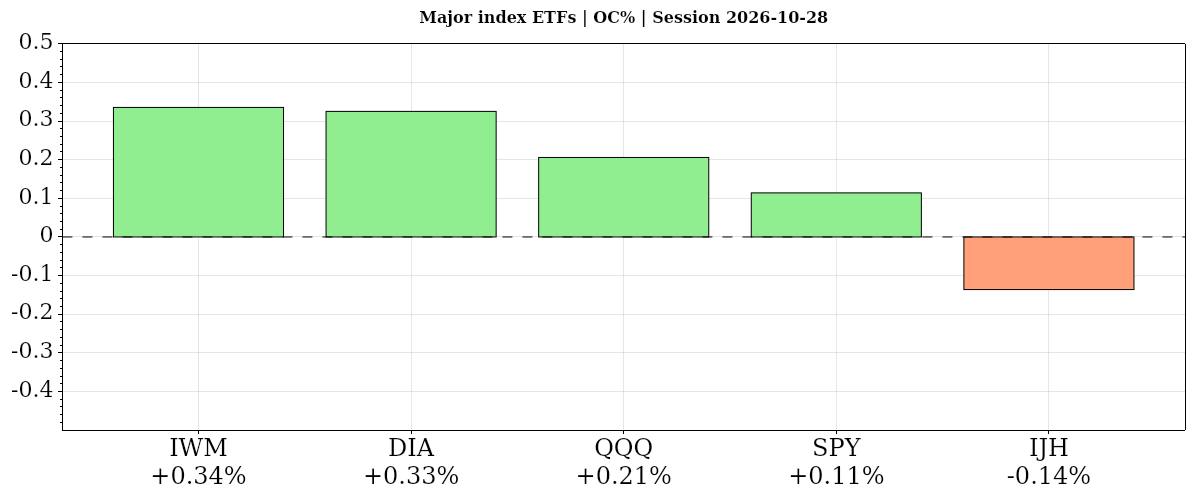
On October 28, 2026, daily risk tone was cautiously positive: most index ETFs gained from the open, but mega-cap participation was weak.
| Instrument | Bias | Date | DNC% | DOC% | O | H | L | C | VWAP | Vol |
|---|---|---|---|---|---|---|---|---|---|---|
| ▲ IWM | ▲ ▲ ▲ | 2026-10-28 | ▲ +0.40% | ▲ +0.34% | 280.35 | 281.48 | 279.05 | 281.29 | ▲ 280.29 | 18,220,793 |
| ▲ DIA | ▲ ▲ ▲ | 2026-10-28 | ▲ +0.27% | ▲ +0.33% | 522.98 | 525.77 | 522.80 | 524.68 | ▲ 524.23 | 2,194,529 |
| ▲ QQQ | ▲ ▲ ▲ | 2026-10-28 | ▲ +0.60% | ▲ +0.21% | 724.12 | 726.14 | 720.30 | 725.61 | ▲ 722.99 | 27,761,001 |
| ▲ SPY | ▲ ▲ ▲ | 2026-10-28 | ▲ +0.34% | ▲ +0.11% | 771.43 | 773.36 | 769.24 | 772.31 | ▲ 771.29 | 29,181,630 |
| ▼ IJH | ▲ ▼ ▲ | 2026-10-28 | ▲ +0.18% | ▼ -0.14% | 73.45 | 73.48 | 72.87 | 73.35 | ▲ 73.22 | 6,579,738 |
| AVG/Sum | — | — | +0.36% | +0.17% | — | — | — | — | — | 83,937,691 |
Index ETFs
Positive confluence: average DOC% +0.17% from the open; DNC% +0.36% versus the prior close. Four of five gained from the open, led by IWM and DIA, while IJH slipped; all five rose versus the prior close, led by QQQ. Index gains came on below-average volume.
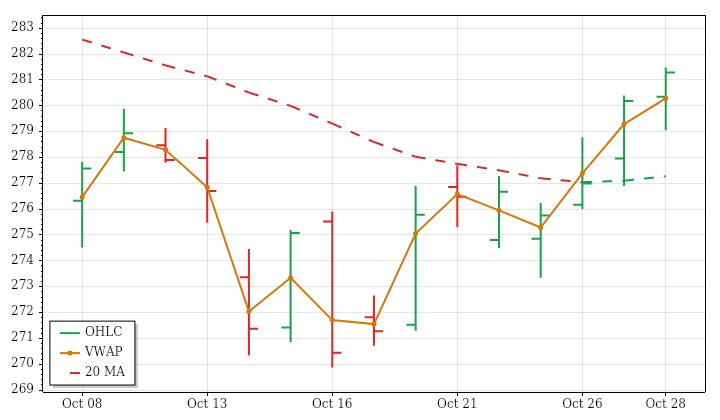
IWM · D:2026-10-28 NC% ▲ +0.40% OC% ▲ +0.34%
IWM – Small Cap Technicals Summary
IWM's completed daily session on October 28 closed at 281.29, up 0.40% from the prior close and 0.34% from the open. The small opening gap up filled, but subsequent trading ended near the session high, above VWAP and above the previous day's high. A higher high and higher low supported the positive daily result, even though the session remained range-bound.
Price was above falling near- and intermediate-term benchmarks, leaving both horizons mixed, while the far-term structure remained downward. The prior 15 sessions showed almost no net directional progress, so the latest gain did not establish broad trend alignment. Range was below average despite expanding lookback ranges, and subdued volume matched decreasing turnover. PSAR and ATR-median were in upward states, contrasting with the moving averages. A next-session low below 273.4051 would conditionally trigger a bearish PSAR reversal.
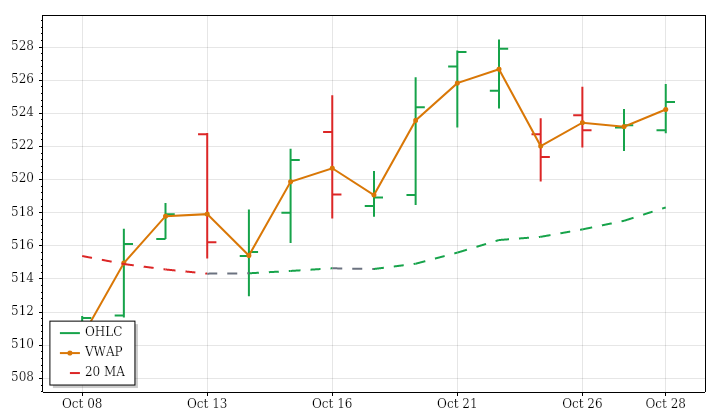
DIA · D:2026-10-28 NC% ▲ +0.27% OC% ▲ +0.33%
DIA – Dow Jones Technicals Summary
DIA's completed daily session on October 28 closed at 524.68, up 0.27% from the prior close and 0.33% from the open. After filling a small opening gap down, it traded on both sides of the open and finished above VWAP and the previous day's high. A higher high and higher low reinforced the positive session, although the overall trading range remained below average.
The advance aligned with the upward price trend over the prior 15 sessions and rising near- and far-term averages. Intermediate-term positioning was less settled: price was above its benchmark, but that average still declined slightly. Volume was only about two-thirds of average, consistent with decreasing lookback turnover, while ranges continued contracting. The moving-average picture was therefore more constructive than participation. PSAR remained bearish; a next-session high above 527.2277 would conditionally trigger a bullish reversal.
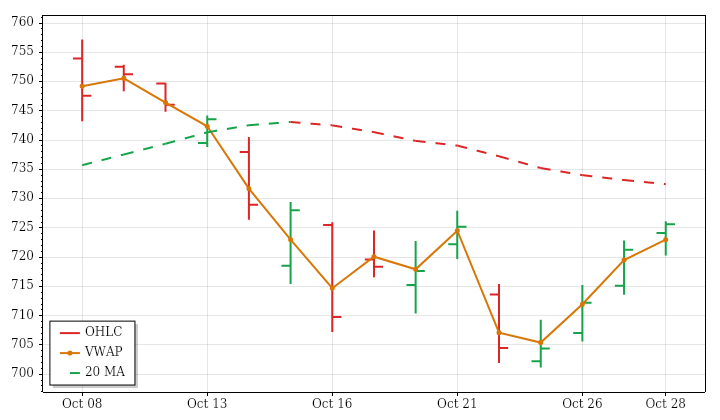
QQQ · D:2026-10-28 NC% ▲ +0.60% OC% ▲ +0.21%
QQQ – Nasdaq 100 Technicals Summary
QQQ's completed daily session on October 28 closed at 725.61, gaining 0.60% versus the prior close and 0.21% from the open. The opening gap up filled, but price recovered to finish above the previous day's high, near the session high and above VWAP. A higher high and higher low reinforced the daily improvement without producing an above-average trading range.
The recovery opposed the declining price trend over the prior 15 sessions. Near-term price was above a falling benchmark, while intermediate-term price stayed below a slightly rising average; the far-term structure remained upward. These differences left the shorter horizons mixed. Both range and volume were below average, contrasting with expanding ranges and increasing turnover in the lookback. PSAR was upward while ATR-median remained downward. A next-session low below 702.409 would conditionally trigger a bearish PSAR reversal.
SPY · D:2026-10-28 NC% ▲ +0.34% OC% ▲ +0.11%
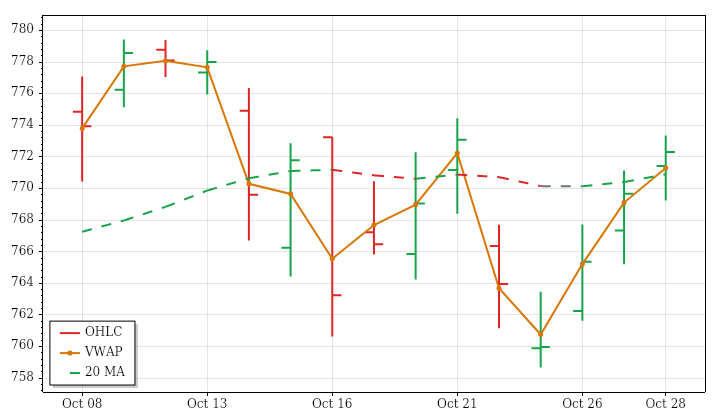
SPY – S&P 500 Technicals Summary
SPY's completed daily session on October 28 closed at 772.31, up 0.34% from the prior close and 0.11% from the open. Its opening gap up filled, but the session still produced a higher high and higher low and finished above the previous day's high. The close near the session high and above VWAP was constructive, although the smaller open-to-close gain shows that much of the daily return originated at the opening.
Intermediate- and far-term averages remained rising beneath price. Near-term price also stood above its benchmark, but that average still declined, leaving a conflict with the stronger longer horizons. The prior 15 sessions retained a downward price trend. Below-average range and volume contrasted with expanding ranges and increasing lookback turnover. PSAR was long while ATR-median remained downward; a next-session low below 758.68 would conditionally trigger a bearish PSAR reversal.
IJH · D:2026-10-28 NC% ▲ +0.18% OC% ▼ -0.14%
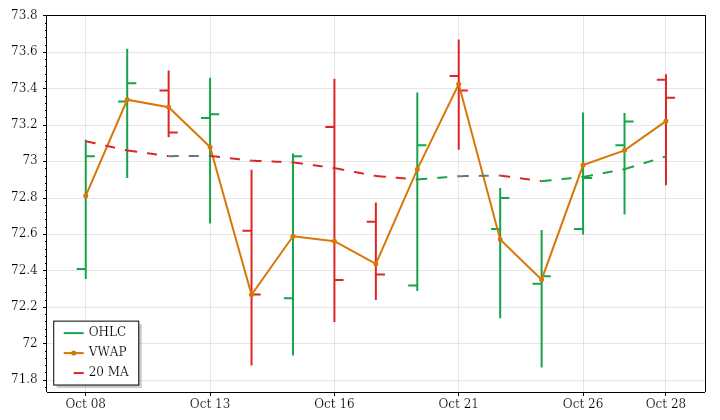
IJH – Mid Cap Technicals Summary
IJH's completed daily session on October 28 closed at 73.35, up 0.18% versus the prior close despite losing 0.14% from the open. The opening gap up filled, so the positive daily return should not be confused with an intraday advance. Nevertheless, price made a higher high and higher low, breached the prior inside bar's high, and finished above the previous day's high and VWAP.
The trend picture remained conflicted. Price stood above a falling near-term benchmark, below a falling intermediate-term average, and below a rising far-term average. The prior 15 sessions showed little net directional progress and a slight downward price trend. Below-average range and modestly below-average volume matched contracting ranges and declining turnover. ATR-median recorded a bullish crossover and PSAR was in a long state; a next-session low below 71.87 would conditionally reverse PSAR downward.
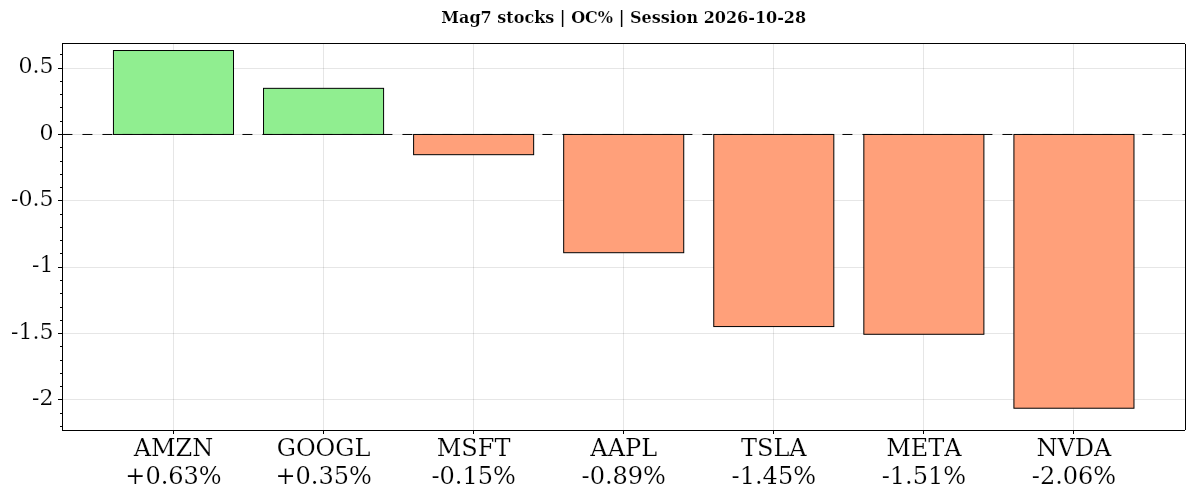
| Instrument | Bias | Date | DNC% | DOC% | O | H | L | C | VWAP | Vol |
|---|---|---|---|---|---|---|---|---|---|---|
| ▲ AMZN | ▲ ▲ ▲ | 2026-10-28 | ▲ +0.59% | ▲ +0.63% | 253.00 | 255.36 | 251.98 | 254.60 | ▲ 253.69 | 33,492,996 |
| ▲ GOOGL | ▲ ▲ ▲ | 2026-10-28 | ▲ +1.34% | ▲ +0.35% | 323.76 | 326.40 | 322.65 | 324.89 | ▲ 324.50 | 49,928,713 |
| ▼ MSFT | ▼ ▼ ▲ | 2026-10-28 | ▼ -0.06% | ▼ -0.15% | 531.82 | 535.00 | 526.13 | 531.01 | ▲ 529.55 | 24,192,445 |
| ▼ AAPL | ▼ ▼ ▼ | 2026-10-28 | ▼ -0.94% | ▼ -0.89% | 346.92 | 347.18 | 343.52 | 343.83 | ▼ 344.61 | 34,348,858 |
| ▼ TSLA | ▼ ▼ ▲ | 2026-10-28 | ▼ -0.80% | ▼ -1.45% | 410.15 | 410.85 | 397.18 | 404.22 | ▲ 402.22 | 35,206,848 |
| ▼ META | ▼ ▼ ▼ | 2026-10-28 | ▼ -1.24% | ▼ -1.51% | 621.85 | 624.42 | 609.00 | 612.49 | ▼ 613.98 | 34,463,595 |
| ▼ NVDA | ▼ ▼ ▼ | 2026-10-28 | ▼ -1.17% | ▼ -2.06% | 219.91 | 219.99 | 214.47 | 215.38 | ▼ 216.61 | 90,447,100 |
| AVG/Sum | — | — | -0.33% | -0.73% | — | — | — | — | — | 302,080,555 |
Mag7 Stocks
Negative confluence: average DOC% -0.73% from the open; DNC% -0.33% versus the prior close. Only Amazon and Alphabet gained on both comparisons: Amazon led from the open, while Alphabet led versus the prior close despite falling moving averages across horizons. Nvidia lagged from the open and Meta versus the prior close; Microsoft and Tesla fell but closed above VWAP.
AMZN · D:2026-10-28 NC% ▲ +0.59% OC% ▲ +0.63%
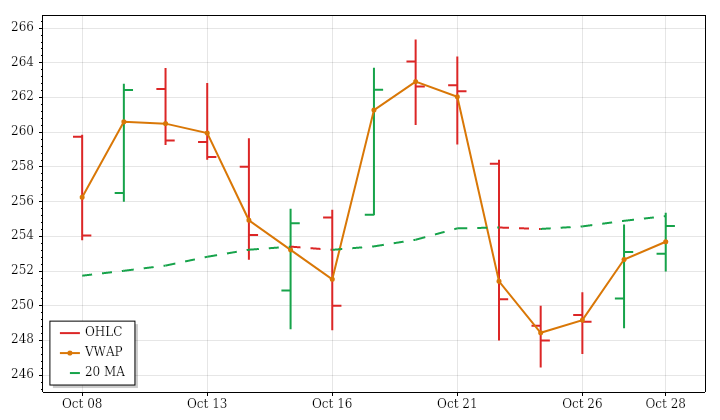
AMZN – Amazon Technicals Summary
AMZN's completed daily session on October 28 ended at 254.60, gaining 0.59% against the prior close and 0.63% from the open. The small opening gap down filled, and the session produced a higher high and higher low. Price closed near the high and above VWAP, although it remained within the previous day's range. That combination shows positive session performance without a decisive expansion beyond the preceding close's trading boundaries.
The advance ran against the declining price trend over the prior 15 sessions. Near-term price stood above a falling benchmark, while intermediate-term price remained just below a rising one, leaving both horizons mixed. The far-term structure stayed upward. Below-average range continued the lookback contraction, but below-average volume contrasted with gradually increasing lookback turnover. PSAR remained bearish; a next-session high above 259.5326 would conditionally reverse that state.
Amazon News and Fundamentals
Amazon unveiled five Alexa-powered devices on October 28, including the Alexa Photo Frame, Echo Time smart alarm clock and redesigned Echo Show 16. Third-quarter earnings are due October 29 after market close, with AWS growth, its reported $496 billion backlog and AI spending in focus. Earnings previews flag rising capital expenditures as a potential pressure on margins and free cash flow. Amazon’s warehouses also increasingly use Hercules robots to carry inventory pods to employee workstations.
GOOGL · D:2026-10-28 NC% ▲ +1.34% OC% ▲ +0.35%
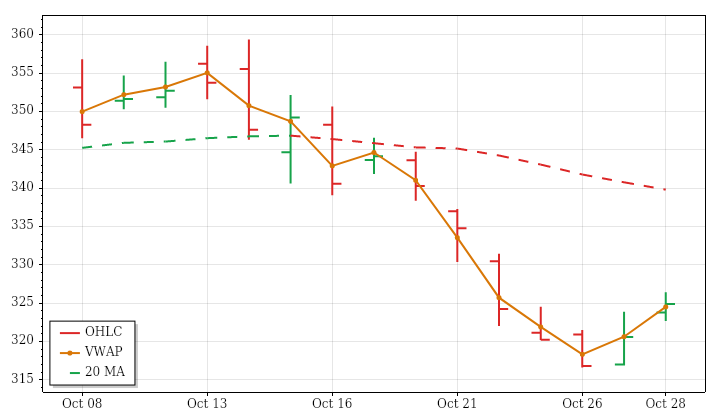
GOOGL – Alphabet Technicals Summary
GOOGL's completed daily session on October 28 closed at 324.89, gaining 1.34% from the prior close but only 0.35% from the open. Much of the gain therefore came through an opening gap up that remained unfilled. A higher high and higher low accompanied a finish above the previous day's high, near the session high and slightly above VWAP.
Despite that improvement, near-, intermediate- and far-term averages remained falling, with price below all three benchmarks. The session was consequently a rebound within an aligned downward structure, consistent with the declining price trend over the prior 15 sessions. Range was less than half of average while volume exceeded twice average, combining limited price travel with unusually heavy turnover. Lookback ranges were contracting as volume increased. PSAR remained bearish; a next-session high above 328.6827 would conditionally trigger a bullish reversal.
MSFT · D:2026-10-28 NC% ▼ -0.06% OC% ▼ -0.15%
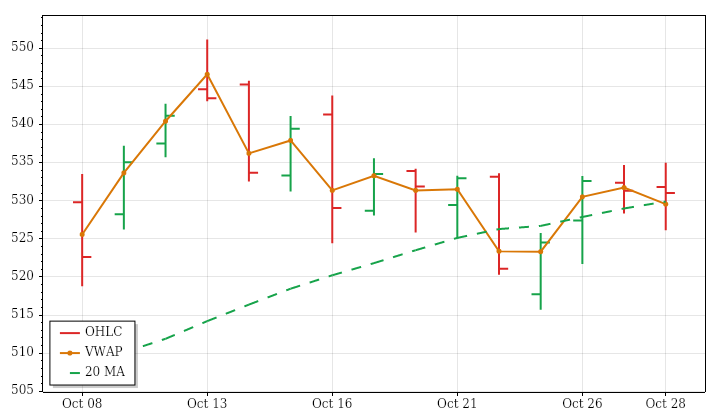
MSFT – Microsoft Technicals Summary
MSFT's completed daily session on October 28 closed at 531.01, down 0.06% against the prior close and 0.15% from the open. The small opening gap up filled, and an outside bar showed trading beyond both ends of the previous day's range. Yet the close returned inside that range and remained close to the open, while finishing above VWAP. The result was limited net movement despite two-sided trading.
Near-, intermediate- and far-term averages remained rising with price above their benchmarks, contrasting with the slight downward price trend and very limited directional progress over the prior 15 sessions. Range was below average, consistent with contraction, while above-average volume ran against decreasing lookback turnover. Shorter-term indicators were split between upward PSAR and downward ATR-median states. A next-session low below 516.665 would conditionally trigger a bearish PSAR reversal.
Microsoft News and Fundamentals
Microsoft reported fiscal first-quarter revenue of $92.3 billion, up 19% year over year, and earnings of $4.89 per share versus a $4.71 consensus estimate and $4.13 a year earlier. Azure revenue grew 48% to approximately $33.2 billion. Free cash flow remained positive despite $45.2 billion spent on data centers. Microsoft lowered its 2026 capital-expenditure forecast to $170 billion from $175 billion; CFO Amy Hood attributed the reduction to delays in third-party capacity.
AAPL · D:2026-10-28 NC% ▼ -0.94% OC% ▼ -0.89%
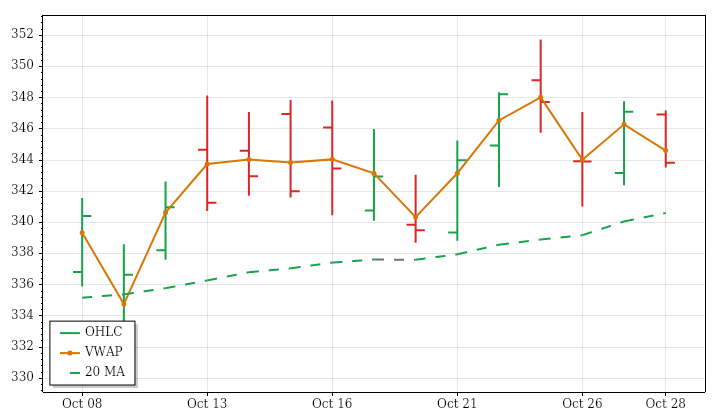
AAPL – Apple Technicals Summary
AAPL's completed daily session on October 28 closed at 343.83, down 0.94% from the prior close and 0.89% from the open. The small opening gap down filled, but trading on both sides of the open ended near the session low and below VWAP. An inside bar and a close within the previous day's range describe a contained retreat rather than a broad range expansion.
The decline conflicted with the rising intermediate- and far-term averages and the upward price trend over the prior 15 sessions. Near-term positioning was less constructive: price finished below a still-rising benchmark, leaving that horizon mixed. Both range and volume were below average; the narrower range matched the lookback contraction, while subdued turnover contrasted with increasing lookback volume. PSAR remained bearish; a next-session high above 350.6868 would conditionally trigger a bullish reversal.
Apple News and Fundamentals
Apple unveiled its first touchscreen MacBook Pro on October 28 in Los Angeles, starting at $2,899 for the 14-inch model; touchscreen use is optional. The launch follows September’s folding iPhone Duo and an October smart-home hub. Apple faces falling global PC shipments and rising memory costs, while AI hyperscalers are bidding up flash-storage prices and absorbing supply. Earnings are due next week.
TSLA · D:2026-10-28 NC% ▼ -0.80% OC% ▼ -1.45%
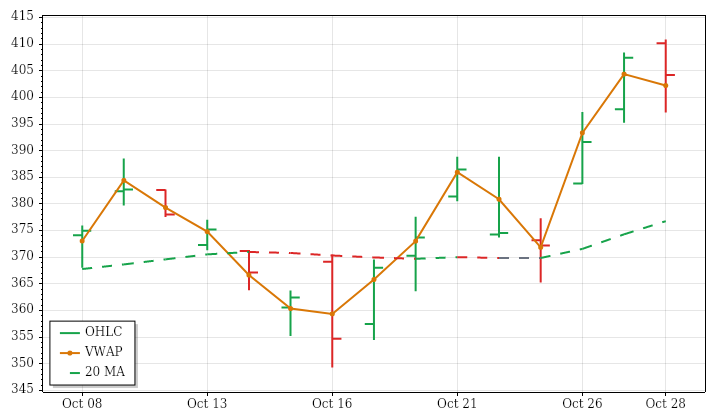
TSLA – Tesla Technicals Summary
TSLA's completed daily session on October 28 closed at 404.22, down 0.80% from the prior close and 1.45% from the open. The opening gap above the previous day's range filled, and price returned to finish inside that range. Despite the negative return, the session maintained a higher high and higher low and closed above VWAP, making the intraday picture less uniformly weak than the open-to-close loss alone suggests.
Near- and intermediate-term averages remained rising beneath price, aligned with the upward price trend over the prior 15 sessions. The far-term benchmark remained falling despite price standing above it. Range exceeded average and continued a run of large-range sessions, consistent with lookback expansion. Volume, however, was below average against an increasing lookback trend. PSAR and ATR-median remained upward; a next-session low below 375.4962 would conditionally trigger a bearish PSAR reversal.
Tesla News and Fundamentals
Tesla’s third-quarter earnings call highlighted rising Full Self-Driving adoption, Robotaxi expansion, Optimus commercialization and a $20 billion capital-spending plan for 2026. Quarterly capital expenditures were $4.73 billion, below analysts’ roughly $7.77 billion expectation, helping free cash flow turn positive. Operating income nevertheless fell 56% to $718 million. AI, robotaxis and Optimus remain major investment priorities. A Seoul court also dismissed a lawsuit by Tesla owners seeking refunds for Full Self-Driving technology.
META · D:2026-10-28 NC% ▼ -1.24% OC% ▼ -1.51%
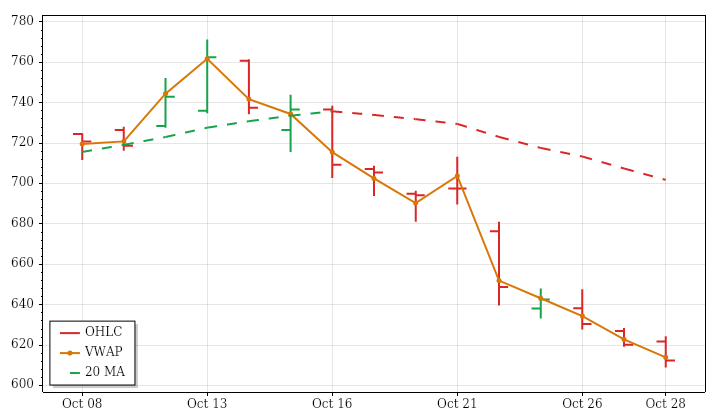
META – Meta Platforms Technicals Summary
META's completed daily session on October 28 ended at 612.49, down 1.24% from the prior close and 1.51% from the open. An initial gap up filled before the session finished below the previous day's low, near its own low and beneath VWAP. A lower high and lower low made the decline consistent with the existing near-term weakness rather than an isolated negative close.
The falling near-term average and downward price trend over the prior 15 sessions aligned with the day's retreat. Intermediate- and far-term averages still rose, but price remained below both, leaving those horizons conflicted rather than upwardly aligned. Volume reached about one and a half times average despite a below-average range, matching increasing lookback turnover and contracting ranges. PSAR remained bearish; a next-session high above 665.4943 would conditionally trigger a bullish reversal.
Meta News and Fundamentals
Meta priced 40 million Class A shares at $625 each in an expanded $25 billion offering, alongside approximately $12.5 billion of mandatory convertible preferred stock. Quarterly capital expenditures of $34.9 billion resulted in negative free cash flow of $2.1 billion. Advertising impressions rose 10% and average ad prices increased 14% year over year. Meta also launched Waddle World, an AI-powered virtual-pet app, and indefinitely delayed new commercial terms following publishers’ concerns.
NVDA · D:2026-10-28 NC% ▼ -1.17% OC% ▼ -2.06%
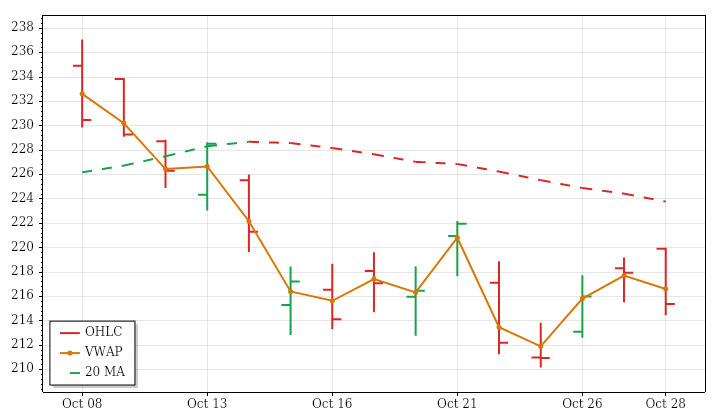
NVDA – Nvidia Technicals Summary
NVDA's completed daily session on October 28 closed at 215.38, losing 1.17% from the prior close and 2.06% from the open. An opening gap above the previous day's range failed to hold and filled. The resulting outside bar finished below the previous day's low, near the session low and beneath VWAP, showing a substantial reversal of the positive opening position.
That weakness aligned with the declining price trend over the prior 15 sessions and the falling intermediate-term average. Near-term price remained barely above a sharply falling benchmark, while the far-term average still rose beneath price, leaving the horizons divided. Range exceeded average despite lookback contraction; volume was below average, consistent with declining turnover. ATR-median remained downward even though PSAR was in a long state. A next-session low below 210.18 would conditionally trigger a bearish PSAR reversal.
Nvidia News and Fundamentals
The U.S. Justice Department is investigating Nvidia’s $12.9 billion acquisition of Hugging Face and requested information about its potential impact on competitors. Hugging Face operates an open-source platform for hosting and testing AI models. On October 28, Nvidia released Nemotron 3.5 Transcribe, a free, open-weight transcription model supporting up to 40 languages, and version 2 of its Granary speech dataset. Nvidia scheduled its third-quarter financial-results conference call for November 17 at 2 p.m.
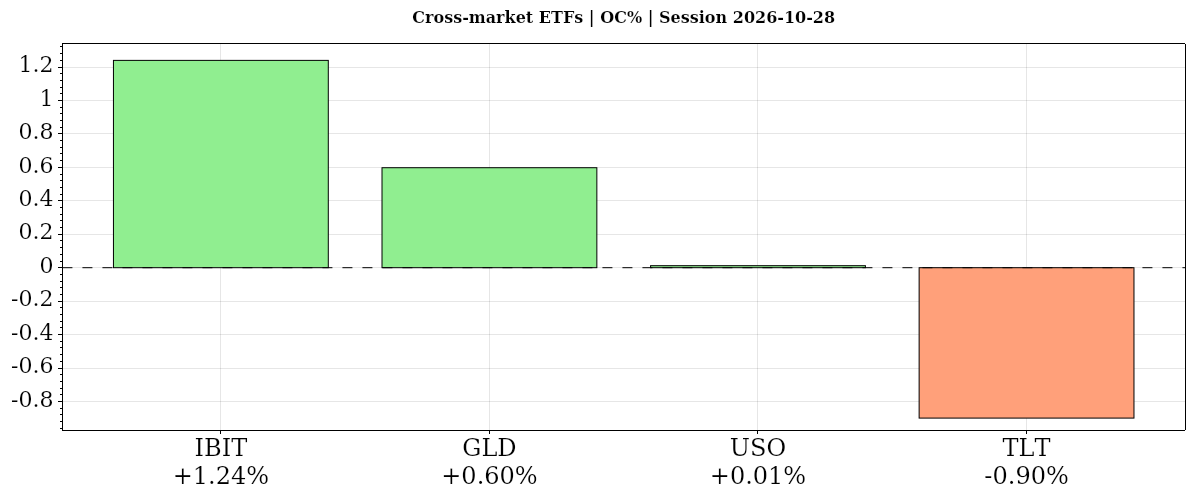
| Instrument | Bias | Date | DNC% | DOC% | O | H | L | C | VWAP | Vol |
|---|---|---|---|---|---|---|---|---|---|---|
| ▲ IBIT | ▲ ▲ ▲ | 2026-10-28 | ▲ +0.96% | ▲ +1.24% | 45.58 | 46.14 | 45.43 | 46.14 | ▲ 45.75 | 19,841,541 |
| ▲ GLD | ▲ ▲ ▲ | 2026-10-28 | ▲ +0.33% | ▲ +0.60% | 371.29 | 373.60 | 368.88 | 373.51 | ▲ 371.24 | 8,876,305 |
| ▲ USO | ▲ ▲ ▼ | 2026-10-28 | ▲ +1.64% | ▲ +0.01% | 166.55 | 169.40 | 166.34 | 166.57 | ▼ 167.96 | 5,341,147 |
| ▼ TLT | ▼ ▼ ▼ | 2026-10-28 | ▼ -0.78% | ▼ -0.90% | 81.72 | 81.76 | 80.73 | 80.99 | ▼ 81.17 | 35,166,586 |
| AVG/Sum | — | — | +0.54% | +0.24% | — | — | — | — | — | 69,225,579 |
Cross-Market ETFs
Positive confluence: average DOC% +0.24% from the open; DNC% +0.54% versus the prior close. Bitcoin led from the open, gold advanced, and bonds diverged from equities with losses. Oil was nearly flat from the open despite gaining 1.64% versus the prior close, largely reflecting its opening gap.
IBIT · D:2026-10-28 NC% ▲ +0.96% OC% ▲ +1.24%
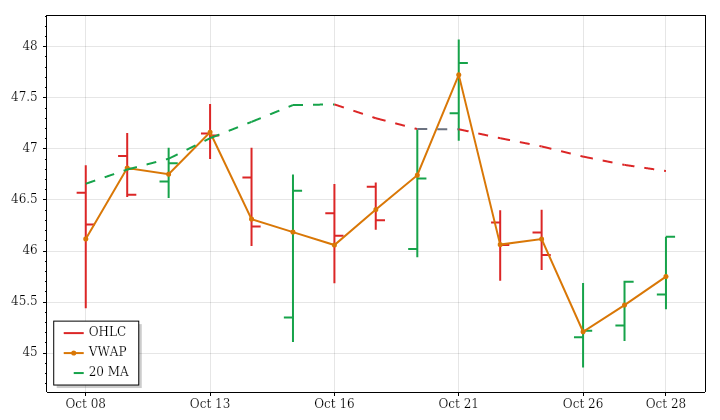
IBIT – Bitcoin Technicals Summary
IBIT's completed daily session on October 28 finished at 46.14, up 0.96% from the prior close and 1.24% from the open. An opening gap down filled, and price established a higher high and higher low before closing above the previous day's high. The finish near the session high and above VWAP gave the day's recovery a constructive shape.
The gain opposed the declining price trend over the prior 15 sessions but aligned with rising intermediate- and far-term averages. Near-term price was just above a falling benchmark, leaving that horizon mixed. Participation was restrained: volume was roughly 55% of average, consistent with the decreasing lookback trend, while the below-average range matched ongoing contraction. Thus the improved close did not come with stronger turnover. PSAR remained bearish; a next-session high above 47.757 would conditionally trigger a bullish reversal.
GLD · D:2026-10-28 NC% ▲ +0.33% OC% ▲ +0.60%
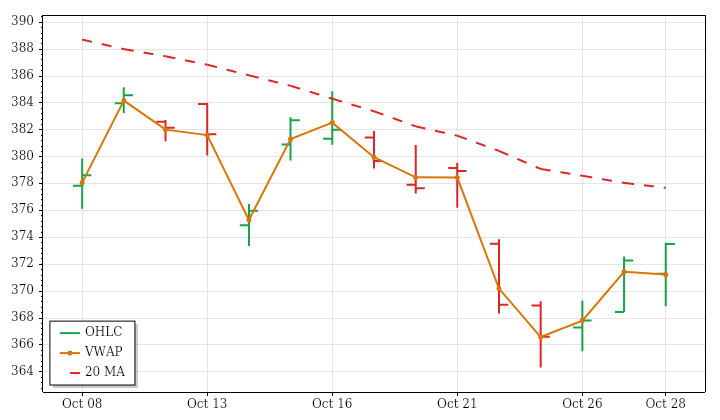
GLD – Gold Technicals Summary
GLD's completed daily session on October 28 closed at 373.51, up 0.33% against the prior close and 0.60% from the open. It recovered an opening gap down and finished above the previous day's high, near the session high and above VWAP. The advance occurred in a range about one-third larger than average, with above-average volume, extending a sequence of large-range sessions.
This stronger daily performance opposed the declining price trend over the prior 15 sessions and falling intermediate- and far-term averages. Near-term price moved above its benchmark, but that average still pointed downward, leaving the short horizon mixed rather than aligned upward. Expanding ranges and increasing volume in the lookback show that the latest active session fit the broader volatility and participation pattern. PSAR remained bearish; a next-session high above 378.5619 would conditionally trigger a bullish reversal.
Gold News and Fundamentals
Gold declined in early Asian trading after the Federal Reserve held interest rates unchanged at its October meeting. On October 28, the Fed voted 10–2 to maintain the federal funds target range at 3.75%–4%. Separately, the Bank of Canada raised its overnight policy rate by 25 basis points to 2.50%, with the bank rate reaching 2.75% and deposit rate 2.45%.
USO · D:2026-10-28 NC% ▲ +1.64% OC% ▲ +0.01%
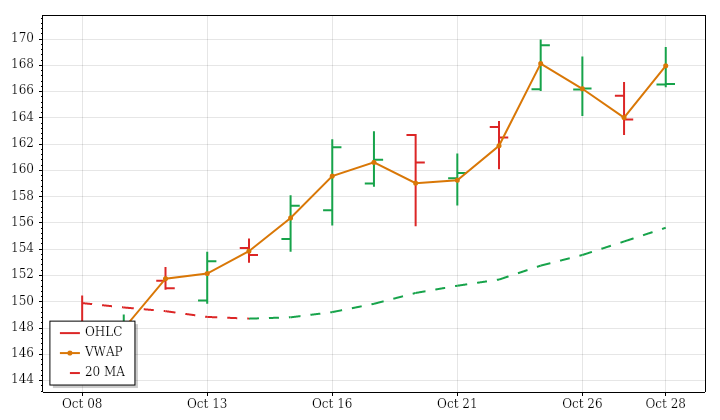
USO – Oil Technicals Summary
USO's completed daily session on October 28 closed at 166.57, up 1.64% versus the prior close but only 0.01% from the open. Almost all the gain came from an opening gap up that remained unfilled. Price traded on both sides of the open and finished near the session low, below VWAP and inside the previous day's range. The strong prior-close return therefore contrasted with little intraday progress.
Near-, intermediate- and far-term averages were all rising beneath price, aligned with the upward price trend over the prior 15 sessions. The latest session did not disturb that alignment, but its below-average range contrasted with expanding lookback ranges. Above-average volume matched increasing turnover without producing a meaningful open-to-close advance. PSAR and ATR-median remained upward; a next-session low below 162.69 would conditionally trigger a bearish PSAR reversal.
Oil News and Fundamentals
U.S. commercial crude inventories fell 1.9 million barrels last week, their fourth consecutive weekly decline, the EIA reported October 28. Gasoline inventories rose while distillate stocks declined. Oil fell in early Asian trading after settling higher overnight, with Middle Eastern supply risks in focus. U.S. Energy Secretary Chris Wright described high prices as a temporary interruption caused by the Iran war and said large military forces were being used to get ships through the Strait of Hormuz.
TLT · D:2026-10-28 NC% ▼ -0.78% OC% ▼ -0.90%
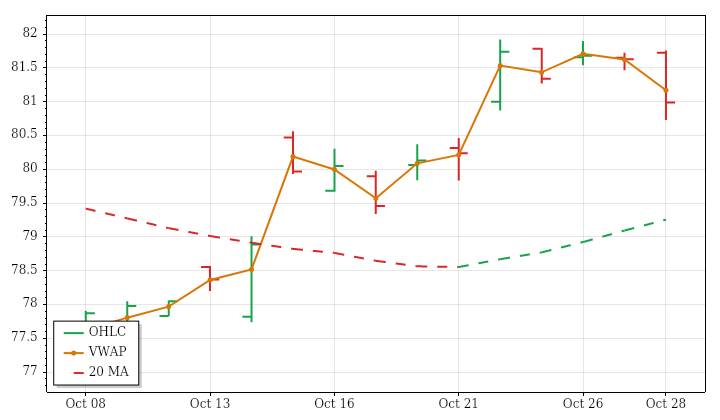
TLT – Long-Term Treasury Bonds Technicals Summary
TLT's completed daily session on October 28 ended at 80.99, down 0.78% against the prior close and 0.90% from the open. A small opening gap up filled, and an outside bar finished below the previous day's low and beneath VWAP. The range was about 64% above average, making this a marked expansion relative to the contracting ranges of the prior 15 sessions.
The decline interrupted the upward lookback price trend and left price below a rising near-term benchmark. Intermediate-term price remained above a falling average, while the far-term structure was downward, so no consistent trend alignment emerged. Volume stayed below average in keeping with decreasing lookback turnover, rather than expanding alongside the day's range. ATR-median remained upward, but PSAR was in a short state. A next-session high above 81.92 would conditionally trigger a bullish PSAR reversal.
Glossary: Instrument — ticker symbol; hover for the instrument or company name; Date — session date. DNC% — prior-session close to this session’s close; DOC% — daily session open-to-close percentage change. O — open; H — high; L — low; C — close, all for the table’s daily or weekly session; VWAP — volume-weighted average price; its arrow shows whether the close is above or below VWAP. Vol — period trading volume.
Bias — three directional readings, in order: DNC%, DOC%, then VWAP. ▲ positive/above; ▼ negative/below; — neutral or unavailable. Matching arrows show alignment; opposing arrows show mixed conditions. AVG/Sum — simple average of percentage changes and sum of reported volumes.
Futures Session Fib Grid Analysis – Snapshot
Session Fib Grids normalise market positioning as percentages, making direction and alignment comparable across different asset types.
Latest available snapshot for each instrument; Time(CT) shows the individual update date and time.
| Instrument | Bias | Time(CT) | YSFG | MSFG | WSFG | RSFG | SFG | TSI |
|---|---|---|---|---|---|---|---|---|
| ▼ ES | ▲ ▲ ▲ ▼ ▼ ▼ | 2026-10-29 07:18:47 | ▲ +58 | ▲ +1 | ▲ +44 | ▼ -35 | ▼ -1 | ▼ -90 |
| ▼ NQ | ▲ ▼ ▲ ▼ ▼ ▼ | 2026-10-29 07:18:45 | ▲ +68 | ▼ -54 | ▲ +35 | ▼ -69 | ▼ -5 | ▼ -90 |
| ▼ YM | ▲ ▲ ▼ ▼ ▼ ▼ | 2026-10-29 07:18:48 | ▲ +35 | ▲ +49 | ▼ -2 | ▼ -1 | ▼ -1 | ▼ -188 |
| ▼ EMD | ▲ ▲ ▲ ▼ ▲ ▼ | 2026-10-29 07:15:33 | ▲ +34 | ▲ +25 | ▲ +36 | ▼ -15 | ▲ +1 | ▼ -108 |
| ▲ RTY | ▲ ▲ ▲ ▲ ▲ ▼ | 2026-10-29 07:18:43 | ▲ +41 | ▲ +11 | ▲ +53 | ▲ +49 | ▲ +4 | ▼ -60 |
| ▲ FDAX | ▲ ▲ ▲ ▲ ▲ ▲ | 2026-10-29 07:18:44 | ▲ +28 | ▲ +73 | ▲ +99 | ▲ +67 | ▲ +18 | ▲ +96 |
| ▲ NKD | ▲ ▼ ▲ ▲ ― ▼ | 2026-10-29 07:15:49 | ▲ +169 | ▼ -50 | ▲ +42 | ▲ +16 | — 0 | ▼ -37 |
| Instrument | Bias | Time(CT) | YSFG | MSFG | WSFG | RSFG | SFG | TSI |
|---|---|---|---|---|---|---|---|---|
| ▼ BTC | ▼ ▼ ▲ ▼ ▼ ▼ | 2026-10-29 07:18:27 | ▼ -37 | ▼ -21 | ▲ +4 | ▼ -32 | ▼ -1 | ▼ -31 |
| ▼ GC | ▼ ▼ ▲ ▼ ▲ ▲ | 2026-10-29 07:18:48 | ▼ -137 | ▼ -36 | ▲ +9 | ▼ -47 | ▲ +21 | ▲ +37 |
| ▼ CL | ▲ ▲ ▲ ▼ ▼ ▲ | 2026-10-29 07:18:43 | ▲ +190 | ▲ +67 | ▲ +12 | ▼ -3 | ▼ -5 | ▲ +60 |
| ▲ 6E | ▼ ▼ ▼ ▲ ― ▼ | 2026-10-29 07:18:45 | ▼ -61 | ▼ -82 | ▼ -63 | ▲ +10 | — 0 | ▼ -30 |
| ▼ ZB | ▼ ▲ ▲ ▼ ▼ ▲ | 2026-10-21 09:39:59 | ▼ -39 | ▲ +77 | ▲ +6 | ▼ -3 | ▼ -2 | ▲ +29 |
Glossary: YSFG — yearly; MSFG — monthly; WSFG — weekly; RSFG — regular trading hours (RTH); SFG — the current session, including pre-market or other sessions. TSI indicates trend strength and power.
Bias shows trend alignment across these six readings. The arrows follow the column order: YSFG, MSFG, WSFG, RSFG, SFG and TSI. Matching arrows show alignment; opposing arrows show mixed conditions.
Futures Higher Time Frame Analysis
Summary of the current state of US Indices Futures based on higher time-frame (HTF) technical analysis as of: 2026-10-29 07:16 -05:00 CT.
US Indices Futures
- ES above YSFG/MSFG/WSFG F0%, rising longer-term benchmarks, daily price below 20-day, upward pivots, support 7648.50, resistance 7819.50 and 7897.50–7906.25.
- NQ above YSFG, daily WSFG recovery, MSFG below F0%, below daily 20/55-day benchmarks, weekly DTrend pivots, support 28987–28992, resistance 30178 and 31119.50–31616.50.
- YM above YSFG/MSFG, below WSFG, rising longer-term weekly benchmarks, daily upward pivots, support 51970 and 50859, resistance 53168–53211 and 54259–54294.
- EMD above weekly YSFG/MSFG/WSFG references, rising weekly but declining longer-term daily benchmarks, DTrend pivots, support 3600–3600.3, reversal 3702.9, resistance 3703.4–3737.8.
- RTY upward YSFG/MSFG/WSFG trends, rising weekly benchmarks versus pressured daily structure, daily upward pivots within intermediate DTrend, support 2848.4 and 2723.3, resistance 2860.8–2870.9, reversal 2888.9.
- FDAX above YSFG/MSFG/WSFG F0%, above all displayed daily benchmarks, daily UTrend, support 25426 and 24925, resistance 26112, weekly pivot threshold 26255, major resistance 26844–26847.
Overall State
- Short-Term: Bullish
- Intermediate-Term: Bullish
- Long-Term: Bullish
Conclusion
Weekly Fib-grid positioning and rising longer-term benchmarks maintain a predominantly bullish HTF structure. ES and FDAX retain bullish ratings across both timeframes; FDAX has regained all displayed daily benchmarks. NQ lags on intermediate structure, with MSFG below F0% and daily price beneath declining 20/55-day benchmarks. YM remains below its weekly Fib reference. EMD and RTY recoveries contrast with bearish daily long-term ratings and unresolved DTrend pivot structures. Recent ES weekly long signals and a monthly short signal reflect timeframe divergence. Recoveries remain bounded by the listed pivot resistance zones, while swing-low supports define the broader pullback structures.
Note: Intra-day counter-trend pullbacks or retracements may occur, HTF is context for informational usage and market structure. Glossary: Session Fib Grids periods of YSFG:’Yearly’, MSFG:’Monthly’, WSFG:’Weekly’
For full details visit: AlphaWebTrader Technicals
SPY Daily View
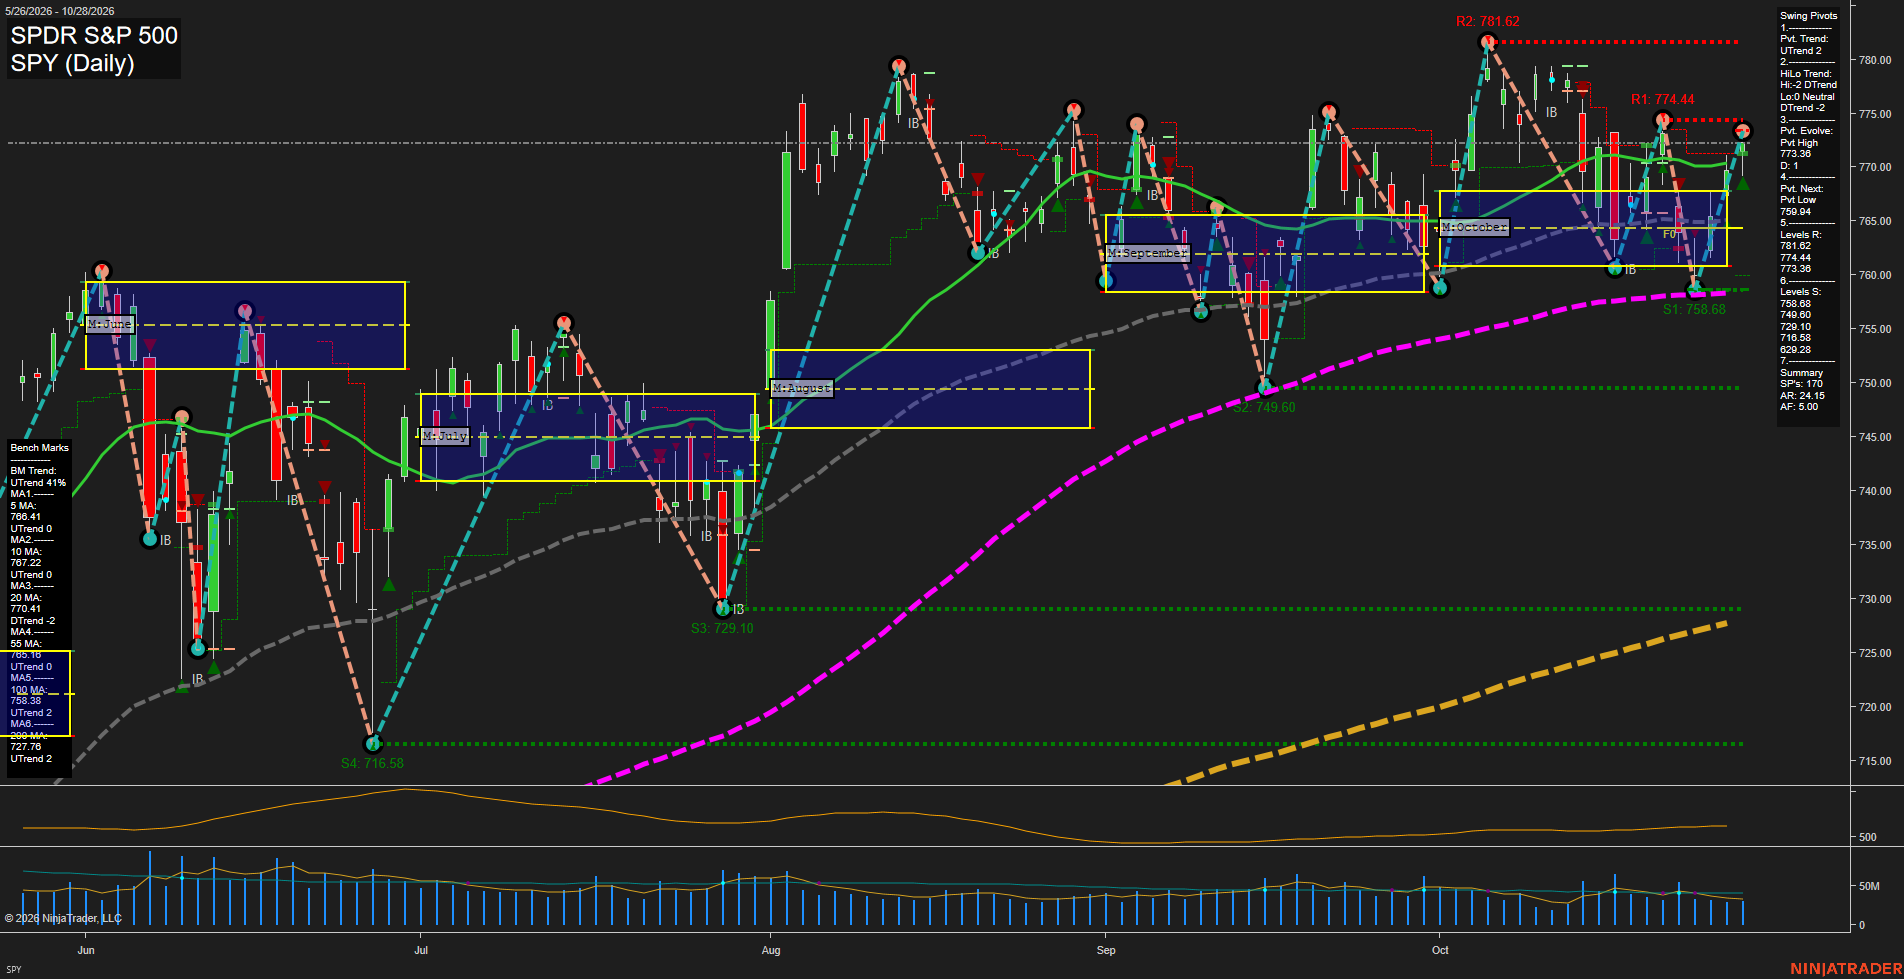
Overall Rating
- Short-Term: Bullish
- Intermediate-Term: Neutral
- Long-Term: Bullish.
Key Insights Summary
SPY futures-equivalent price action has staged a fast V-recovery from the 760 area and is trading above the October NTZ, the 5-day, 10-day, 55-day, 100-day, and 200-day benchmarks. Short-term pivot structure is positive, although price is pressing the 773.36 to 774.44 resistance band after a sharp rebound. The intermediate structure remains mixed because the HiLo pivot trend and declining 20-day average still reflect prior lower-high behavior. The broader cycle remains constructive above rising long-term averages, with 758.68 and 749.60 defining the principal pullback support structure and 781.62 marking the higher swing-resistance reference.
View charts on: AlphaWebTrader HTF Charts
ES Daily View
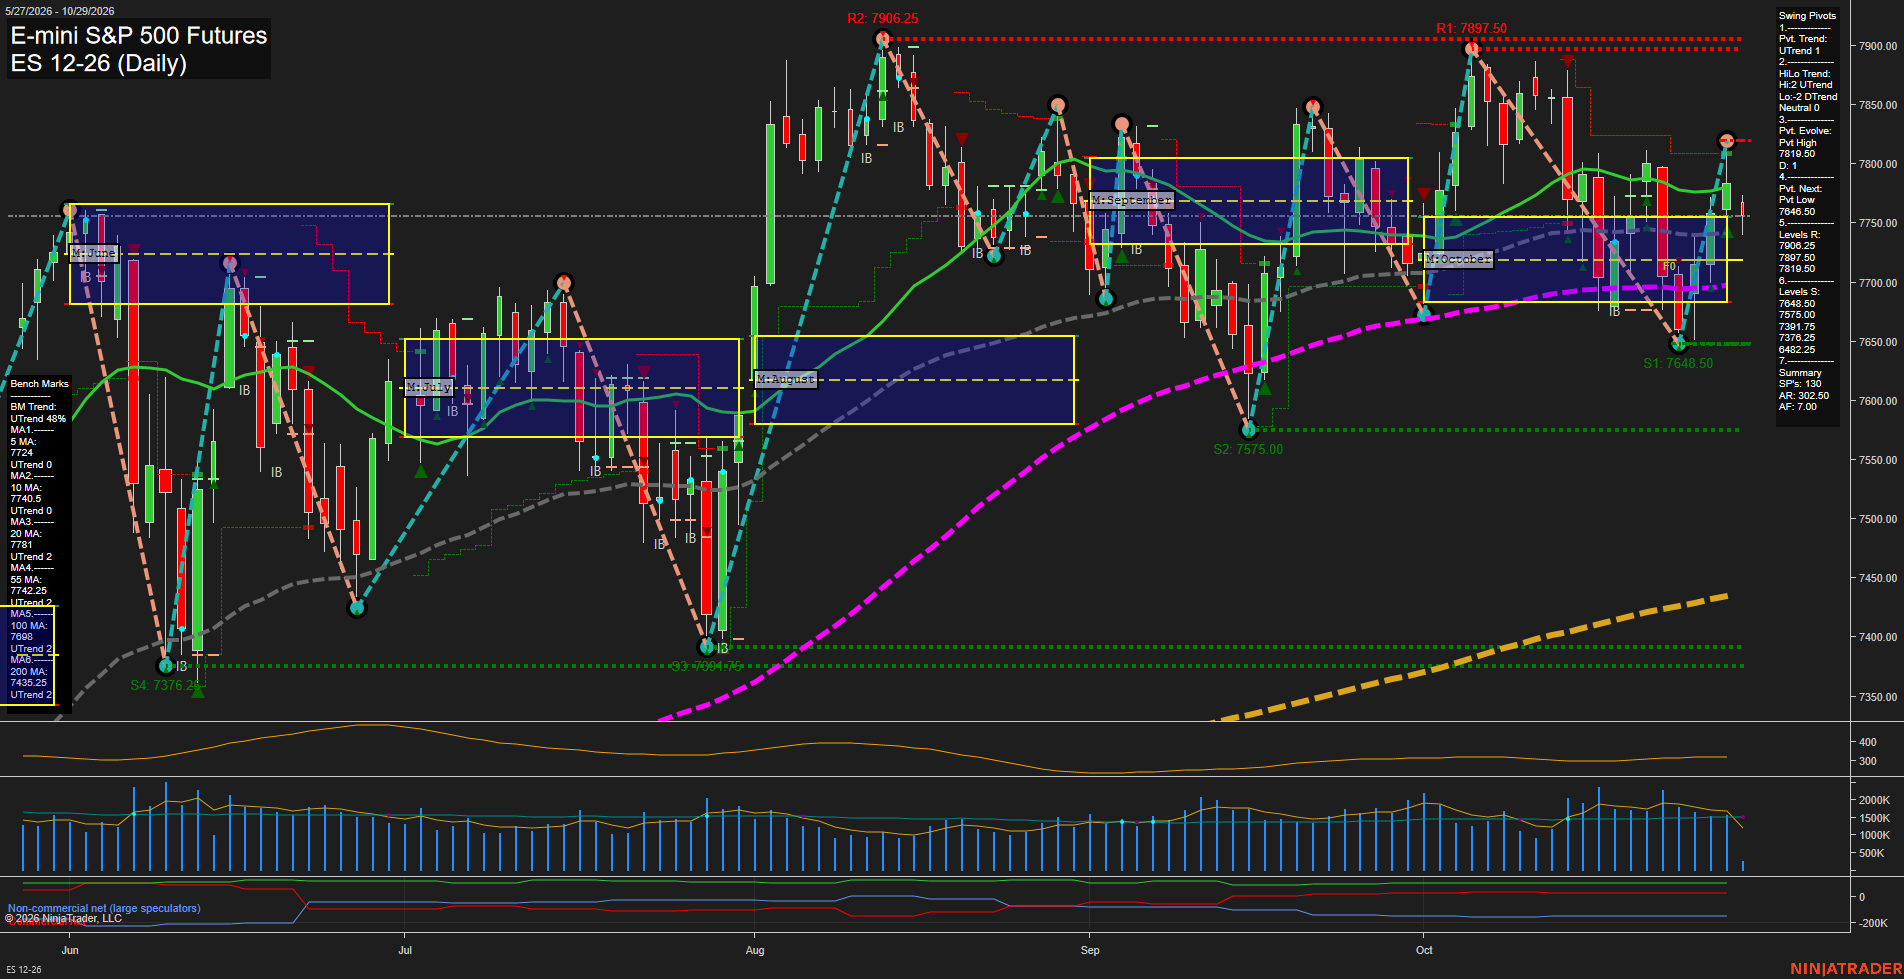
Overall Rating
- Short-Term: Bullish
- Intermediate-Term: Bullish
- Long-Term: Bullish.
Key Insights Summary
Price has rebounded from the 7648.50 pivot-low support area and is holding above the 5-day, 10-day, 55-day, 100-day, and 200-day benchmarks. The short-term pivot structure remains in an uptrend, although price is consolidating beneath the 20-day benchmark at 7781.00 and the 7819.50 pivot-high resistance. The broader intermediate and long-term structure remains constructive, supported by rising benchmark trends and positive monthly and yearly Fib-grid positioning. Recent action reflects a recovery within a choppy high-level range, with 7648.50 defining nearby support and 7819.50 followed by 7897.50-7906.25 defining the overhead resistance band.
View charts on: AlphaWebTrader HTF Charts
QQQ Daily View
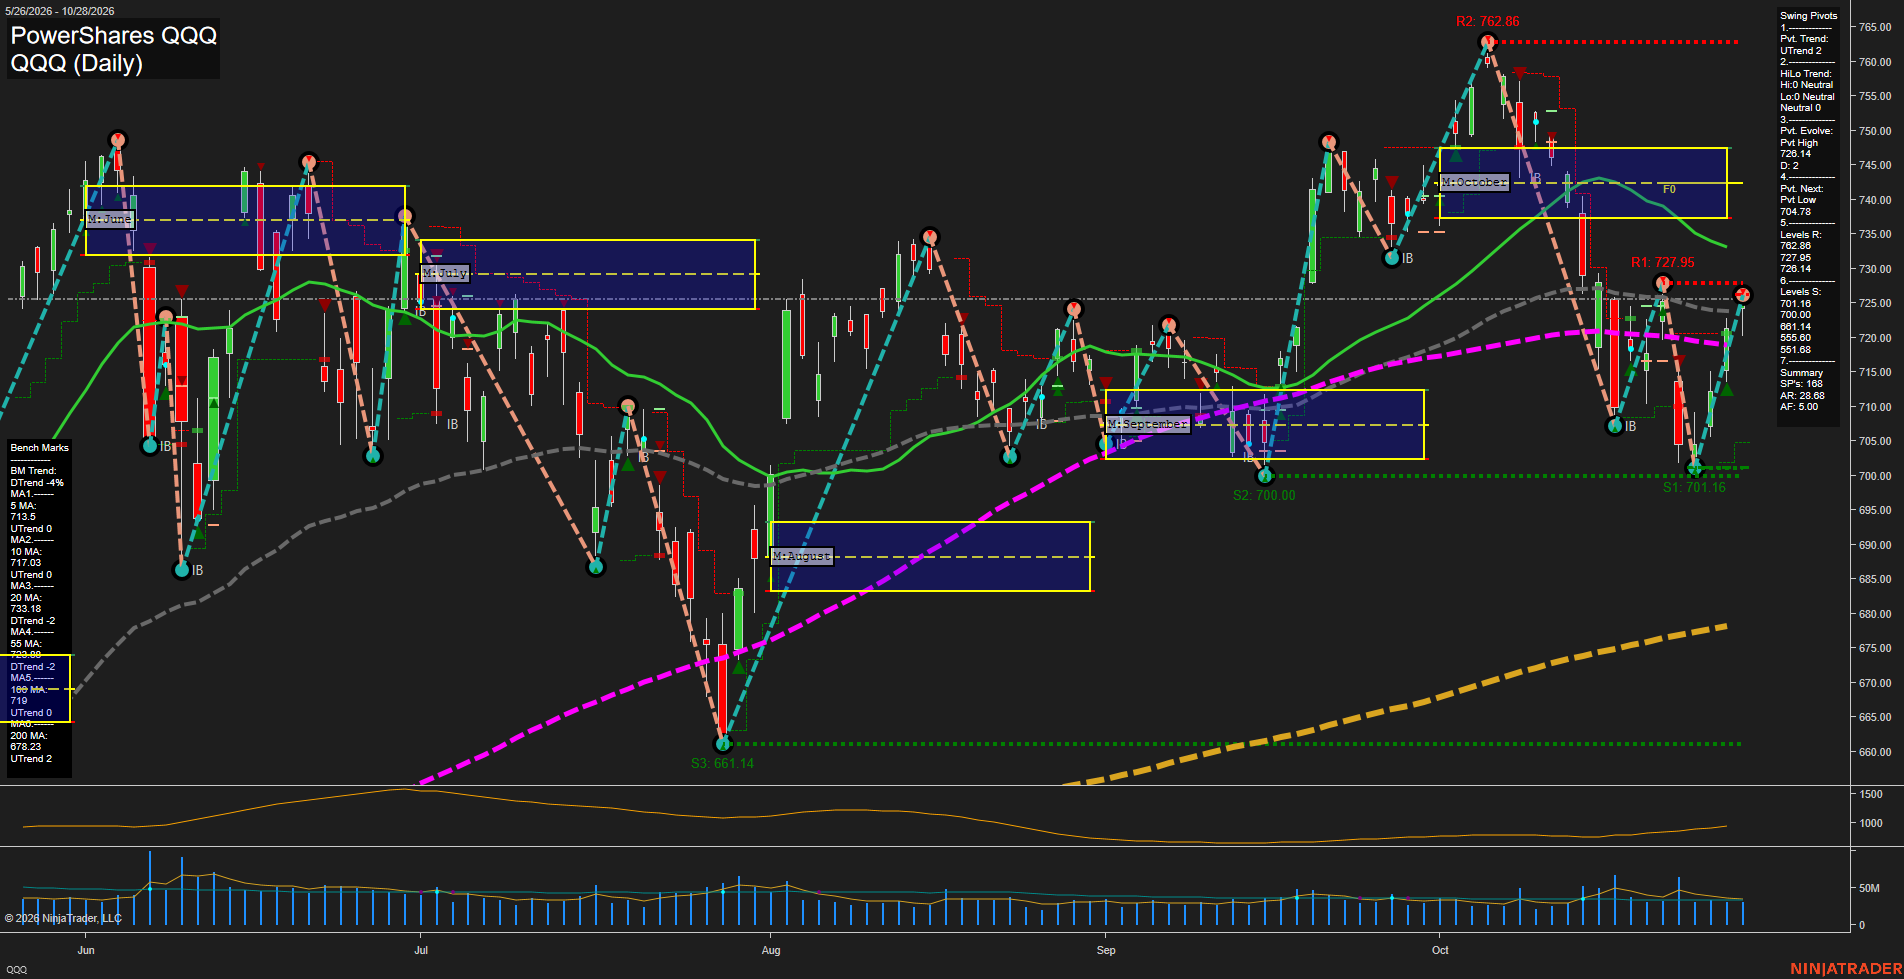
Overall Rating
- Short-Term: Bullish
- Intermediate-Term: Bearish
- Long-Term: Bullish.
Key Insights Summary
QQQ, as an NQ futures directional proxy, has produced a sharp V-style recovery from the 700-701 support cluster and regained both short-term benchmarks. The short-term pivot structure is upward and momentum is fast, although price is testing the 726.14-727.95 resistance band while remaining below the declining 20-day average at 733.18 and below the October monthly NTZ. Intermediate structure remains mixed-to-bearish after the October decline, while the rising 100-day and 200-day averages preserve the longer-term bullish backdrop. The 701.16-700.00 area remains the key completed-swing support zone, with 762.86 the major overhead pivot resistance.
View charts on: AlphaWebTrader HTF Charts
NQ Daily View
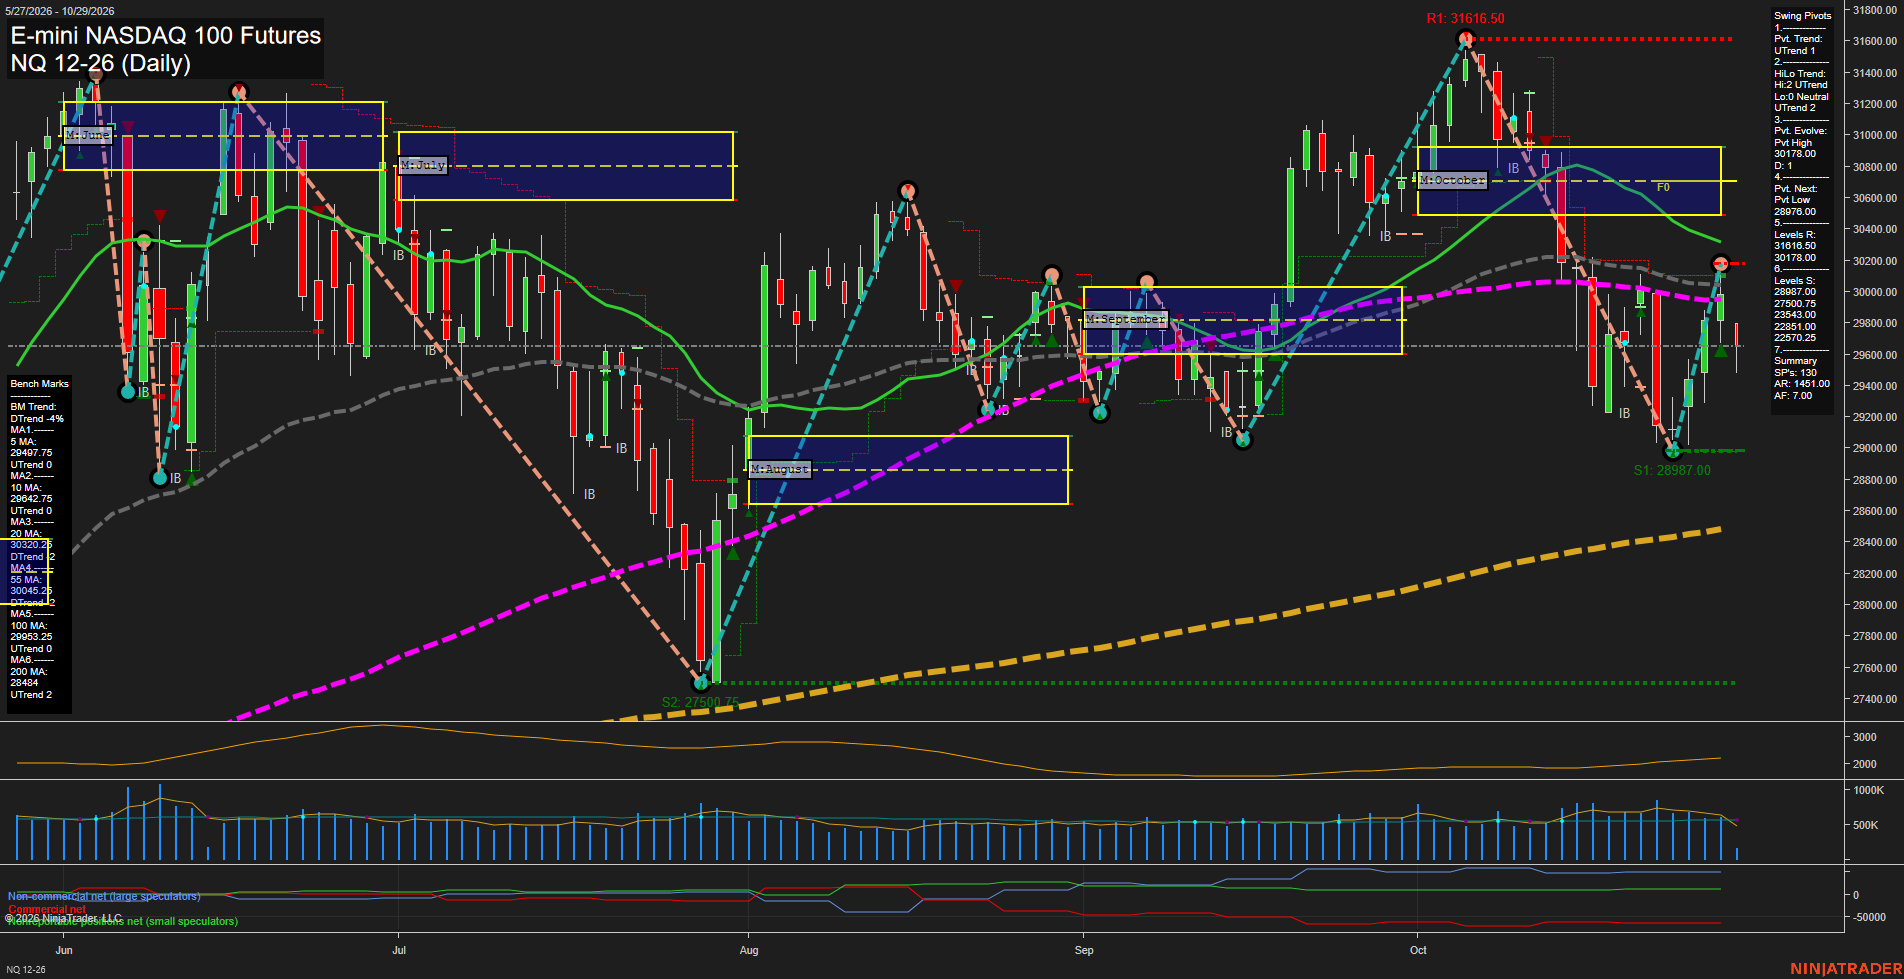
Overall Rating
- Short-Term: Bullish
- Intermediate-Term: Bearish
- Long-Term: Bullish.
Key Insights Summary
NQ is in a volatile recovery phase following the sharp October selloff into the 28987 swing-low support. The short-term pivot structure, weekly fib-grid position, and 5/10-day benchmarks remain constructive, while the latest rebound has encountered rejection beneath the 30178 pivot-high resistance and below the declining 20/55-day averages. This creates a counter-trend, choppy intermediate-term environment inside a broader long-term uptrend supported by the annual fib-grid position and rising 100/200-day benchmarks. Price remains compressed between 28987 support and 30178 resistance, with 31616.50 defining the larger overhead swing-high objective zone.
View charts on: AlphaWebTrader HTF Charts
USO Daily View
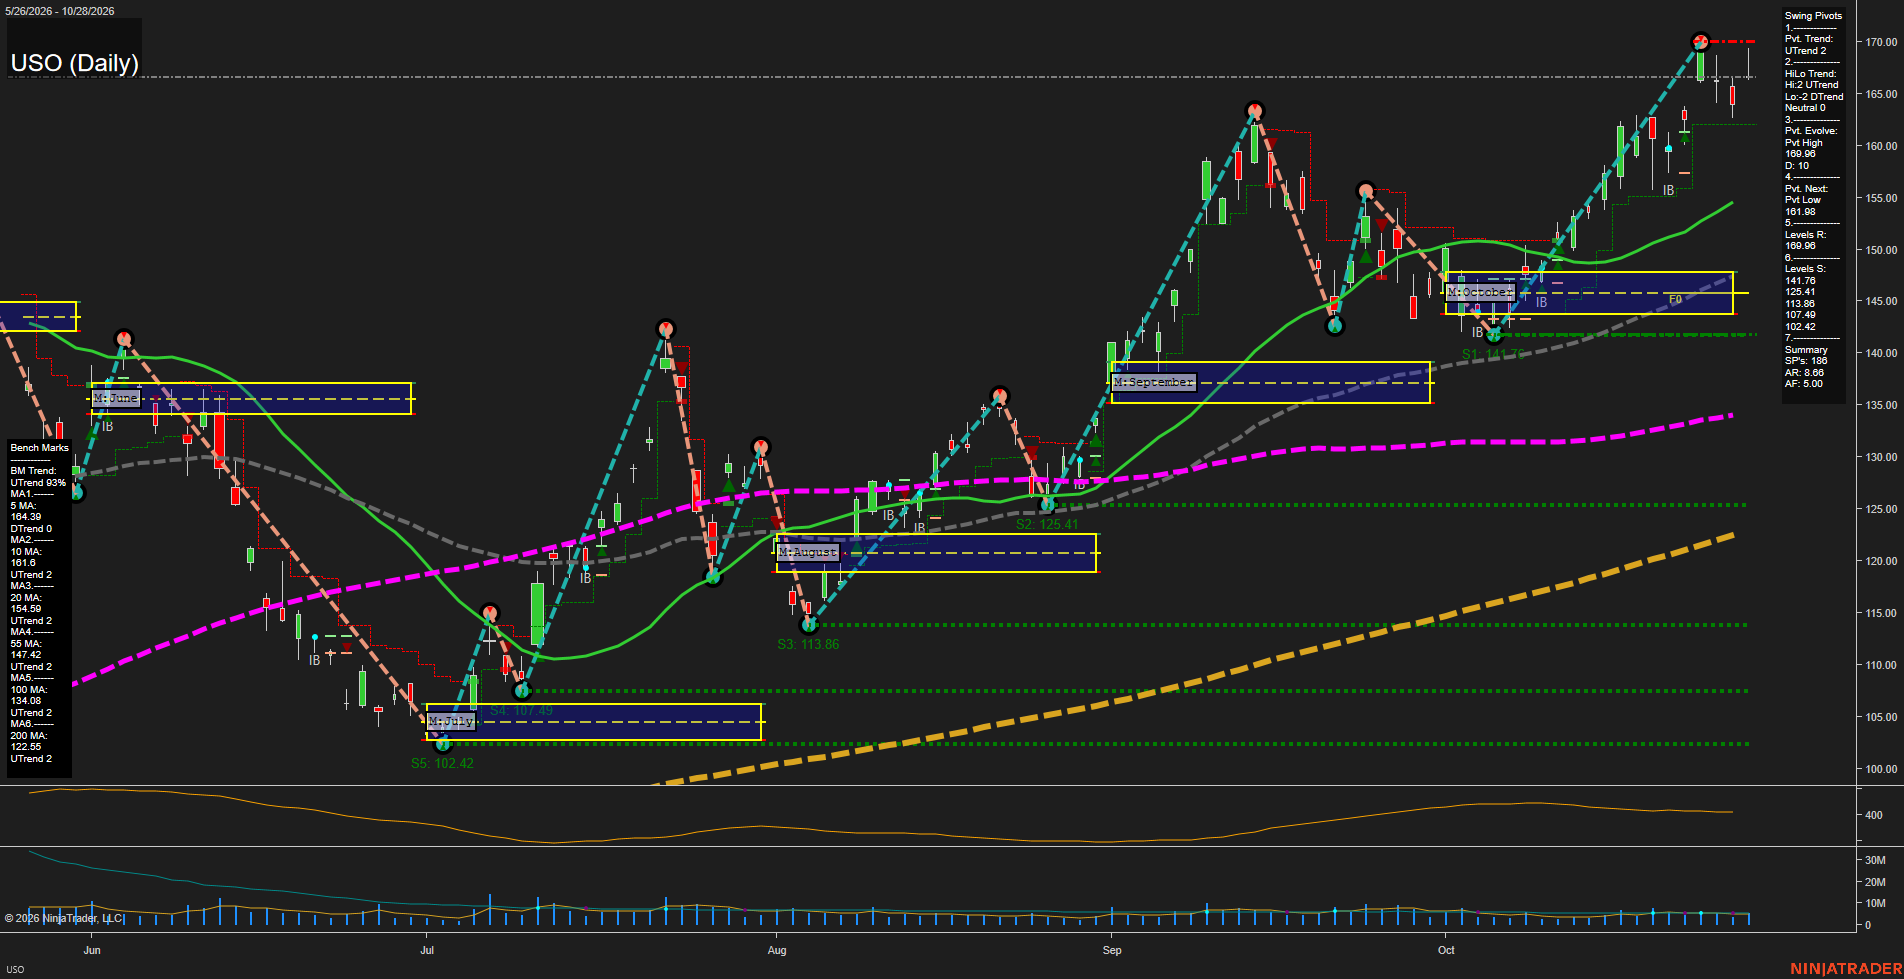
Overall Rating
- Short-Term: Bullish
- Intermediate-Term: Bullish
- Long-Term: Bullish.
Key Insights Summary
USO remains in a broad bullish daily swing structure, with price materially above the rising 20-, 55-, 100-, and 200-day benchmarks. The recent advance accelerated into the 169.86 pivot-high resistance area and then produced a medium-sized pullback, leaving the short-term pivot trend positive while the HiLo structure remains in a corrective DTrend state. The 161.98 pivot-low reversal level defines the near-term swing structure, while 169.86 is the principal upside reference. October’s monthly grid is well below current price, reflecting an extended move above the monthly value zone. ATR near 5.00 indicates an expanded daily range environment, consistent with the recent fast momentum rally and subsequent pullback.
View charts on: AlphaWebTrader HTF Charts
CL Daily View
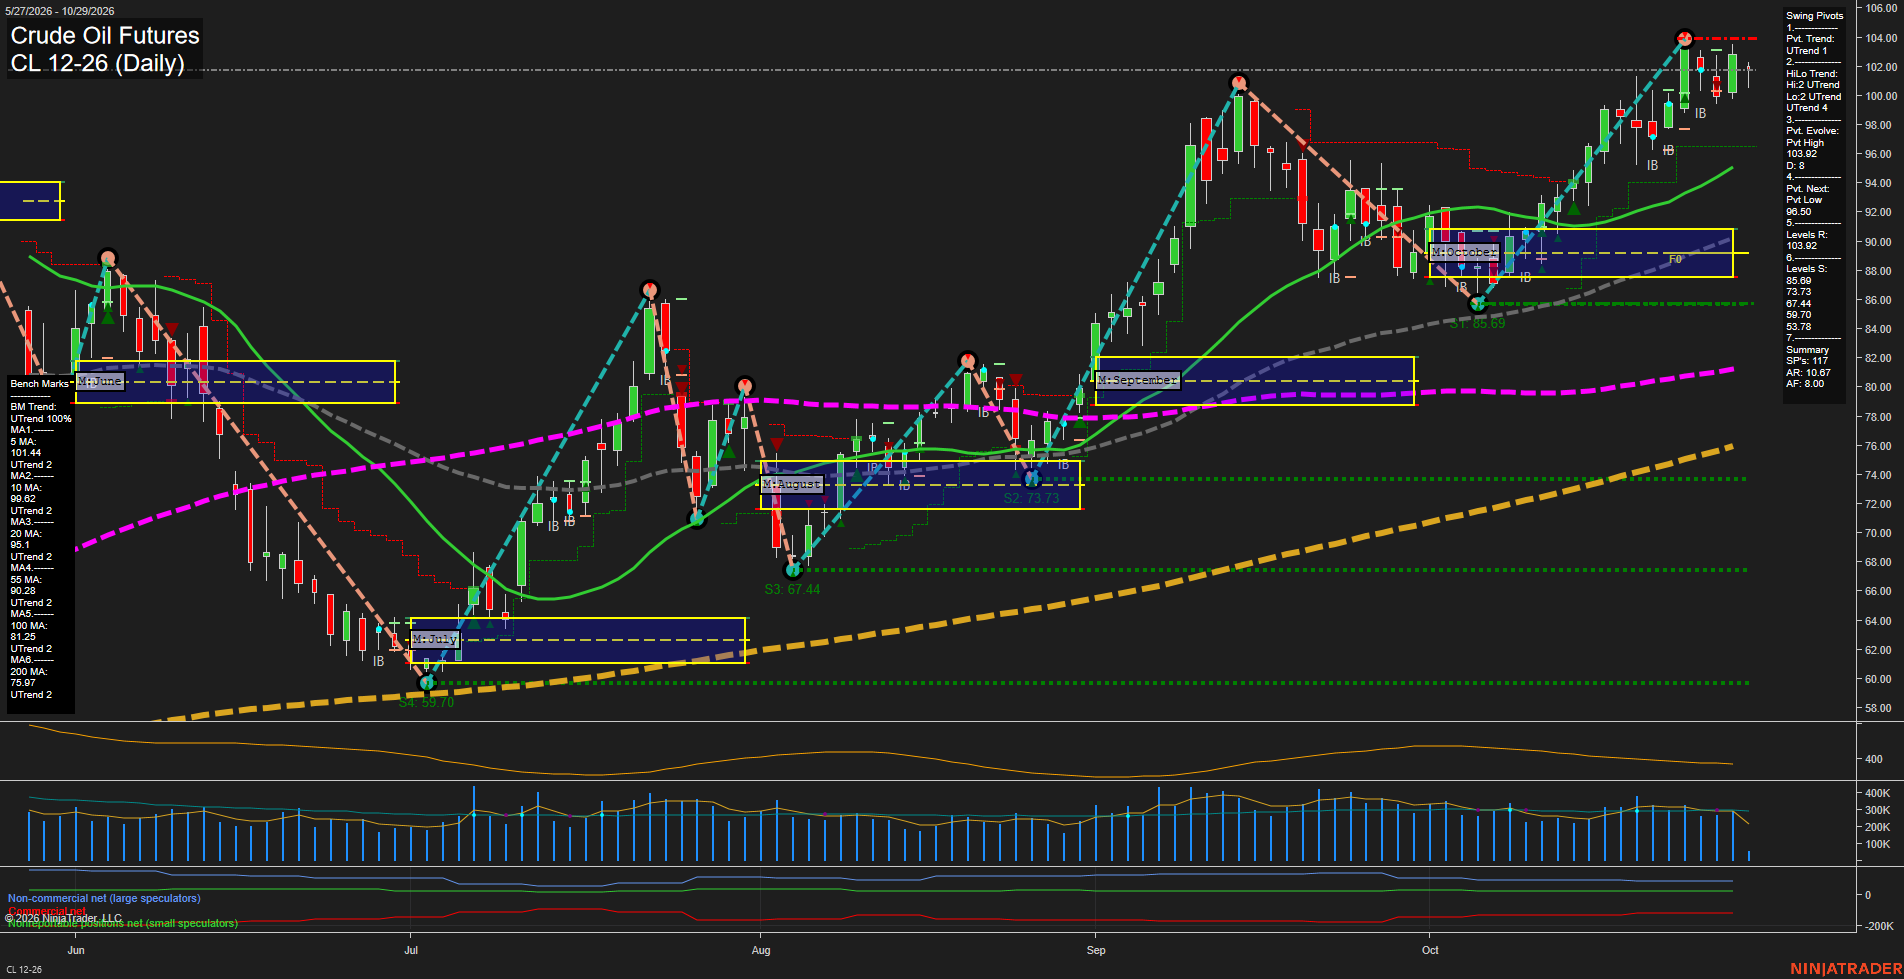
Overall Rating
- Short-Term: Bullish
- Intermediate-Term: Bullish
- Long-Term: Bullish.
Key Insights Summary
CL is sustaining a broad daily-chart advance, with price near the 103.29 pivot-high resistance area and above every benchmark average. The swing structure remains constructive: both pivot trend measures are UTrend, the monthly and yearly fib-grid positioning is above F0%, and the moving-average stack rises from 5 through 200 days. Recent action reflects consolidation beneath the new high rather than a material trend failure, while 100.00 and the 96.50 next-pivot level define the nearest lower structure beneath the market.
View charts on: AlphaWebTrader HTF Charts
GLD Daily View
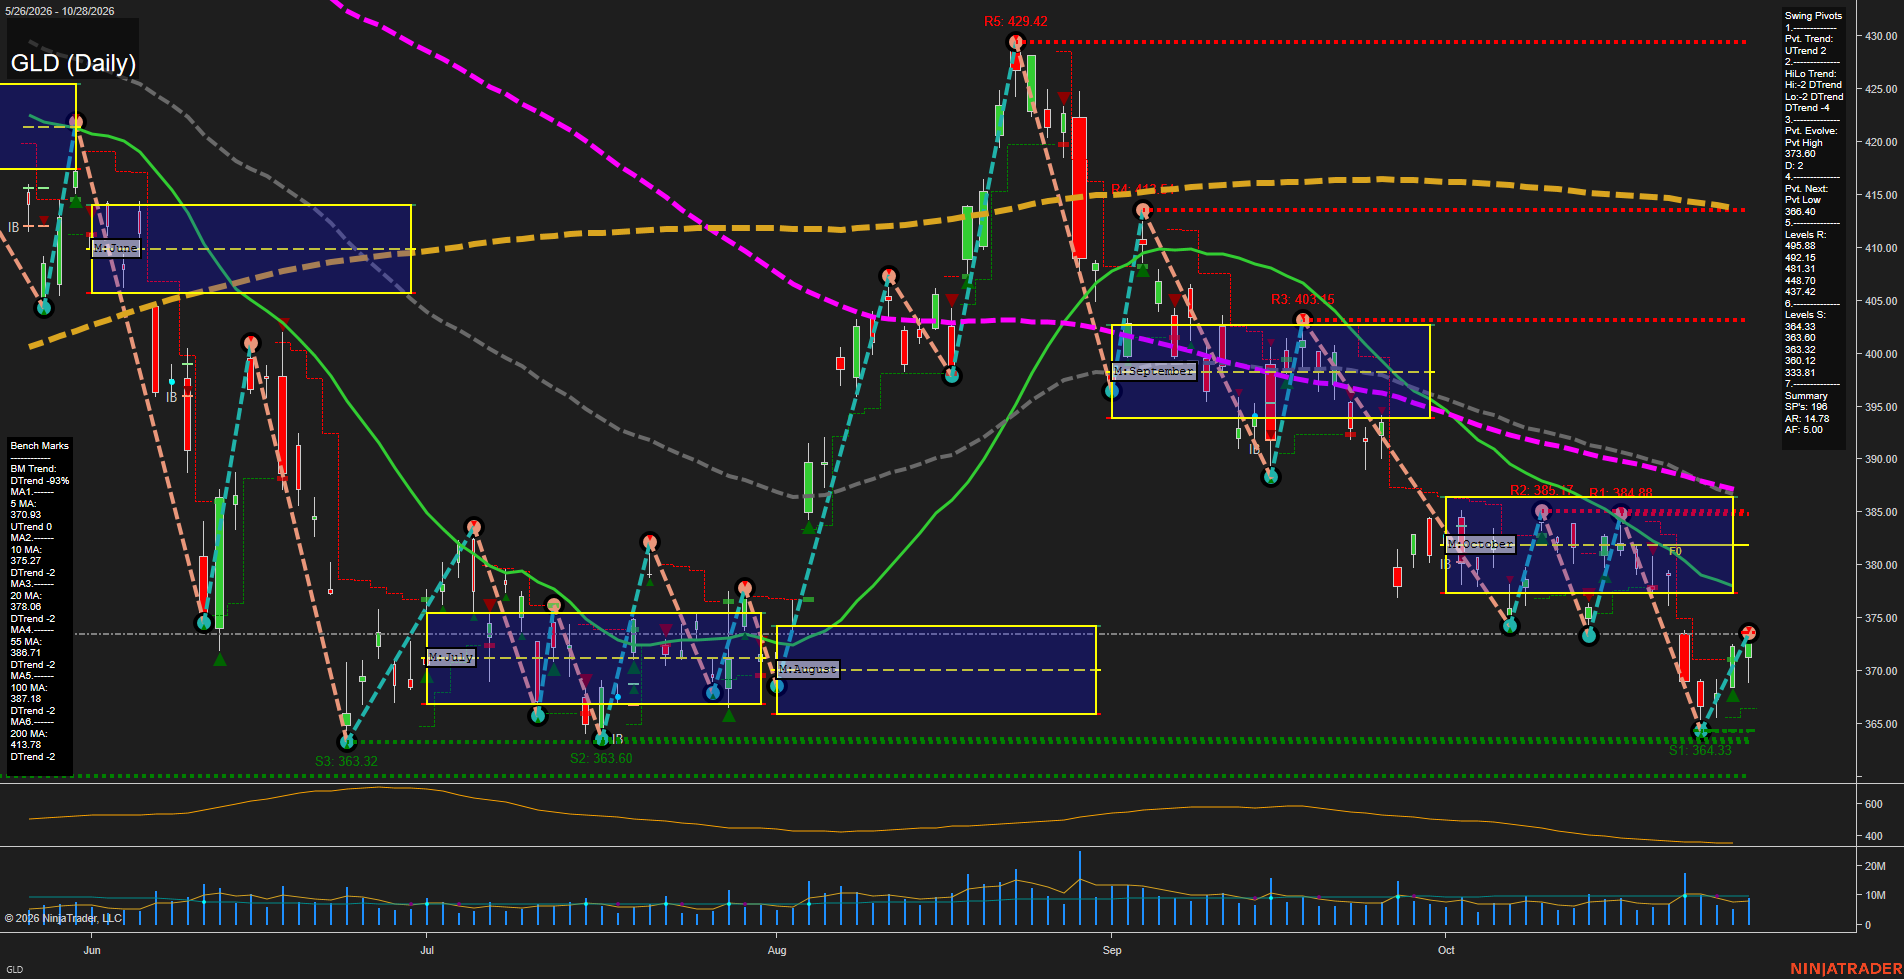
Overall Rating
- Short-Term: Bearish
- Intermediate-Term: Bearish
- Long-Term: Bearish.
Key Insights Summary
GLD is staging a modest rebound from the 364.33-363.32 support cluster, but the futures-style swing structure remains corrective: price is beneath the 10-, 20-, 55-, 100-, and 200-day benchmarks, while both short-term pivot trend and intermediate HiLo trend remain DTrend. The current recovery has lifted above the 5-day average, reflecting a near-term bounce, but the 373.20 pivot-high area and the October NTZ lower boundary remain immediate structural overhead. The broader sequence continues to show lower highs from the September peak, with declining ATR and subdued volume indicating a less impulsive rebound than the preceding selloff. A sustained move through the nearby monthly-grid and moving-average cluster would alter the countertrend character; failure to hold the 364 area would restore focus to the lower support sequence.
View charts on: AlphaWebTrader HTF Charts
GC Daily View
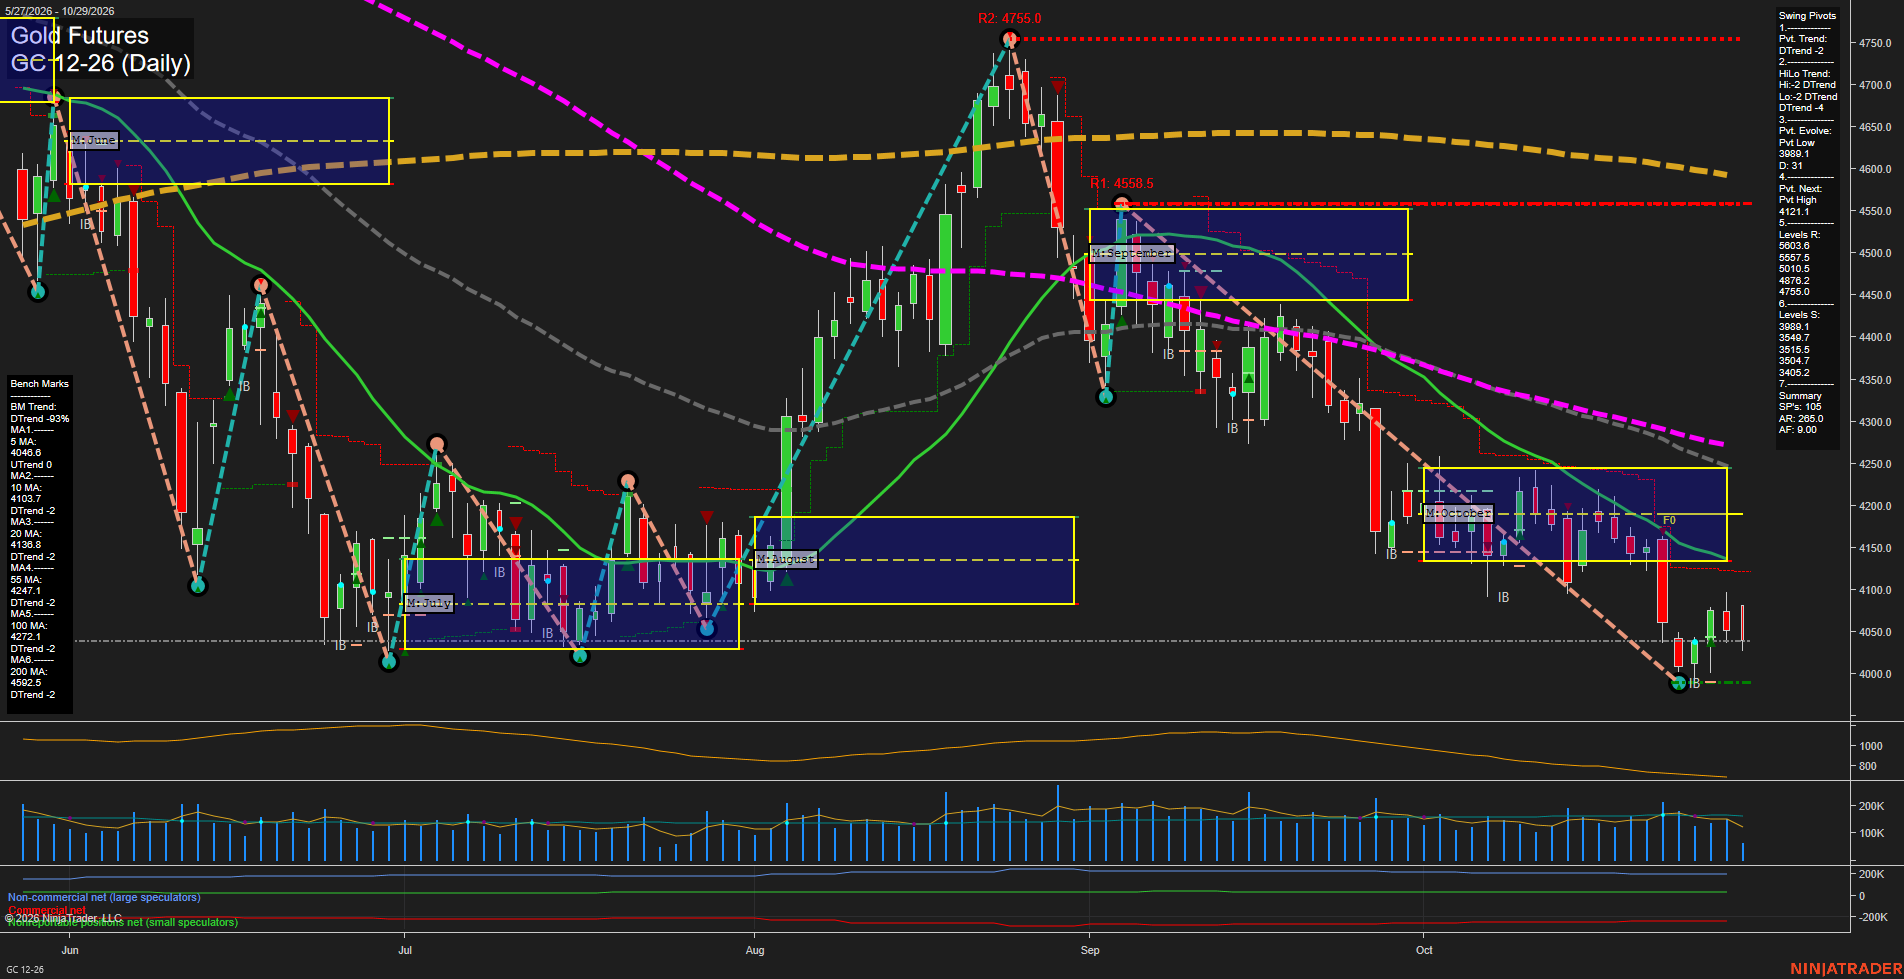
Overall Rating
- Short-Term: Neutral
- Intermediate-Term: Bearish
- Long-Term: Bearish.
Key Insights Summary
Gold remains in a broad daily downswing following the September peak, with lower highs and lower lows confirmed by both pivot-trend measures and price trading beneath the 10-, 20-, 55-, 100-, and 200-day benchmarks. The late-October bounce from the 3993 pivot low is small and momentum remains slow; price is near the 5-day average but remains below the 4121 reversal-pivot level and the October MSFG structure. Weekly positioning is marginally constructive above its F0% area, creating a short-term countertrend stabilization theme within a bearish intermediate- and long-term trend.
View charts on: AlphaWebTrader HTF Charts
ZB Daily View
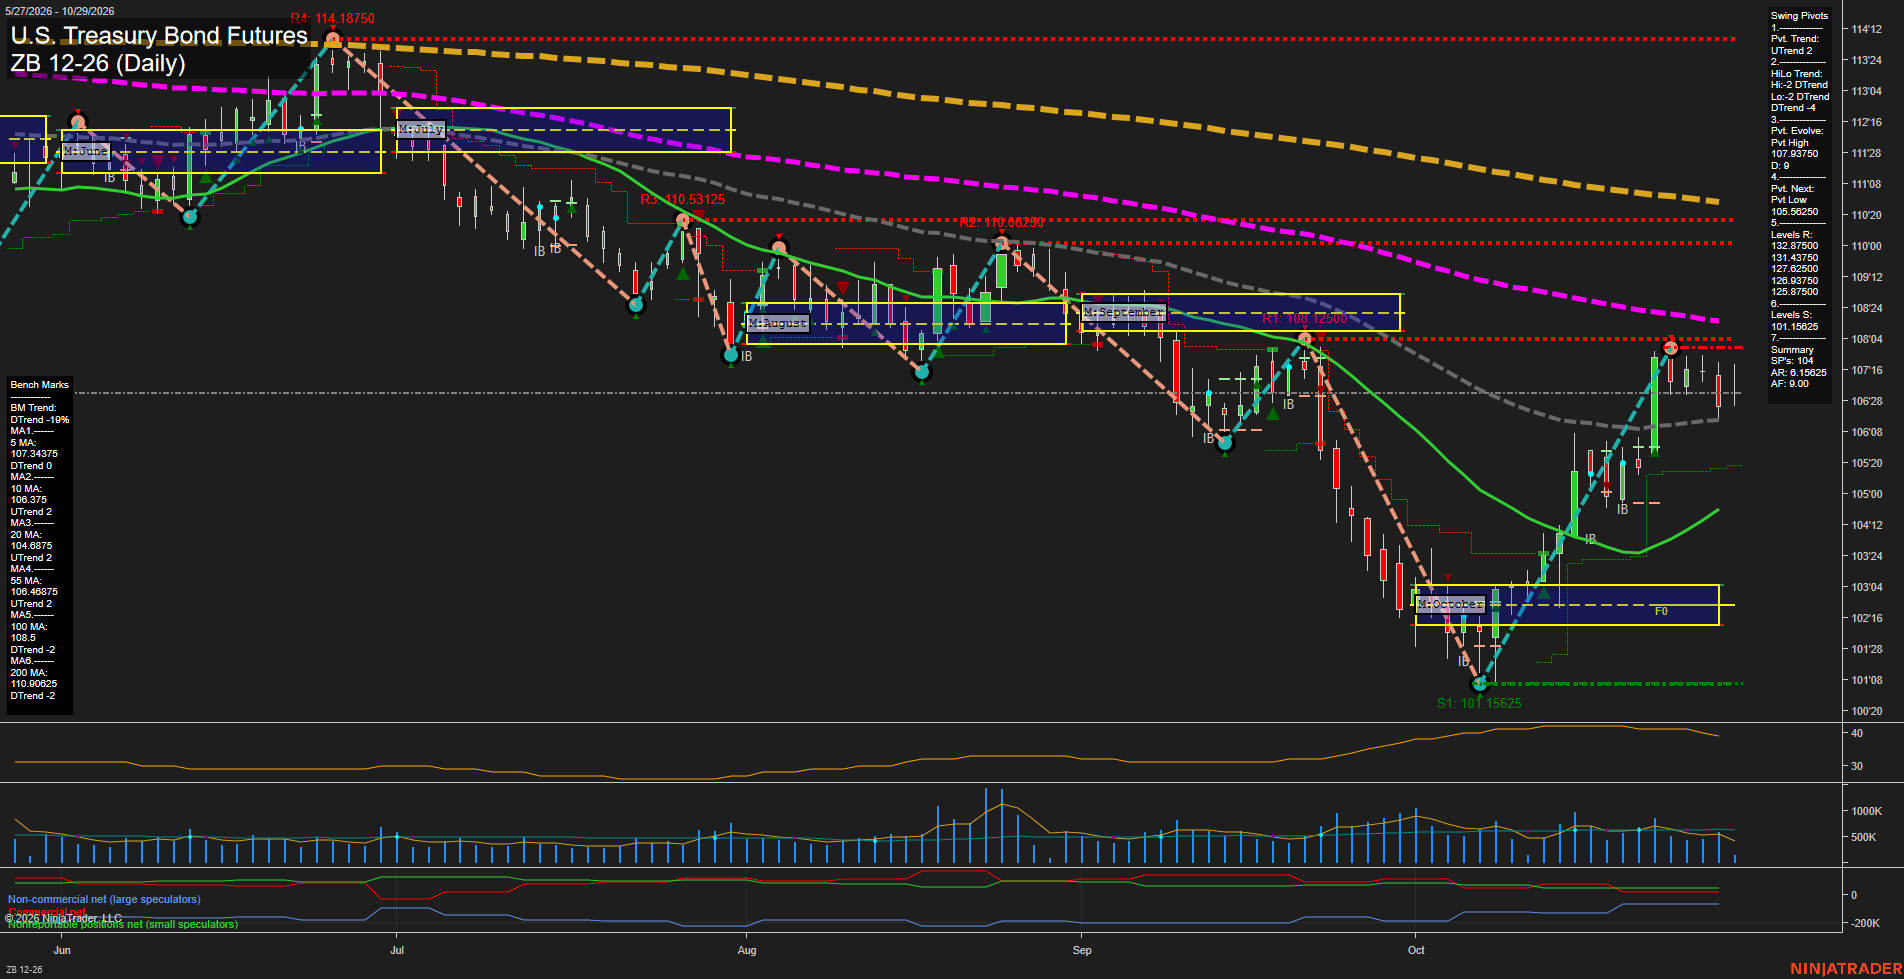
Overall Rating
- Short-Term: Bullish
- Intermediate-Term: Bullish
- Long-Term: Bearish.
Key Insights Summary
The daily structure reflects a sharp October recovery from the 101'05 swing low, with price holding above the weekly and monthly F0% grids and the rising 10-day and 20-day benchmarks. The rebound has slowed beneath the 107'30 pivot high and declining 55-day average, producing smaller, consolidating bars after the fast rally. Short-term pivot structure remains upward, while the intermediate HiLo trend and long-term moving-average alignment remain bearish. This creates a countertrend recovery within the broader long-term decline, with 105'18 defining the next downside pivot threshold and 107'30 marking the nearby recovery ceiling.
View charts on: AlphaWebTrader HTF Charts
Sentiment Summary: Coverage was mostly neutral (46%) with a modest positive bias (+7 percentage points), supported by the Fed’s October 28 rate hold and Microsoft’s earnings beat, including 48% Azure growth. Alphabet’s post-close earnings miss, advertising slowdown and AI cash burn provided the main counterweight, with shares falling more than 10% after hours and Nasdaq futures sliding on October 29 as chip stocks weakened. The Fed’s emphasis on elevated inflation kept further tightening in focus despite Wednesday’s modest index gains.
Conclusion: October 29 GDP and inflation releases at 8:30 a.m. ET precede Amazon’s after-close earnings, leaving both macroeconomic and technology earnings risks on the day’s calendar.