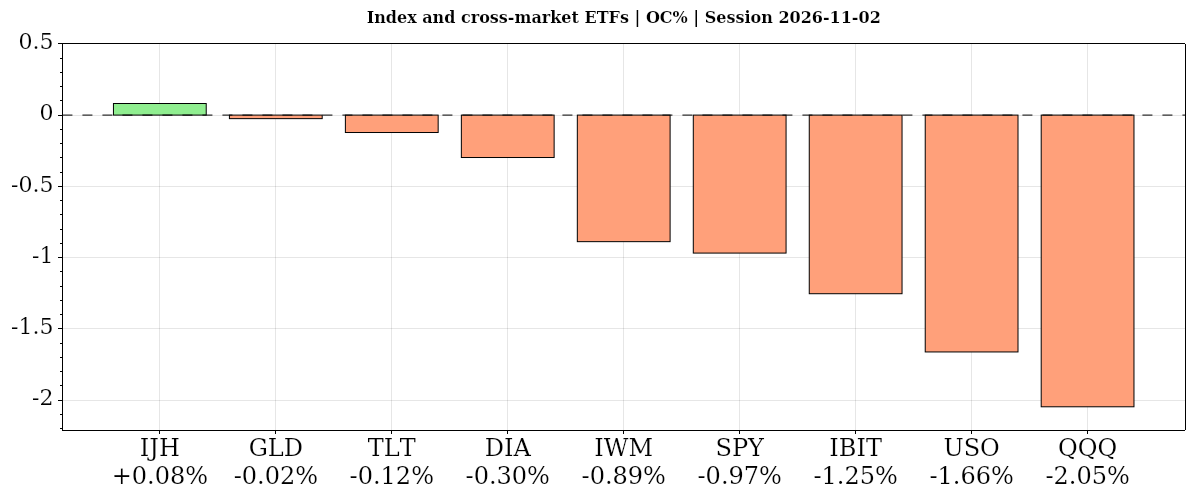
Monday brought 10 a.m. ET ISM manufacturing data, with Apple earnings due after the close. Tech led stock ETF losses; oil and Treasury bonds also fell.
Fundamentals: Monday's calendar featured ISM Manufacturing PMI at 10 a.m. ET, with Apple earnings due after the close. Technology remains under pressure from AI spending and cash-flow concerns: the Nasdaq 100 fell 6.66% in October while the Dow gained 1.7%. Stronger earnings surprises outside tech underscore sector rotation, while U.S. oil fell below $100 a barrel and election positioning added context.
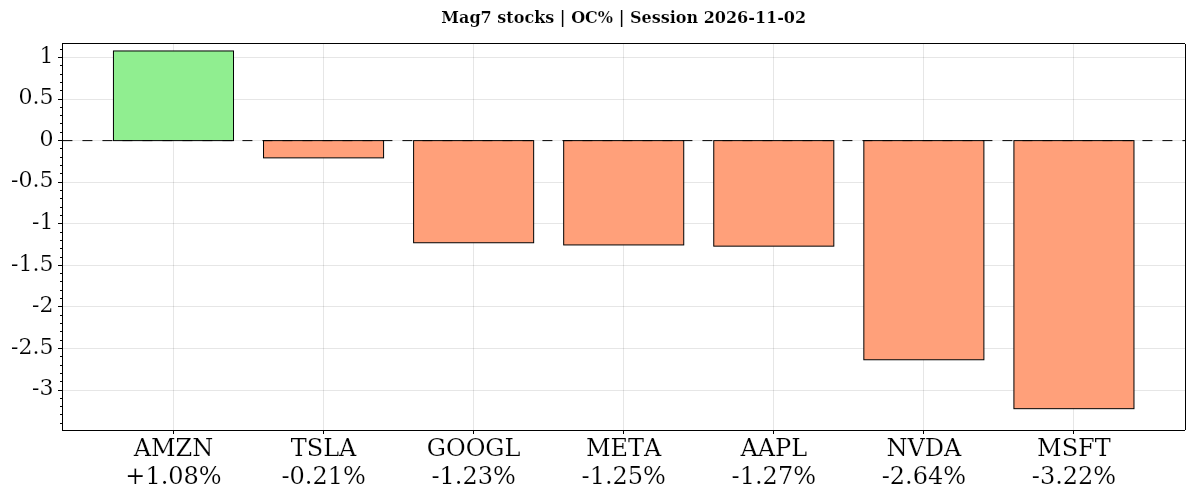
Technicals: Stock ETFs fell from the open in Monday’s completed session: the S&P 500 fund lost 0.97% and the Nasdaq-100 fund dropped 2.05%, with Microsoft down 3.22%. Amazon bucked the weakness, rising 1.08%. The oil fund fell 1.66%, or 7.08% versus its prior close. Gold slipped 0.02% from the open but gained 1.65% versus its prior close. far-term Treasury bonds eased 0.12%, while broader equity futures retained bullish far-term structures.
After Market Close daily snapshot: market news summary and sentiment, major ETFs, Magnificent 7 analysis, Indices Futures Higher Time Frame Analysis, and E-mini S&P500, Nasdaq 100, NYMEX Crude, Gold Futures Daily Chart analysis.
As of: November 2, 2026 08:16 CT
Earnings Radar Day Recap
Monitoring for earnings releases by the Magnificent 7, AI-tech-related firms, and major financial institutions.
| Date/Day | Impact | Company / Symbol | Time | EPS | Revenue | ||||
|---|---|---|---|---|---|---|---|---|---|
| 2026-11-02 – Monday | High | Apple (AAPL) | After close |
|
|
For full details visit: Yahoo Earnings Calendar
EcoNews Radar U.S. Events Day Recap
| Date | Impact | Event, Prev, Forecast, Actual | Info |
|---|---|---|---|
| 2026-11-02 Monday 10:00 | Medium | ISM Manufacturing PMI Prev: 54.5 Forecast: 54.7 Actual: — | Surveys factory activity across orders, production, employment and supplier deliveries; index futures traders monitor it for signals on growth, inflation pressures and the interest-rate outlook. |
Summary: The calendar focuses on the health of US manufacturing.
Market News Summary:
AI spending and cash-flow concerns dominate technology headlines, while stronger earnings outside tech and election positioning highlight market rotation.
Primary Drivers & Risks:
- Primary Driver: AI spending concerns and sector rotation
- Primary Risk: Hyperscaler profitability and financing pressures
Tone:
Cautious on technology, with mixed earnings and divergent sector performance.
Market News Sentiment
Sentiment Bias shows the balance of positive and negative news coverage sampled from 2026-11-01 16:23 to 2026-11-02 15:41 ET, covering stocks, energy and gold.
▼ Market news
- Bias
- ▼ -1.69%
- Articles
- 178
- Positive
- ▲ 26.40%
- Neutral
- — 45.51%
- Negative
- ▼ 28.09%
▲ GLD / Gold
- Bias
- ▲ +11.11%
- Articles
- 9
- Positive
- ▲ 44.44%
- Neutral
- — 22.22%
- Negative
- ▼ 33.33%
Sentiment Summary: Coverage was modestly positive (44% positive versus 33% negative), as gold rebounded more than 2% on November 2, with reports citing falling oil prices, reduced inflation concerns and Fed hike expectations, a weaker dollar, and lower Treasury yields. This followed November 1 coverage warning that tighter-policy expectations constrained gold; despite Monday’s recovery, bearish weekly charts and resistance near $4,000 remained important counterweights after October’s steep losses.
Conclusion: For indices futures traders, the supported cross-market context is easing oil-driven inflation pressure, with upcoming U.S. employment data remaining a key rates-related risk.
▼ USO / Oil
- Bias
- ▼ -18.52%
- Articles
- 27
- Positive
- ▲ 25.93%
- Neutral
- — 29.63%
- Negative
- ▼ 44.44%
Sentiment Summary: Oil coverage leaned negative (44% versus 26% positive) as reports of U.S.-Iran diplomacy drove selling from early Asian trading on November 2 into the U.S. session, with Brent down more than 6% to $105.55 by midday. Cheaper oil eased reported inflation and rate-hike concerns, supporting higher equity futures and a subsequent stock rebound led partly by technology and AI shares. Persistent Hormuz shipping risks, tight supplies and inventory draws counterbalanced the oil decline.
Conclusion: The reported equity recovery accompanied oil-price relief, with November 3 midterm elections and upcoming earnings remaining key event risks.
Glossary: Sentiment Bias = (positive articles − negative articles) ÷ total articles × 100. It ranges from −100% negative to +100% positive. A reading near zero indicates little directional bias. Neutral articles reduce the score’s strength. ▲ positive; ▼ negative; — balanced. These readings describe news coverage, not market-price direction.
Market Technical Analysis
Analysis of VIX volatility, the completed session in major ETFs and mega-cap tech stocks, and futures snapshots and higher-time-frame analysis.
VIX — Market Fear Gauge Daily
| Level | Open | High | MaxVix | Low | MinVix | DNC% | DOC% | VR | MaxVR | MinVR |
|---|---|---|---|---|---|---|---|---|---|---|
| 21.18 | 19.05 | 21.77 | 23.93 | 18.03 | 14.98 | +11.71% | +11.18% | 24.44 | 41.30 | -0.20 |
VIX rose 11.18% from the session's opening level. VIX rose 11.71% versus the previous session close. Expected volatility rose from the period open. VIX is 69.3% up the recent 15-session range (14.98–23.93), in the 60–70% band.
VR: ATN Volatility Ratio (VR): 24.44 – Stocks fell while expected volatility rose. VR is around the middle of its preceding 15-session VR range (-0.20 to 41.30), in the 50–60% band. VR rose 18.67 points from the previous session, a large shift relative to that range.
Range lookback: preceding 15 completed sessions.
Major ETFs and Mega Cap Tech Stocks
- The Nasdaq 100 fell 6.66% in October, while the Dow 30 gained 1.7%.
- Energy, utilities and industrials delivered larger earnings surprises as technology companies struggled to exceed expectations.
- Amazon shares slipped following a third-quarter earnings miss and rising free cash outflow, despite strong AWS growth.
- Alphabet reported 25% revenue growth and 103% Google Cloud revenue growth, but $51.3 billion in AI infrastructure capital expenditure drove negative free cash flow of $9.1 billion.
- Alphabet shares fell 20% over the one-month period covered by a technology-stock performance report.
- Chip stocks faced concerns about sustained demand despite continued heavy spending by large technology companies.
- Tesla shares rose Monday after October vehicle registrations increased across Europe, including substantial gains in Sweden, Spain, Portugal and Norway.
- Apple gained 3% in October and was up 24% in 2026, contrasting with broader technology weakness.
- Meta postponed new business-account terms after objections over potential news-site scraping, while Meta and Snap reached settlements involving alleged social-media harms.
Oil / Energy:
- U.S. oil prices fell below $100 a barrel, while retail gasoline prices declined to $4.12 a gallon Monday.
- Cheniere Energy missed third-quarter earnings estimates as costs rose, but revenue exceeded estimates alongside record cargo exports and higher guidance.
Fed / Financials:
- One market commentator cited a projected interest-rate hiking cycle and energy volatility as pressures on AI sentiment, highlighting hyperscalers’ substantial financing needs.
Macro / Other:
- Kalshi traders assigned a 74% probability to Democrats winning the Senate after polling showed Democratic leads in seven battleground states.
- Market commentary described sharp rotation as investors positioned for midterm election results.
- Tighter ammonia supplies from Trinidad added pressure on U.S. farmers ahead of the elections.
Conclusion:
AI capital spending, weakening cash-flow visibility and concerns about future profitability are central to technology-sector pressure. October’s Nasdaq 100 decline and Dow advance underscore the divergence, alongside stronger earnings surprises outside technology.
Falling oil and gasoline prices, election positioning and individual earnings results provide additional context. Strong cloud growth contrasts with heavy infrastructure costs, while interest-rate concerns add to scrutiny of hyperscaler financing.
ETF, Mag7, and Cross-Market ETF Insights
Overall Tone
On November 2, 2026, daily risk tone was weak from the open across equities and cross-market assets, though prior-close comparisons showed pockets of resilience.
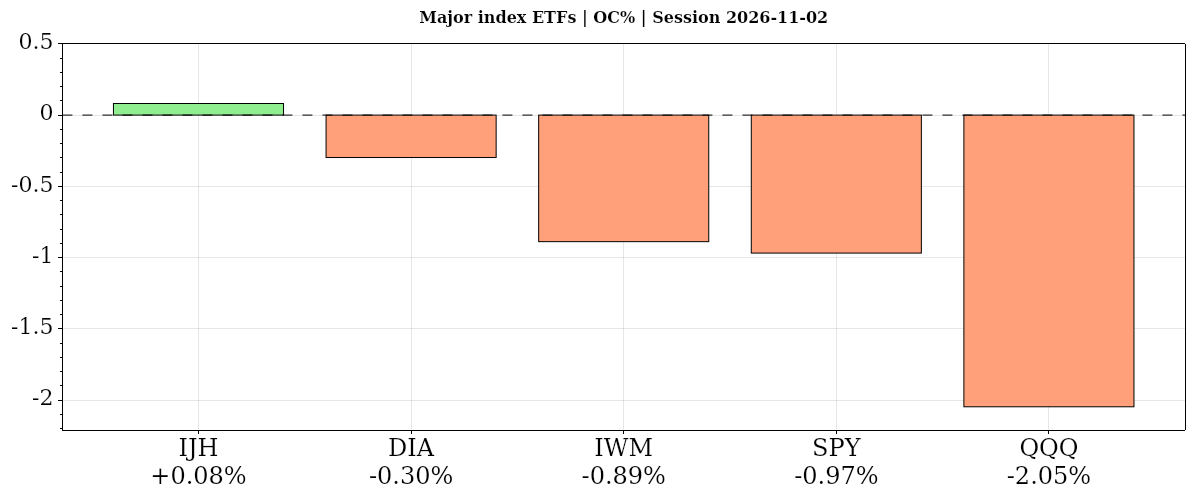
| Instrument | Bias | Date | DNC% | DOC% | O | H | L | C | VWAP | Vol |
|---|---|---|---|---|---|---|---|---|---|---|
| ▲ IJH | ▲ ▲ ▼ | 2026-11-02 | ▲ +0.80% | ▲ +0.08% | 73.86 | 74.59 | 73.75 | 73.92 | ▼ 74.17 | 8,299,604 |
| ▼ DIA | ▲ ▼ ▼ | 2026-11-02 | ▲ +0.43% | ▼ -0.30% | 520.89 | 523.68 | 519.19 | 519.34 | ▼ 521.47 | 3,327,724 |
| ▼ IWM | ▼ ▼ ▼ | 2026-11-02 | ▼ -0.07% | ▼ -0.89% | 281.64 | 283.19 | 278.88 | 279.14 | ▼ 281.07 | 23,994,459 |
| ▼ SPY | ▼ ▼ ▼ | 2026-11-02 | ▼ -0.48% | ▼ -0.97% | 759.45 | 763.86 | 751.60 | 752.10 | ▼ 756.97 | 49,881,625 |
| ▼ QQQ | ▼ ▼ ▼ | 2026-11-02 | ▼ -1.36% | ▼ -2.05% | 695.32 | 699.43 | 680.33 | 681.09 | ▼ 689.39 | 53,875,303 |
| AVG/Sum | — | — | -0.14% | -0.82% | — | — | — | — | — | 139,378,715 |
Index ETFs
Negative confluence: average DOC% -0.83% from the open, DNC% -0.14% versus the prior close; four of five index ETFs fell from the open, with near-flat IJH leading and QQQ lagging. IJH also led versus the prior close, while DIA gained despite falling from the open; QQQ’s decline featured an extreme range and above-average volume.
IJH · D:2026-11-02 NC% ▲ +0.80% OC% ▲ +0.08%
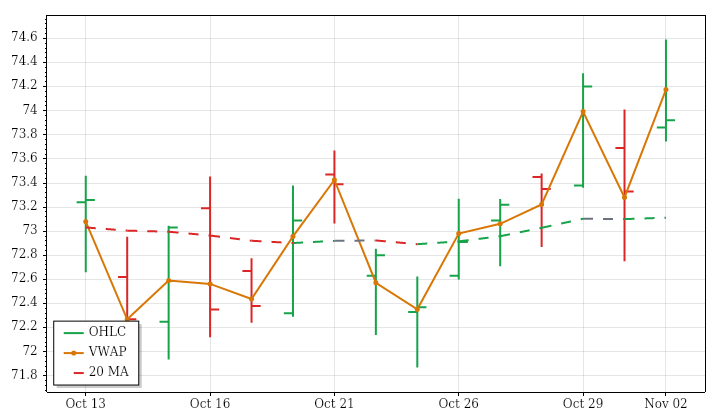
IJH – Mid Cap Technicals Summary
IJH’s completed daily session on November 2 closed at 73.92, up 0.80% from the prior close but only 0.08% from the open. Most of the gain therefore came from an opening gap up that remained unfilled. Price made a higher high and higher low, yet closed near the open, below session VWAP and inside the previous day’s range, limiting the evidence of sustained intraday strength.
The near-term structure is rising, but the longer horizons are not aligned: price sits above a falling intermediate average and slightly below a rising far-term average. The positive 15-session price trend has also produced very little net directional progress relative to its fluctuations. Session range was only slightly above average, while volume was about 22% higher despite a gently declining lookback volume trend. PSAR and ATR-median trends were positive. A next-session low below 72.4604 would conditionally trigger a bearish PSAR reversal.
DIA · D:2026-11-02 NC% ▲ +0.43% OC% ▼ -0.30%
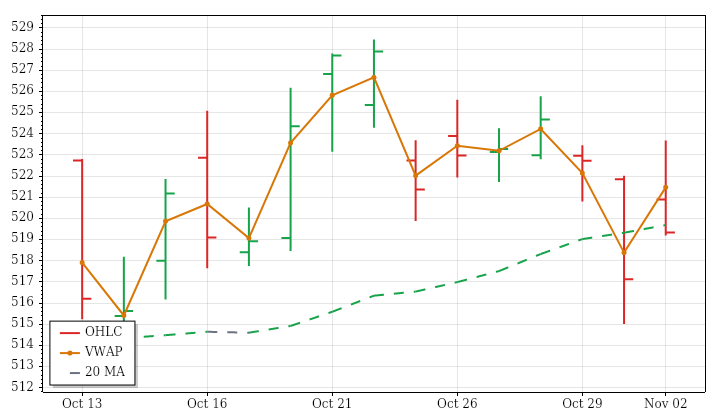
DIA – Dow Jones Technicals Summary
DIA’s completed daily session on November 2 closed at 519.34, gaining 0.43% against the prior close despite losing 0.30% from the open. An unfilled opening gap up accounted for the positive daily return. Price made a higher high and higher low, but finished near the session low, below VWAP and inside the previous day’s range, showing that the opening strength did not carry through the session.
The broader structure remains uneven. Price is below rising near- and intermediate-term averages, leaving both horizons mixed, while it remains above the rising far-term average. The 15-session price trend is positive but has made little efficient directional progress. Session range and volume were close to average, contrasting with contracting ranges and declining volume across that lookback. PSAR remained negative while the ATR-median trend stayed positive. A next-session high above 525.142 would conditionally trigger a bullish PSAR reversal.
IWM · D:2026-11-02 NC% ▼ -0.07% OC% ▼ -0.89%
IWM – Small Cap Technicals Summary
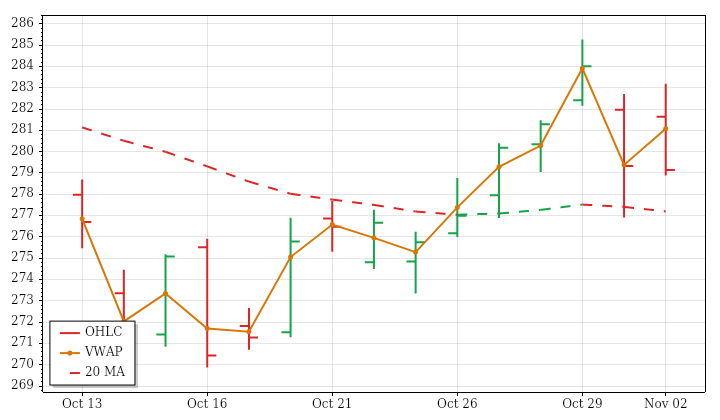
IWM’s completed daily session on November 2 closed at 279.14, down just 0.07% from the prior close but 0.89% from the open. The opening gap up was filled, and price ended near the session low and below VWAP. Although the day produced a higher high and higher low, the close stayed inside the prior day’s range, with the opening advance giving way to intraday weakness.
Price finished below a rising near-term average, leaving that horizon mixed, and below falling intermediate- and far-term averages. This contrasts with the positive 15-session price trend, which has shown very little directional efficiency. Range was about 24% above average, consistent with expanding lookback ranges, while volume was near average against a declining volume trend. Positive PSAR and ATR-median states therefore conflict with weaker moving-average positioning. A next-session low below 276.91 would conditionally trigger a bearish PSAR reversal.
SPY · D:2026-11-02 NC% ▼ -0.48% OC% ▼ -0.97%
SPY – S&P 500 Technicals Summary
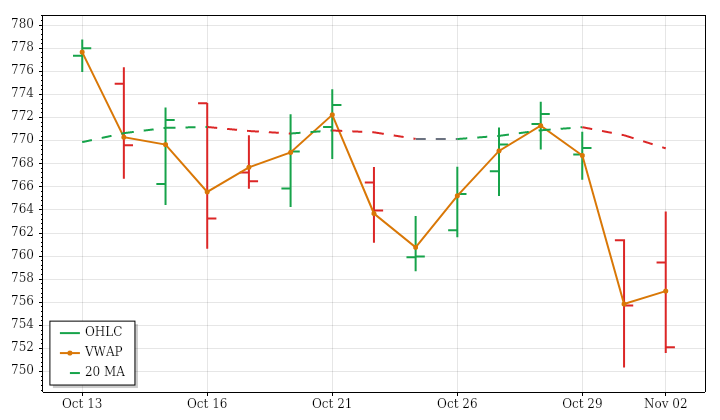
SPY’s completed daily session on November 2 closed at 752.10, down 0.48% from the prior close and 0.97% from the open. The opening gap up was filled, with price eventually finishing near the session low, below VWAP and in the first lower volatility-band zone. A higher high and higher low did not translate into a positive close, although price remained inside the previous day’s range.
The weak session fits the falling near-term average and declining 15-session price trend. Intermediate positioning is mixed because price is below a nearly flat but rising average, while the far-term uptrend remains intact. Range was about 89% above average and volume 23% above average, extending the lookback pattern of expanding ranges and increasing activity. PSAR turned negative alongside the existing negative ATR-median trend. A next-session high above 772.21 would conditionally trigger a bullish PSAR reversal.
QQQ · D:2026-11-02 NC% ▼ -1.36% OC% ▼ -2.05%
QQQ – Nasdaq 100 Technicals Summary
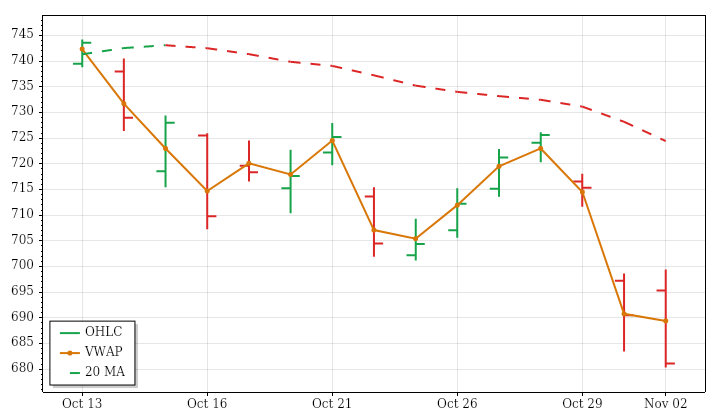
QQQ’s completed daily session on November 2 closed at 681.09, down 1.36% from the prior close and 2.05% from the open. The opening gap up was filled as price formed an outside bar and finished below the previous day’s low. The close near the session low, below VWAP and in the first lower volatility-band zone showed a distinctly weak finish after the initial advance.
That action aligns with falling near- and intermediate-term averages and the declining 15-session price trend. The far-term structure remains mixed, with price below a still-rising average. Session range was about 86% above average, sharply contrasting with modest lookback range contraction, while volume was roughly 27% above average alongside increasing lookback activity. PSAR turned negative, aligning with the existing negative ATR-median trend. A next-session high above 723.8495 would conditionally trigger a bullish PSAR reversal, rather than establish a broader recovery.
| Instrument | Bias | Date | DNC% | DOC% | O | H | L | C | VWAP | Vol |
|---|---|---|---|---|---|---|---|---|---|---|
| ▲ AMZN | ▲ ▲ ▼ | 2026-11-02 | ▲ +2.20% | ▲ +1.08% | 243.01 | 253.81 | 242.28 | 245.63 | ▼ 249.04 | 57,869,620 |
| ▼ TSLA | ▲ ▼ ▼ | 2026-11-02 | ▲ +1.00% | ▼ -0.21% | 404.66 | 414.23 | 397.61 | 403.82 | ▼ 406.99 | 42,841,135 |
| ▼ GOOGL | ▼ ▼ ▼ | 2026-11-02 | ▼ -0.30% | ▼ -1.23% | 282.46 | 287.00 | 278.80 | 278.99 | ▼ 282.55 | 48,009,156 |
| ▼ META | ▼ ▼ ▼ | 2026-11-02 | ▼ -1.34% | ▼ -1.25% | 614.44 | 621.69 | 606.41 | 606.73 | ▼ 611.65 | 18,982,380 |
| ▼ AAPL | ▼ ▼ ▼ | 2026-11-02 | ▼ -1.83% | ▼ -1.27% | 342.67 | 343.80 | 335.82 | 338.32 | ▼ 338.97 | 56,141,698 |
| ▼ NVDA | ▼ ▼ ▼ | 2026-11-02 | ▼ -1.26% | ▼ -2.64% | 207.53 | 209.98 | 201.66 | 202.06 | ▼ 205.05 | 117,972,866 |
| ▼ MSFT | ▼ ▼ ▼ | 2026-11-02 | ▼ -2.83% | ▼ -3.22% | 524.01 | 529.63 | 504.96 | 507.12 | ▼ 516.58 | 33,980,802 |
| AVG/Sum | — | — | -0.62% | -1.25% | — | — | — | — | — | 375,797,657 |
Mag7 Stocks
Negative confluence: average DOC% -1.25% from the open, DNC% -0.62% versus the prior close; Amazon alone advanced from the open, while Microsoft lagged on both comparisons. Tesla joined Amazon above the prior close despite slipping from the open; all seven closed below VWAP, and Microsoft retained a rising longer-term structure.
AMZN · D:2026-11-02 NC% ▲ +2.20% OC% ▲ +1.08%
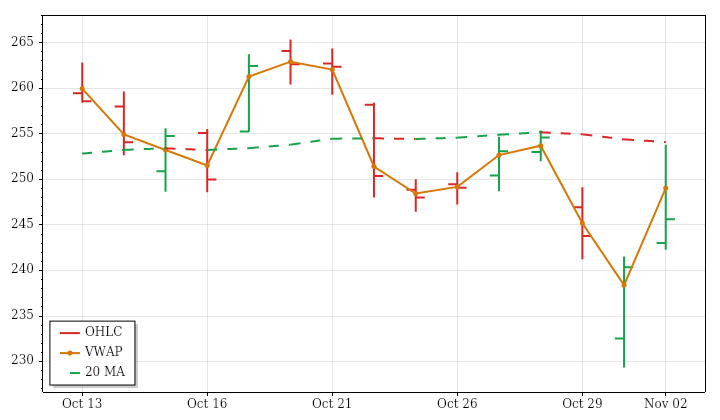
AMZN – Amazon Technicals Summary
AMZN’s completed daily session on November 2 rose 2.20% from the prior close to 245.63, including a 1.08% gain from the open. The opening gap up remained unfilled, and price recorded a higher high and higher low before closing above the previous day’s high. However, the close remained below session VWAP, tempering the strength suggested by the positive return and higher trading range.
The advance runs against falling near- and intermediate-term averages and the declining 15-session price trend. The far-term structure is mixed, with price below an average that is still edging higher. The session’s range was about 82% above average and volume about 34% above average, extending the lookback pattern of expanding ranges and increasing activity. PSAR was in a long state, but the ATR-median trend remained negative. A next-session low below 229.3632 would conditionally trigger a bearish PSAR reversal.
Amazon News and Fundamentals
Amazon’s operating income rose 61% year over year to $28.1 billion, while AWS backlog reached $578 billion. Management guided for AWS growth above 40% in 2027–2028, and cloud supply was reported sold out through 2027. Heavy data-center investment, rising capital expenditures and debt accompanied trailing free cash flow of negative $42.4 billion, raising funding and balance-sheet concerns. Amazon also announced plans to increase capital spending.
TSLA · D:2026-11-02 NC% ▲ +1.00% OC% ▼ -0.21%
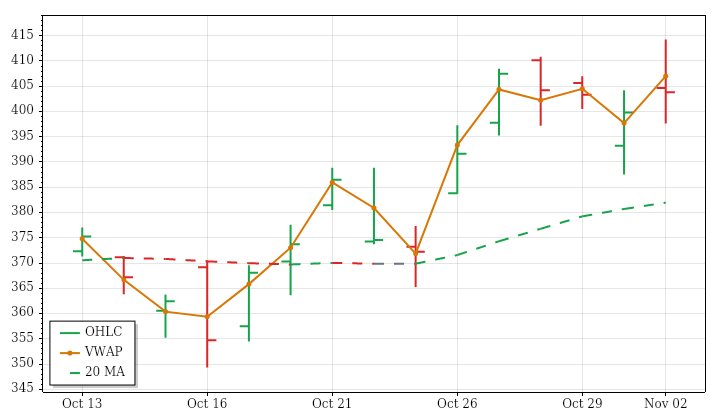
TSLA – Tesla Technicals Summary
TSLA’s completed daily session on November 2 closed at 403.82, up 1.00% from the prior close despite a 0.21% decline from the open. The opening gap up was filled during trading, but the close still retained a gain against the previous close. Price made a higher high and higher low, then finished near the open, below VWAP and inside the previous day’s range.
Near- and intermediate-term averages remain rising, supporting the positive 15-session price trend. The far-term picture is mixed because price is above a still-falling average. Low directional efficiency over the lookback indicates that the upward progress has involved substantial back-and-forth movement. Session range was about 41% above average and volume 13% above average, consistent with expanding ranges and increasing activity. PSAR and ATR-median trends remained positive. A next-session low below 387.52 would conditionally trigger a bearish PSAR reversal.
Tesla News and Fundamentals
Tesla’s October vehicle registrations increased across Europe, with substantial gains reported in Sweden, Spain, Portugal and Norway. October new-car sales in Italy rose 94% year over year, while sales in Portugal increased 186.1%. Tesla shares rose on November 2 as the registration figures were reported.
GOOGL · D:2026-11-02 NC% ▼ -0.30% OC% ▼ -1.23%
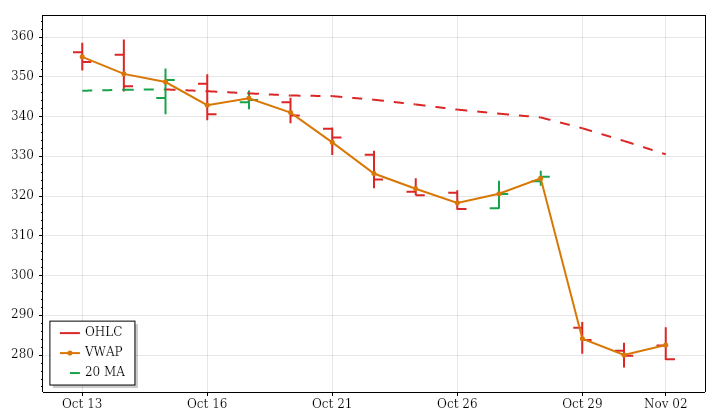
GOOGL – Alphabet Technicals Summary
GOOGL’s completed daily session on November 2 closed at 278.99, down 0.30% from the prior close and 1.23% from the open. The opening gap up was filled, and price finished near the session low, below VWAP and in the first lower volatility-band zone. A higher high and higher low did not prevent that weak finish, although the close remained inside the previous day’s range.
The session’s decline aligns with falling near-, intermediate- and far-term averages. The preceding 15 sessions also show a relatively directional downtrend, so the latest weakness fits the broader technical structure rather than opposing it. Range was about 11% above average despite a contracting lookback range trend; volume was roughly 30% above average, consistent with increasing activity. PSAR and the ATR-median trend remained bearish. A next-session high above 308.5904 would conditionally trigger a bullish PSAR reversal, not confirm a broader trend change.
META · D:2026-11-02 NC% ▼ -1.34% OC% ▼ -1.25%
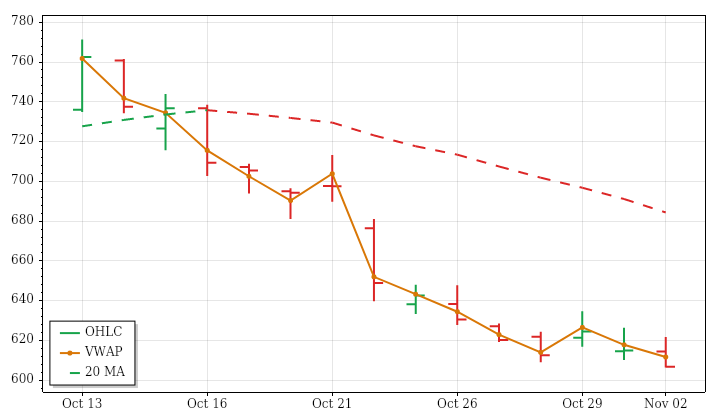
META – Meta Platforms Technicals Summary
META’s completed daily session on November 2 closed at 606.73, down 1.34% from the prior close and 1.25% from the open. A small opening gap down was filled, but the session ultimately recorded a lower high and lower low and closed below the previous day’s low. The finish near the session low and below VWAP reinforced the weak daily price structure.
Near- and intermediate-term averages are falling, aligning with the declining 15-session price trend. The far-term picture remains mixed rather than fully bearish because price is below an average that still slopes upward. The decline occurred on a range roughly one-third below average and volume about 28% below average. Smaller range fits the lookback contraction, whereas lighter participation contrasts with increasing lookback volume. PSAR and the ATR-median trend remained negative. A next-session high above 637.4071 would conditionally trigger a bullish PSAR reversal.
Meta News and Fundamentals
Meta postponed new business-account terms following objections from media companies and open-web advocates. Critics said the proposed rules would permit extensive scraping of website data and potentially enable competing services. Separately, S&P Global Ratings changed Meta’s outlook to Negative, citing uncertainty over future capital expenditures and its ambitious artificial intelligence investments.
AAPL · D:2026-11-02 NC% ▼ -1.83% OC% ▼ -1.27%
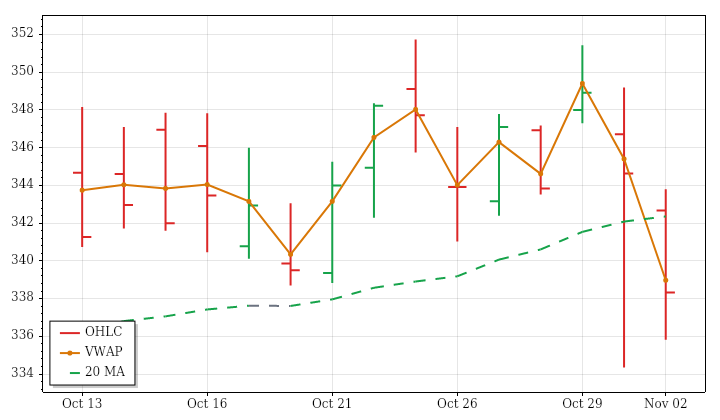
AAPL – Apple Technicals Summary
AAPL’s completed daily session on November 2 closed at 338.32, down 1.83% from the prior close and 1.27% from the open. The opening gap down remained unfilled, and trading on both sides of the open ultimately ended below session VWAP. Although the session stayed inside the prior day’s range, the decline showed weakness relative to the opening level rather than a decisive break beyond the previous day’s boundaries.
That weakness conflicts with rising intermediate- and far-term averages. Price remained just above the intermediate benchmark but below the rising near-term benchmark, leaving the shorter-term structure mixed. Range and volume were roughly 27% and 32% above their respective averages, consistent with expanding ranges and increasing participation over the preceding 15 sessions. PSAR moved into a downtrend while the ATR-median trend remained positive. A next-session high above 350.576 would conditionally trigger a PSAR bullish reversal; none is yet established.
Apple News and Fundamentals
Apple is scheduled to report fiscal fourth-quarter results after the market close on November 2. This will be its first earnings call under CEO John Ternus, who succeeded Tim Cook in September after Cook’s 15-year tenure. Investors will be watching for updates on product strategy, artificial intelligence ambitions and the company’s ability to manage rising memory-chip costs.
NVDA · D:2026-11-02 NC% ▼ -1.26% OC% ▼ -2.64%
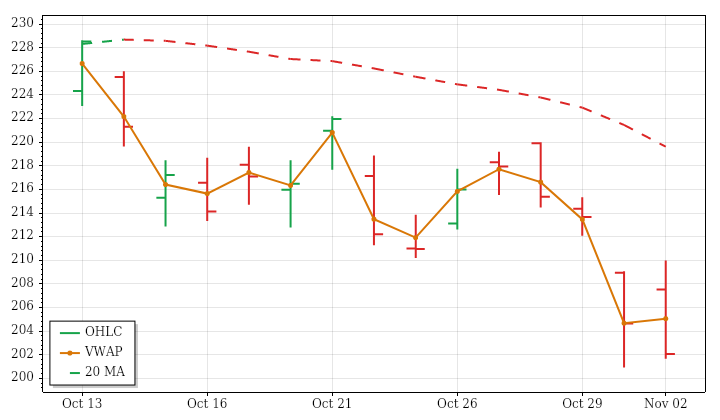
NVDA – Nvidia Technicals Summary
NVDA’s completed daily session on November 2 closed at 202.06, down 1.26% from the prior close and 2.64% from the open. The opening gap up was filled, and price finished near the session low, below VWAP and in the first lower volatility-band zone. Despite a higher high and higher low, the close remained inside the previous day’s range, separating the weak intraday reversal from a break below that prior range.
Near- and intermediate-term averages are falling, matching the declining 15-session price trend. The far-term structure is mixed because price is below an average that still rises. Range was about 58% above average and volume 17% above average, consistent with the lookback tendency toward expanding ranges and increasing activity. PSAR moved into a downtrend alongside the negative ATR-median trend. A next-session high above 219.0365 would conditionally trigger a bullish PSAR reversal.
MSFT · D:2026-11-02 NC% ▼ -2.83% OC% ▼ -3.22%
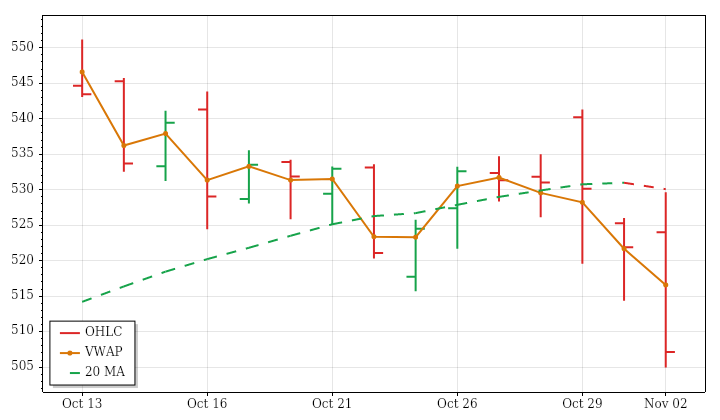
MSFT – Microsoft Technicals Summary
MSFT’s completed daily session on November 2 closed at 507.12, down 2.83% from the prior close and 3.22% from the open. An opening gap up was filled as an outside bar developed, with price finishing below the previous day’s low, near the session low and below VWAP. The close also occupied the first lower volatility-band zone, underscoring the weak finish.
The decline reinforces a falling near-term structure and leaves price below the still-rising intermediate average. The far-term uptrend remains intact, so the weakness is not aligned across every horizon. Session range exceeded twice its average, and volume was about 51% above average, extending the preceding 15-session expansion in ranges and activity. PSAR turned negative, joining the existing negative ATR-median trend. A next-session high above 539.4735 would conditionally trigger a bullish PSAR reversal; that threshold is not an established recovery signal.
Microsoft News and Fundamentals
Microsoft’s fiscal first-quarter 2027 results included 48% Azure revenue growth, $18.6 billion in free cash flow and operating margins of 50%. Commercial remaining performance obligations rose 73% to $677 billion. Copilot adoption continued to grow. Capital-expenditure guidance exceeded $50 billion, with lease commitments also increasing. Microsoft separately announced its first major U.S. bond sale in years.
| Instrument | Bias | Date | DNC% | DOC% | O | H | L | C | VWAP | Vol |
|---|---|---|---|---|---|---|---|---|---|---|
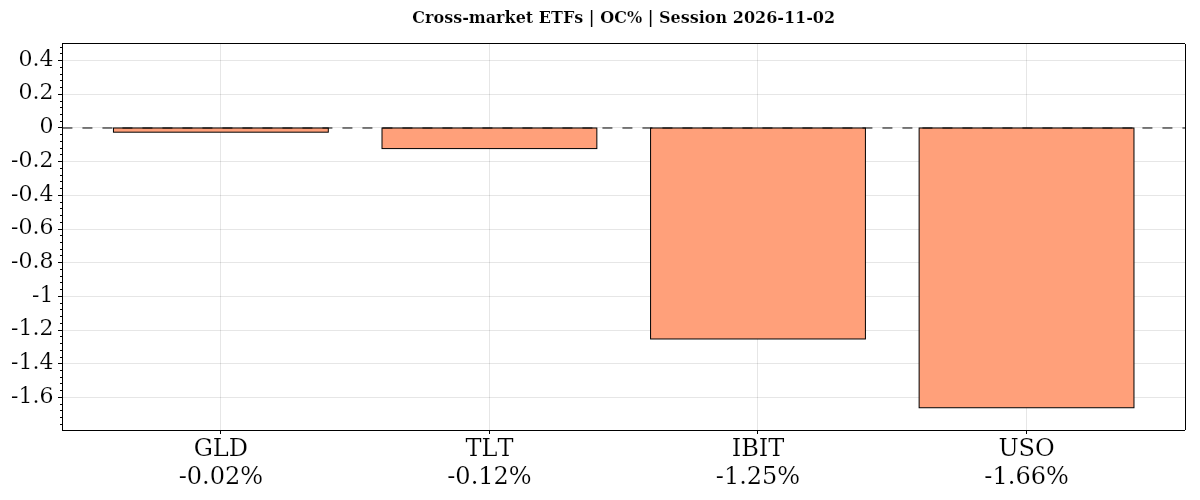
| ▼ GLD | ▲ ▼ ▼ | 2026-11-02 | ▲ +1.65% | ▼ -0.02% | 361.74 | 363.80 | 360.80 | 361.65 | ▼ 362.42 | 8,588,790 |
| ▼ TLT | ▼ ▼ ▼ | 2026-11-02 | ▼ -0.13% | ▼ -0.12% | 81.83 | 82.17 | 81.55 | 81.73 | ▼ 81.89 | 35,841,602 |
| ▼ IBIT | ▼ ▼ ▼ | 2026-11-02 | ▼ -0.02% | ▼ -1.25% | 43.90 | 44.15 | 43.29 | 43.35 | ▼ 43.69 | 34,600,427 |
| ▼ USO | ▼ ▼ ▼ | 2026-11-02 | ▼ -7.08% | ▼ -1.66% | 159.52 | 159.86 | 155.75 | 156.87 | ▼ 158.10 | 7,379,428 |
| AVG/Sum | — | — | -1.40% | -0.77% | — | — | — | — | — | 86,410,247 |
Cross-Market ETFs
Negative confluence: average DOC% -0.76% from the open, DNC% -1.40% versus the prior close; oil lagged, bitcoin and bonds slipped, and gold was nearly flat. Gold diverged from weaker equities versus the prior close, gaining 1.65%, while oil fell 7.08%, largely through its opening gap.
GLD · D:2026-11-02 NC% ▲ +1.65% OC% ▼ -0.02%
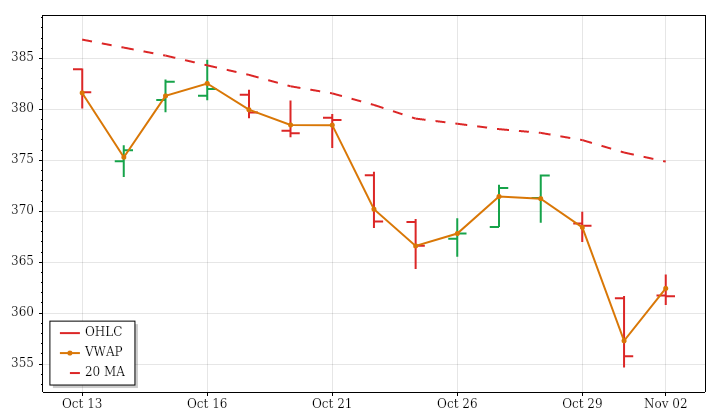
GLD – Gold Technicals Summary
GLD’s completed daily session on November 2 closed at 361.65, up 1.65% from the prior close but essentially unchanged from the open, with a 0.02% intraday decline. The unfilled opening gap up supplied the daily gain. Trading crossed both sides of the open and finished below session VWAP, while the close remained inside the prior day’s range despite a higher high and higher low.
This was a positive daily return within aligned near-, intermediate- and far-term downtrends, not confirmation that those trends had reversed. Price remained below falling averages across all three horizons and close to its annual low. The session range was about 23% below average and volume slightly below average, contrary to the preceding 15-session pattern of expanding ranges and increasing volume. PSAR and the ATR-median trend remained negative. A next-session high above 371.8586 would conditionally trigger a bullish PSAR reversal.
Gold News and Fundamentals
Gold struggled to recover from Friday’s selloff despite easing real yields. Upcoming U.S. employment data were identified as a key catalyst.
TLT · D:2026-11-02 NC% ▼ -0.13% OC% ▼ -0.12%
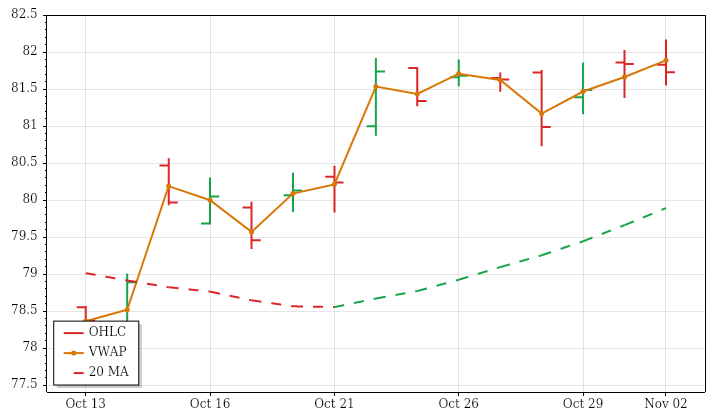
TLT – Long-Term Treasury Bonds Technicals Summary
TLT’s completed daily session on November 2 closed at 81.73, down 0.13% from the prior close and 0.12% from the open. The tiny opening gap down was filled, and trading crossed both sides of the open before finishing below session VWAP. Price nevertheless recorded a higher high and higher low, with the close remaining inside the previous day’s range rather than extending beyond its boundaries.
The modest daily decline contrasts with rising near- and intermediate-term averages and an upward 15-session price trend. Those shorter-horizon gains remain within a falling far-term structure, since price is still below the declining long-horizon average. Session range was close to average despite expanding lookback ranges, while slightly below-average volume was consistent with declining participation. PSAR and the ATR-median trend were positive. A next-session low below 80.802 would conditionally trigger a bearish PSAR reversal without itself resolving the broader horizon conflict.
IBIT · D:2026-11-02 NC% ▼ -0.02% OC% ▼ -1.25%
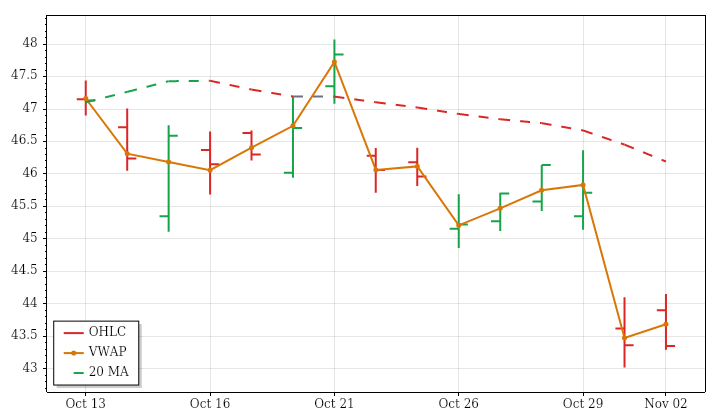
IBIT – Bitcoin Technicals Summary
IBIT’s completed daily session on November 2 closed at 43.35, almost unchanged from the prior close with a 0.02% loss, but down 1.25% from the open. The opening gap up was completely erased. Despite a higher high and higher low, price finished near the session low, below VWAP and in the first lower volatility-band zone, while remaining inside the previous day’s range.
The weak intraday performance fits the falling near-term structure and the declining 15-session price trend. Intermediate positioning is mixed because price is below an average that continues to rise, while the far-term uptrend remains intact. This leaves shorter-term weakness within a stronger long-horizon structure. The session range was close to average, but volume was about 13% below average, unlike the lookback pattern of expanding ranges and increasing volume. A next-session high above 46.9463 would conditionally trigger a bullish PSAR reversal.
USO · D:2026-11-02 NC% ▼ -7.08% OC% ▼ -1.66%
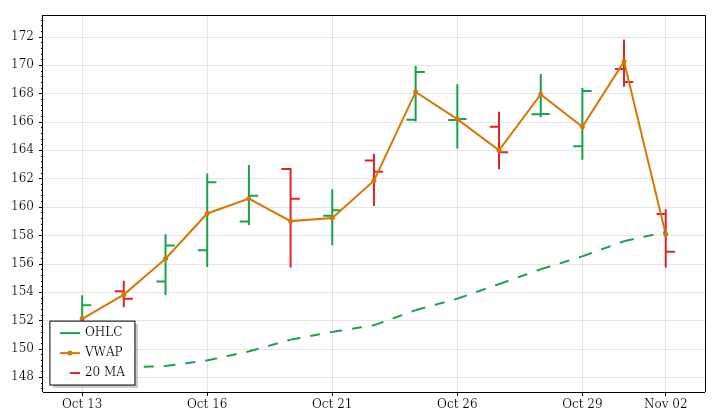
USO – Oil Technicals Summary
USO’s completed daily session on November 2 closed at 156.87, down 7.08% from the prior close and 1.66% from the open. Most of the daily loss came from a large opening gap down that remained unfilled. Price then recorded a lower high and lower low, closing below the previous day’s low and session VWAP. The entire session occupied the first lower volatility-band zone.
The abrupt decline conflicts with rising intermediate- and far-term averages and the positive preceding 15-session price trend. Price fell below the rising near-term average, leaving that horizon mixed rather than uniformly upward. Despite the large prior-close loss, the intraday range was only around average; volume was roughly 52% above average, consistent with increasing lookback activity. PSAR was in a short state while the ATR-median trend remained positive. A next-session high above 171.82 would conditionally trigger a bullish PSAR reversal.
Oil News and Fundamentals
U.S. oil prices fell below $100 a barrel on November 2, while Brent dropped more than 6% to $105.55, its lowest level in over two weeks, amid hopes of a breakthrough to end the Iran war. Selling pressure persisted despite crude inventory draws and unchanged OPEC+ production requirements. ADNOC’s CEO said nearly 1 billion barrels had been drained from global inventories since the Hormuz disruption. Goldman Sachs analysts warned Brent could reach $140 next year if Middle East tensions worsen.
Glossary: Instrument — ticker symbol; hover for the instrument or company name; Date — session date. DNC% — prior-session close to this session’s close; DOC% — daily session open-to-close percentage change. O — open; H — high; L — low; C — close, all for the table’s daily or weekly session; VWAP — volume-weighted average price; its arrow shows whether the close is above or below VWAP. Vol — period trading volume.
Bias — three directional readings, in order: DNC%, DOC%, then VWAP. ▲ positive/above; ▼ negative/below; — neutral or unavailable. Matching arrows show alignment; opposing arrows show mixed conditions. AVG/Sum — simple average of percentage changes and sum of reported volumes.
Futures Session Fib Grid Analysis – Snapshot
Session Fib Grids normalise market positioning as percentages, making direction and alignment comparable across different asset types.
Latest available snapshot for each instrument; Time(CT) shows the individual update date and time.
| Instrument | Bias | Time(CT) | YSFG | MSFG | WSFG | RSFG | SFG | TSI |
|---|---|---|---|---|---|---|---|---|
| ▼ ES | ▲ ▼ ▼ ▼ ▼ ▼ | 2026-11-02 20:18:41 | ▲ +41 | ▼ -15 | ▼ -24 | ▼ -96 | ▼ -5 | ▼ -75 |
| ▼ NQ | ▲ ▼ ▼ ▼ ▲ ▼ | 2026-11-02 20:18:45 | ▲ +37 | ▼ -13 | ▼ -23 | ▼ -87 | ▲ +3 | ▼ -19 |
| ▼ YM | ▲ ▲ ▲ ▼ ▼ ▼ | 2026-11-02 20:18:36 | ▲ +27 | ▲ +1 | ▲ +1 | ▼ -66 | ▼ -22 | ▼ -161 |
| ▲ EMD | ▲ ▲ ▲ ▲ ▲ ▼ | 2026-11-02 15:59:52 | ▲ +39 | ▲ +21 | ▲ +35 | ▲ +17 | ▲ +17 | ▼ -28 |
| ▼ RTY | ▲ ▼ ▼ ▼ ― ▼ | 2026-11-02 20:18:42 | ▲ +37 | ▼ -6 | ▼ -9 | ▼ -67 | — 0 | ▼ -36 |
| ▲ FDAX | ▲ ▲ ▲ ▲ ▲ ▼ | 2026-11-02 14:59:59 | ▲ +27 | ▲ +3 | ▲ +4 | ▲ +22 | ▲ +6 | ▼ -20 |
| ▲ NKD | ▲ ▲ ▲ ▲ ▲ ▲ | 2026-11-02 20:18:48 | ▲ +150 | ▲ +6 | ▲ +12 | ▲ +16 | ▲ +16 | ▲ +34 |
| Instrument | Bias | Time(CT) | YSFG | MSFG | WSFG | RSFG | SFG | TSI |
|---|---|---|---|---|---|---|---|---|
| ▼ BTC | ▼ ▼ ▼ ▼ ▲ ▼ | 2026-11-02 20:18:44 | ▼ -50 | ▼ -6 | ▼ -20 | ▼ -29 | ▲ +13 | ▼ -93 |
| ▲ GC | ▼ ▲ ▲ ▲ ▼ ▼ | 2026-11-02 20:18:46 | ▼ -155 | ▲ +15 | ▲ +35 | ▲ +80 | ▼ -1 | ▼ -70 |
| ▼ CL | ▲ ▼ ▼ ▼ ▲ ▼ | 2026-11-02 20:18:28 | ▲ +174 | ▼ -29 | ▼ -75 | ▼ -35 | ▲ +3 | ▼ -23 |
| ▼ 6E | ▼ ▲ ▲ ▼ ▼ ▼ | 2026-11-02 20:18:17 | ▼ -58 | ▲ +10 | ▲ +22 | ▼ -58 | ▼ -12 | ▼ -182 |
| ▼ ZB | ▼ ▲ ▲ ▼ ▼ ▲ | 2026-10-21 09:39:59 | ▼ -39 | ▲ +77 | ▲ +6 | ▼ -3 | ▼ -2 | ▲ +29 |
Glossary: YSFG — yearly; MSFG — monthly; WSFG — weekly; RSFG — regular trading hours (RTH); SFG — the current session, including pre-market or other sessions. TSI indicates trend strength and power.
Bias shows trend alignment across these six readings. The arrows follow the column order: YSFG, MSFG, WSFG, RSFG, SFG and TSI. Matching arrows show alignment; opposing arrows show mixed conditions.
Futures Higher Time Frame Analysis
Summary of the current state of US Indices Futures based on higher time-frame (HTF) technical analysis as of: 2026-11-02 16:00 -05:00 CT.
US Indices Futures
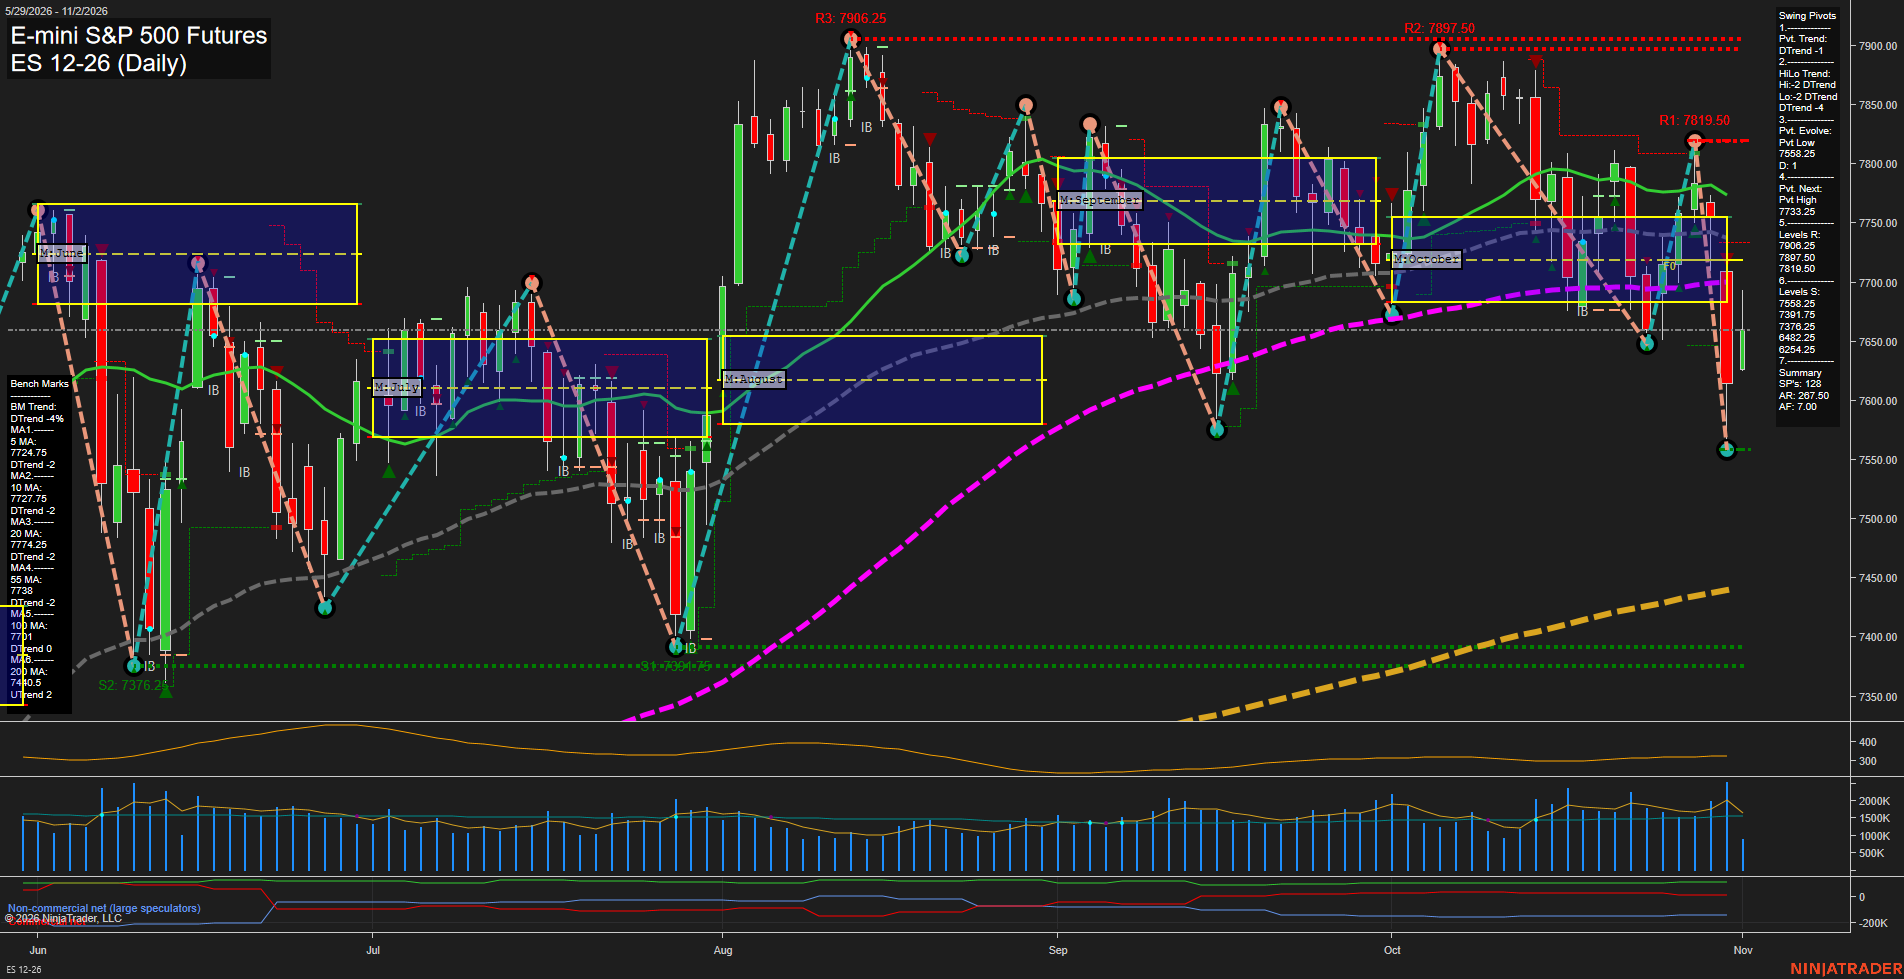
- ES YSFG/MSFG upward, WSFG unspecified, rising 55/100/200 benchmarks, below declining 5/10/20 benchmarks, pivot support 7558.25, resistance 7874.75–7906.25.
- NQ Fib-grid alignment unspecified, short/intermediate pivots DTrend, below 5–100-day benchmarks, rising 200-day nearby, support 28220.75–28232.75, reversal threshold 29463.25.
- YM YSFG/MSFG upward, WSFG unspecified, rising longer-term weekly benchmarks, daily DTrend, support 51700/50859, daily resistance 52961–53168, weekly reversal 53223.
- EMD above WSFG/MSFG/YSFG F0%, rising weekly 55/100/200 benchmarks, daily pivots upward, support 3600–3604, resistance 3739/3793.5/3825, daily benchmark resistance 3782–3868.
- RTY above WSFG/MSFG/YSFG references, weekly HiLo UTrend, daily pivots upward, below daily 55/100 benchmarks, support 2723.3, resistance 2869–2888.9/3101.8.
- FDAX YSFG/MSFG/WSFG upward, above six rising daily benchmarks, daily pivots UTrend versus weekly DTrend, support 25560/25119/24925–24897, resistance 26246/26255/26844–26847.
Overall State
- Short-Term: Neutral
- Intermediate-Term: Bullish
- Long-Term: Bullish
Conclusion
Weekly YSFG/MSFG and longer-term benchmark structures remain predominantly bullish, while short-term pivot directions diverge. ES, NQ, and YM retain downside short-term structures; EMD and RTY show daily recovery pivots, and FDAX has daily UTrend alignment across rising benchmarks despite its weekly DTrend. NQ lags through intermediate DTrend and price below its 5–100-day benchmarks. EMD and RTY recoveries remain beneath daily benchmark resistance. These differences leave short-term correlation mixed within broadly upward weekly structures, with the listed swing lows defining support and pivot highs defining overhead resistance.
Note: Intra-day counter-trend pullbacks or retracements may occur, HTF is context for informational usage and market structure. Glossary: Session Fib Grids periods of YSFG:’Yearly’, MSFG:’Monthly’, WSFG:’Weekly’
For full details visit: AlphaWebTrader Technicals
SPY Daily View
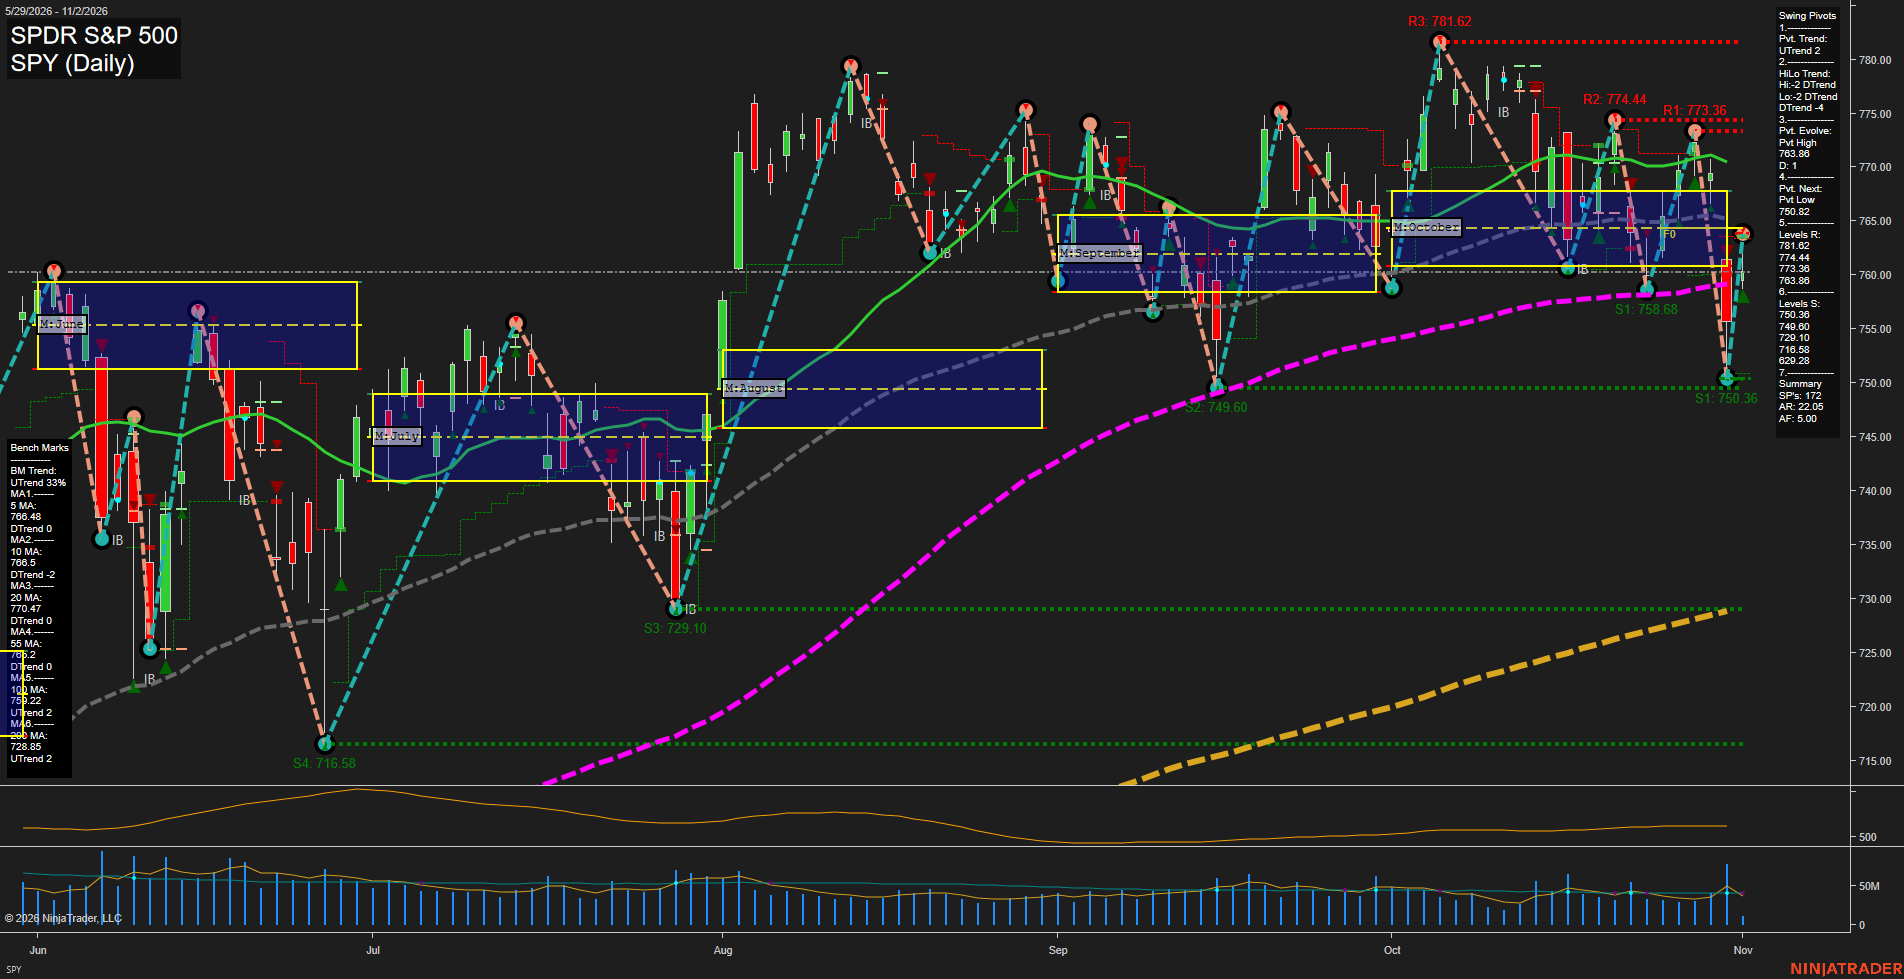
Overall Rating
- Short-Term: Neutral
- Intermediate-Term: Neutral
- Long-Term: Bullish.
Key Insights Summary
SPY futures-equivalent price action shows a large V-style rebound from the 750.36 support area back to 763.88, returning to the monthly and weekly F0% balance zone. The short-term pivot structure remains in UTrend, but price is still beneath declining 5, 10, 20, and 55-day benchmarks, leaving the near-term structure rotational and choppy. The 763.88 to 774.44 area contains layered pivot and moving-average resistance, while 758.68 and 749.60 define the nearest swing-support sequence. The broader futures swing backdrop remains constructive because price holds above rising 100-day and 200-day benchmarks, although the current rebound is occurring within an intermediate-term consolidation rather than a confirmed momentum expansion.
View charts on: AlphaWebTrader HTF Charts
ES Daily View
View charts on: AlphaWebTrader HTF Charts
QQQ Daily View
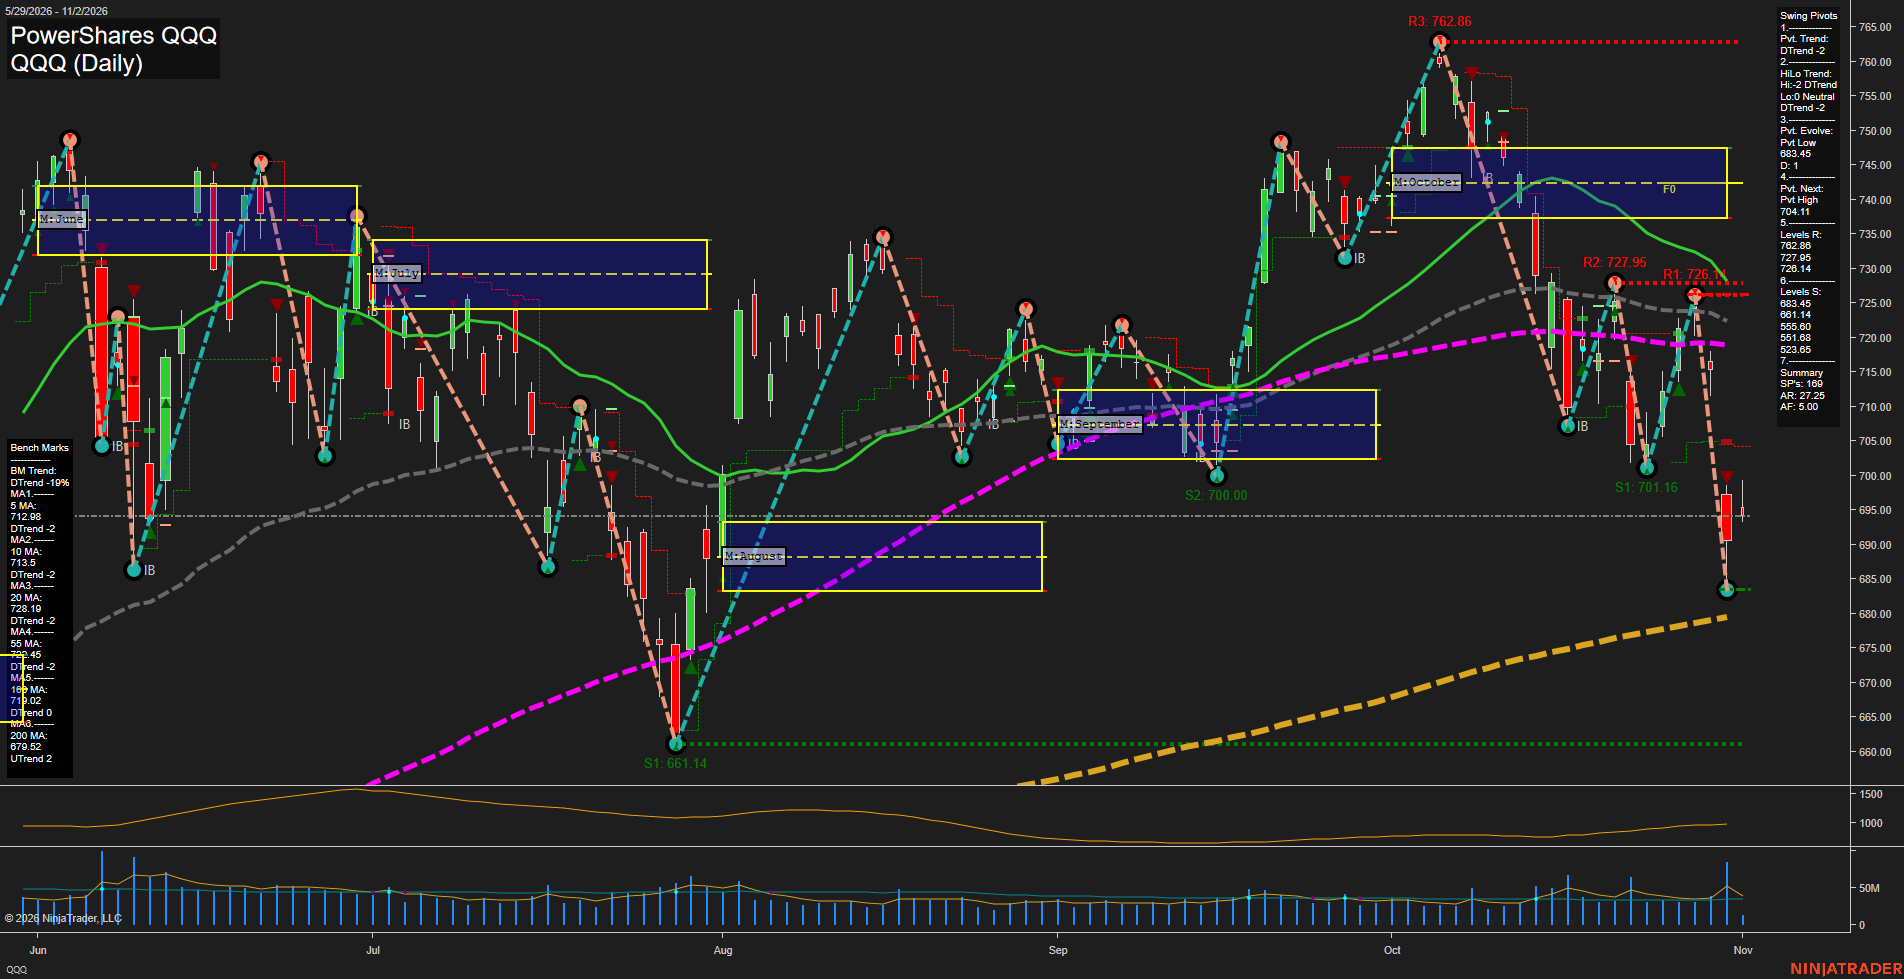
Overall Rating
- Short-Term: Bearish
- Intermediate-Term: Bearish
- Long-Term: Neutral.
Key Insights Summary
QQQ futures-equivalent swing structure is decisively lower across the short and intermediate horizons: price is beneath the declining 5, 10, 20, 55, and 100-day benchmarks, while the pivot sequence remains DTrend with lower highs and a fresh 683.45 pivot low. The rapid decline from the 726-728 resistance cluster has expanded daily range and momentum, with 704.11 defining the nearest opposing pivot level. The 683.45 area is the immediate structural reference, followed by 661.14 support; the still-rising 200-day average near 679.52 preserves a neutral longer-cycle backdrop despite the current corrective downswing.
View charts on: AlphaWebTrader HTF Charts
NQ Daily View
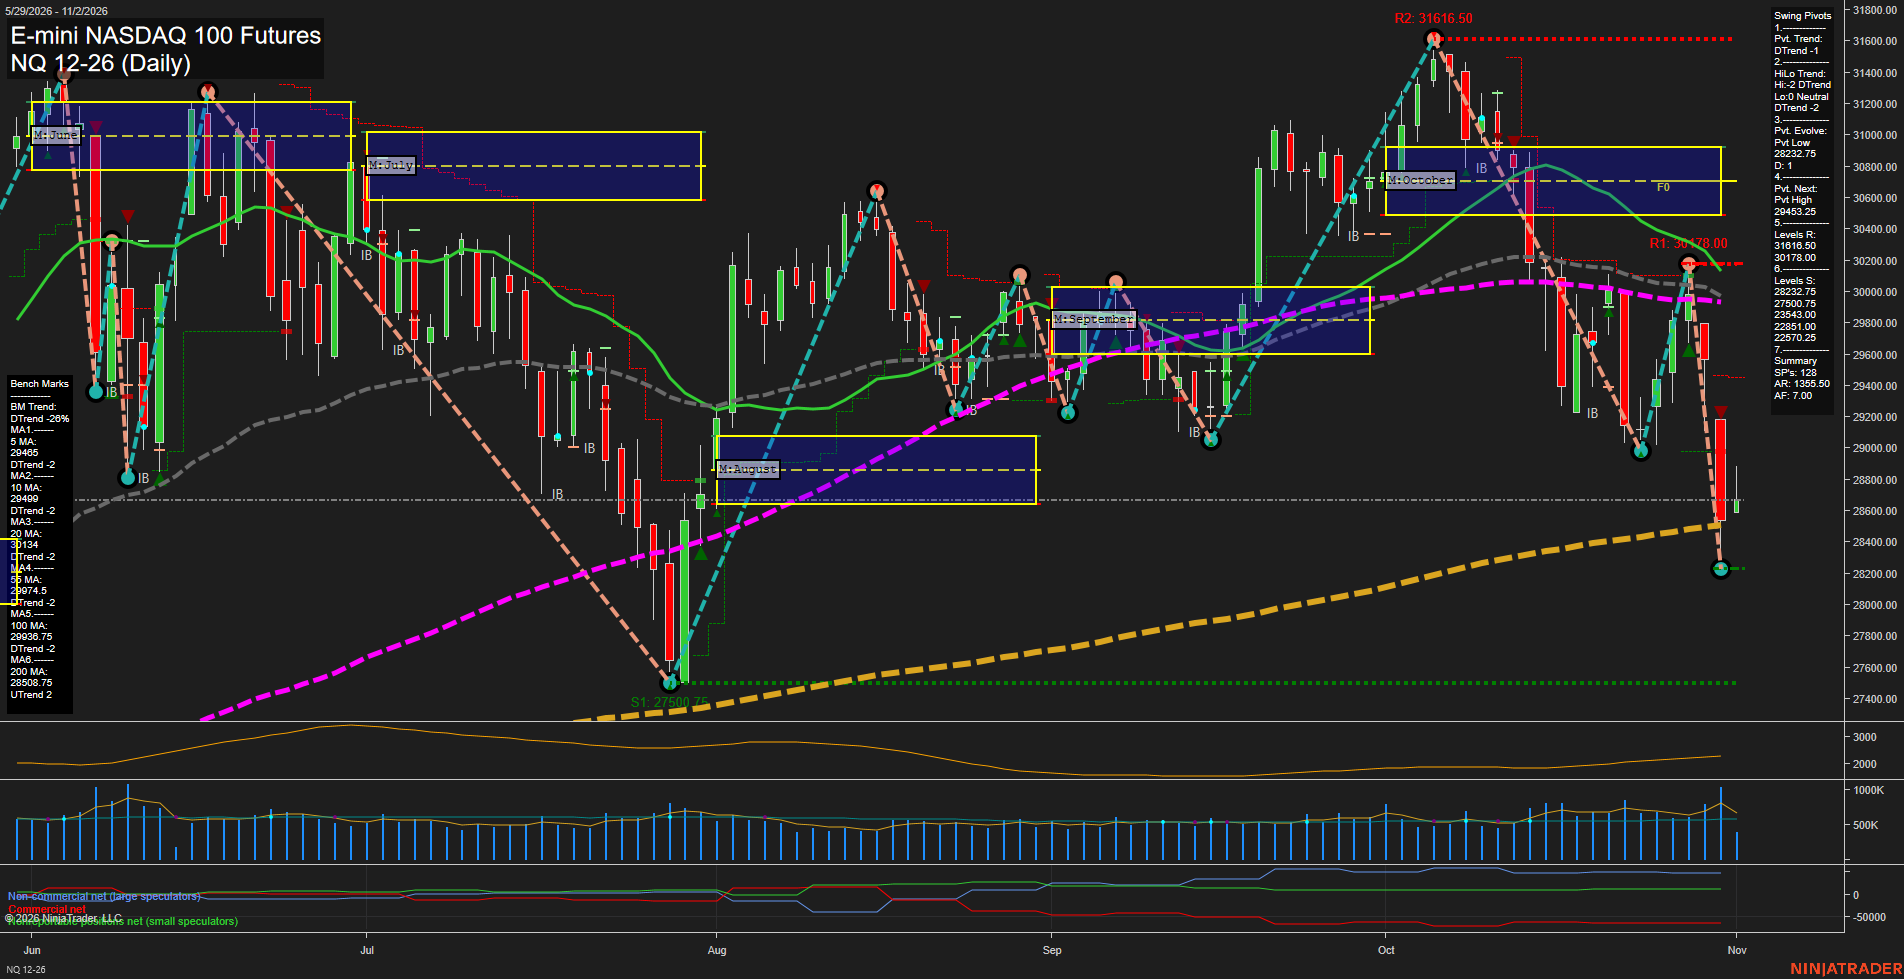
Overall Rating
- Short-Term: Bearish
- Intermediate-Term: Bearish
- Long-Term: Bullish.
Key Insights Summary
Price action has shifted into a fast, large-range downswing, with the active short-term pivot trend and intermediate HiLo structure both in DTrend. The decline has pushed price beneath the 5, 10, 20, 55, and 100-day benchmarks, confirming broad downside alignment across the short and intermediate horizons. The 28220.75 pivot low and nearby 28232.75 support define the current downswing floor, while 29463.25 is the reversal threshold for a new short-term pivot high. The 200-day average remains upward sloping and sits near current price, preserving a constructive longer-term backdrop despite the sharp countertrend liquidation from the October high.
View charts on: AlphaWebTrader HTF Charts
USO Daily View
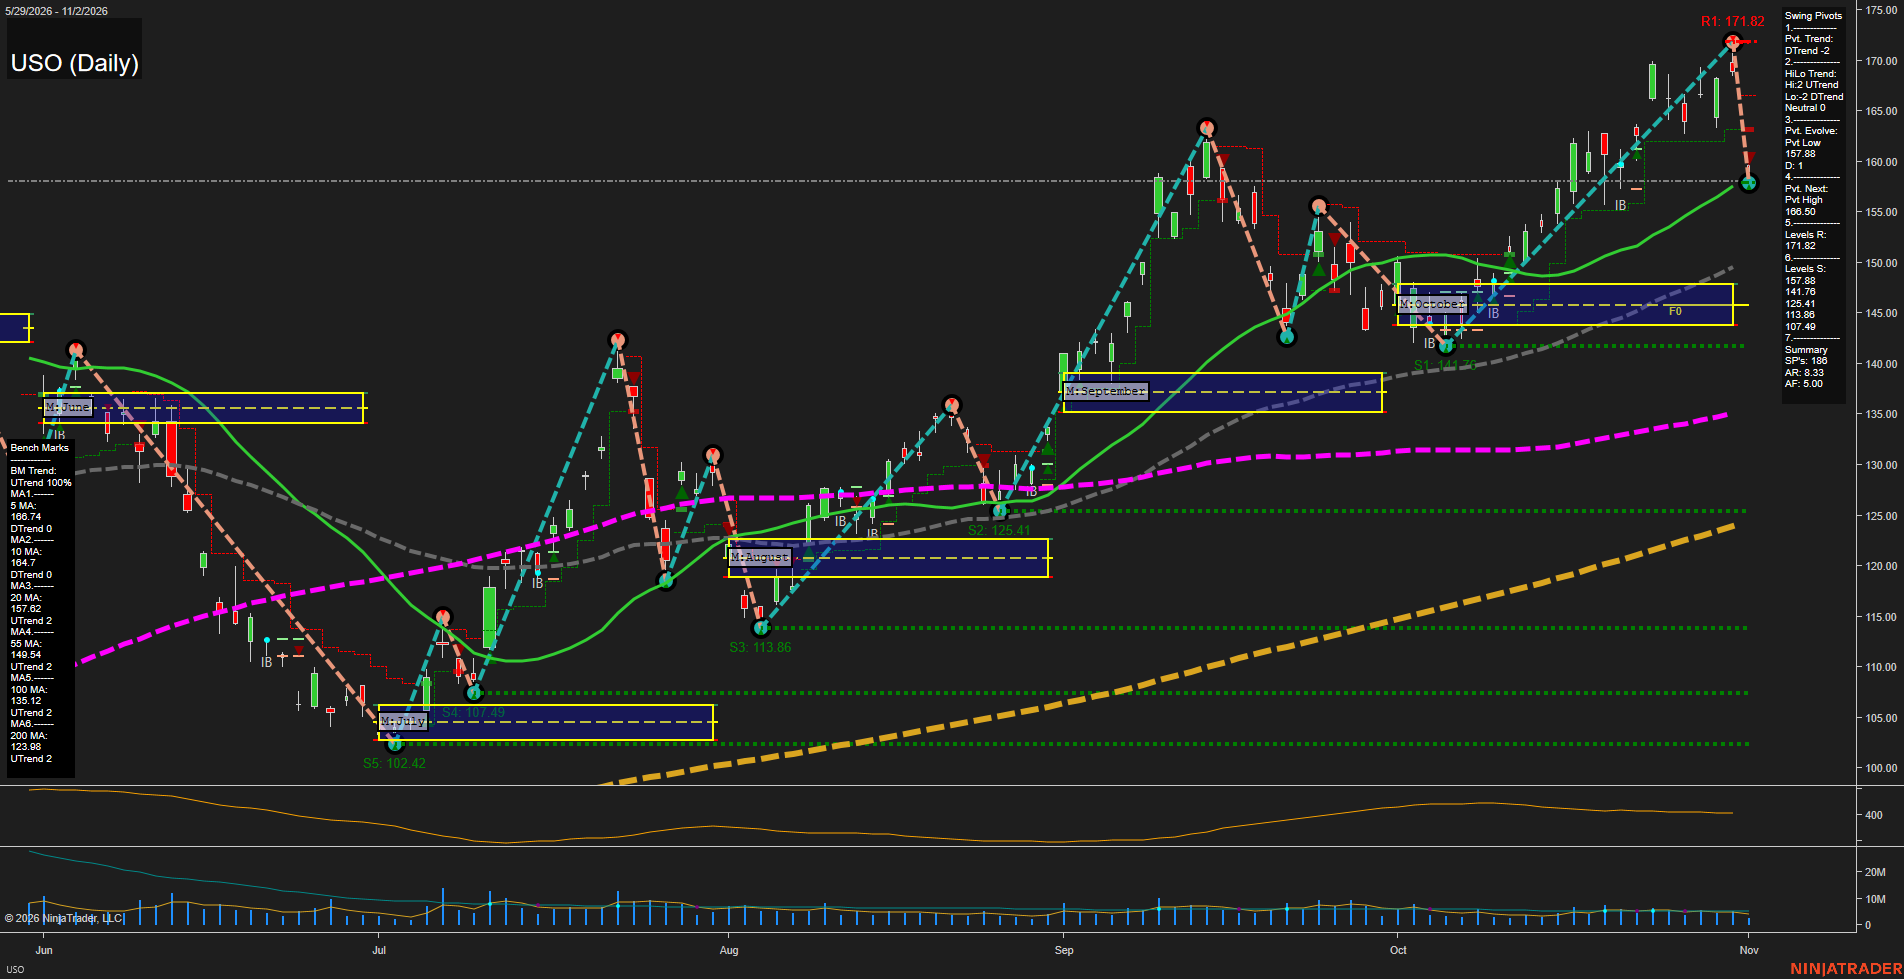
Overall Rating
- Short-Term: Bearish
- Intermediate-Term: Bullish
- Long-Term: Bullish.
Key Insights Summary
USO remains within a broad daily uptrend, supported by rising 20-, 55-, 100-, and 200-day benchmarks and an intermediate pivot structure that remains UTrend. The latest large downside bar reversed sharply from the 171.82 swing-high resistance area and shifted the short-term pivot condition to DTrend, with price now below the declining 5- and 10-day averages. The 157.38 pivot low and rising 20-day average form the immediate technical balance area, while 160.59 marks the next pivot reversal threshold. The November monthly grid remains below current price, preserving a bullish intermediate-term location despite the near-term pullback and elevated daily volatility.
View charts on: AlphaWebTrader HTF Charts
CL Daily View
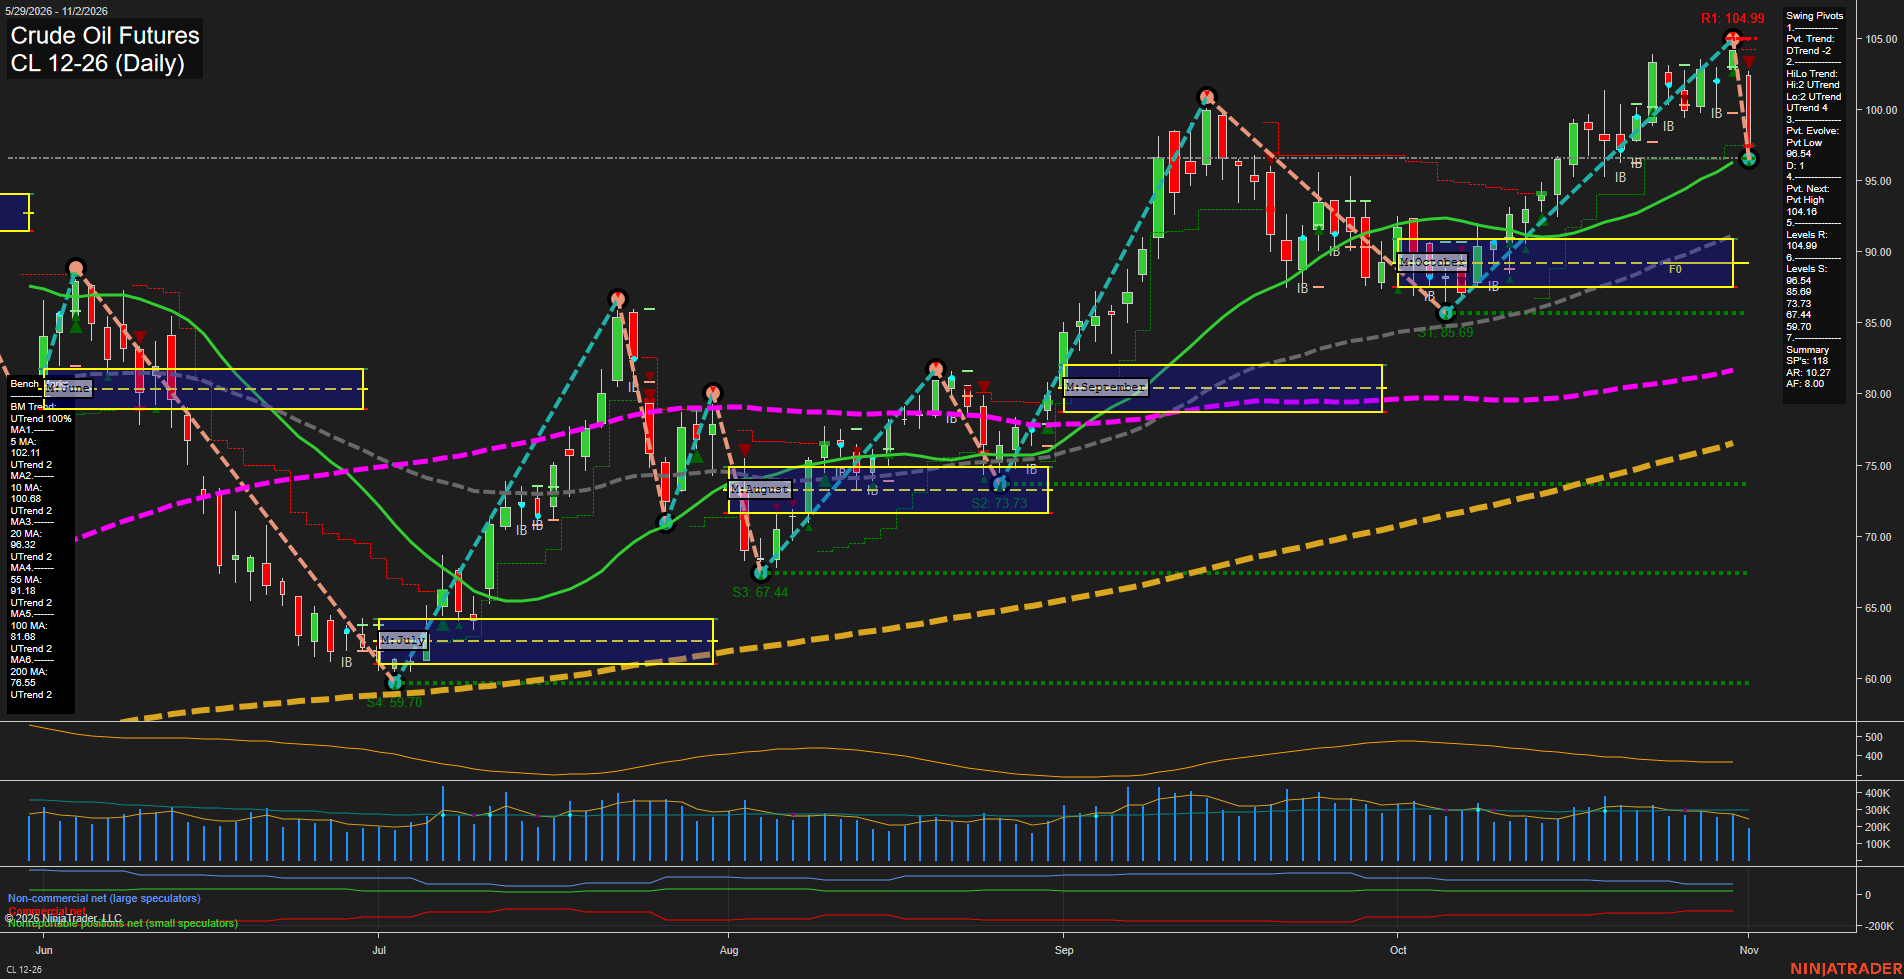
Overall Rating
- Short-Term: Bearish
- Intermediate-Term: Neutral
- Long-Term: Bullish.
Key Insights Summary
Price action has shifted sharply lower from the 104.99 resistance area, producing a large-range decline and a short-term DTrend pivot structure. The decline has pushed price beneath the 5, 10, and 20-day benchmarks and below the weekly and monthly Fib-grid bias levels, confirming fast bearish swing momentum. The broader structure remains constructive because the HiLo pivot trend is up and price remains above the rising 55, 100, and 200-day averages. The 96.54 pivot low is the immediate structural support, while
View charts on: AlphaWebTrader HTF Charts
GLD Daily View
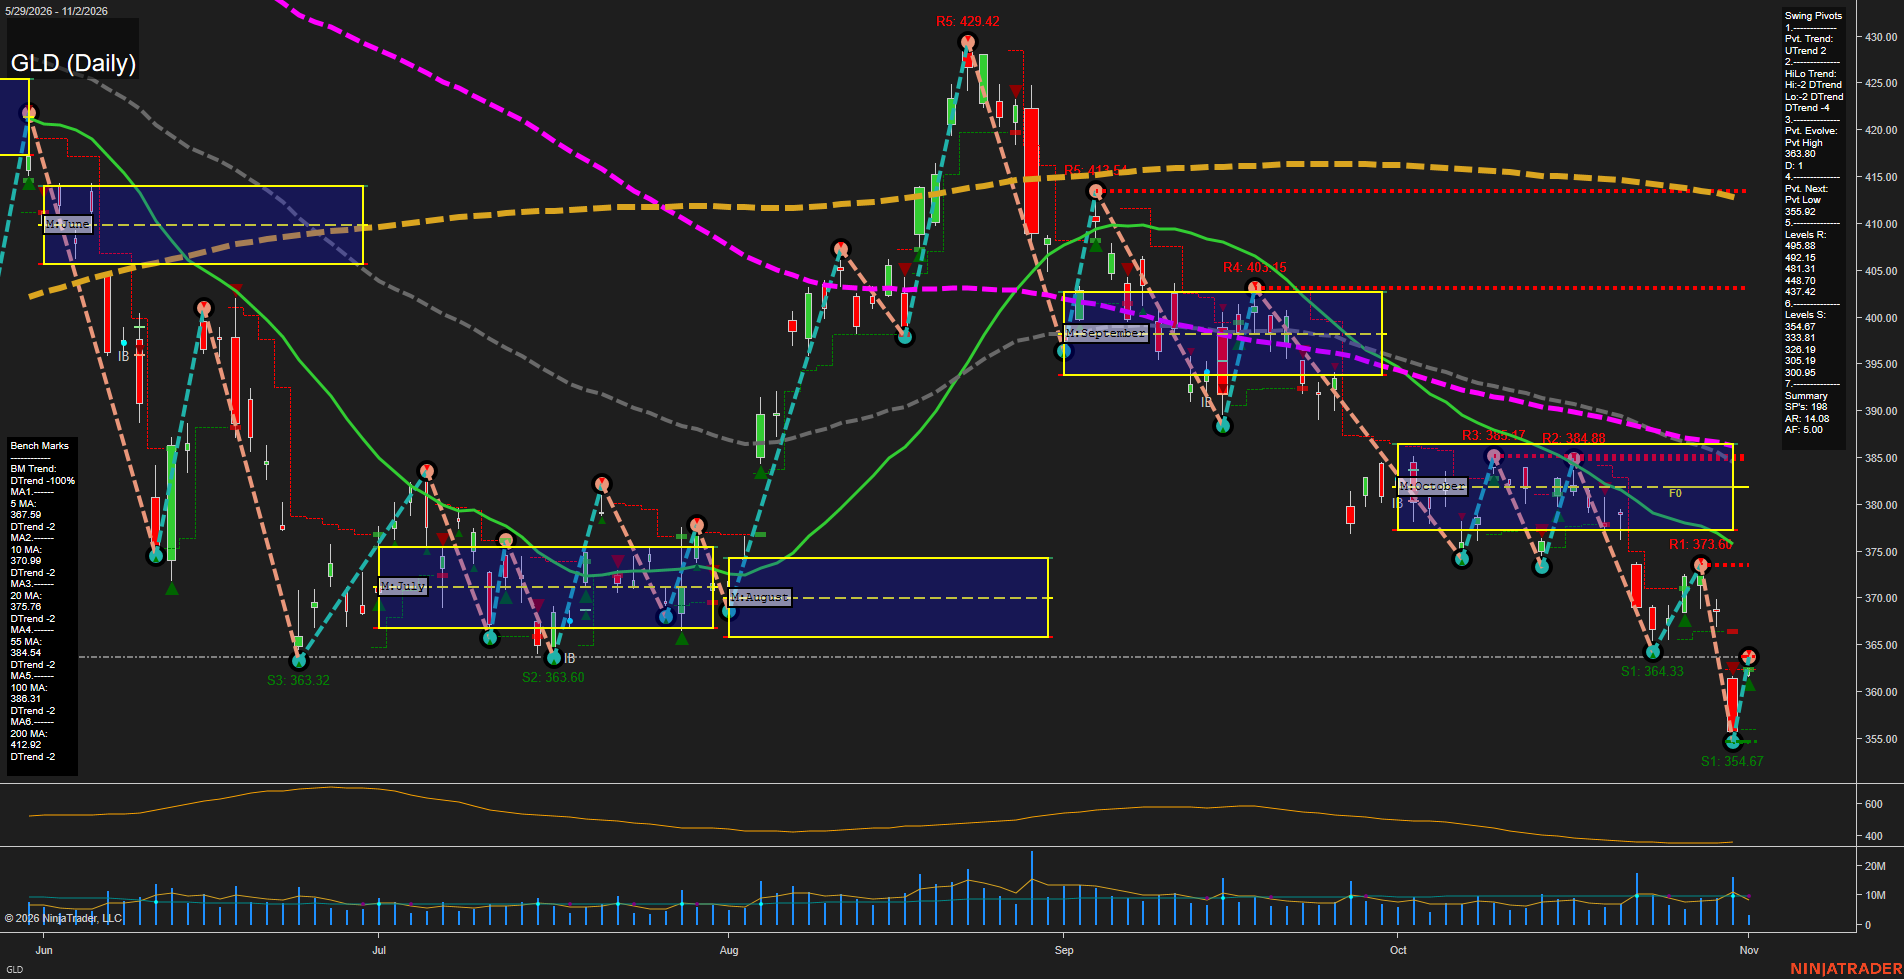
Overall Rating
- Short-Term: Bearish
- Intermediate-Term: Bearish
- Long-Term: Bearish.
Key Insights Summary
GLD reflects a futures-style bearish trend structure: price is below every tracked benchmark, with the 5/10-day averages declining and the intermediate and long-term moving-average stack materially overhead. The short-term pivot remains UTrend following the rebound from 354.67, but the broader HiLo DTrend and the latest rejection beneath the 373.66 pivot resistance characterize that rebound as a countertrend bounce within a larger selloff. Price is compressing near 364.67 support after a fast decline; a break below this area would maintain the lower-high/lower-low sequence, while the nearest meaningful overhead pivot level is 373.66, followed by the October grid and 384.88 area. Volatility remains elevated relative to the recent consolidation, consistent with an active directional futures market rather than a stable basing pattern.
View charts on: AlphaWebTrader HTF Charts
GC Daily View
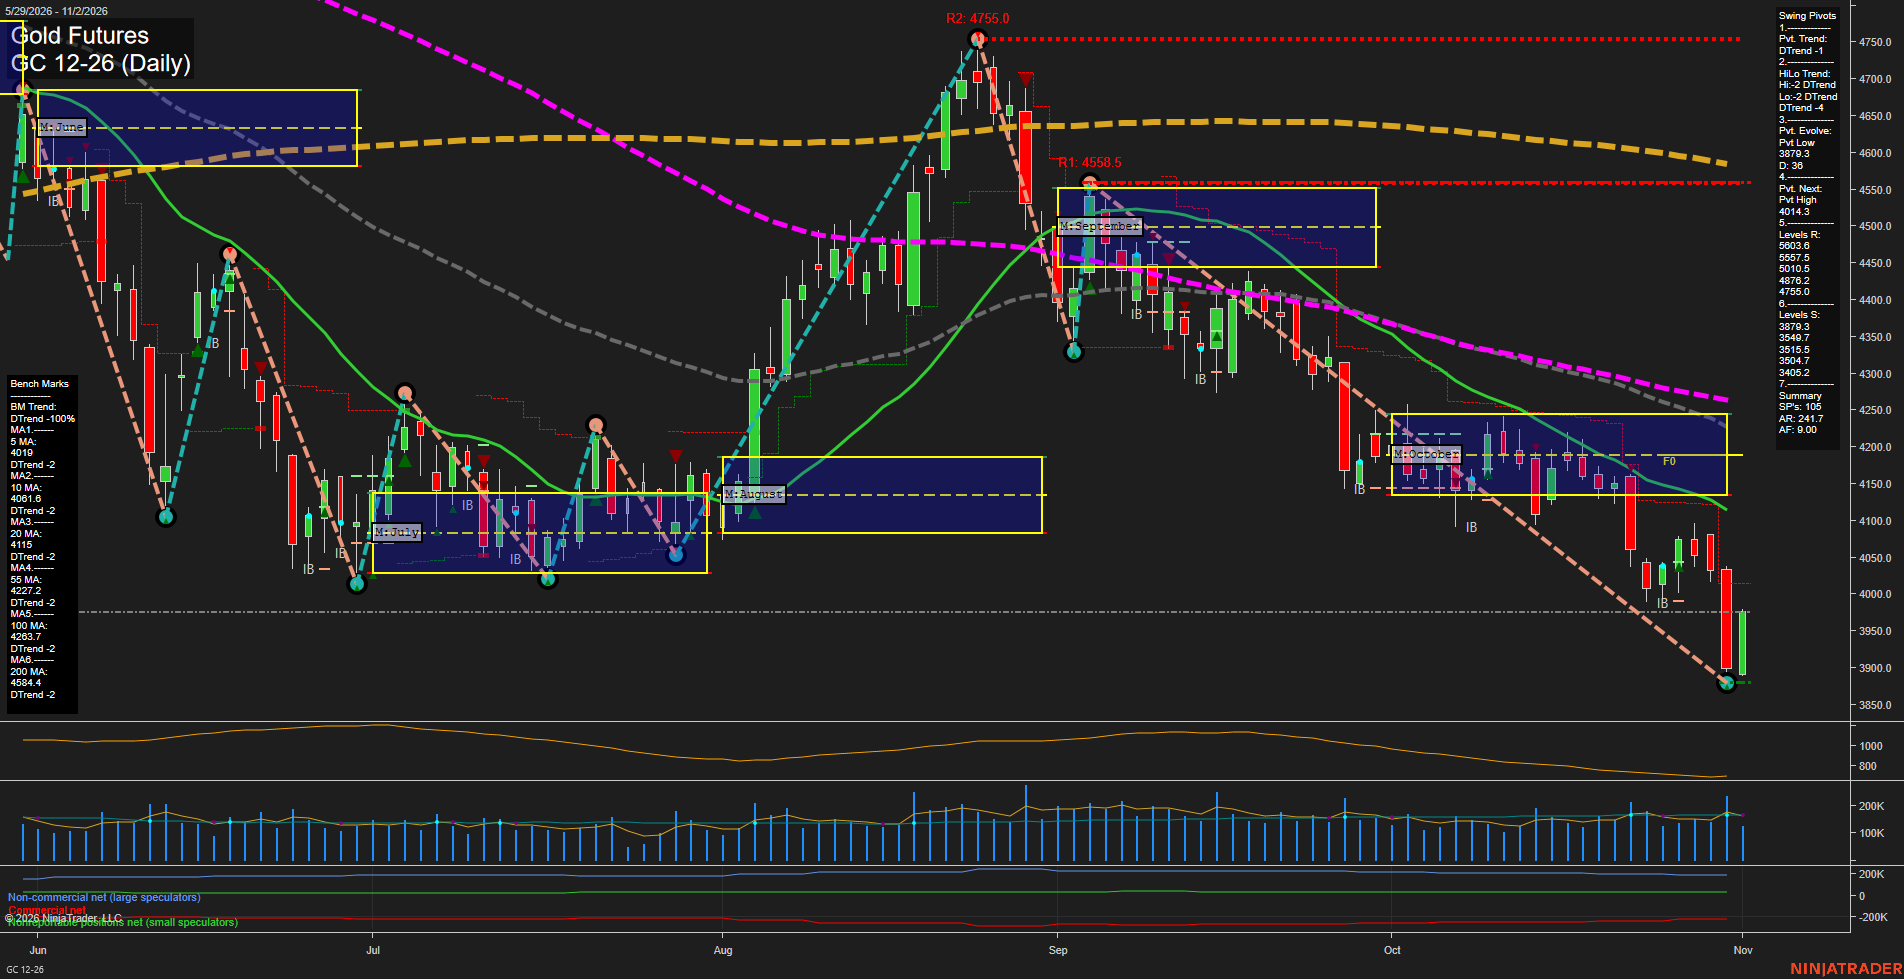
Overall Rating
- Short-Term: Bearish
- Intermediate-Term: Bearish
- Long-Term: Bearish.
Key Insights Summary
GC has extended its decline from the late-August peak, producing lower highs and lower lows while trading beneath every daily benchmark. The latest rebound from the 3879.3 pivot low is a sharp counter-trend bounce, but price remains below the 5-day and 10-day averages and the next pivot threshold at 4014.3. Weekly and monthly Fib-grid readings remain above their F0% levels, indicating an oversold recovery phase within the broader daily downtrend. Elevated range expansion and large recent bars reflect a volatile, fast-momentum environment, with 4014.3 and the clustered 4019.0-4061.6 short-term averages defining the nearest overhead technical zone.
View charts on: AlphaWebTrader HTF Charts
ZB Daily View
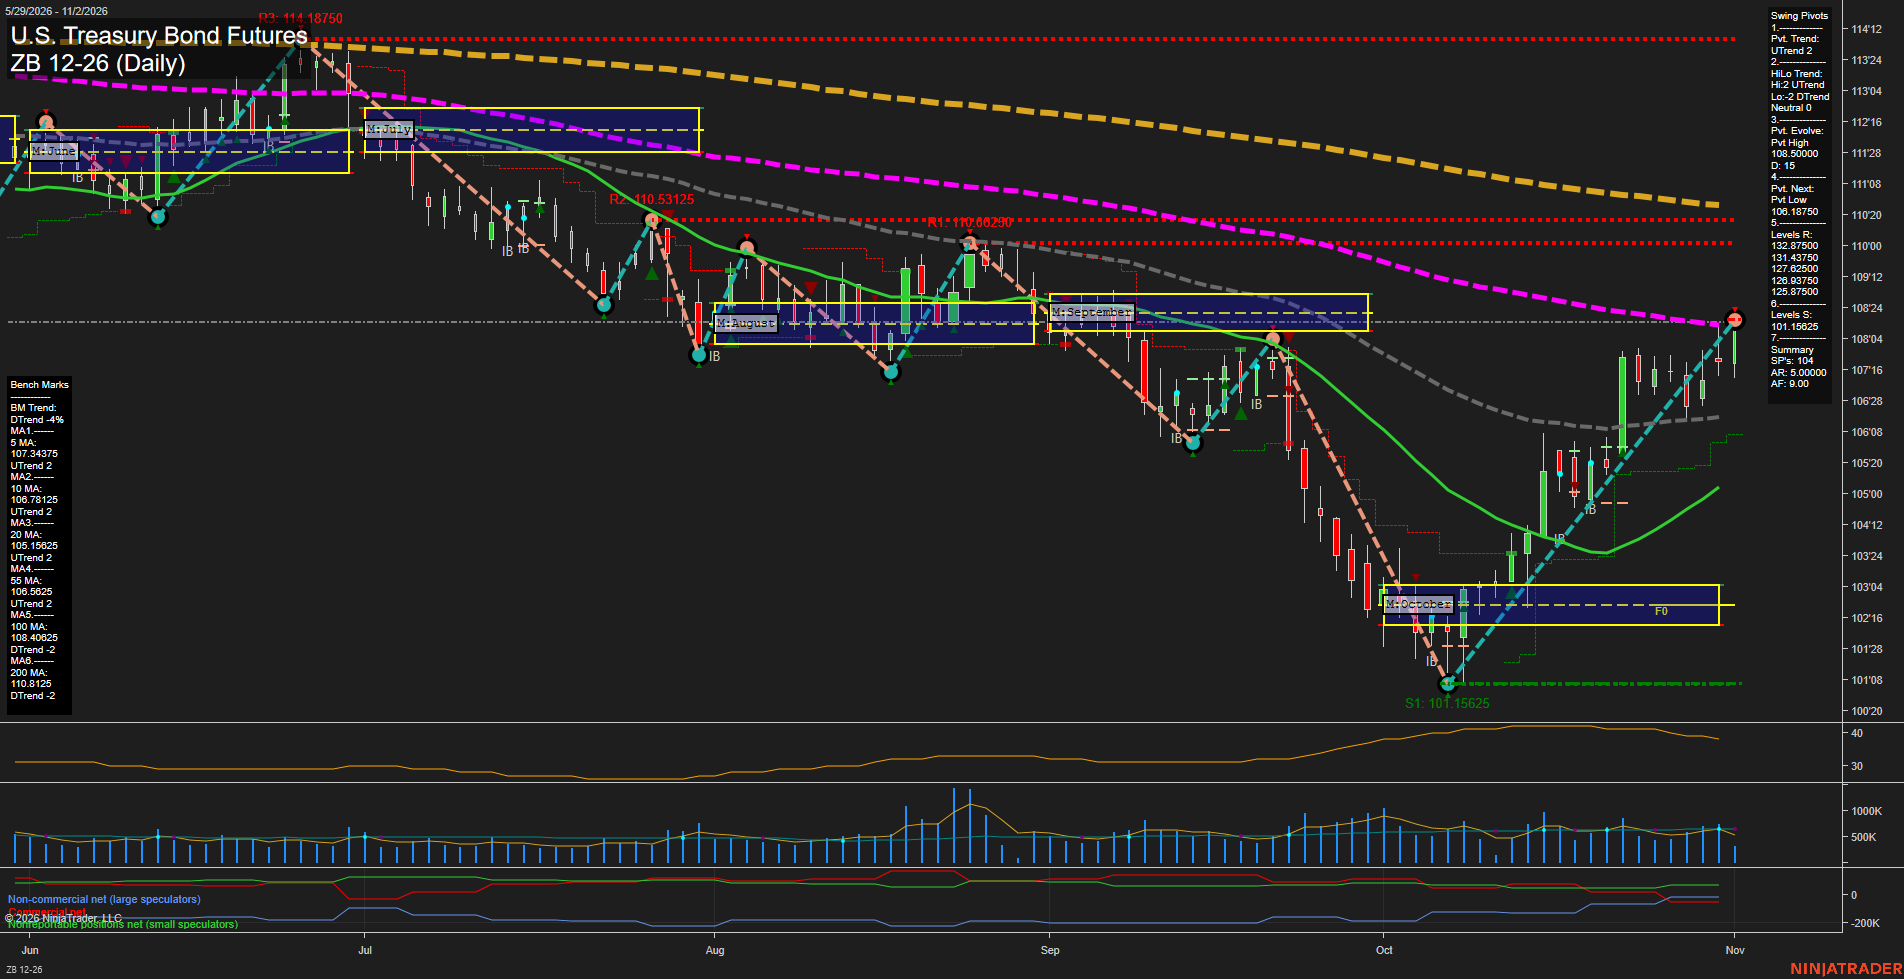
Overall Rating
- Short-Term: Bullish
- Intermediate-Term: Bullish
- Long-Term: Bearish.
Key Insights Summary
The daily structure reflects a strong recovery leg from the October low, with higher lows, an active UTrend pivot condition, and price holding above the rising 5, 10, 20, and 55-day benchmarks. The advance has reached the evolving 108.50000 pivot-high area and remains beneath the declining 100-day benchmark, leaving the broader yearly structure in a downtrend. Weekly and monthly Fib-grid positioning are positive, while the long-term moving-average alignment and yearly grid describe the current rally as an intermediate countertrend recovery within a still-bearish major trend.
View charts on: AlphaWebTrader HTF Charts
Sentiment Summary: Coverage was mostly neutral (46%), with negative sentiment (28%) narrowly exceeding positive (26%), as last week’s technology earnings intensified scrutiny of AI capital spending, negative free cash flow and debt financing following the October 30 selloff. November 2 morning futures rebounded as oil fell on reported U.S.–Iran diplomacy, while strong cloud growth, Amazon’s upgrade-led rebound and larger earnings surprises outside technology counterbalanced continued semiconductor weakness. October’s Dow gain versus Nasdaq-100 decline underscored sector divergence rather than uniform market weakness.
Conclusion: Apple and Palantir earnings scheduled after the November 2 close and November 3 midterm elections remain immediate event risks for index futures.