Ahead of Thursday's 8:30 ET jobless claims and Microchip Technology earnings after close, Dow futures rise while Nasdaq futures weaken amid chip pressure.
Fundamentals: Thursday brings U.S. jobless claims at 8:30 ET and Microchip Technology earnings after the close, with index futures mixed following the midterm rally. Dow futures rose about 0.61%, S&P 500 futures were broadly steady and Nasdaq futures fell amid chip weakness and scrutiny of AI spending. Tomorrow, Friday, brings payrolls, wages and unemployment at 8:30 ET, followed by preliminary consumer sentiment and inflation expectations at 10:00 ET.
Technicals: Ahead of the open, S&P 500 and Dow futures show sharp recoveries within broader bullish trends, while Nasdaq futures remain in a volatile downswing near key support at 27,500.75–27,615.75. Small-cap futures are testing resistance after a V-shaped rebound, though their medium structure remains mixed. German DAX futures retain broad bullish alignment as they press the 26,765–26,847 resistance zone.
Pre-Market Trading 360° view Market Radar of: holidays, earnings, eco-news, market-news summary, news sentiment, prior session major ETFs, MAG7, Higher Time Frame Analysis Indices Futures Summary, and E-mini S&P500, Nasdaq 100, NYMEX Crude, Gold Futures Daily Chart analysis.
As of: November 5, 2026 07:16 CT
Earnings Radar
Monitoring for earnings releases by the Magnificent 7, AI-tech-related firms, and major financial institutions.
| Date/Day | Impact | Company / Symbol | Time | EPS | Revenue | ||||
|---|---|---|---|---|---|---|---|---|---|
| 2026-11-05 – Thursday | Medium | Microchip Technology (MCHP) | After close |
|
|
Conclusion: MCHP’s semiconductor earnings release is scheduled for today, November 5, after the market close and remains ahead as of publication; no actual results are provided. The report is a semiconductor-sector event relevant to index futures context; market momentum and volume can slow ahead of major semiconductor earnings releases.
For full details visit: Yahoo Earnings Calendar
EcoNews Radar U.S. Events
| Date | Impact | Event, Prev, Forecast, Actual | Info |
|---|---|---|---|
| 2026-11-05 Thursday 08:30 | Medium | Unemployment Claims Prev: 194K Forecast: 197K Actual: — | Counts new applications for jobless benefits, offering a timely gauge of layoffs that traders monitor for labor-market shifts and monetary-policy implications. |
| 2026-11-06 Friday 08:30 | High | Average Hourly Earnings m/m Prev: 0.1% Forecast: 0.3% Actual: — | Measures monthly changes in worker pay, helping traders assess wage pressures, household purchasing power and the outlook for interest rates. |
| 2026-11-06 Friday 08:30 | High | Non-Farm Employment Change Prev: 29K Forecast: 65K Actual: — | Measures the monthly change in payroll jobs outside agriculture, providing a key signal of economic momentum relevant to corporate earnings and interest-rate expectations. |
| 2026-11-06 Friday 08:30 | High | Unemployment Rate Prev: 4.2% Forecast: 4.2% Actual: — | Measures the share of the labor force without work and actively seeking employment, helping traders assess labor-market slack and the monetary-policy outlook. |
| 2026-11-06 Friday 10:00 | Medium | Prelim UoM Consumer Sentiment Prev: 46.3 Forecast: 48.1 Actual: — | Provides an early survey-based reading of household confidence in personal finances and economic conditions, which traders monitor for clues about consumer spending. |
| 2026-11-06 Friday 10:00 | Medium | Prelim UoM Inflation Expectations Prev: 4.7% Forecast: — Actual: — | Tracks households’ expected inflation over the next year, helping traders assess perceived price pressures and potential implications for monetary policy and bond yields. |
Summary: The calendar centers on US labor conditions, household confidence and inflation expectations.
Conclusion: The main release cluster arrives Friday morning.
NYSE Session Open Gap Radar
Session gaps compare the predicted opening price with the prior session’s close to predict the upcoming session’s opening gap pattern.
| Instrument | Gap | Prior Close | Predicted Open | Gap % |
|---|---|---|---|---|
| USO | ▼ IGU | 145.41 | 147.44 | ▲ +1.40% |
| GLD | ▲ OGU | 372.49 | 377.12 | ▲ +1.24% |
| DIA | ▲ OGU | 533.11 | 536.35 | ▲ +0.61% |
| IJH | ▼ IGU | 74.59 | 74.65 | ▲ +0.08% |
| IWM | ▼ IGU | 284.02 | 284.19 | ▲ +0.06% |
| SPY | ▼ IGU | 766.81 | 767.12 | ▲ +0.04% |
| QQQ | ▼ OGD | 691.95 | 685.73 | ▼ -0.90% |
| TLT | ▼ OGD | 81.76 | 80.49 | ▼ -1.55% |
Before the session opens, the table shows the predicted opening price and gap. Once the session opens, it uses the recorded opening price.
Glossary: IGU — Inside Gap Up: above the prior close, within the prior session’s range. IGD — Inside Gap Down: below the prior close, within that range. OGU — Outside Gap Up: above the prior session’s high. OGD — Outside Gap Down: below the prior session’s low.
As of: 2026-11-05 07:16 CT. Predicted gaps are best estimates as of publication and may change before the regular-session open, particularly when the session is still some time away.
Market News Summary:
U.S. index futures are mixed after the midterm rally, with technology weakness contrasting with Dow gains as investors assess election implications and AI infrastructure spending.
Primary Drivers & Risks:
- Primary Driver: Post-election repricing and technology sector weakness
- Primary Risk: AI spending scrutiny and prolonged Iran conflict
Tone:
Mixed, with cautious technology sentiment and persistent geopolitical concerns.
Data, Market and System
Geopolitical:
- BNY strategist Alicia Levine warned that markets have not priced in a prolonged war in Iran.
Oil / Energy:
- Bank of America strategists highlighted a strong relationship between oil prices and interest rates in the United States, United Kingdom, and Germany.
Gold / Metals:
- Gold held solid gains as the Bank of England raised interest rates in response to persistent inflation.
Fed / Financials:
- A report noted a recent Federal Reserve rate change without specifying its direction or size and discussed the sensitivity of Treasury ETF income to interest rates.
- ETFs using derivatives tied to private-company perpetual futures are attracting attention alongside regulatory developments and concerns over instrument complexity.
Macro / Other:
- Novonesis attributed weaker dietary supplement sales to subdued U.S. consumer sentiment, offsetting broader growth.
Conclusion:
The principal index-market drivers are post-election repricing and pressure on technology shares from AI spending and monetization concerns. Dow strength contrasts with Nasdaq weakness, leaving S&P 500 futures broadly steady.
Secondary risks include an extended Iran conflict and the oil-price relationship with interest rates. Apple’s gains provide a counterweight to broader technology pressure, while persistent inflation remains evident in the Bank of England’s rate increase.
Market News Sentiment
Sentiment Bias shows the balance of positive and negative news coverage sampled from 2026-11-04 08:16 to 2026-11-05 07:33 ET, covering stocks, energy and gold.
▼ Market news
- Bias
- ▼ -0.51%
- Articles
- 196
- Positive
- ▲ 29.59%
- Neutral
- — 40.31%
- Negative
- ▼ 30.10%
▲ GLD / Gold
- Bias
- ▲ +40.00%
- Articles
- 15
- Positive
- ▲ 46.67%
- Neutral
- — 46.67%
- Negative
- ▼ 6.67%
Sentiment Summary: Gold coverage was 47% positive and 47% neutral, with 7% negative, reflecting a rebound above $4,000 after the October 30 selloff. November 4 reports linked gold gains and a Wall Street rally to Democratic midterm victories, a weaker dollar, lower Treasury yields and falling oil; November 5 coverage added U.S.-Iran peace hopes. Persistent inflation, resilient November 4 employment and services readings, and the Bank of England’s November 5 rate increase counterbalanced the recovery by highlighting continued monetary-policy pressure.
Conclusion: Friday, November 6 U.S. payrolls remain the next reported catalyst for rates-sensitive cross-market trading.
▼ USO / Oil
- Bias
- ▼ -9.68%
- Articles
- 31
- Positive
- ▲ 29.03%
- Neutral
- — 32.26%
- Negative
- ▼ 38.71%
Sentiment Summary: Oil coverage leaned negative (39% negative versus 29% positive), as November 4 election results fueled Iran de-escalation hopes and recovering Middle East exports reinforced surplus concerns; crude extended losses into November 5. Lower oil and yields accompanied November 4’s broad equity rally, with the Dow gaining 3.0% and airlines advancing, although early November 5 U.S. stock futures were mixed. The main counterweight was November 4’s EIA release: crude inventories fell for a fifth consecutive week, while distillate stocks reached their lowest level in over two decades.
Conclusion: The equity relief rally coexisted with unresolved Iran escalation risk and tight refined-product supplies.
Glossary: Sentiment Bias = (positive articles − negative articles) ÷ total articles × 100. It ranges from −100% negative to +100% positive. A reading near zero indicates little directional bias. Neutral articles reduce the score’s strength. ▲ positive; ▼ negative; — balanced. These readings describe news coverage, not market-price direction.
Market Technical Analysis
Analysis of VIX volatility, prior-session major ETFs and mega-cap tech stocks, and real-time futures snapshots and higher-time-frame analysis.
VIX — Market Fear Gauge Daily
| Level | Open | High | MaxVix | Low | MinVix | DNC% | DOC% | VR | MaxVR | MinVR |
|---|---|---|---|---|---|---|---|---|---|---|
| 16.58 | 17.77 | 18.30 | 23.93 | 16.58 | 14.98 | -20.40% | -6.70% | 12.35 | 24.11 | -0.20 |
VIX fell 6.70% from the session's opening level. VIX fell 20.40% versus the previous session close. Expected volatility eased from the period open. VIX is 17.9% up the recent 15-session range (14.98–23.93), in the 10–20% band.
VR: ATN Volatility Ratio (VR): 12.35 – Stocks rose while expected volatility eased. VR is around the middle of its preceding 15-session VR range (-0.20 to 24.11), in the 50–60% band. VR rose 7.30 points from the previous session, a large shift relative to that range.
Range lookback: preceding 15 completed sessions.
Major ETFs and Mega Cap Tech Stocks
- Dow futures rose around 0.61%, S&P 500 futures were little changed, and Nasdaq futures declined amid chip weakness.
- Investors assessed the Democratic Party’s sweeping midterm victory and its implications for technology and AI infrastructure spending.
- Technology shares faced pressure from rising capital expenditures and slower monetization despite widespread positive third-quarter earnings surprises.
- Nvidia, Microsoft, Apple, Amazon, Alphabet, and Meta represented 30.8% of the S&P 500 in early November, concentrating index exposure in major technology companies.
- Apple shares rose following its fiscal 2026 annual report, while commentary linked resistance to data center projects with potential relief in memory costs.
- Alphabet commentary highlighted slowing search growth, rising capital expenditures, and uncertainty over AI monetization.
- Amazon and Uber announced a U.S. Prime delivery partnership offering zero delivery fees on eligible restaurant orders of at least $25.
- Nvidia’s third-quarter results are scheduled for November 17 after the market close, with company guidance indicating roughly 106% annual revenue growth.
ETF, Mag7, and Cross-Market ETF prior day Insights
Overall Tone
Most assets gained from the open in the completed November 4, 2026 daily session, supporting a broadly constructive but uneven risk tone versus the prior close.
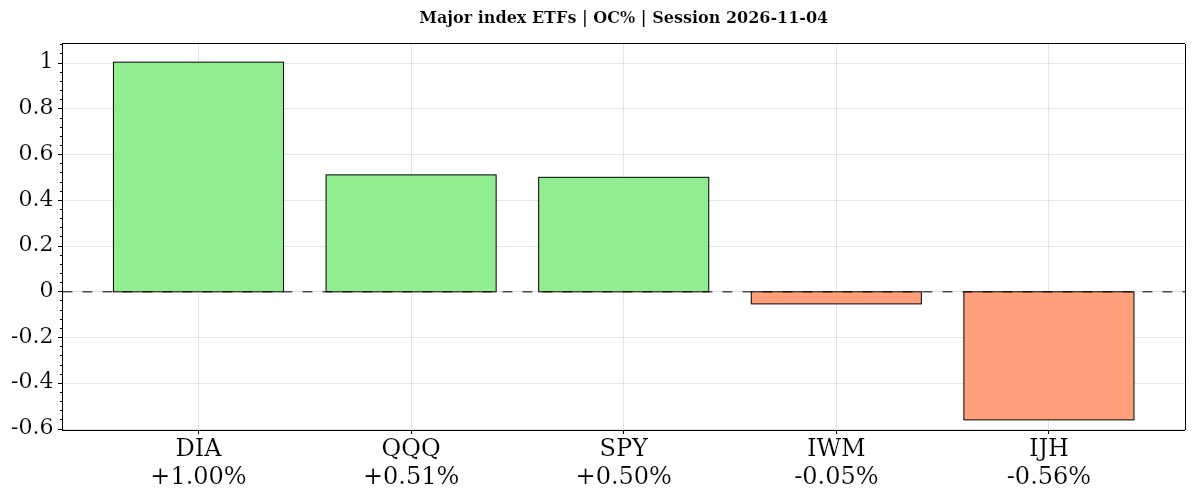
| Instrument | Bias | Date | DNC% | DOC% | O | H | L | C | VWAP | Vol |
|---|---|---|---|---|---|---|---|---|---|---|
| ▲ DIA | ▲ ▲ ▲ | 2026-11-04 | ▲ +3.10% | ▲ +1.00% | 527.81 | 534.28 | 527.02 | 533.11 | ▲ 530.73 | 6,456,248 |
| ▲ QQQ | ▲ ▲ ▼ | 2026-11-04 | ▲ +0.97% | ▲ +0.51% | 688.43 | 701.45 | 687.87 | 691.95 | ▼ 694.31 | 61,970,272 |
| ▲ SPY | ▲ ▲ ▼ | 2026-11-04 | ▲ +1.65% | ▲ +0.50% | 762.99 | 775.64 | 762.64 | 766.81 | ▼ 766.84 | 60,945,733 |
| ▼ IWM | ▲ ▼ ▲ | 2026-11-04 | ▲ +1.51% | ▼ -0.05% | 284.17 | 286.17 | 281.31 | 284.02 | ▲ 283.78 | 34,658,989 |
| ▼ IJH | ▲ ▼ ▲ | 2026-11-04 | ▲ +0.62% | ▼ -0.56% | 75.01 | 75.18 | 73.81 | 74.59 | ▲ 74.41 | 7,425,598 |
| AVG/Sum | — | — | +1.57% | +0.28% | — | — | — | — | — | 171,456,840 |
Index ETFs
Positive confluence: average DOC% +0.28% from the open and DNC% +1.57% versus the prior close. Three of five index ETFs advanced from the open, led by DIA; IJH lagged, while IWM was nearly flat. All five gained versus the prior close, again led by DIA, whose moving-average uptrends were aligned.
DIA · D:2026-11-04 NC% ▲ +3.10% OC% ▲ +1.00%
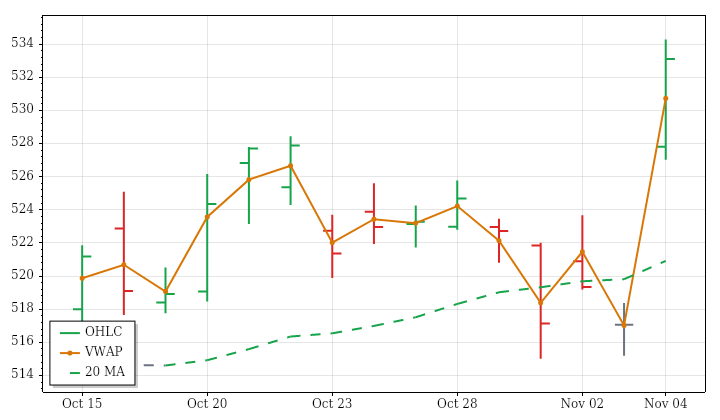
DIA – Dow Jones Technicals Summary
DIA's completed daily session on November 4 closed at 533.11, up 3.10% from the prior close and 1.00% from the open. An unfilled upward opening gap was followed by further gains, a higher high and higher low, and a finish above the previous day's high. The close also exceeded session VWAP, aligning the intraday finish with the positive daily result.
Near-, intermediate- and far-term moving averages were all rising beneath price. That alignment contrasts with the nearly flat, slightly declining and highly choppy price trend over the prior 15 sessions. The latest range reached about 1.6 times average and volume nearly twice average, reversing the lookback tendencies toward contracting ranges and decreasing activity. PSAR entered a long state, although a next-session low below 515.01 would trigger a bearish reversal rather than confirm continued strength.
QQQ · D:2026-11-04 NC% ▲ +0.97% OC% ▲ +0.51%
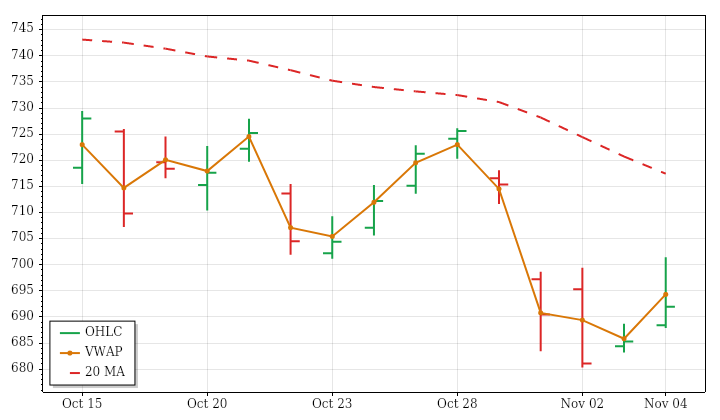
QQQ – Nasdaq 100 Technicals Summary
QQQ's completed November 4 daily session closed at 691.95, up 0.97% from the prior close and 0.51% from the open. The modest upward opening gap remained unfilled. Price formed a higher high and higher low, breached the prior inside-bar high and closed above the preceding day's high. Still, the close below session VWAP showed that the positive daily finish did not extend above the session's volume-weighted price.
The advance ran counter to falling near- and intermediate-term averages, both still above price, and to the declining 15-session price trend. The far-term average remained rising but also above price, leaving a mixed longer horizon. Range and volume exceeded their recent averages despite lookback tendencies toward contraction and decreasing activity. PSAR and the median-based measure stayed bearish. A next-session high above 715.5808 would conditionally trigger a bullish PSAR reversal.
SPY · D:2026-11-04 NC% ▲ +1.65% OC% ▲ +0.50%
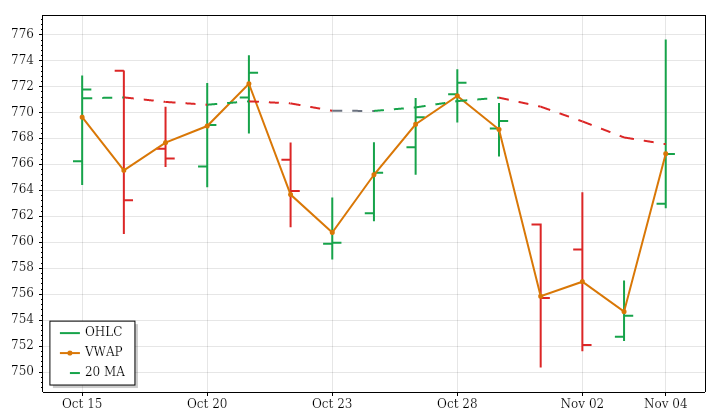
SPY – S&P 500 Technicals Summary
SPY's completed daily session on November 4 gained 1.65% from the prior close to 766.81 and 0.50% from the open. The upward opening gap remained unfilled, and price made a higher high and higher low before closing above the preceding day's high. Although the session breached the prior inside-bar high, the finish was marginally below VWAP, making its volume-weighted positioning essentially flat rather than clearly positive.
Price stood above a falling near-term average but just below a falling intermediate-term average, while the far-term uptrend remained intact. The rally therefore improved price position without resolving the mixed shorter-term structure or the declining 15-session trend. Range was roughly 1.8 times average and volume was elevated, interrupting contracting-range and decreasing-volume tendencies. PSAR entered a long state; a next-session low below 750.36 would conditionally trigger a bearish reversal.
S&P 500 News and Fundamentals
S&P 500 futures fell 102 points early on November 4 following Democratic midterm victories. Goldman Sachs described a hidden bear market within the index: approximately 60% of constituent stocks were in bear-market territory even as the benchmark remained near a record high.
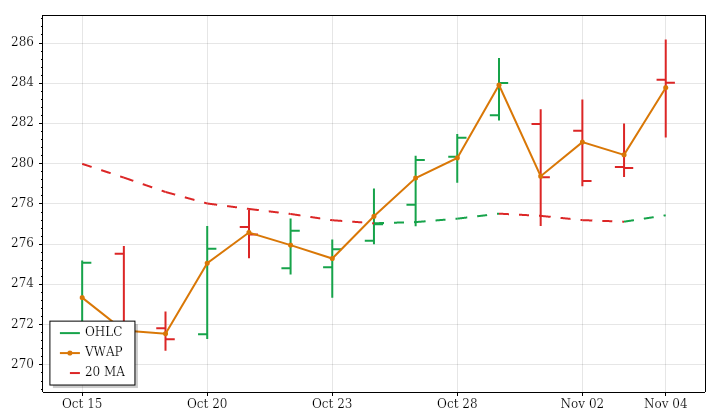
IWM · D:2026-11-04 NC% ▲ +1.51% OC% ▼ -0.05%
IWM – Small Cap Technicals Summary
IWM's completed November 4 daily session closed at 284.02, gaining 1.51% from the prior close but slipping 0.05% from the open. The positive return was therefore attributable to the unfilled upward opening gap rather than intraday appreciation. Price nevertheless recorded a higher high and higher low, breached the prior inside-bar high and closed above the preceding day's high. The finish was also slightly above session VWAP.
The near-term uptrend agreed with the rising but choppy 15-session price trend. Broader alignment was incomplete: price stood above a falling intermediate-term average and just below a rising far-term average. Range and volume were both above average, interrupting lookback tendencies toward contraction and decreasing activity. PSAR and the median-based trend measure remained bullish. A next-session low below 279.34 would trigger a bearish PSAR reversal, not an already confirmed change.
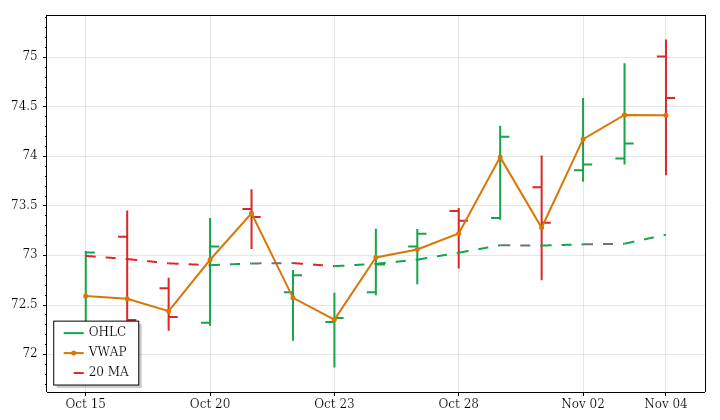
IJH · D:2026-11-04 NC% ▲ +0.62% OC% ▼ -0.56%
IJH – Mid Cap Technicals Summary
IJH's completed daily session on November 4 finished at 74.59, up 0.62% from the prior close but down 0.56% from the open. The initial upward gap was filled, and an outside bar ended inside the preceding day's range. This makes the positive daily return less decisive than it first appears, although the close remained above session VWAP despite the retreat from the opening price.
Near- and far-term averages were rising beneath price, while the intermediate-term average remained falling, leaving that horizon mixed. The 15-session price trend was upward but choppy, consistent with limited directional follow-through. The latest range was roughly 1.6 times average against a contracting-range backdrop; volume was essentially average despite a slight increasing lookback tendency. PSAR and the median-based measure were bullish, but a next-session low below 73.3019 would conditionally trigger a PSAR bearish reversal.
| Instrument | Bias | Date | DNC% | DOC% | O | H | L | C | VWAP | Vol |
|---|---|---|---|---|---|---|---|---|---|---|
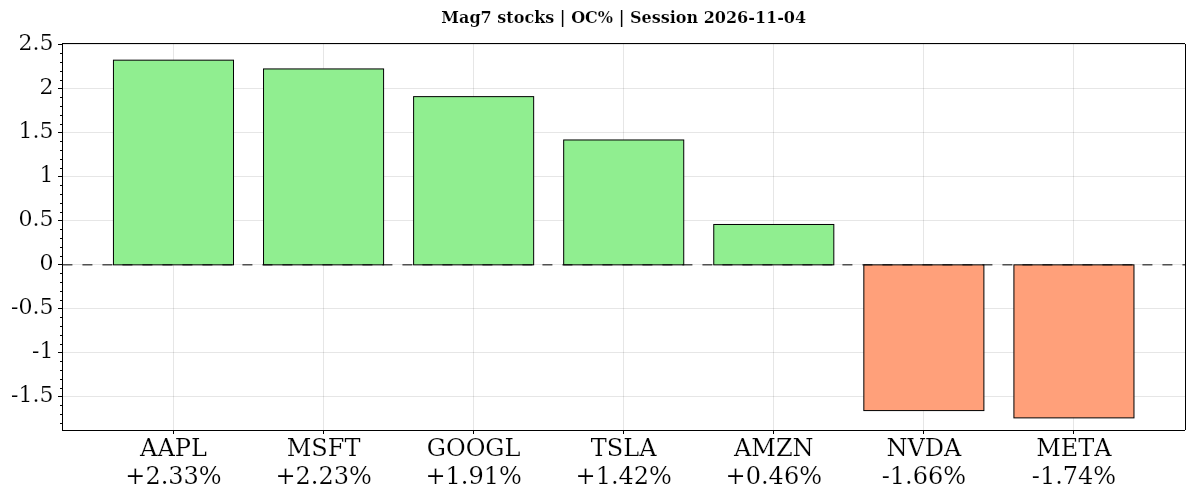
| ▲ AAPL | ▲ ▲ ▼ | 2026-11-04 | ▲ +5.31% | ▲ +2.33% | 341.56 | 354.50 | 340.99 | 349.51 | ▼ 351.06 | 88,983,256 |
| ▲ MSFT | ▲ ▲ ▲ | 2026-11-04 | ▲ +6.68% | ▲ +2.23% | 543.70 | 559.15 | 542.30 | 555.80 | ▲ 554.09 | 50,731,891 |
| ▲ GOOGL | ▲ ▲ ▼ | 2026-11-04 | ▲ +3.18% | ▲ +1.91% | 283.51 | 296.49 | 283.40 | 288.93 | ▼ 290.88 | 51,395,689 |
| ▲ TSLA | ▼ ▲ ▼ | 2026-11-04 | ▼ -3.34% | ▲ +1.42% | 379.80 | 392.04 | 375.50 | 385.19 | ▼ 385.39 | 47,672,706 |
| ▲ AMZN | ▲ ▲ ▼ | 2026-11-04 | ▲ +6.12% | ▲ +0.46% | 264.81 | 271.49 | 263.85 | 266.03 | ▼ 267.83 | 93,049,549 |
| ▼ NVDA | ▼ ▼ ▼ | 2026-11-04 | ▼ -3.17% | ▼ -1.66% | 203.50 | 206.79 | 199.68 | 200.13 | ▼ 202.58 | 148,138,884 |
| ▼ META | ▲ ▼ ▼ | 2026-11-04 | ▲ +1.44% | ▼ -1.74% | 641.15 | 643.09 | 624.50 | 630.00 | ▼ 632.60 | 32,247,627 |
| AVG/Sum | — | — | +2.32% | +0.71% | — | — | — | — | — | 512,219,602 |
Mag7 Stocks
Positive confluence: average DOC% +0.71% from the open and DNC% +2.32% versus the prior close. Five of seven gained from the open, led by AAPL, while META lagged; MSFT led versus the prior close, with TSLA weakest. Only MSFT closed above VWAP, limiting technical alignment.
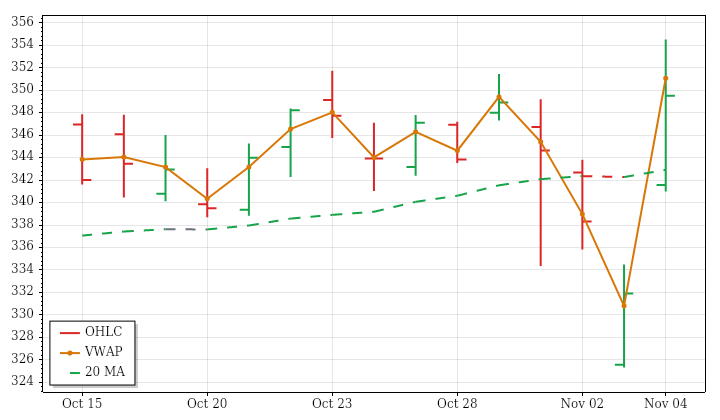
AAPL · D:2026-11-04 NC% ▲ +5.31% OC% ▲ +2.33%
AAPL – Apple Technicals Summary
AAPL's completed daily session on November 4 closed at 349.51, gaining 5.31% from the prior close and 2.33% from the open. The opening gap remained unfilled, and a higher high and higher low culminated in a close above the previous day's high. Nevertheless, the finish below session VWAP shows that the strong daily advance did not carry through above the session's volume-weighted price.
Near-, intermediate- and far-term moving-average uptrends were aligned, contrasting with the slightly declining, choppy price trend across the preceding 15 sessions. The latest range was roughly twice average, with volume around 1.9 times average, extending the lookback pattern of expanding ranges and increasing activity. The PSAR was in a long state, but a next-session low below 325.33 would trigger a bearish reversal; that remains conditional rather than established.
Apple News and Fundamentals
Bloomberg reported on November 4 that Apple is reducing the daily amount engineering teams can spend on AI as part of a cost-control push. Apple also recently posted record revenue and committed to substantial purchases from manufacturing partners, with nearly all commitments due before next fall. Shares reached a record high Wednesday as investors considered whether Democratic election victories could slow data-center construction and ease memory-chip price pressure; that potential benefit remains speculative.
MSFT · D:2026-11-04 NC% ▲ +6.68% OC% ▲ +2.23%
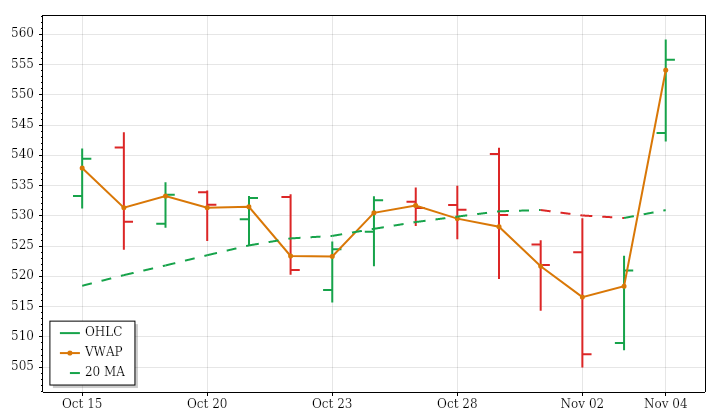
MSFT – Microsoft Technicals Summary
MSFT's completed November 4 daily session rose 6.68% from the prior close to 555.8, with a further 2.23% gain from the open following an unfilled upward gap. A higher high and higher low, a breach of the prior inside-bar high and a close above the preceding day's high accompanied the advance. The finish above session VWAP added intraday alignment, and price ended close to its 52-week high.
Intermediate- and far-term averages were rising beneath price, but the near-term average was still falling, leaving that horizon mixed despite the rally. The prior 15-session price trend also remained downward and choppy. Range was above average and volume exceeded twice average, extending the lookback tendencies of expanding ranges and increasing participation. PSAR entered a long state; a next-session low below 504.96 would conditionally trigger a bearish reversal.
Microsoft News and Fundamentals
Microsoft's fiscal first-quarter 2027 earnings and revenue exceeded estimates, with accelerating Azure growth supported by cloud demand and rising AI adoption. Reported revenue rose 19% year over year to $92.3 billion, Azure grew 48%, and free cash flow remained positive. Separately, Mediaocean announced an integration with Microsoft Advertising to expand Prisma Direct into search advertising.
GOOGL · D:2026-11-04 NC% ▲ +3.18% OC% ▲ +1.91%
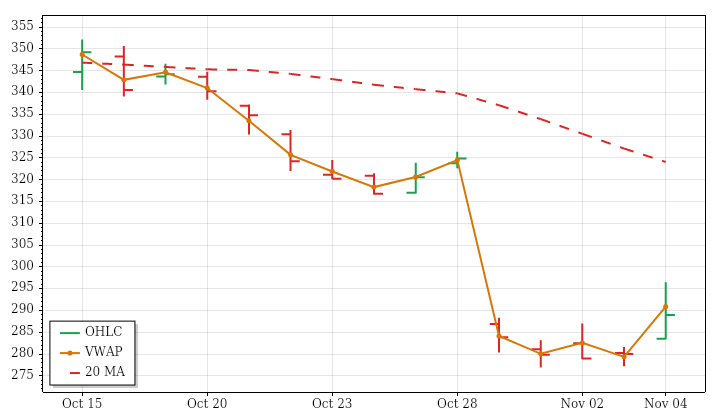
GOOGL – Alphabet Technicals Summary
GOOGL's completed daily session on November 4 closed at 288.93, up 3.18% from the prior close and 1.91% from the open. The upward opening gap remained unfilled, and price established a higher high and higher low before closing above the preceding day's high. However, the finish below session VWAP qualified the rebound: the close did not exceed the session's volume-weighted price despite the positive return.
Near-, intermediate- and far-term averages all remained falling above price, so the daily advance opposed an aligned bearish structure and a pronounced 15-session decline. The session range was about 1.8 times average, interrupting a contracting-range lookback trend, while above-average volume matched increasing activity. PSAR and the median-based trend measure remained bearish. A next-session high above 297.1891 would trigger a PSAR bullish reversal, but that threshold had not been confirmed.
TSLA · D:2026-11-04 NC% ▼ -3.34% OC% ▲ +1.42%
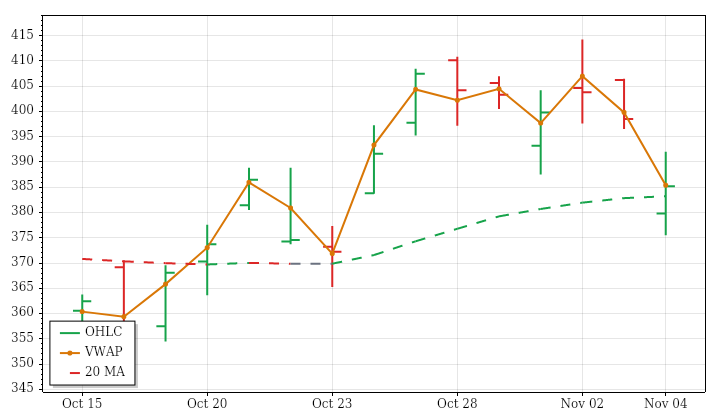
TSLA – Tesla Technicals Summary
TSLA's completed daily session on November 4 closed at 385.19, down 3.34% from the prior close despite gaining 1.42% from the open. The intraday rebound only partly offset an unfilled downward opening gap. Price recorded a lower high and lower low and finished below the preceding day's low. Its close just below session VWAP further distinguishes the recovery from a broadly strong daily result.
The pullback placed price beneath a rising near-term average, while it remained above a rising intermediate-term average and a falling far-term average. Those conflicts leave only the intermediate horizon clearly bullish, despite an upward but choppy 15-session price trend. Range was above average alongside expanding lookback ranges, while elevated volume interrupted a decreasing activity trend. PSAR entered a short state; a next-session high above 414.23 would conditionally trigger a bullish reversal.
Tesla News and Fundamentals
Tesla holds a record cash balance, while increasing capital expenditures and shrinking margins are raising concerns about how quickly that liquidity could be consumed.
AMZN · D:2026-11-04 NC% ▲ +6.12% OC% ▲ +0.46%
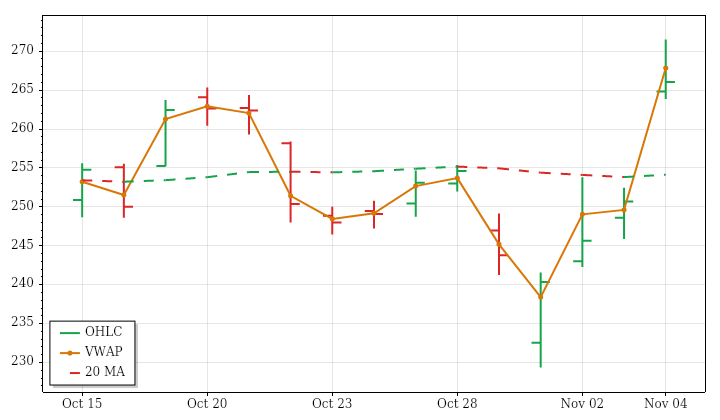
AMZN – Amazon Technicals Summary
AMZN's completed November 4 daily session rose 6.12% from the prior close to 266.03, but only 0.46% from the open. Most of the advance therefore came through the unfilled opening gap rather than subsequent intraday progress. Price made a higher high and higher low and closed above the preceding day's high, yet finished below session VWAP, tempering the strength of the headline gain.
The rally lifted price above both near- and intermediate-term benchmarks, but those averages were still falling. That leaves shorter horizons mixed against a rising far-term structure and a declining, low-efficiency 15-session price trend. Range was only modestly above average while volume was approximately twice average, consistent with increasing lookback activity and expanding ranges. PSAR remained bullish; a next-session low below 232.6308 would conditionally trigger a bearish reversal.
Amazon News and Fundamentals
Amazon is planning data-center campuses in Washington state's Walla Walla County and Tri-Cities. AWS has delivered six consecutive quarters of accelerating revenue growth, with CEO Andy Jassy indicating further momentum ahead. On November 4, Can Marine Systems announced an authorized-reseller agreement for Amazon Leo, under which it will provide the satellite constellation's connectivity through its Canopus platform as part of managed maritime connectivity and onboard IT services.
NVDA · D:2026-11-04 NC% ▼ -3.17% OC% ▼ -1.66%
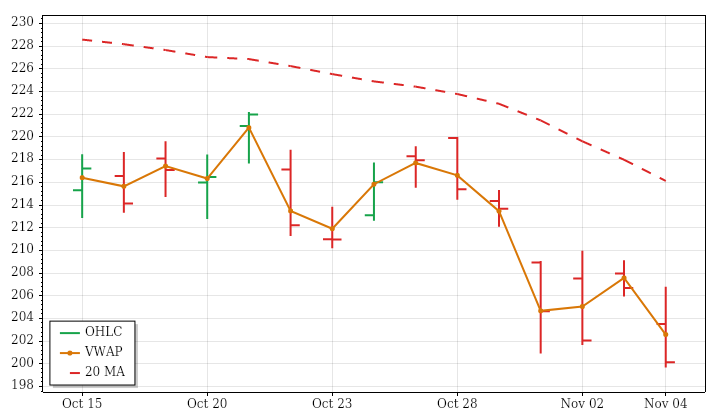
NVDA – Nvidia Technicals Summary
NVDA's completed daily session on November 4 declined 3.17% from the prior close to 200.13 and 1.66% from the open. The downward opening gap was filled, but that recovery did not hold: price finished below the preceding day's low and near its own session low. A lower high and lower low, together with a close below session VWAP, aligned the final result with intraday weakness.
Near- and intermediate-term averages were falling above price, reinforcing the declining 15-session price trend. The far-term average still rose, but price remained below it, leaving that horizon mixed rather than fully bearish. Above-average range and volume contrasted with lookback contraction and decreasing activity, making the latest decline more active than its recent backdrop. PSAR remained bearish; a next-session high above 217.2081 would conditionally trigger a bullish reversal, not confirm an existing recovery.
Nvidia News and Fundamentals
Nvidia has told cloud partners to limit business with Chinese customers, with the reported guidance requiring at least 51% of sales to non-Chinese customers. The unwritten rule is creating difficulties for some smaller providers ahead of Nvidia's November earnings report. Shares fell about 1.5% by 1:38 p.m. on November 4 amid concerns that Democratic midterm victories could slow data-center construction or make it more expensive.
META · D:2026-11-04 NC% ▲ +1.44% OC% ▼ -1.74%
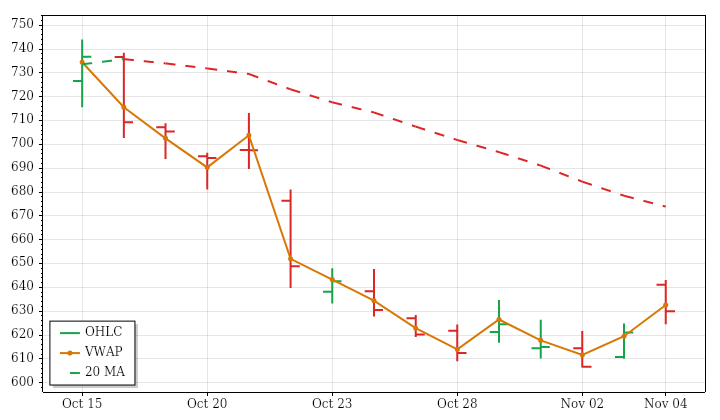
META – Meta Platforms Technicals Summary
META's completed daily session on November 4 closed at 630, up 1.44% from the prior close but down 1.74% from the open. The unfilled upward gap preserved a positive daily return despite substantial intraday retracement. Price still formed a higher high and higher low and finished above the previous day's high, but the close below session VWAP underscored the weaker open-to-close performance.
Price was above a falling near-term average, below a falling intermediate-term average and just beneath a rising far-term average. That mixed positioning did not erase the pronounced decline across the preceding 15 sessions. The latest range was below average, consistent with contracting lookback ranges, while elevated volume matched increasing activity. PSAR entered a long state even as the median-based measure remained bearish. A next-session low below 606.41 would conditionally reverse that PSAR state.
Meta News and Fundamentals
Meta acquired Conductor, an AI coding startup that deploys multiple agents into parallel workspaces for software projects. The company is seeking $9.2 billion in its debut euro bond sale, spanning maturities from four to 38 years; Bloomberg reported record orders. At the WSJ Tech conference, President Dina Powell McCormick said the midterm results would make building data centers harder, while expressing greater optimism about expanding existing facilities.
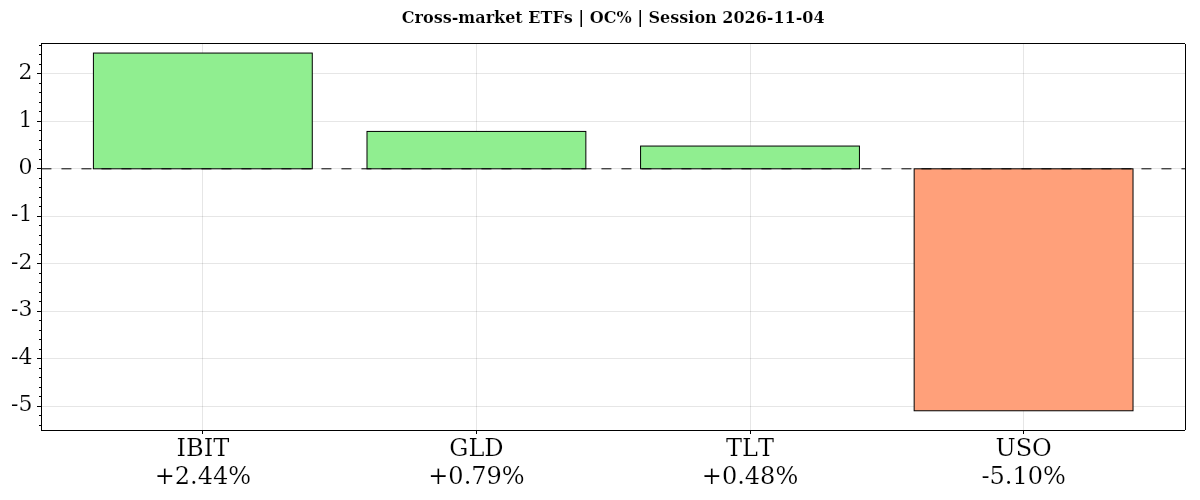
| Instrument | Bias | Date | DNC% | DOC% | O | H | L | C | VWAP | Vol |
|---|---|---|---|---|---|---|---|---|---|---|
| ▲ IBIT | ▲ ▲ ▼ | 2026-11-04 | ▲ +2.91% | ▲ +2.44% | 44.25 | 45.95 | 44.25 | 45.33 | ▼ 45.39 | 59,521,551 |
| ▲ GLD | ▲ ▲ ▲ | 2026-11-04 | ▲ +3.68% | ▲ +0.79% | 369.58 | 372.99 | 369.22 | 372.49 | ▲ 371.30 | 10,991,898 |
| ▲ TLT | ▲ ▲ ▲ | 2026-11-04 | ▲ +0.80% | ▲ +0.48% | 81.37 | 81.80 | 80.89 | 81.76 | ▲ 81.53 | 41,441,322 |
| ▼ USO | ▼ ▼ ▼ | 2026-11-04 | ▼ -8.07% | ▼ -5.10% | 153.22 | 154.49 | 142.96 | 145.41 | ▼ 146.95 | 11,742,746 |
| AVG/Sum | — | — | -0.17% | -0.35% | — | — | — | — | — | 123,697,517 |
Cross-Market ETFs
Negative confluence: average DOC% -0.35% from the open and DNC% -0.17% versus the prior close. Bitcoin led open-to-close gains alongside gold and bonds, but oil’s 5.10% decline outweighed them, diverging from equities. Versus the prior close, gold led gains while oil fell 8.07%; gold’s longer-term structure remained falling.
IBIT · D:2026-11-04 NC% ▲ +2.91% OC% ▲ +2.44%
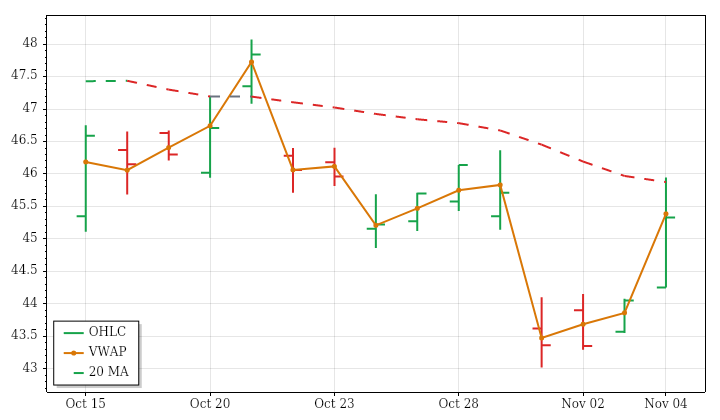
IBIT – Bitcoin Technicals Summary
IBIT's completed November 4 daily session gained 2.91% from the prior close to 45.33 and 2.44% from the open, so most of the advance developed after trading began. The opening gap remained unfilled. A higher high and higher low, a breach of the prior inside-bar high and a close above the preceding day's high marked the rebound, although the finish remained slightly below session VWAP.
The trend structure was unresolved across horizons. Price exceeded a falling near-term benchmark but remained beneath a rising intermediate-term benchmark, while the far-term uptrend persisted. This contrasts with the declining 15-session price trend. Range was nearly twice average despite contracting lookback ranges, and elevated volume accompanied an existing increase in activity. PSAR remained bearish; a next-session high above 46.2003 would conditionally trigger a bullish reversal rather than confirm one already underway.
GLD · D:2026-11-04 NC% ▲ +3.68% OC% ▲ +0.79%
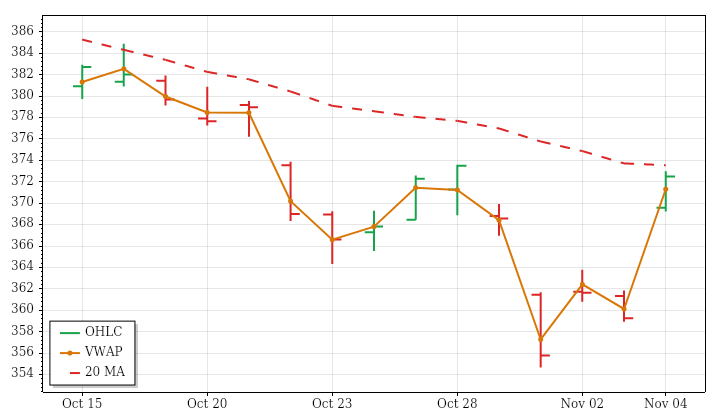
GLD – Gold Technicals Summary
GLD's completed November 4 daily session advanced 3.68% from the prior close to 372.49, including a 0.79% gain from the open. The upward opening gap remained unfilled. Price formed a higher high and higher low, closed above the preceding day's high and finished near the session high. Its position above session VWAP reinforced the positive intraday finish, despite the day's range remaining slightly below average.
This was a rebound within a weaker broader structure, not an aligned trend advance. Price stood above a still-falling near-term average, while remaining below declining intermediate- and far-term averages. The preceding 15-session price trend also remained downward. Volume was moderately above average, consistent with rising lookback activity, although the latest range did not match the broader expansion tendency. A next-session low below 354.67 would conditionally reverse the PSAR long state.
Gold News and Fundamentals
Gold reclaimed $4,000 an ounce on November 4 as a weaker dollar and falling Treasury yields following Democratic midterm victories supported precious-metals buying. Prices were subsequently flat in early Asian trading. ADP reported 86,000 private-sector jobs added in October, while ISM reported services-sector expansion; coverage linked economic resilience and persistent inflation to constraints on gold's recovery. Friday's U.S. jobs report is the next identified catalyst.
TLT · D:2026-11-04 NC% ▲ +0.80% OC% ▲ +0.48%
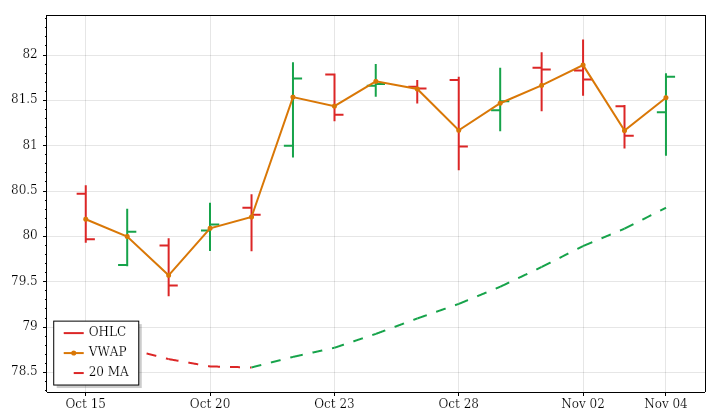
TLT – Long-Term Treasury Bonds Technicals Summary
TLT's completed November 4 daily session advanced 0.80% from the prior close to 81.76 and 0.48% from the open. The initial upward gap was filled, but price recovered to finish above the preceding day's high and near the session high. An outside bar captured the two-way movement, while the close above session VWAP supported the stronger final positioning rather than the earlier pullback.
Near- and intermediate-term averages were rising beneath price, consistent with the upward 15-session price trend. The far-term average remained falling above price, so shorter-term strength continued within a weaker longer-term structure. Range was above average despite contracting lookback ranges, while volume was only modestly above average against decreasing activity. The median-based trend measure remained bullish, but PSAR was in a short state. A next-session high above 82.17 would conditionally trigger its bullish reversal.
USO · D:2026-11-04 NC% ▼ -8.07% OC% ▼ -5.10%
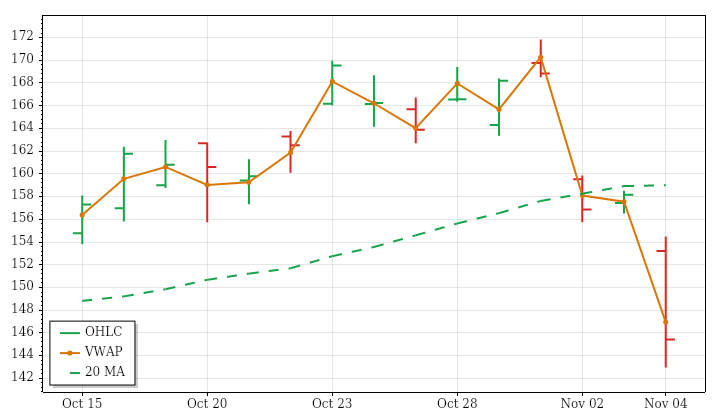
USO – Oil Technicals Summary
USO's completed November 4 daily session fell 8.07% from the prior close to 145.41, including a 5.10% decline from the open. The downward opening gap remained unfilled, and further selling produced a lower high and lower low, a breach of the prior inside-bar low and a close below the preceding day's low. The finish below session VWAP aligned the intraday result with the sharp daily loss.
Price dropped beneath still-rising near- and intermediate-term averages, creating mixed shorter horizons, while remaining above a rising far-term average. That deterioration contrasted with the upward but choppy 15-session price trend. Range reached about 2.8 times average despite lookback contraction, and volume exceeded twice average alongside increasing activity. The median-based measure crossed bearish and PSAR remained bearish. A next-session high above 169.6137 would conditionally trigger a bullish PSAR reversal.
Oil News and Fundamentals
Oil fell on November 4 and extended its decline into Thursday, with reports attributing the move to hopes that Democratic midterm victories would reduce escalation risks in the Iran war. JPMorgan said recovering Middle Eastern exports and weaker demand were pushing global oil supply into surplus. Meanwhile, EIA reported an 865,000-barrel decline in U.S. commercial crude inventories, the fifth consecutive weekly draw, and distillate stocks at their lowest in more than two decades. The Energy Department announced a 300,000-barrel emergency heating-oil loan.
Glossary: Instrument — ticker symbol; hover for the instrument or company name; Date — session date. DNC% — prior-session close to this session’s close; DOC% — daily session open-to-close percentage change. O — open; H — high; L — low; C — close, all for the table’s daily or weekly session; VWAP — volume-weighted average price; its arrow shows whether the close is above or below VWAP. Vol — period trading volume.
Bias — three directional readings, in order: DNC%, DOC%, then VWAP. ▲ positive/above; ▼ negative/below; — neutral or unavailable. Matching arrows show alignment; opposing arrows show mixed conditions. AVG/Sum — simple average of percentage changes and sum of reported volumes.
Futures Session Fib Grid Analysis – Snapshot
Session Fib Grids normalise market positioning as percentages, making direction and alignment comparable across different asset types.
Latest available snapshot for each instrument; Time(CT) shows the individual update date and time.
| Instrument | Bias | Time(CT) | YSFG | MSFG | WSFG | RSFG | SFG | TSI |
|---|---|---|---|---|---|---|---|---|
| ▲ ES | ▲ ▲ ▲ ▲ ▲ ▲ | 2026-11-05 07:18:55 | ▲ +56 | ▲ +34 | ▲ +55 | ▲ +47 | ▲ +2 | ▲ +63 |
| ▼ NQ | ▲ ▼ ▼ ▼ ▲ ▼ | 2026-11-05 07:18:53 | ▲ +39 | ▼ -9 | ▼ -16 | ▼ -12 | ▲ +4 | ▼ -26 |
| ▲ YM | ▲ ▲ ▲ ▲ ▼ ▲ | 2026-11-05 07:18:54 | ▲ +54 | ▲ +83 | ▲ +151 | ▲ +137 | ▼ -2 | ▲ +119 |
| ▼ EMD | ▲ ▲ ▲ ▼ ▼ ▼ | 2026-11-05 07:17:07 | ▲ +44 | ▲ +40 | ▲ +66 | ▼ -46 | ▼ -13 | ▼ -132 |
| ▲ RTY | ▲ ▲ ▲ ▲ ▼ ▼ | 2026-11-05 07:18:54 | ▲ +45 | ▲ +26 | ▲ +41 | ▲ +2 | ▼ -11 | ▼ -103 |
| ▲ FDAX | ▲ ▲ ▲ ▲ ▼ ▲ | 2026-11-05 07:18:47 | ▲ +47 | ▲ +63 | ▲ +98 | ▲ +5 | ▼ -3 | ▲ +24 |
| ▼ NKD | ▲ ▼ ▼ ▼ ▲ ▼ | 2026-11-05 07:18:52 | ▲ +126 | ▼ -17 | ▼ -34 | ▼ -118 | ▲ +2 | ▼ -83 |
| Instrument | Bias | Time(CT) | YSFG | MSFG | WSFG | RSFG | SFG | TSI |
|---|---|---|---|---|---|---|---|---|
| ▲ BTC | ▼ ▲ ▲ ▲ ▼ ▼ | 2026-11-05 07:18:01 | ▼ -40 | ▲ +13 | ▲ +35 | ▲ +55 | ▼ -1 | ▼ -187 |
| ▲ GC | ▼ ▲ ▲ ▲ ▼ ▼ | 2026-11-05 07:18:49 | ▼ -120 | ▲ +56 | ▲ +130 | ▲ +103 | ▼ -3 | ▼ -40 |
| ▼ CL | ▲ ▼ ▼ ▼ ▲ ▲ | 2026-11-05 07:18:54 | ▲ +154 | ▼ -64 | ▼ -158 | ▼ -84 | ▲ +14 | ▲ +201 |
| ▼ 6E | ▼ ▲ ▲ ▼ ▼ ▼ | 2026-11-05 07:18:47 | ▼ -55 | ▲ +26 | ▲ +54 | ▼ -72 | ▼ -7 | ▼ -94 |
| ▼ ZB | ▼ ▲ ▲ ▼ ▼ ▲ | 2026-10-21 09:39:59 | ▼ -39 | ▲ +77 | ▲ +6 | ▼ -3 | ▼ -2 | ▲ +29 |
Glossary: YSFG — yearly; MSFG — monthly; WSFG — weekly; RSFG — regular trading hours (RTH); SFG — the current session, including pre-market or other sessions. TSI indicates trend strength and power.
Bias shows trend alignment across these six readings. The arrows follow the column order: YSFG, MSFG, WSFG, RSFG, SFG and TSI. Matching arrows show alignment; opposing arrows show mixed conditions.
Futures Higher Time Frame Analysis
Summary of the current state of US Indices Futures based on higher time-frame (HTF) technical analysis as of: 2026-11-05 07:16 -06:00 CT.
US Indices Futures
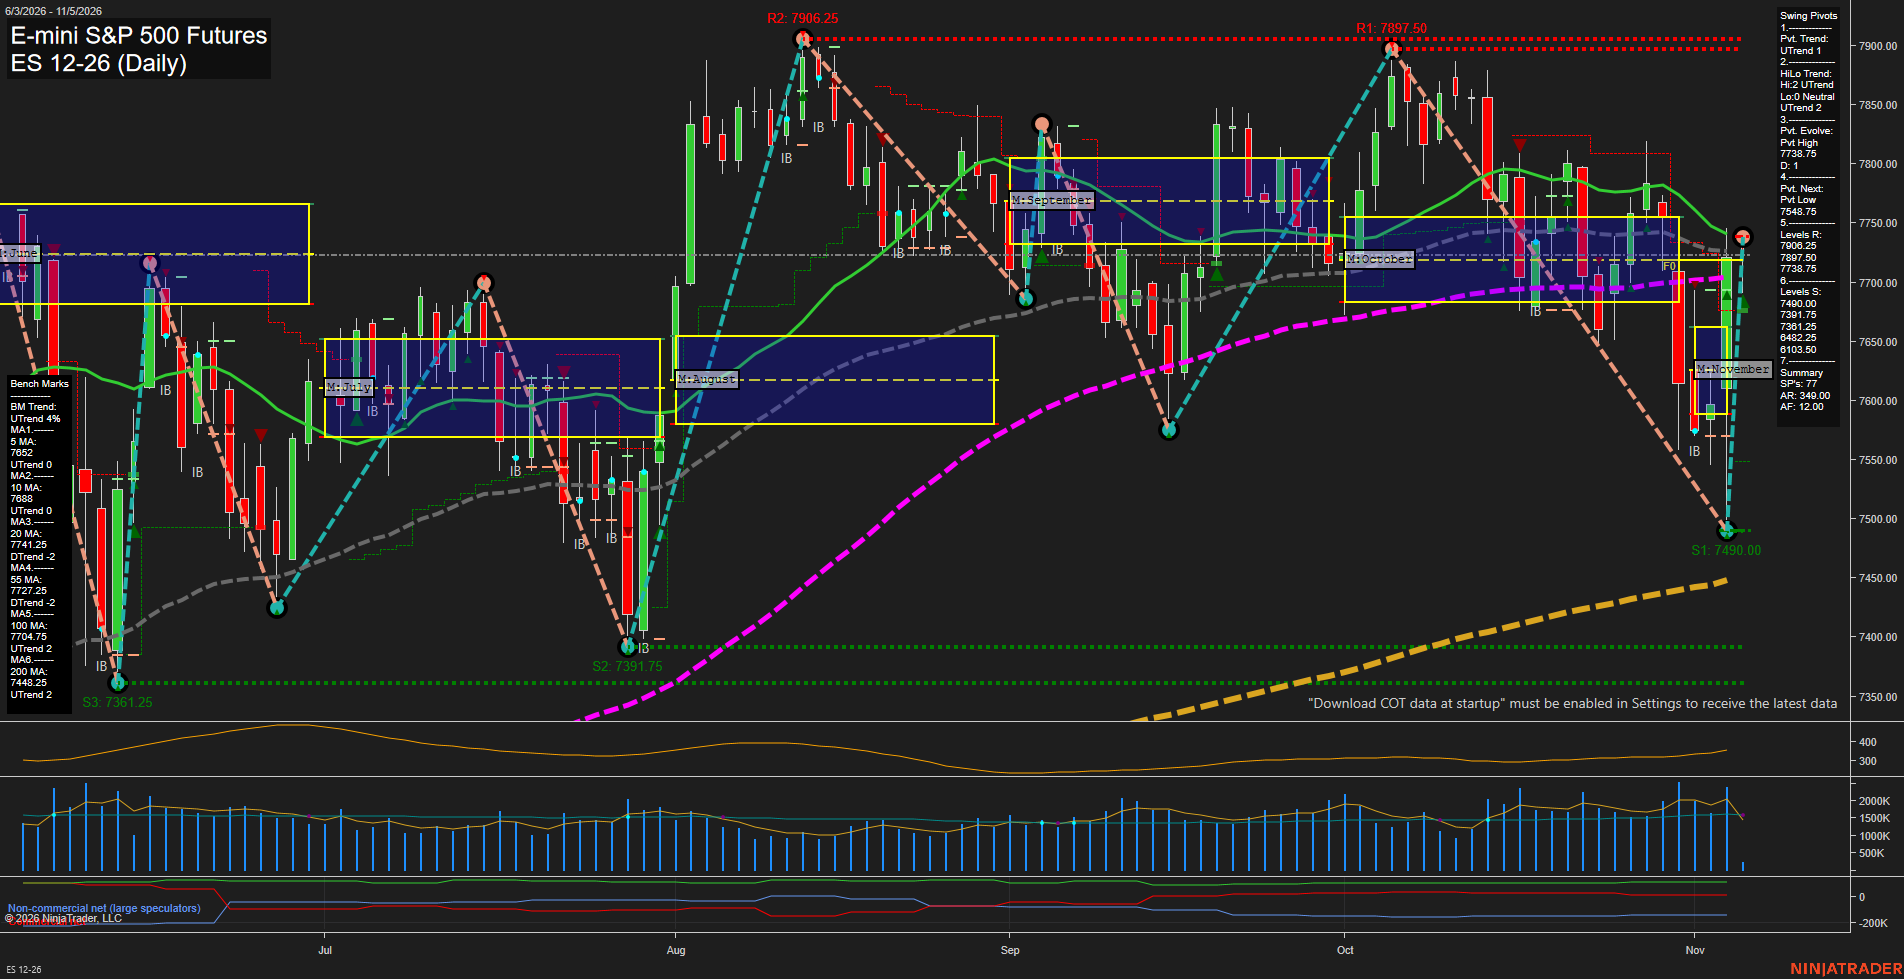
- ES YSFG/MSFG/WSFG upward, daily pivots UTrend, testing 55-day benchmark 7727.25, resistance 7738.75/7906.25, support 7587.75/7490.
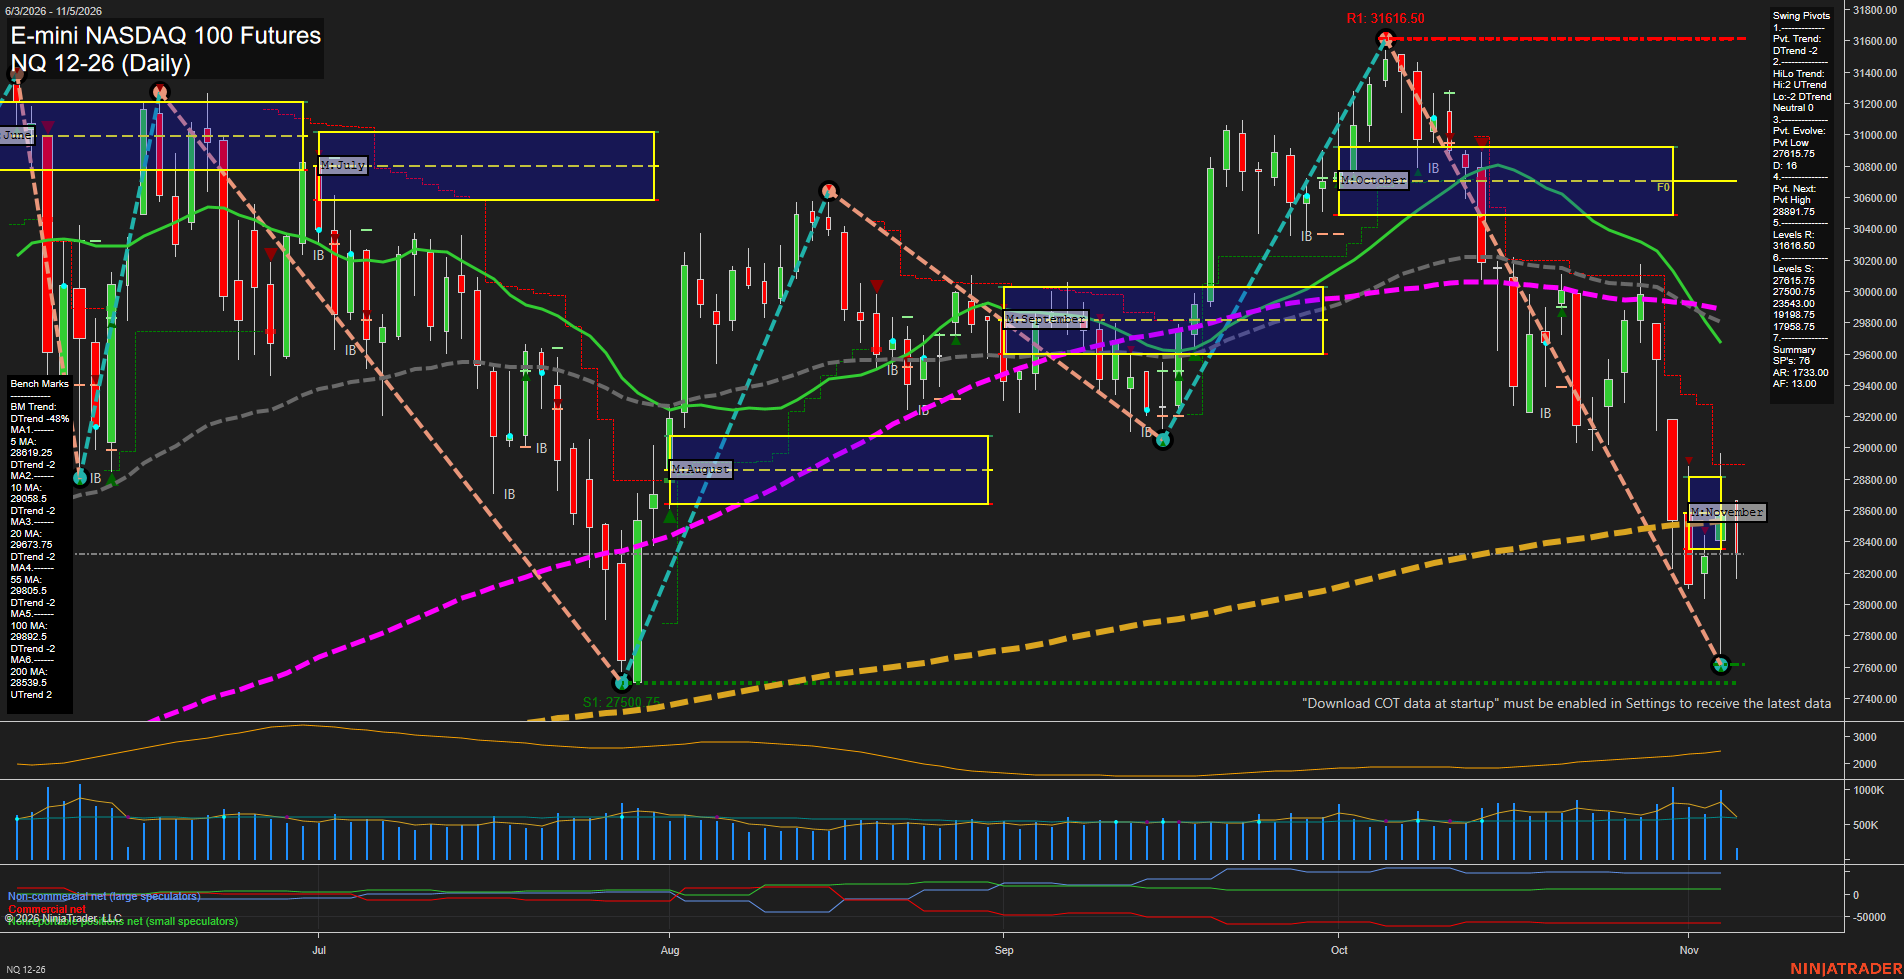
- NQ YSFG upward, MSFG/WSFG below F0%, pivots DTrend, below 5–100-day benchmarks, near rising 200-day, resistance 28901.25, support 27615.75–27500.75.
- YM above YSFG/MSFG/WSFG reference zones, daily benchmarks rising, pivots UTrend, resistance 54259/55316, daily reversal 52631, support 50859.
- EMD above YSFG/MSFG/WSFG F0%, daily pivots UTrend versus weekly DTrend, resistance 3770.1–3793.9 includes 100-day benchmark, reversal 3686.3, support 3604.1/3600.3.
- RTY YSFG upward, MSFG/WSFG reclaimed, daily pivots UTrend versus weekly DTrend, resistance 2888.7–2889.1/2945.5–2946.3, rising 200-day benchmark, reversal 2800.5, support 2723.3–2725.3.
- FDAX YSFG/MSFG upward, WSFG extended at 99%, all benchmarks rising beneath price, pivot/HiLo UTrend, resistance 26765–26876, daily reversal 25974, support 24925.
Overall State
- Short-Term: Bullish
- Intermediate-Term: Bullish
- Long-Term: Bullish
Conclusion
Broad HTF direction remains bullish, with NQ diverging through bearish short- and intermediate-term structures. YM and FDAX lead benchmark and pivot alignment; ES and EMD retain broader upward structures while testing overhead benchmarks and swing resistance. RTY’s daily recovery contrasts with its weekly pivot DTrend and daily HiLo DTrend. YSFG direction remains upward across the instruments, while NQ remains below MSFG/WSFG F0% areas. ES’s recent long signals align with its daily pivot recovery, although weekly price remains beneath shorter benchmarks. NQ’s 27615.75–27500.75 support band and the recovery instruments’ overhead pivot clusters remain the principal structural references.
Note: Intra-day counter-trend pullbacks or retracements may occur, HTF is context for informational usage and market structure. Glossary: Session Fib Grids periods of YSFG:’Yearly’, MSFG:’Monthly’, WSFG:’Weekly’
For full details visit: AlphaWebTrader Technicals
SPY Daily View
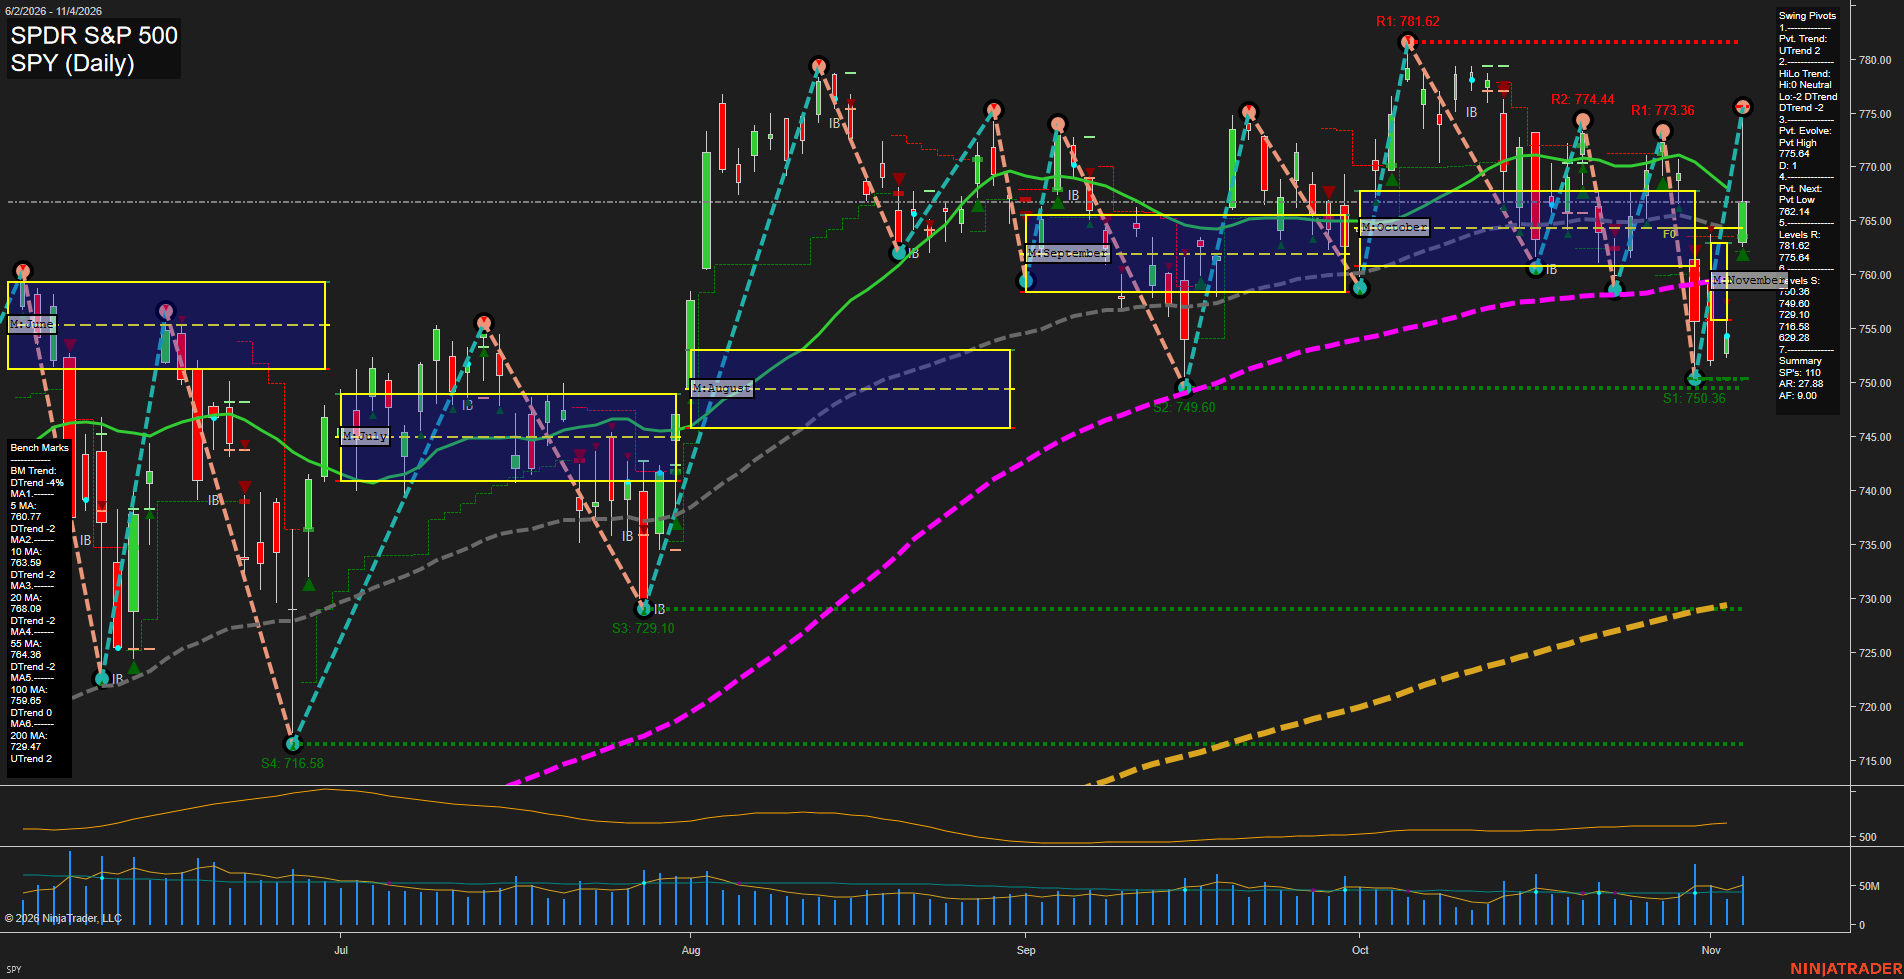
Overall Rating
- Short-Term: Bullish
- Intermediate-Term: Neutral
- Long-Term: Bullish.
Key Insights Summary
SPY/ES-equivalent daily structure reflects a sharp V-style recovery from the 750 area, with price reclaiming the 55-day benchmark and turning the short-term pivot trend upward. The recovery remains high-volatility and rotational rather than a clean intermediate-term breakout because price is testing the declining 20-day average near 768.69 and remains beneath the 773.64 to 775.64 pivot-resistance zone. The 762.14 pivot-next level and 759.36 support define the nearby retracement structure, while a sustained move through the upper pivot zone would place 781.62 in focus. Longer-term structure remains constructive above the rising 200-day average, although the declining 100-day average and mixed intermediate moving averages describe a choppy consolidation phase rather than a fully synchronized trend advance.
View charts on: AlphaWebTrader HTF Charts
ES Daily View
Overall Rating
- Short-Term: Bullish
- Intermediate-Term: Bullish
- Long-Term: Bullish.
Key Insights Summary
The daily chart shows a sharp V-style rebound from the 7490 swing-low area, with large-range upside bars restoring fast momentum and returning price above the weekly and monthly Fib-grid centers. Short-term pivot structure is in UTrend and the intermediate HiLo structure remains UTrend, while the 5-day and 10-day averages have turned upward. Price is testing the 55-day benchmark near 7727.25 and remains just beneath the 20-day average and the active 7738.75 pivot-high level, defining a near-term overhead congestion zone. The broader structure remains constructive as price holds above rising 100-day and 200-day benchmarks, while the November grid, yearly grid, and recent long signals retain an upward directional backdrop. ATR at 349 reflects elevated daily range conditions and the recent recovery has retraced much of the late-October selloff.
View charts on: AlphaWebTrader HTF Charts
QQQ Daily View
Overall Rating
- Short-Term: Bearish
- Intermediate-Term: Bearish
- Long-Term: Neutral.
Key Insights Summary
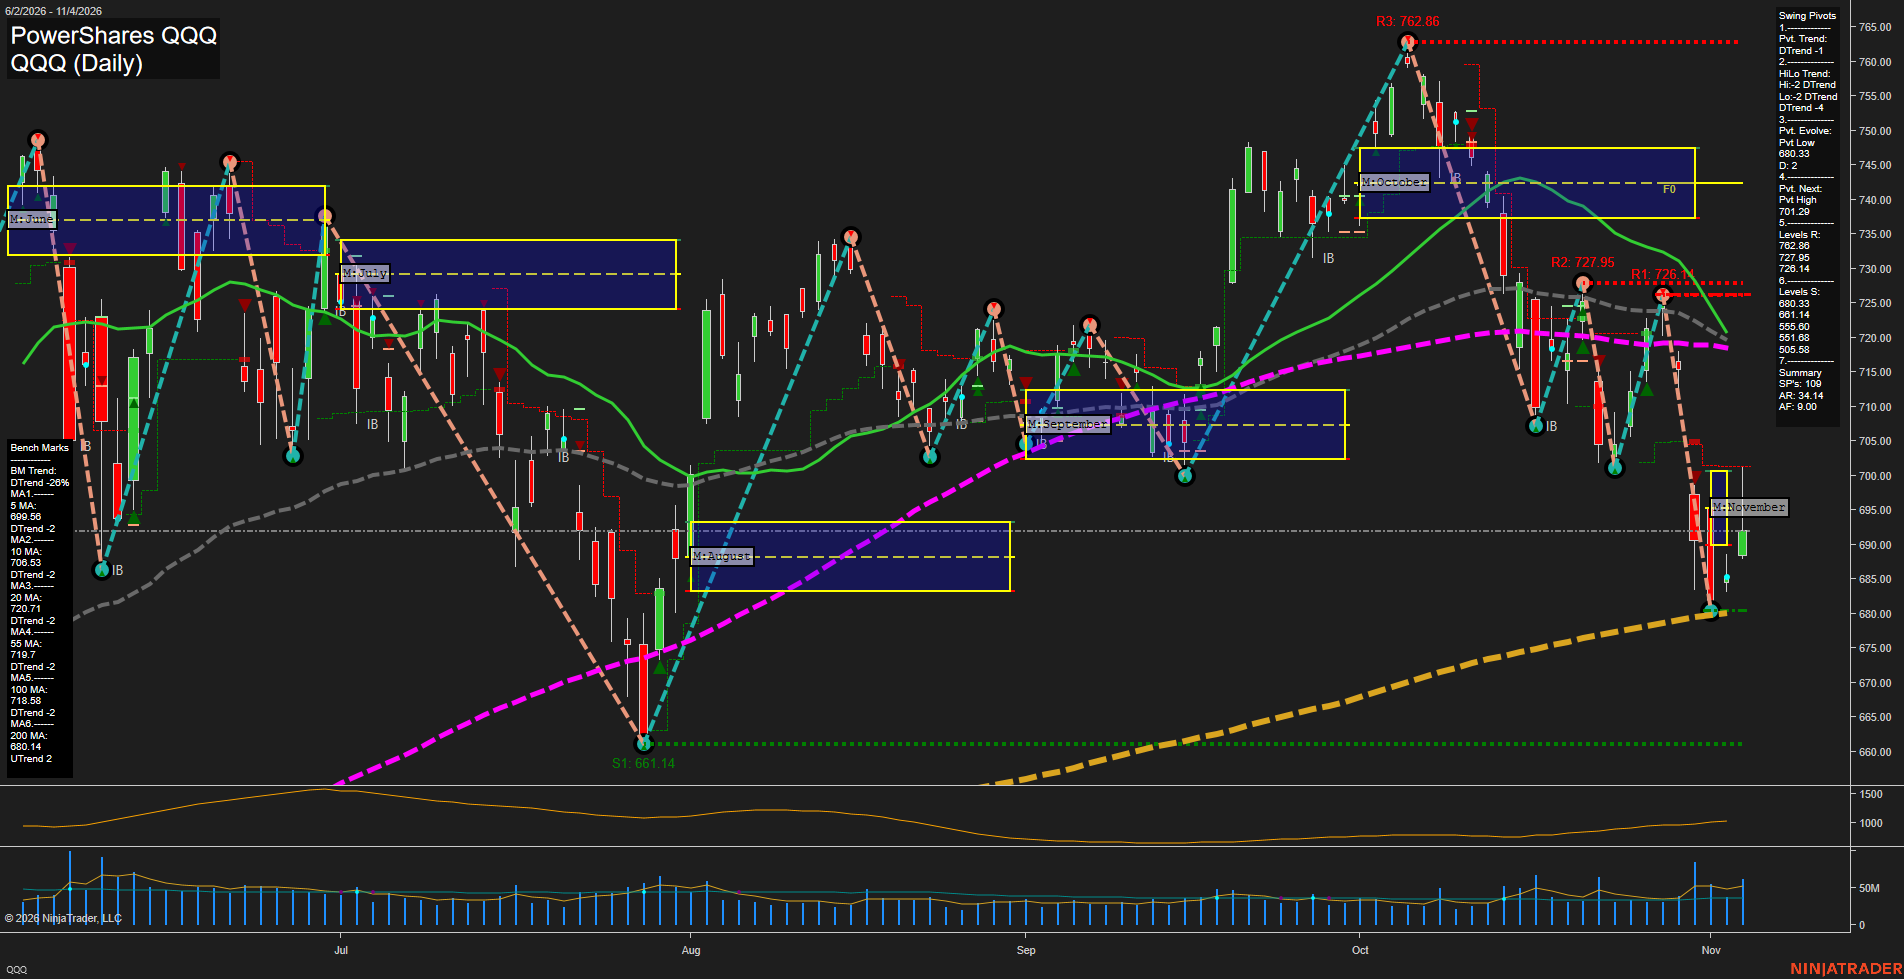
QQQ, as a liquid NQ futures proxy, remains in a sharp downside swing after rejection from the 762.86 pivot high. Price is below every short- and intermediate-term benchmark, while both pivot structures remain in DTrend. The 680.33 pivot low and rising 200-day benchmark near 680.14 form the immediate major support confluence. The latest bounce from that area is a countertrend recovery within the broader decline; 701.29 is the defined next pivot threshold, with the 5-day and 10-day averages near 699.56 and 706.53 representing nearby overhead structure. Elevated ATR reflects a fast, high-range price cycle rather than orderly consolidation.
View charts on: AlphaWebTrader HTF Charts
NQ Daily View
Overall Rating
- Short-Term: Bearish
- Intermediate-Term: Bearish
- Long-Term: Neutral.
Key Insights Summary
Price is in a fast, volatile downswing from the October 31616.50 pivot high, with lower highs and lower lows defining the short-term structure. The November and weekly Fib grids remain below their F0% areas, while price is under the 5-, 10-, 20-, 55-, and 100-day benchmarks. The 27615.75 to 27500.75 pivot-support band is the key nearby downside reference following the sharp selloff and rebound attempt. Long-term conditions are mixed: the annual Fib structure remains positive and price is near the rising 200-day benchmark, but the declining 100-day average and broad intermediate-term weakness keep the larger swing picture neutral rather than constructive.
View charts on: AlphaWebTrader HTF Charts
USO Daily View
Overall Rating
- Short-Term: Bearish
- Intermediate-Term: Bullish
- Long-Term: Bullish.
Key Insights Summary
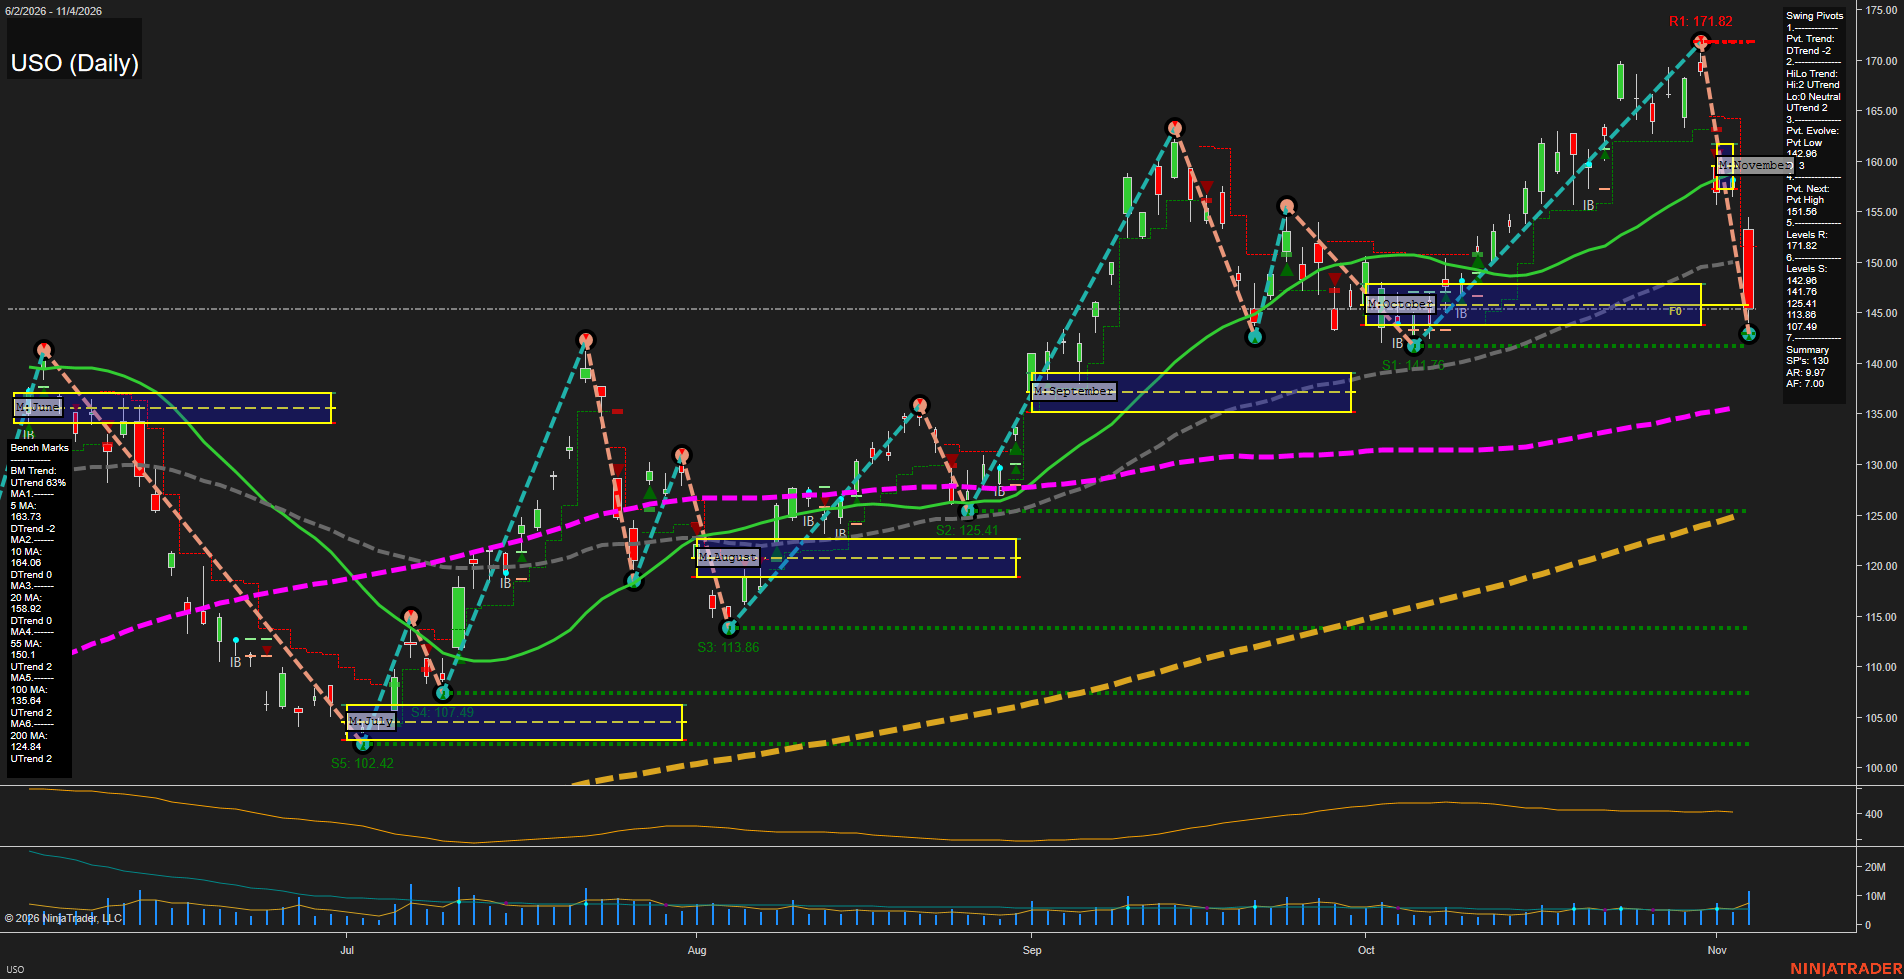
USO experienced a sharp, high-momentum reversal from the 171.82 pivot high, producing large-range downside bars and shifting the short-term pivot structure into DTrend. Price is beneath the November MSFG lower boundary and below the 5-, 10-, 20-, and 55-day benchmarks, reflecting a decisive short-term liquidation cycle. The 142.98 pivot low and 141.76 support form the immediate reaction zone. Despite the abrupt selloff, the intermediate HiLo trend remains UTrend and the 100- and 200-day benchmarks continue rising, leaving the broader advance intact while price undergoes a deep countertrend retracement. A recovery through 151.56 would mark the next pivot-structure reversal threshold, while sustained trade below 141.76 would extend the current downside swing toward lower historical support.
View charts on: AlphaWebTrader HTF Charts
CL Daily View
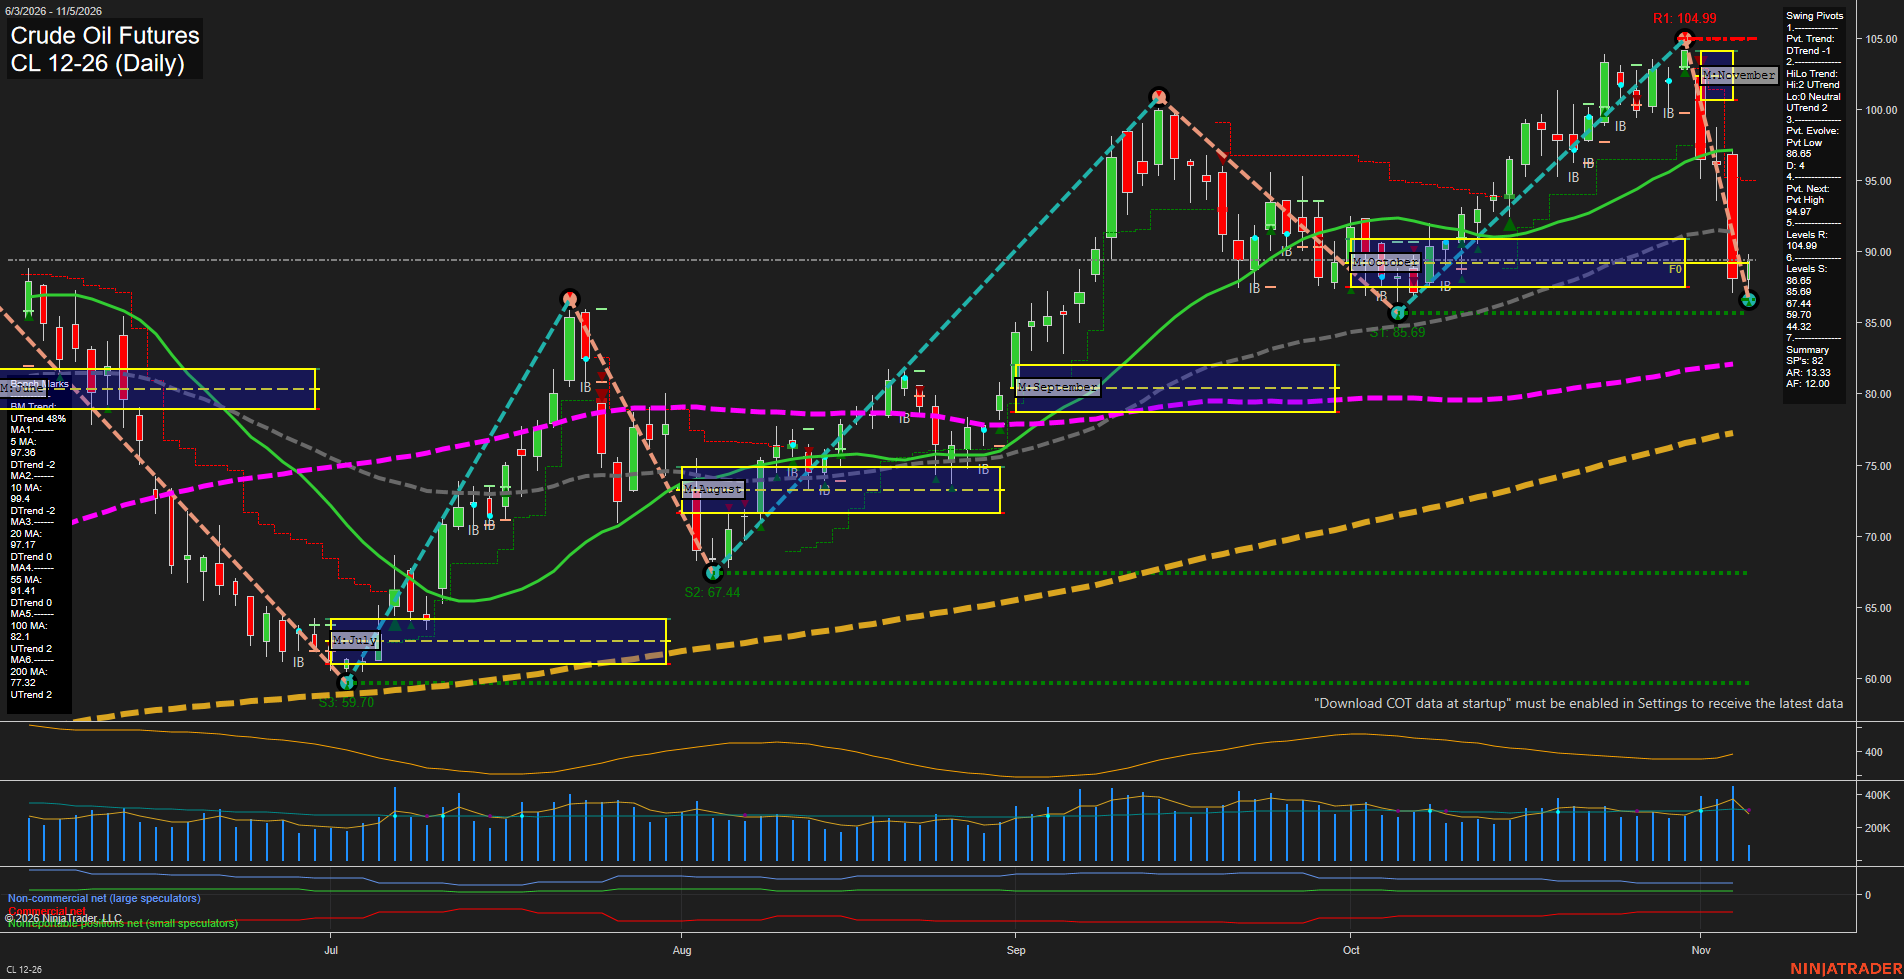
Overall Rating
- Short-Term: Bearish
- Intermediate-Term: Bearish
- Long-Term: Bullish.
Key Insights Summary
Price has undergone a fast, large-range selloff from the 104.99 swing-high resistance area and is trading beneath the weekly and November monthly Fib-grid centers. The short-term pivot structure is in DTrend, with price pressing the 86.65 pivot-low area and nearby 85.69 support after a sharp breakdown below the 5-, 10-, 20-, and 55-day benchmarks. The intermediate structure has weakened materially, although the broader HiLo trend and long-term moving-average structure remain constructive because price is still above rising 100- and 200-day benchmarks. The current action reflects a strong countertrend retracement within the longer-term advance, with 94.97 defining the next pivot-high reversal reference and 104.99 remaining major overhead resistance.
View charts on: AlphaWebTrader HTF Charts
GLD Daily View
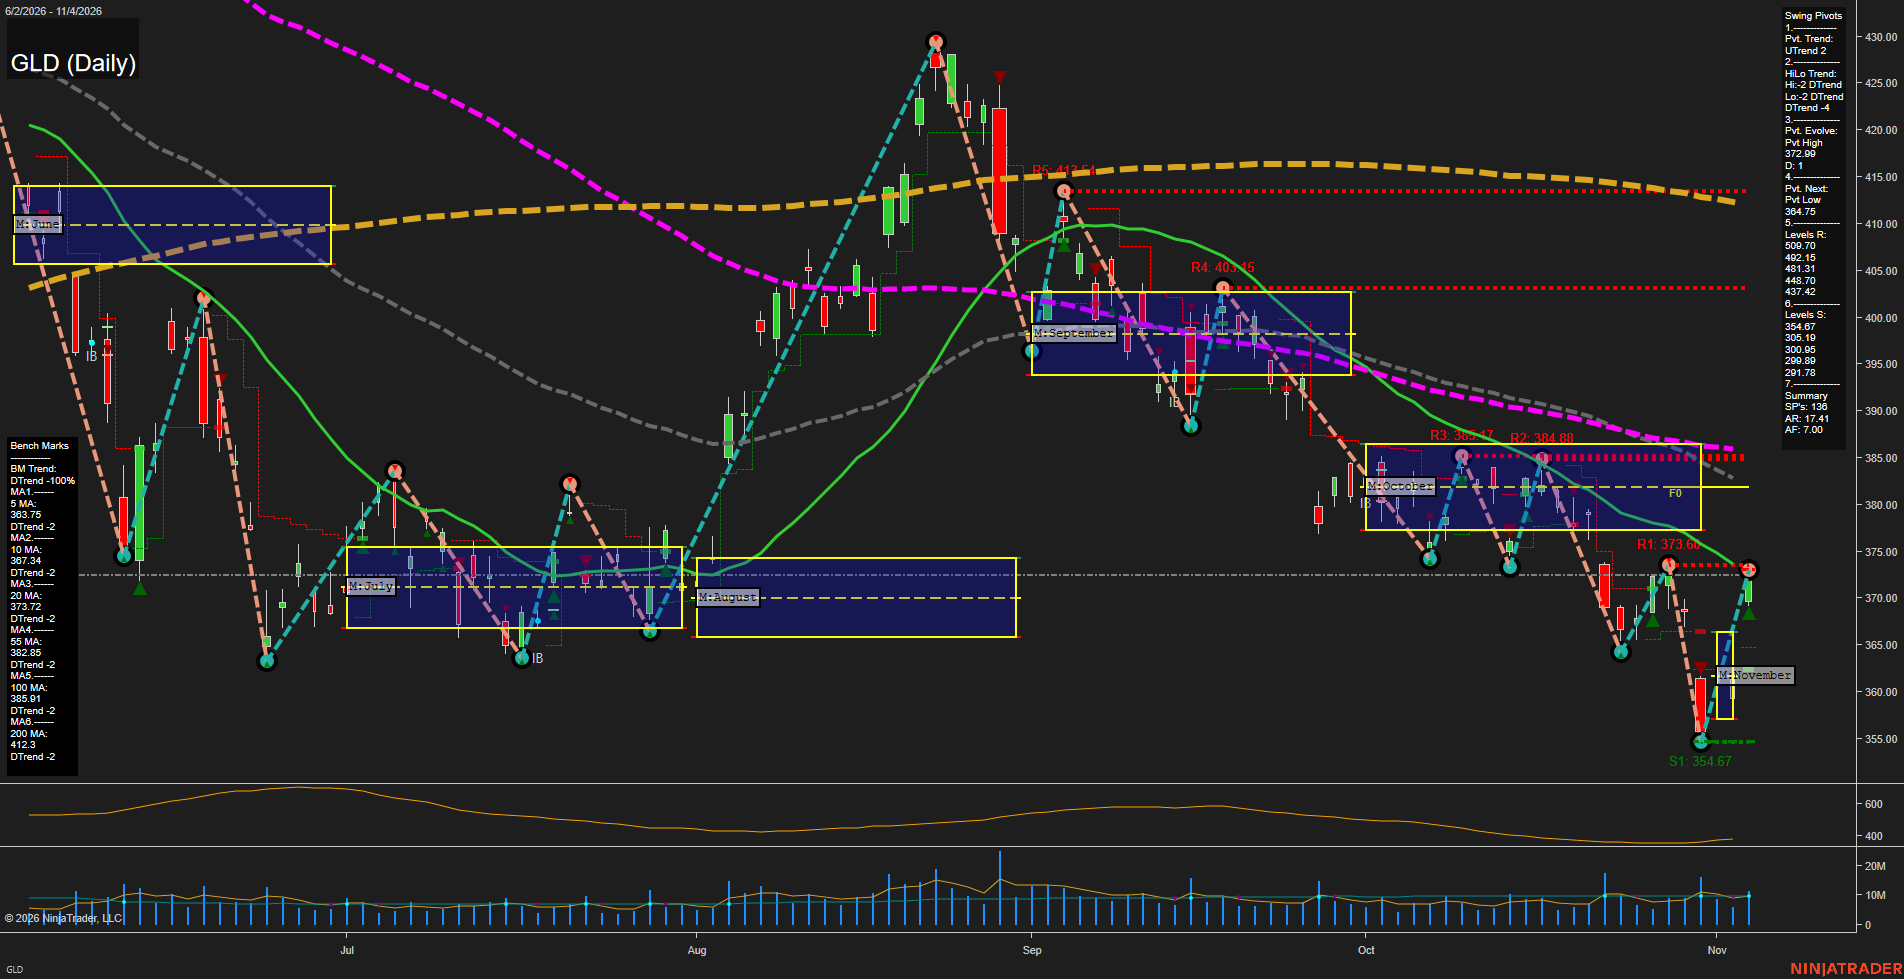
Overall Rating
- Short-Term: Bullish
- Intermediate-Term: Bearish
- Long-Term: Bearish.
Key Insights Summary
From a futures swing-trader perspective, GLD reflects a sharp short-covering recovery from the 354.67 pivot low, producing a short-term UTrend and fast upside momentum. Price is testing the 373.80 pivot-resistance area and remains essentially aligned with the declining 20-day benchmark. The larger structure remains corrective: the intermediate HiLo trend is down, price is below the declining 55-, 100-, and 200-day averages, and the November grid remains neutral beneath its F0% area. The bounce has recovered from an oversold selloff but has not yet altered the broader sequence of lower highs; overhead levels at 384.88, 386.17, and 403.45 define the principal recovery ceiling, while 354.67 remains the dominant swing-low reference.
View charts on: AlphaWebTrader HTF Charts
GC Daily View
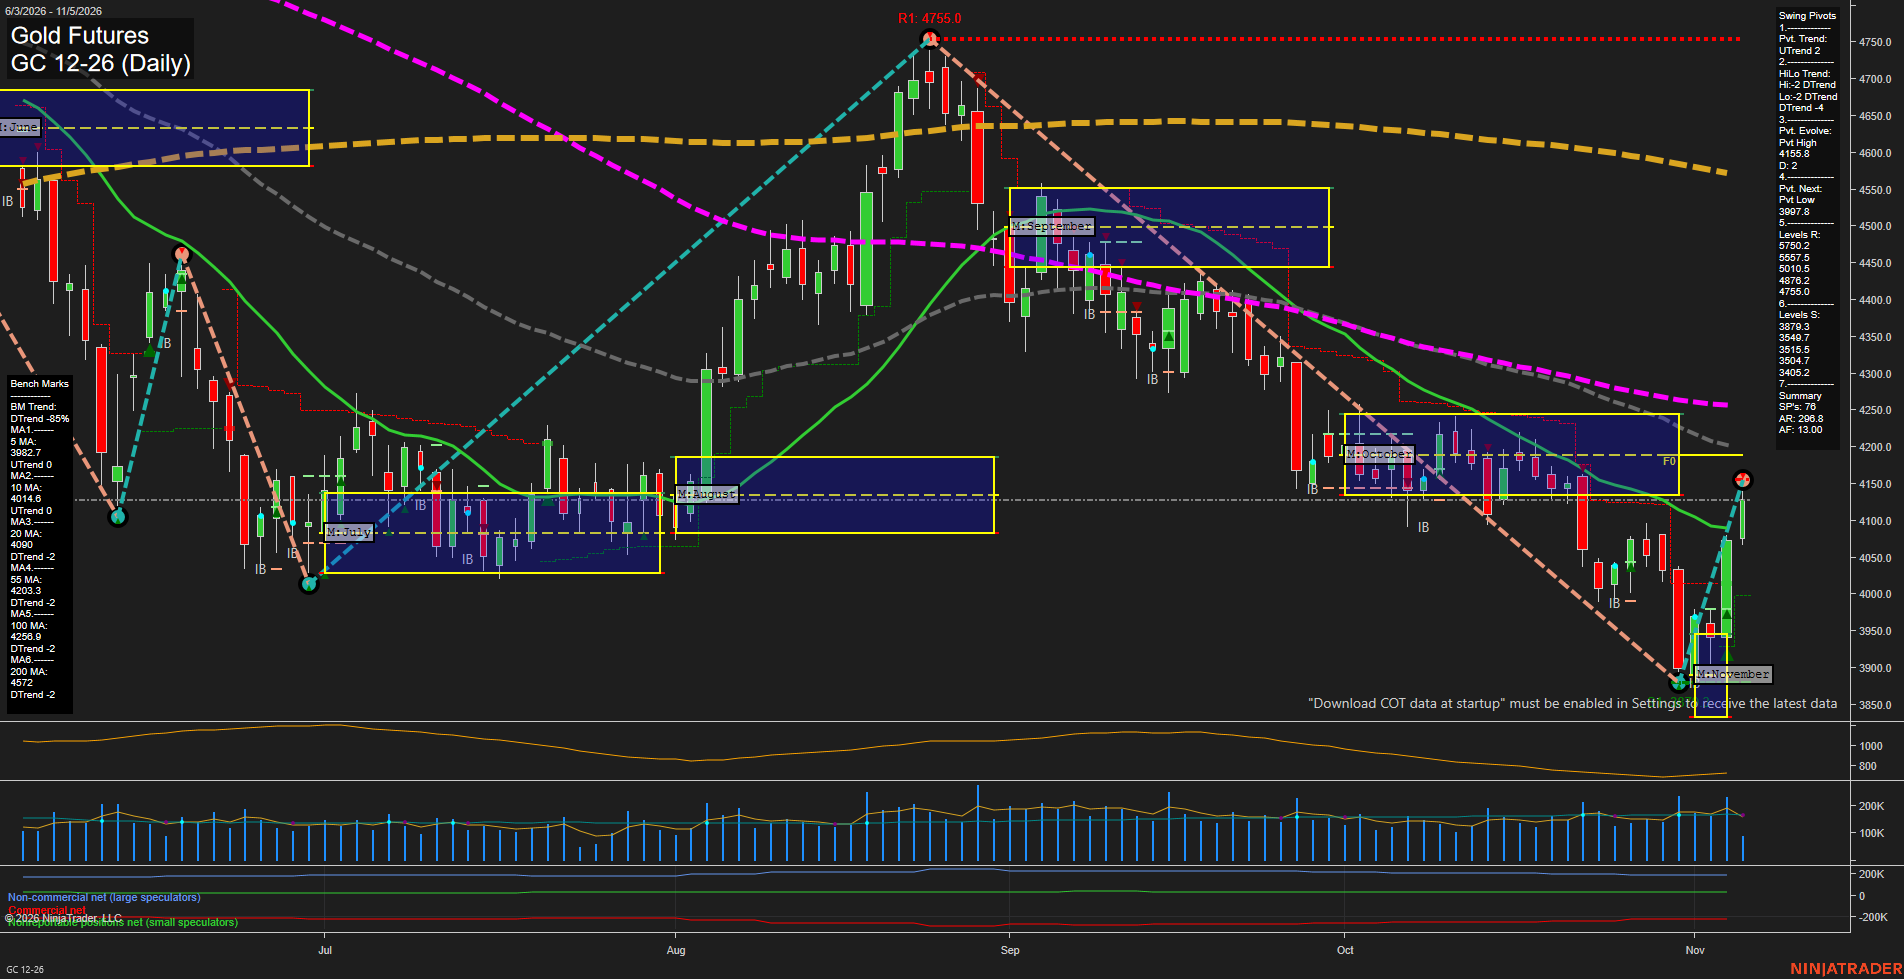
Overall Rating
- Short-Term: Bullish
- Intermediate-Term: Bearish
- Long-Term: Bearish.
Key Insights Summary
Gold has produced a sharp V-style rebound from the 3879 pivot-support area, lifting price above the rising 5-day and 10-day benchmarks and restoring the short-term pivot trend to UTrend. The recovery is fast, but price remains beneath the declining 55-day, 100-day, and 200-day benchmarks, while the intermediate HiLo pivot structure remains DTrend. The 4155.8 evolving pivot high and the 4203.3 to 4258.9 moving-average band define the nearby overhead technical zone; the 3997.8 pivot-low level and 3879.3 support remain the principal downside structure. This reflects a short-term countertrend recovery inside a broader intermediate and long-term corrective decline.
View charts on: AlphaWebTrader HTF Charts
ZB Daily View
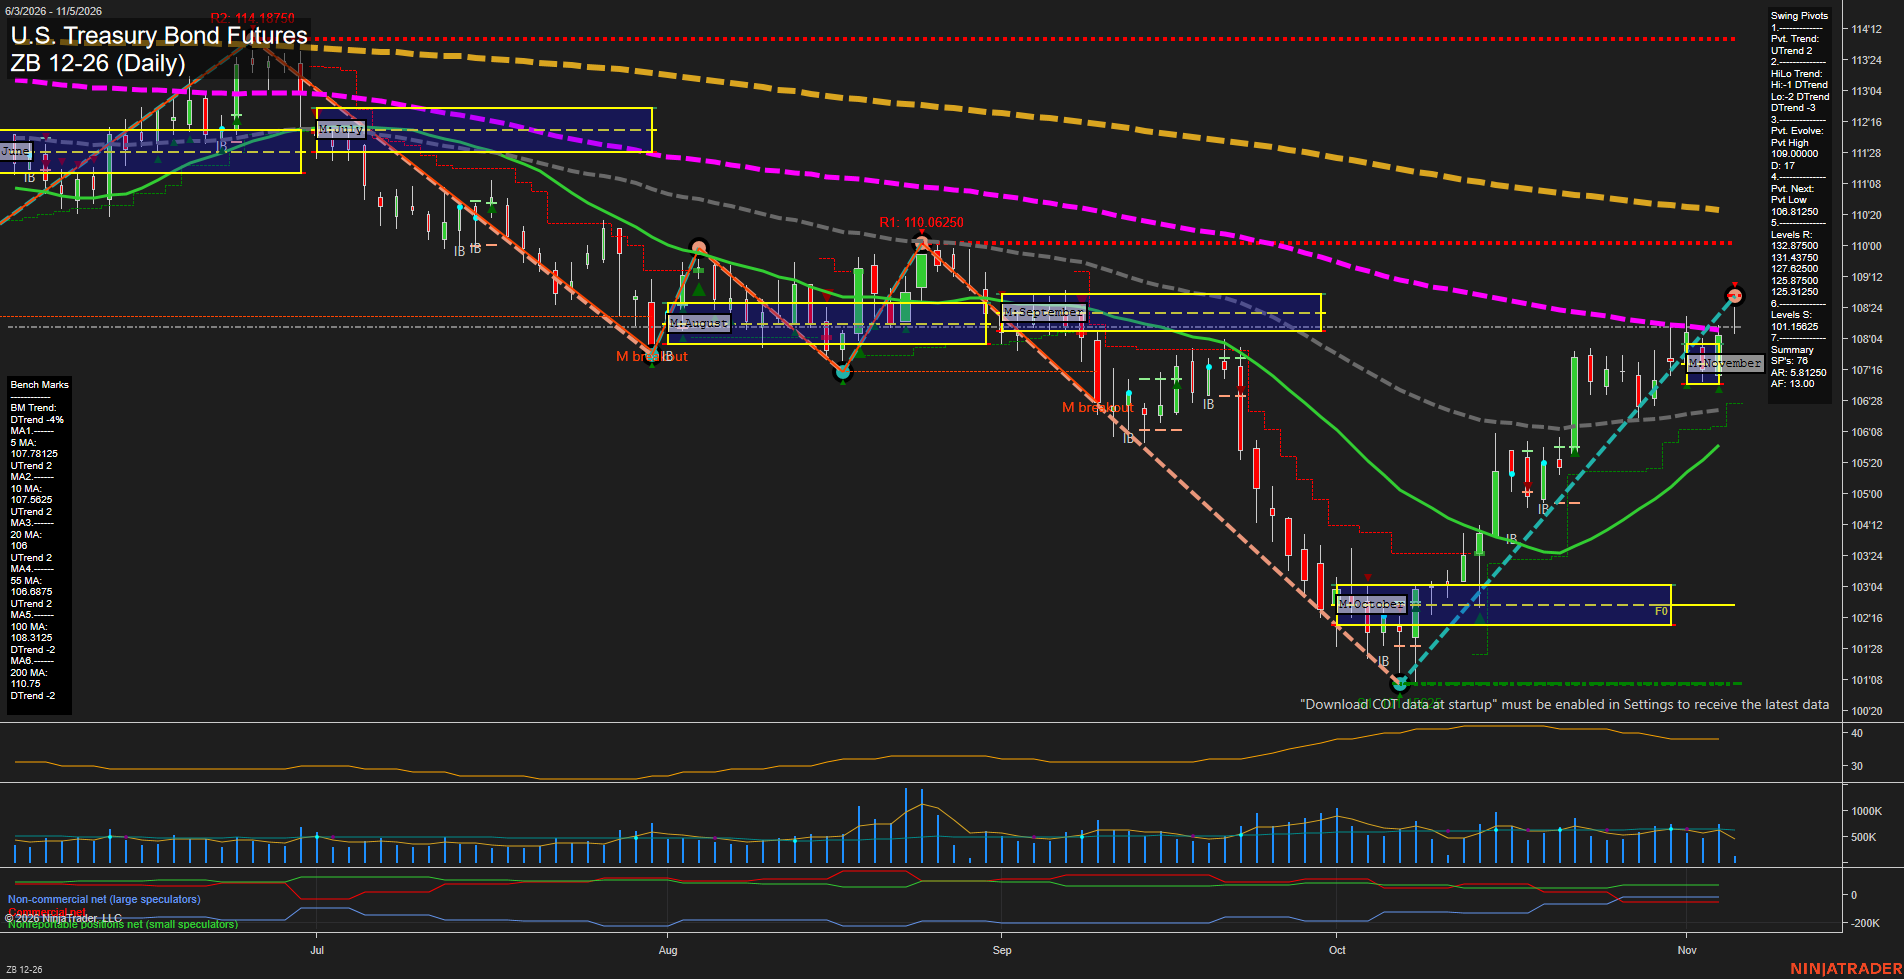
Overall Rating
- Short-Term: Bullish
- Intermediate-Term: Bullish
- Long-Term: Bearish.
Key Insights Summary
The daily structure reflects a strong recovery from the October low, with higher lows, a confirmed short-term UTrend, price above the rising 5, 10, 20, and 55-day benchmarks, and positive weekly and monthly fib-grid alignment. The rebound has approached the declining 100-day average near 108.31250 and the developing 109.00000 pivot-high area, creating an important countertrend test within the broader long-term downtrend. Momentum is constructive but measured rather than impulsive, while ATR near 39 indicates active daily range conditions. The intermediate HiLo structure remains a DTrend and the 100-day and 200-day benchmarks remain downward sloping, so the present advance is technically a recovery leg inside a still-bearish longer-term trend framework.
View charts on: AlphaWebTrader HTF Charts
Sentiment Summary: Coverage is balanced with a slight negative bias: 40% neutral, 30% negative and 30% positive, as the November 3 Democratic midterm sweep raised concerns about data-center restrictions, alongside AI spending and cash-flow pressures. November 4 gains in Apple, Amazon and Microsoft and strong reported Q3 earnings provided counterweights, while chip weakness persisted into November 5, when Dow futures rose about 0.6%, S&P 500 futures were little changed and Nasdaq futures declined.
Conclusion: Index divergence, rather than broad directional conviction, defines the premarket context ahead of the November 6 jobs report.