Stocks sank Thursday on AI buildout concerns after jobless claims; Microchip earnings were due after the close, ahead of tomorrow's Friday jobs report.
Fundamentals: Stocks closed lower Thursday as concerns about post-election constraints on AI data-center construction pressured technology shares, with Microchip Technology earnings due after the close. Semiconductor selling weighed on the Nasdaq and S&P 500, bringing their 200-day moving averages into focus. Thursday's calendar included unemployment claims; tomorrow, Friday, November 6, brings the October jobs report.
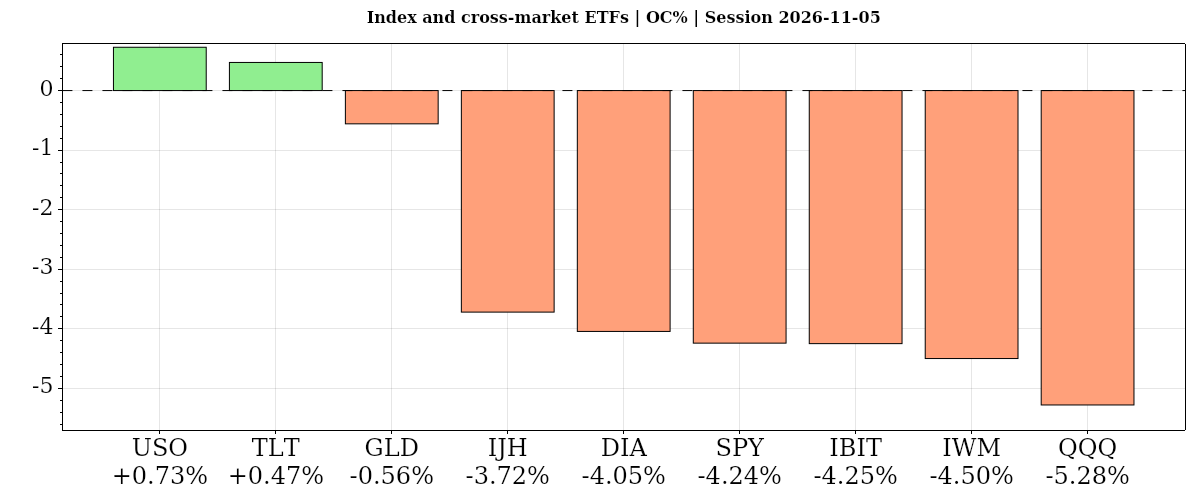
Technicals: Stocks sold off in Thursday's completed session on elevated volume. From the open, the S&P 500 ETF fell 4.24% and the Nasdaq-100 ETF lost 5.28%, while Nvidia dropped 7.38% and Tesla slid 8.13%. Oil and far-term Treasury ETFs rose 0.73% and 0.47%, respectively, from their opens. Gold's ETF slipped 0.56% from the open but finished 0.81% above its prior close. Short- and medium-term equity ETF trends remained weak.
After Market Close daily snapshot: market news summary and sentiment, major ETFs, Magnificent 7 analysis, Indices Futures Higher Time Frame Analysis, and E-mini S&P500, Nasdaq 100, NYMEX Crude, Gold Futures Daily Chart analysis.
As of: November 5, 2026 05:00 CT
Earnings Radar Day Recap
Monitoring for earnings releases by the Magnificent 7, AI-tech-related firms, and major financial institutions.
| Date/Day | Impact | Company / Symbol | Time | EPS | Revenue | ||||
|---|---|---|---|---|---|---|---|---|---|
| 2026-11-05 – Thursday | Medium | Microchip Technology (MCHP) | After close |
|
|
For full details visit: Yahoo Earnings Calendar
EcoNews Radar U.S. Events Day Recap
| Date | Impact | Event, Prev, Forecast, Actual | Info |
|---|---|---|---|
| 2026-11-05 Thursday 08:30 | Medium | Unemployment Claims Prev: 194K Forecast: 197K Actual: — | Measures new applications for unemployment benefits, offering a timely gauge of layoffs that index futures traders monitor for signals about labor demand, economic momentum and monetary policy expectations. |
Summary: The calendar focuses on the health of the U.S. labor market.
Market News Summary:
Technology-led selling pressured equities on November 5 as post-election concerns about AI infrastructure spending dominated market coverage.
Primary Drivers & Risks:
- Primary Driver: Post-election AI data-center buildout concerns
- Primary Risk: Further technology weakness and Friday jobs data
Tone:
Coverage is predominantly negative, with selective bargain-hunting commentary.
Market News Sentiment
Sentiment Bias shows the balance of positive and negative news coverage sampled from 2026-11-04 16:07 to 2026-11-05 15:51 ET, covering stocks, energy and gold.
▼ Market news
- Bias
- ▼ -8.93%
- Articles
- 224
- Positive
- ▲ 27.68%
- Neutral
- — 35.71%
- Negative
- ▼ 36.61%
▲ GLD / Gold
- Bias
- ▲ +43.75%
- Articles
- 16
- Positive
- ▲ 56.25%
- Neutral
- — 31.25%
- Negative
- ▼ 12.50%
Sentiment Summary: Gold coverage leaned positive (56% positive, 13% negative), with November 5 gains above $4,100 extending November 4’s post-midterm rebound; reports linked the move to lower Treasury yields, a softer dollar and falling oil, alongside a Wall Street rally. Central-bank purchases of 321.2 metric tons in the quarter ending September supported the demand backdrop, while elevated real yields, resistance near $4,200 and the upcoming November 6 U.S. jobs report tempered bullish coverage.
Conclusion: The reported equity and gold rebound shared a lower-yield backdrop, making the scheduled payrolls release the central near-term cross-market event.
▲ USO / Oil
- Bias
- ▲ +4.55%
- Articles
- 22
- Positive
- ▲ 36.36%
- Neutral
- — 31.82%
- Negative
- ▼ 31.82%
Sentiment Summary: Coverage was narrowly positive (36% positive versus 32% negative), reflecting cross-market relief as oil fell on reported hopes that Democratic midterm victories would reduce Iran-war escalation, alongside recovering Gulf supply. On November 4, the Dow rose 3%, Treasury yields and the dollar fell, and gold gained; November 5 morning reports showed mixed U.S. futures after that rally. Persistent Iran-related disruptions and tight distillate supplies counterbalanced the de-escalation narrative, while stronger producer earnings reflected earlier higher oil prices rather than the latest decline.
Conclusion: Friday, November 6’s jobs report remained an upcoming catalyst after the post-election relief rally.
Glossary: Sentiment Bias = (positive articles − negative articles) ÷ total articles × 100. It ranges from −100% negative to +100% positive. A reading near zero indicates little directional bias. Neutral articles reduce the score’s strength. ▲ positive; ▼ negative; — balanced. These readings describe news coverage, not market-price direction.
Market Technical Analysis
Analysis of VIX volatility, the completed session in major ETFs and mega-cap tech stocks, and futures snapshots and higher-time-frame analysis.
VIX — Market Fear Gauge Daily
| Level | Open | High | MaxVix | Low | MinVix | DNC% | DOC% | VR | MaxVR | MinVR |
|---|---|---|---|---|---|---|---|---|---|---|
| 28.16 | 17.28 | 28.36 | 23.93 | 17.28 | 15.72 | +69.54% | +62.96% | 15.77 | 24.11 | -0.20 |
VIX rose 62.96% from the session's opening level. VIX rose 69.54% versus the previous session close. Expected volatility rose from the period open. VIX is above the recent 15-session range (15.72–23.93).
VR: ATN Volatility Ratio (VR): 15.77 – Stocks fell while expected volatility rose. VR is in the upper part of its preceding 15-session VR range (-0.20 to 24.11), in the 60–70% band. VR rose 3.51 points from the previous session, a moderate shift relative to that range.
Range lookback: preceding 15 completed sessions.
Major ETFs and Mega Cap Tech Stocks
- The Nasdaq and S&P 500 sold off as investors reduced technology exposure, bringing key 200-day moving averages into focus.
- Nvidia traded 8.7% lower at $182.75 during the afternoon, extending its decline from an October 6 record high of $243.37.
- Tesla and SpaceX had fallen about 14% and 12%, respectively, since the Election Day close, erasing roughly $450 billion in combined market value as of approximately 3:00 p.m. Eastern.
- Meta’s president said Democratic midterm gains complicate data-center construction and acknowledged shortcomings in the industry’s communication of investment benefits.
- Some portfolio managers and commentary emphasized resilient chip demand and intact hyperscaler spending commitments despite the semiconductor selloff.
- Apple sought about $7 billion through its first investment-grade bond sale in more than a year, with proceeds helping fund share buybacks.
Gold / Metals:
- Gold rebounded above $4,000 in its strongest daily performance since August, lifting mining shares.
- The World Bank’s outlook places gold above $4,000 through 2028 while flagging a steeper correction risk for silver.
Macro / Other:
- The October jobs report is scheduled for Friday morning, November 6, following Thursday’s technology-led equity decline.
- One strategist argued that economic growth is slower than investors perceive and favored financials and software.
- October’s asset-class scoreboard showed gains in commodities, U.S. real estate, bonds and cash, while equities declined.
Conclusion:
Concerns about post-election constraints on AI data-center construction drove the technology selloff. Semiconductor losses and reduced technology exposure pressured the Nasdaq and S&P 500.
Friday’s October jobs report is the next identified macro catalyst, with index 200-day moving averages also in focus. Gold’s rebound and commentary highlighting intact AI spending commitments provided cross-currents to the negative equity coverage.
ETF, Mag7, and Cross-Market ETF Insights
Overall Tone
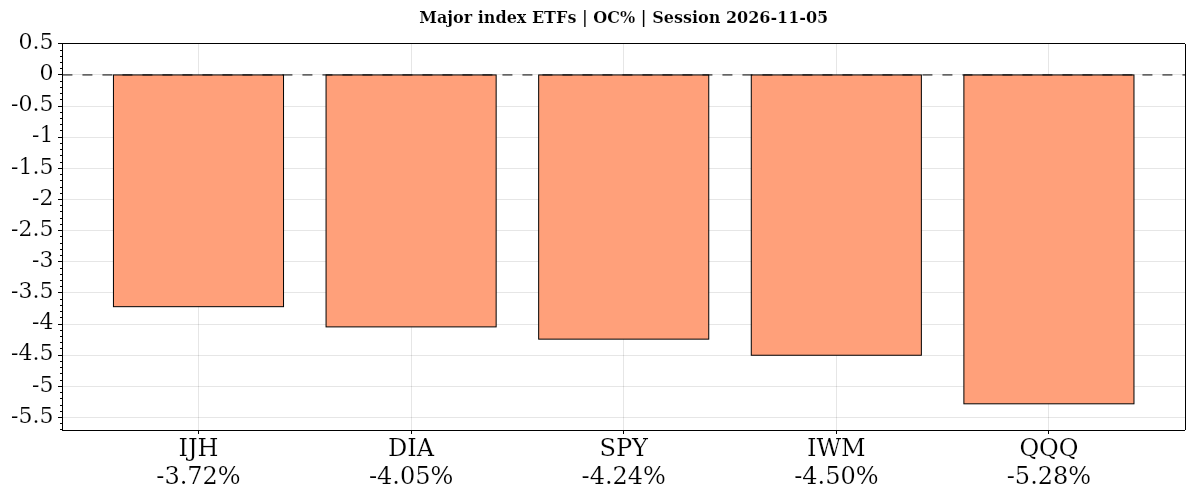
The November 5, 2026 daily session was decisively risk-off, with every index ETF and Mag7 stock falling from the open and versus the prior close.
| Instrument | Bias | Date | DNC% | DOC% | O | H | L | C | VWAP | Vol |
|---|---|---|---|---|---|---|---|---|---|---|
| ▼ IJH | ▼ ▼ ▼ | 2026-11-05 | ▼ -3.90% | ▼ -3.72% | 74.45 | 74.76 | 71.55 | 71.68 | ▼ 72.42 | 14,193,278 |
| ▼ DIA | ▼ ▼ ▼ | 2026-11-05 | ▼ -3.53% | ▼ -4.05% | 535.95 | 536.60 | 514.13 | 514.27 | ▼ 520.12 | 10,832,983 |
| ▼ SPY | ▼ ▼ ▼ | 2026-11-05 | ▼ -4.41% | ▼ -4.24% | 765.47 | 765.97 | 732.71 | 733.00 | ▼ 741.69 | 120,520,518 |
| ▼ IWM | ▼ ▼ ▼ | 2026-11-05 | ▼ -4.59% | ▼ -4.50% | 283.75 | 284.70 | 270.52 | 270.98 | ▼ 274.56 | 50,220,713 |
| ▼ QQQ | ▼ ▼ ▼ | 2026-11-05 | ▼ -6.49% | ▼ -5.28% | 683.12 | 683.65 | 647.05 | 647.05 | ▼ 656.98 | 125,743,846 |
| AVG/Sum | — | — | -4.58% | -4.36% | — | — | — | — | — | 321,511,338 |
Index ETFs
Negative confluence: average DOC% -4.36% from the open and DNC% -4.58% versus the prior close. IJH led relatively from the open while QQQ lagged; DIA was most resilient versus the prior close, with QQQ again weakest. All five closed below VWAP on extreme ranges and above-average volume.
IJH · D:2026-11-05 NC% ▼ -3.90% OC% ▼ -3.72%
IJH – Mid Cap Technicals Summary
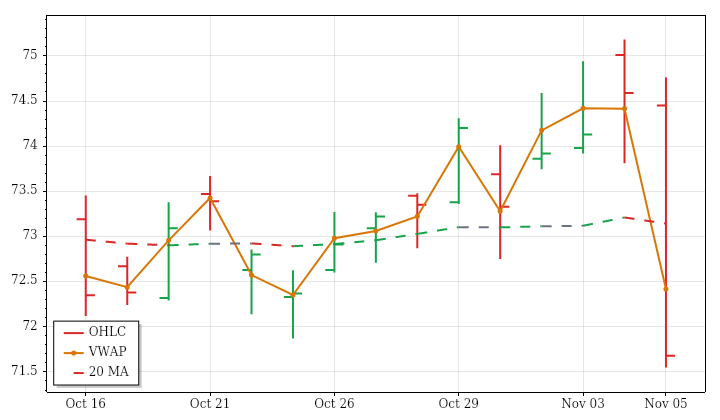
IJH's completed November 5 daily session closed at 71.68, losing 3.90% versus the prior close and 3.72% from the open. The small opening gap lower was filled before the session finished below the prior day's low, near its own low and well beneath VWAP. This sharp reversal contrasts with the upward price trend across the preceding 15 sessions.
Price is below all three moving-average benchmarks. The intermediate average is falling, confirming a downtrend there, while rising near- and far-term averages leave those horizons mixed. The day's range was about 3.59 times average and volume nearly twice average, extending expanding ranges and slightly increasing activity over the lookback. Six consecutive large-range bars underscore the sustained volatility. PSAR was in a short state despite a positive ATR-median trend; a next-session high above 75.18 would conditionally reverse PSAR upward.
DIA · D:2026-11-05 NC% ▼ -3.53% OC% ▼ -4.05%
DIA – Dow Jones Technicals Summary
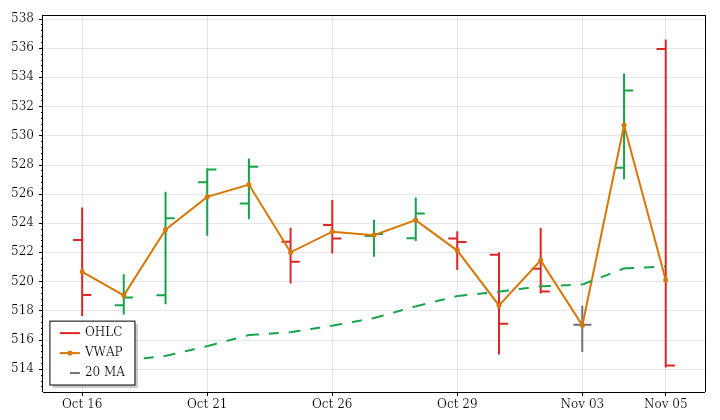
DIA's completed November 5 daily session erased an opening gap higher and closed at 514.27, down 3.53% from the prior close and 4.05% from the open. The outside bar ended below the prior day's low, near its own low and well below session VWAP. Those features distinguish the day's sharp weakness from the modest upward price trend over the preceding 15 sessions.
Price finished below near-, intermediate- and far-term benchmarks even though all three averages were still rising. This leaves every horizon mixed rather than establishing fully aligned moving-average downtrends. The range was approximately 4.81 times average, sharply opposing the lookback's contracting ranges, while volume exceeded three times average amid increasing activity. PSAR was in a short state, although ATR-median crossed bullishly. A next-session high above 536.6 would trigger a conditional upward PSAR reversal.
SPY · D:2026-11-05 NC% ▼ -4.41% OC% ▼ -4.24%
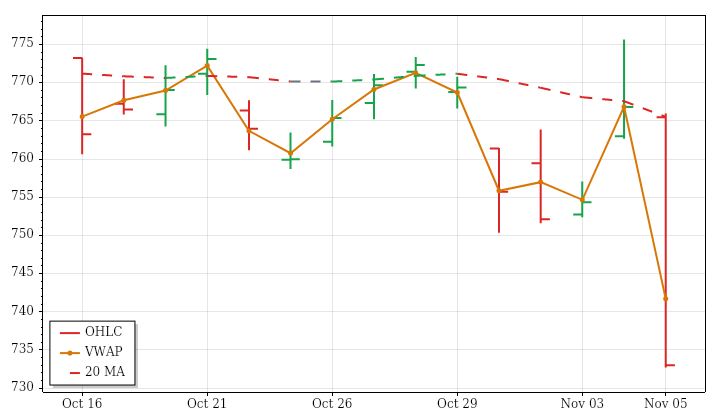
SPY – S&P 500 Technicals Summary
SPY's completed November 5 daily session closed at 733, down 4.41% versus the prior close and 4.24% from the open. The opening gap lower remained unfilled, and a lower high and lower low ended beneath the prior day's low. Finishing near the session low and well below VWAP adds to the evidence of sustained intraday weakness.
Near- and intermediate-term averages are falling with price below them, while the rising far-term average leaves that horizon mixed because price is also below its benchmark. The prior 15-session price trend was downward but highly inefficient, so the latest decisive decline contrasts with that window's extensive back-and-forth movement. Range reached roughly 4.44 times average and volume 2.76 times average, reinforcing expanding ranges and increasing activity. PSAR and ATR-median were negative; a next-session high above 775.64 would conditionally reverse PSAR upward.
S&P 500 News and Fundamentals
S&P 500 futures were steady early on November 5 following a midterm-election rally. Nvidia, Microsoft, Apple, Amazon, Alphabet and Meta together accounted for 30.8% of the index in early November 2026, underscoring its concentration in a small group of technology-related companies.
IWM · D:2026-11-05 NC% ▼ -4.59% OC% ▼ -4.50%
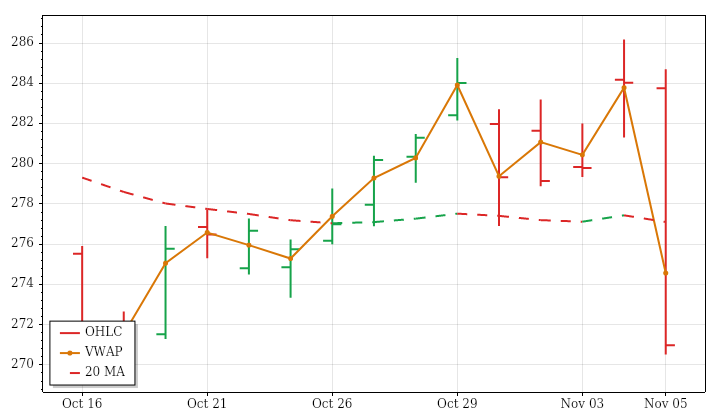
IWM – Small Cap Technicals Summary
IWM's completed November 5 daily session closed at 270.98, down 4.59% from the prior close and 4.50% from the open. After filling a small opening gap lower, price made a lower high and lower low and finished beneath the prior day's low. The close near the session low and substantially below VWAP underscores the day's weakness.
That decline conflicts with the upward 15-session price trend and rising near-term average. Price nevertheless sits below near-, intermediate- and far-term benchmarks; only the intermediate average is falling, leaving the other horizons mixed. Range expanded to roughly 3.83 times average and volume exceeded twice average, sharply contrasting with contracting ranges and decreasing volume over the lookback. PSAR's short state also conflicts with a positive ATR-median trend. A next-session high above 286.17 would conditionally trigger an upward PSAR reversal.
QQQ · D:2026-11-05 NC% ▼ -6.49% OC% ▼ -5.28%
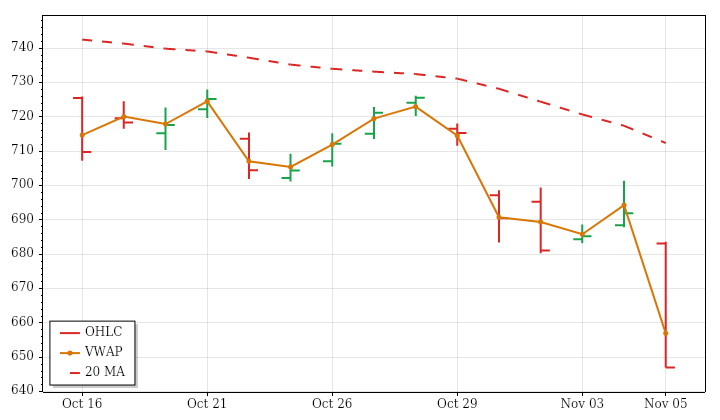
QQQ – Nasdaq 100 Technicals Summary
QQQ's completed November 5 daily session closed at 647.05, down 6.49% from the prior close and 5.28% from the open. Its opening gap below the prior day's range remained unfilled, and subsequent weakness produced a lower high and lower low. The close beneath the prior day's low, near the session low and well below VWAP reinforced the negative daily structure.
Near- and intermediate-term downtrends align with the downward 15-session price trend. The far-term average still rises, but price is below it, leaving a conflict between current position and longer-term direction. The day's range exceeded three times average despite contracting lookback ranges, while volume reached about 2.75 times average alongside increasing activity. PSAR and ATR-median remained negative. A next-session high above 708.7277 would conditionally trigger an upward PSAR reversal, rather than indicate one already occurred.
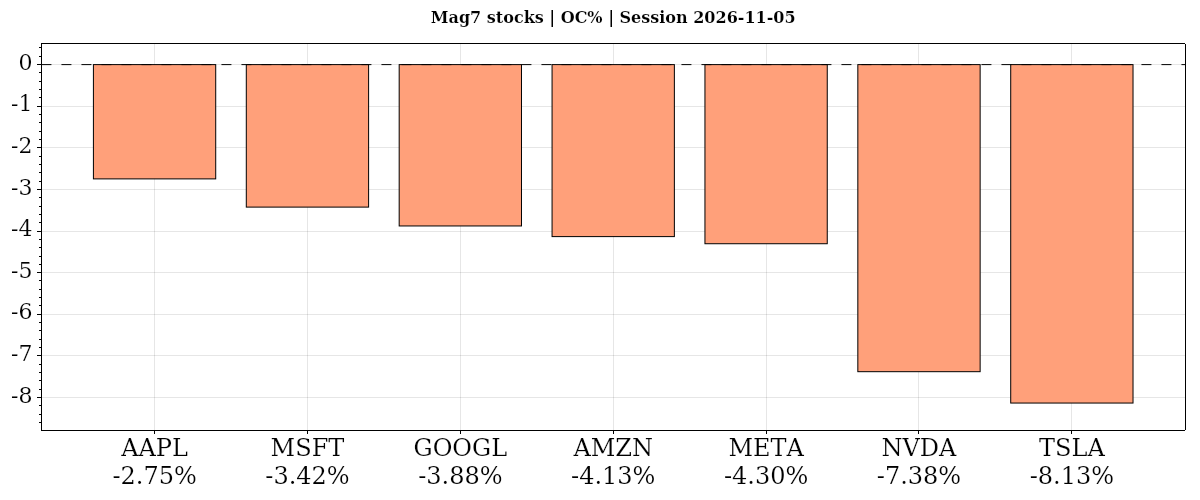
| Instrument | Bias | Date | DNC% | DOC% | O | H | L | C | VWAP | Vol |
|---|---|---|---|---|---|---|---|---|---|---|
| ▼ AAPL | ▼ ▼ ▼ | 2026-11-05 | ▼ -1.53% | ▼ -2.75% | 353.89 | 355.38 | 342.06 | 344.17 | ▼ 346.73 | 73,330,042 |
| ▼ MSFT | ▼ ▼ ▼ | 2026-11-05 | ▼ -3.58% | ▼ -3.42% | 554.93 | 557.62 | 532.67 | 535.93 | ▼ 540.29 | 41,613,881 |
| ▼ GOOGL | ▼ ▼ ▼ | 2026-11-05 | ▼ -2.20% | ▼ -3.88% | 293.97 | 295.60 | 277.07 | 282.57 | ▼ 284.55 | 52,763,840 |
| ▼ AMZN | ▼ ▼ ▼ | 2026-11-05 | ▼ -2.19% | ▼ -4.13% | 271.43 | 273.23 | 252.27 | 260.21 | ▼ 260.72 | 83,701,181 |
| ▼ META | ▼ ▼ ▲ | 2026-11-05 | ▼ -3.96% | ▼ -4.30% | 632.30 | 634.99 | 583.80 | 605.08 | ▲ 604.50 | 28,014,757 |
| ▼ NVDA | ▼ ▼ ▼ | 2026-11-05 | ▼ -9.26% | ▼ -7.38% | 196.07 | 196.25 | 181.46 | 181.60 | ▼ 185.18 | 301,704,199 |
| ▼ TSLA | ▼ ▼ ▼ | 2026-11-05 | ▼ -10.77% | ▼ -8.13% | 374.12 | 374.30 | 338.15 | 343.69 | ▼ 347.27 | 78,586,825 |
| AVG/Sum | — | — | -4.78% | -4.86% | — | — | — | — | — | 659,714,725 |
Mag7 Stocks
Negative confluence: average DOC% -4.86% from the open and DNC% -4.78% versus the prior close. Apple led relatively on both comparisons, while Tesla lagged, dropping 8.13% from the open and 10.77% versus the prior close, followed by Nvidia. All seven declined on both measures, although Apple retained rising moving-average structures across horizons.
AAPL · D:2026-11-05 NC% ▼ -1.53% OC% ▼ -2.75%
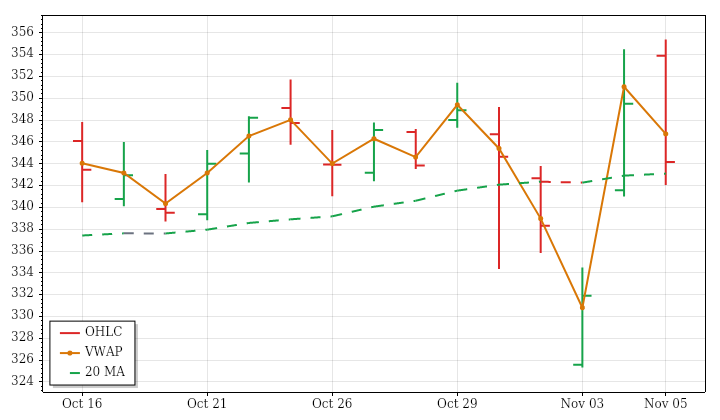
AAPL – Apple Technicals Summary
AAPL's completed November 5 daily session reversed an opening gap higher and closed at 344.17, down 1.53% from the prior close and 2.75% from the open. Although it made a higher high and higher low, the close returned inside the prior day's range and finished below session VWAP. That combination shows intraday weakness without a uniformly lower daily price structure.
The decline conflicts with rising near-, intermediate- and far-term averages, with price still above all three benchmarks. Meanwhile, the prior 15-session price trend was slightly downward and inefficient, indicating considerable back-and-forth movement. The day's range was roughly 1.87 times average and volume was elevated, extending the lookback pattern of expanding ranges and increasing activity. PSAR remained in an upward state; only a next-session low below 326.8325 would trigger its downward reversal.
Apple News and Fundamentals
Apple is seeking about $7 billion in its first investment-grade bond sale in more than a year, with proceeds helping fund share buybacks. Upcoming iOS 27.3 features will let Siri control apps, perform complex tasks and coordinate actions across applications. Strong premium-iPhone demand faces supply constraints, with the $1,999 iPhone Duo sold out into January. December-quarter gross margin was guided to 45–46% amid rising memory costs. Apple is also preparing tighter restrictions on dating apps and AI companions.
MSFT · D:2026-11-05 NC% ▼ -3.58% OC% ▼ -3.42%
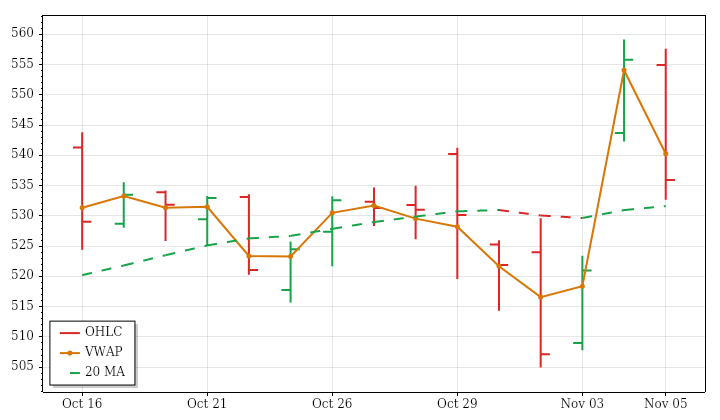
MSFT – Microsoft Technicals Summary
MSFT's completed November 5 daily session closed at 535.93, down 3.58% versus the prior close and 3.42% from the open. The small opening gap lower was filled, but a lower high and lower low left the close below the prior day's low and session VWAP. The weakness therefore extended beyond the opening decline into the completed trading session.
Price still stands above rising intermediate- and far-term averages, preserving those uptrends. Near-term conditions are mixed because price is above a falling benchmark, consistent with the slightly downward and inefficient 15-session price trend. Range was nearly twice average and volume about 1.65 times average, following expanding ranges and increasing activity across the lookback. This was the sixth consecutive large-range bar. PSAR remained upward and ATR-median crossed bullishly; a next-session low below 507.6695 would conditionally reverse PSAR downward.
Microsoft News and Fundamentals
Microsoft’s Azure revenue increased 48% to $33.2 billion, and management forecast further growth of 49–50% despite infrastructure delivery constraints. Foundry exceeded 120,000 customers, while GPU deployment times improved 20%. Free cash flow fell 27% to $18.6 billion as infrastructure investment accelerated, although operating cash flow rose 29%. Bloomberg reported Microsoft was tightening oversight of neocloud data-center projects, while the Financial Times reported it rejected a multibillion-dollar AI deal with Britain’s Nscale.
GOOGL · D:2026-11-05 NC% ▼ -2.20% OC% ▼ -3.88%
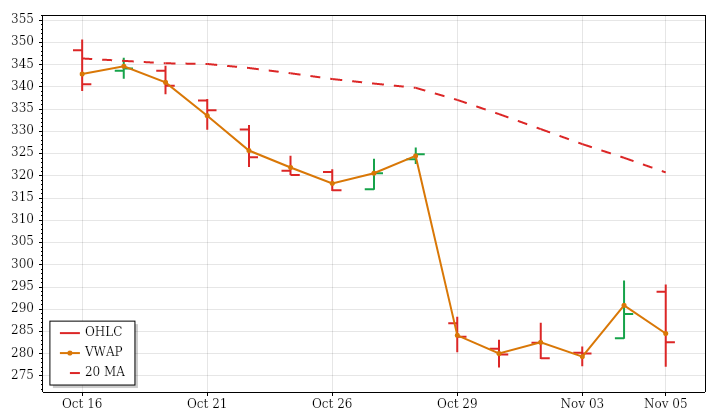
GOOGL – Alphabet Technicals Summary
GOOGL's completed November 5 daily session reversed its opening gap higher and closed at 282.57, down 2.20% from the prior close and 3.88% from the open. A lower high and lower low culminated in a close beneath the prior day's low and session VWAP. The latest weakness therefore reinforced, rather than contradicted, the established price direction.
Near-, intermediate- and far-term downtrends are aligned, with price below falling averages at every horizon. The prior 15-session decline also showed more directional progress than the choppier structures evident in many other supplied instruments. The day's range was about 2.52 times average despite a contracting lookback range trend, while above-average volume accompanied an already increasing activity trend. Both PSAR and ATR-median remained negative. A next-session high above 296.49 would trigger a conditional upward PSAR reversal, not confirm one in this completed session.
AMZN · D:2026-11-05 NC% ▼ -2.19% OC% ▼ -4.13%
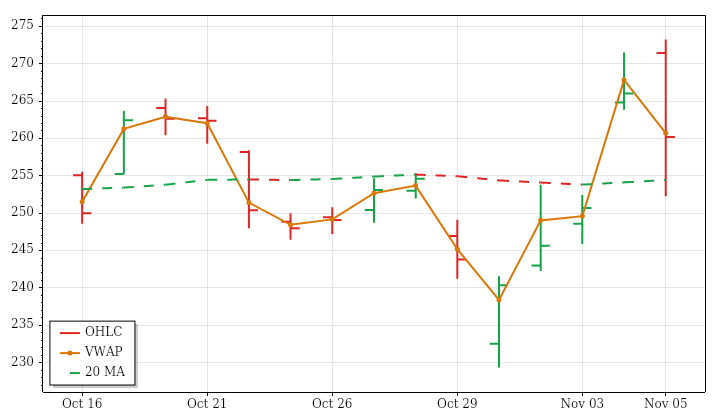
AMZN – Amazon Technicals Summary
AMZN's completed November 5 daily session surrendered its opening gap higher and closed at 260.21, down 2.19% versus the prior close and 4.13% from the open. The outside bar finished below the prior day's low and slightly below session VWAP, making the intraday reversal more consequential than the opening strength.
Near- and intermediate-term conditions remain mixed: price is above those benchmarks, but their averages are falling. The far-term structure remains rising, so the latest decline and the downward 15-session price trend conflict with that broader alignment. Range reached almost three times average, while volume was about 1.67 times average, reinforcing an existing expansion in range and activity. Indicator evidence was not uniformly bearish, with an upward PSAR state and a bullish ATR-median crossover. A next-session low below 236.6907 would conditionally reverse PSAR downward.
Amazon News and Fundamentals
AWS revenue rose 39.3% to $46 billion, with a 38.7% operating margin and 63% of Amazon’s operating income. Bedrock token usage increased nearly 17-fold, while custom chips saved customers more than $2 billion during Q3. In newly unredacted details from an August lawsuit, the FTC alleged Amazon misled advertisers about the causes of advertising-price increases. Amazon also launched an Uber Eats partnership allowing Prime members to order through Amazon without delivery fees on orders of at least $25.
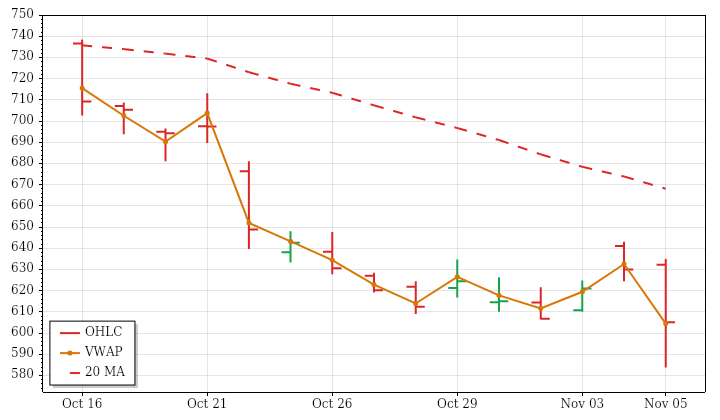
META · D:2026-11-05 NC% ▼ -3.96% OC% ▼ -4.30%
META – Meta Platforms Technicals Summary
META's completed November 5 daily session erased a small opening gap higher and closed at 605.08, down 3.96% from the prior close and 4.30% from the open. Its lower high and lower low ended below the prior day's low. Unlike the broader bearish daily structure, however, the close held marginally above session VWAP, providing a limited intraday counterpoint rather than evidence of a trend reversal.
Near- and intermediate-term downtrends align with the downward 15-session price trend. The far-term average is still rising, but price remains below it, leaving that horizon mixed. Range was about 2.55 times average despite a contracting lookback range trend; volume was only modestly above average alongside increasing activity. PSAR and ATR-median were negative. A next-session high above 643.09 would conditionally reverse PSAR upward, while the completed session itself supplies no such reversal.
Meta News and Fundamentals
Meta announced on November 5 that Muse Voice is available to all U.S. users, enabling voice and video conversations with its consumer AI agent, Muse. President Dina Powell McCormick warned that Democratic midterm victories would make data-center construction harder. She said the industry had not adequately explained the benefits of its investments, highlighting political resistance as a risk to AI infrastructure expansion.
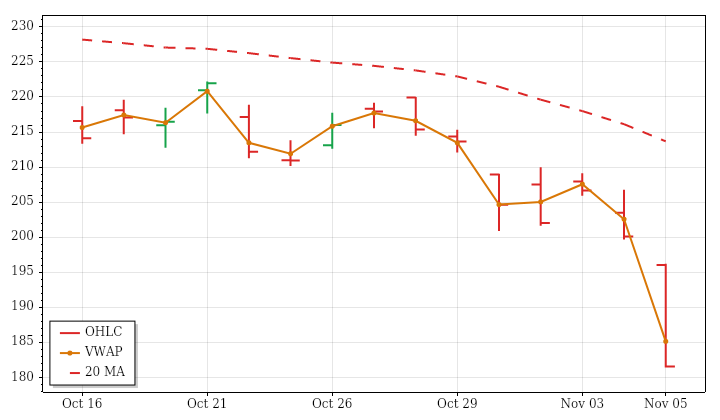
NVDA · D:2026-11-05 NC% ▼ -9.26% OC% ▼ -7.38%
NVDA – Nvidia Technicals Summary
NVDA's completed November 5 daily session closed at 181.6, down 9.26% from the prior close and 7.38% from the open. An opening gap below the prior day's range remained unfilled, followed by a lower high and lower low. The finish near the session low and below VWAP shows that weakness persisted after the opening loss rather than being confined to it.
Near- and intermediate-term downtrends align with the declining 15-session price trend. The far-term average remains rising, but price is below it, leaving that horizon mixed rather than fully bearish. Range was approximately 2.71 times average and volume 2.83 times average, reinforcing expanding ranges and increasing activity in the lookback. Both PSAR and ATR-median remained negative. A next-session high above 213.6335 would trigger a conditional upward PSAR reversal; it is not a signal established by this session.
Nvidia News and Fundamentals
Box announced on November 5 that its new Content Retrieval feature will integrate Nvidia’s Nemotron embedding system into its core product, using embedded metadata to improve AI agents’ responses to queries. Separately, sources told CNBC that Chinese AI lab Moonshot had sought access to advanced Nvidia chips hosted in Europe amid U.S. restrictions on China. The report highlighted access to Nvidia chips as a continuing geopolitical flashpoint.
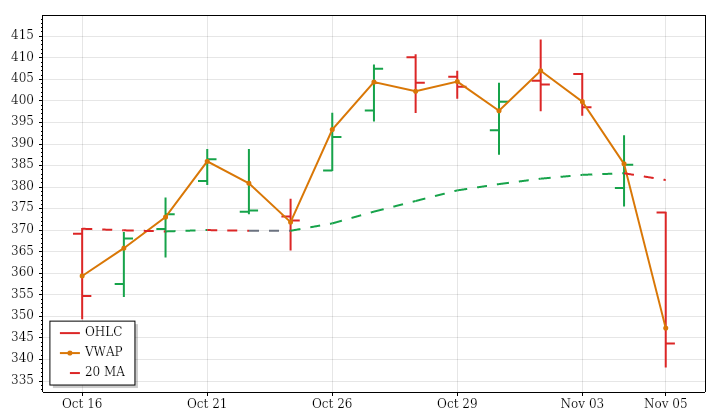
TSLA · D:2026-11-05 NC% ▼ -10.77% OC% ▼ -8.13%
TSLA – Tesla Technicals Summary
TSLA's completed November 5 daily session closed at 343.69, down 10.77% from the prior close and 8.13% from the open. An opening gap below the prior day's range remained unfilled, followed by a lower high and lower low. The close beneath the prior day's low and session VWAP confirms that the daily loss included substantial weakness after the open.
This decline conflicts with the upward 15-session price trend and still-rising near- and intermediate-term averages. Price is below both benchmarks, leaving those horizons mixed, while the far-term downtrend is aligned with the latest weakness. Range was about 2.70 times average and volume nearly twice average. That activity contrasts with decreasing lookback volume, while ranges had been only marginally expanding. PSAR was negative despite a positive ATR-median trend; a next-session high above 410.426 would conditionally reverse PSAR upward.
| Instrument | Bias | Date | DNC% | DOC% | O | H | L | C | VWAP | Vol |
|---|---|---|---|---|---|---|---|---|---|---|
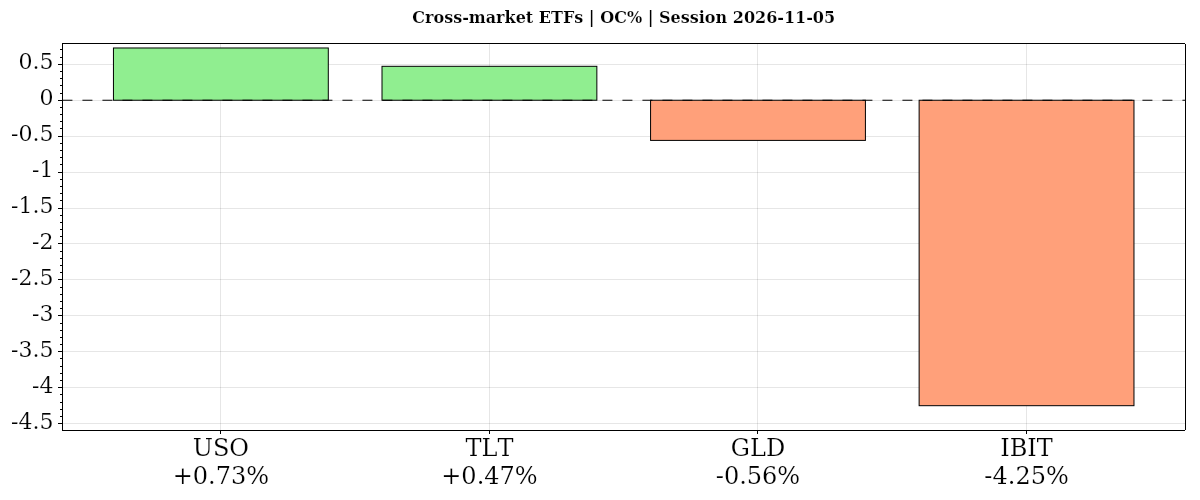
| ▲ USO | ▲ ▲ ▲ | 2026-11-05 | ▲ +1.93% | ▲ +0.73% | 147.14 | 148.93 | 145.81 | 148.21 | ▲ 147.72 | 5,262,052 |
| ▲ TLT | ▲ ▲ ▼ | 2026-11-05 | ▲ +0.21% | ▲ +0.47% | 81.55 | 82.21 | 81.54 | 81.93 | ▼ 81.98 | 50,094,682 |
| ▼ GLD | ▲ ▼ ▼ | 2026-11-05 | ▲ +0.81% | ▼ -0.56% | 377.60 | 378.97 | 373.42 | 375.49 | ▼ 376.24 | 12,194,360 |
| ▼ IBIT | ▼ ▼ ▼ | 2026-11-05 | ▼ -5.07% | ▼ -4.25% | 44.94 | 45.02 | 42.66 | 43.03 | ▼ 43.27 | 68,022,134 |
| AVG/Sum | — | — | -0.53% | -0.90% | — | — | — | — | — | 135,573,228 |
Cross-Market ETFs
Negative confluence: average DOC% -0.90% from the open and DNC% -0.53% versus the prior close. Oil led from the open and versus the prior close; bonds also gained against equity weakness, while bitcoin lagged. Gold fell from the open but gained versus the prior close, despite falling longer-term averages.
USO · D:2026-11-05 NC% ▲ +1.93% OC% ▲ +0.73%
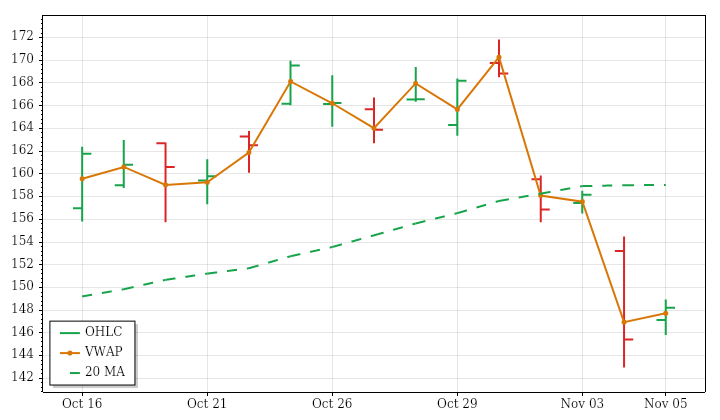
USO – Oil Technicals Summary
USO's completed November 5 daily session closed at 148.21, up 1.93% from the prior close and 0.73% from the open. Its opening gap higher remained unfilled, and the close finished above VWAP near the session high. However, the entire session stayed inside the prior day's range, making this a contained advance rather than a broader daily breakout.
Near- and intermediate-term conditions remain mixed: price is below their benchmarks even though both averages are rising. The far-term uptrend remains intact, while the downward 15-session price trend highlights the conflict between recent weakness and the broader structure. Range was only about two-thirds of average and volume was below average, opposing lookback trends of expanding ranges and increasing activity. PSAR and ATR-median remained negative. A next-session high above 166.9483 would conditionally trigger an upward PSAR reversal, not confirm one now.
TLT · D:2026-11-05 NC% ▲ +0.21% OC% ▲ +0.47%
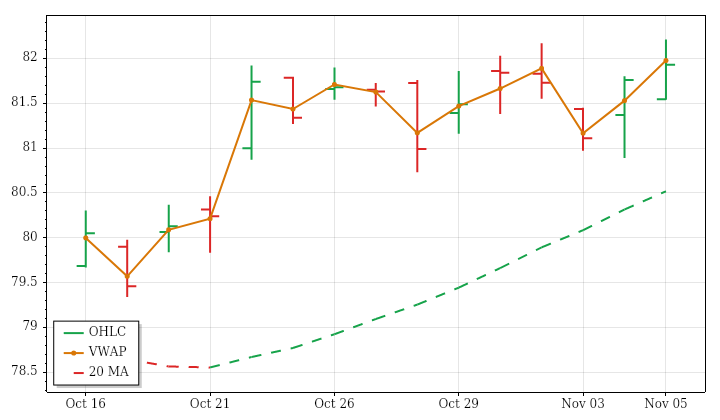
TLT – Long-Term Treasury Bonds Technicals Summary
TLT's completed November 5 daily session closed at 81.93, gaining 0.21% versus the prior close and 0.47% from the open. It filled an opening gap lower, made a higher high and higher low, and finished above the prior day's high. The close nevertheless remained slightly below session VWAP, tempering an otherwise constructive daily price structure.
Near- and intermediate-term uptrends align with the upward 15-session price trend, with price above rising averages. The far-term structure remains a downtrend, so recent strength has not resolved the longer-horizon conflict. Range was only slightly above average, consistent with gradual lookback expansion. Volume was about 29% above average despite a decreasing volume trend over that window. PSAR was in a long state and ATR-median remained positive. A next-session low below 80.89 would trigger a conditional downward PSAR reversal.
Treasury Bonds News and Fundamentals
Bond investors were preparing for a potential 2027 debt-ceiling confrontation following Democratic midterm victories. Treasury’s remaining borrowing capacity was reported to be shrinking faster than its plans suggested, bringing federal financing constraints into focus.
GLD · D:2026-11-05 NC% ▲ +0.81% OC% ▼ -0.56%
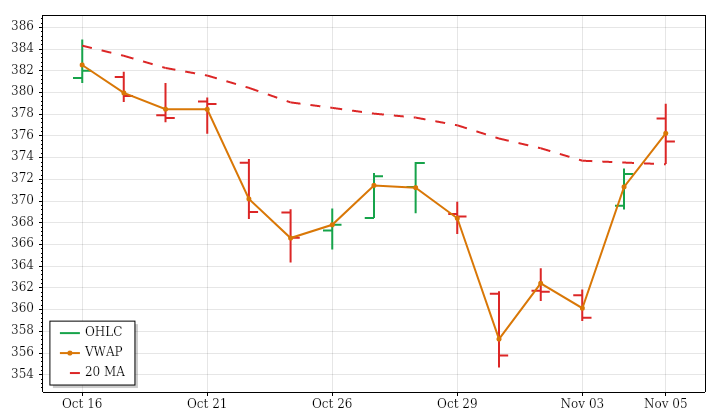
GLD – Gold Technicals Summary
GLD's completed November 5 daily session gained 0.81% versus the prior close but lost 0.56% from the open, closing at 375.49. Its opening gap higher remained unfilled, and the close held above the prior day's high. Nevertheless, finishing below both the open and session VWAP tempers the strength implied by the positive daily return.
The advance sits against intermediate- and far-term downtrends, with price below falling averages. Near-term conditions are mixed because price is above its benchmark while that average continues to fall. The prior 15-session trend was also downward, though highly inefficient, reflecting substantial two-way movement. Range and volume were moderately above average, consistent with expanding ranges and increasing activity across that window. PSAR's upward state contrasts with the negative ATR-median trend; a next-session low below 355.885 would conditionally reverse PSAR downward.
Gold News and Fundamentals
Gold traded above $4,100 in early U.S. trading on November 5, extending Wednesday’s sharp gains, with reports citing lower Treasury yields and a softer dollar as support. Central banks added 321.2 metric tons of gold in the three months ending September, exceeding jewelry purchases of roughly 312 metric tons. Elevated real yields remained a concern for the rally, while Friday’s U.S. jobs report was an upcoming catalyst.
IBIT · D:2026-11-05 NC% ▼ -5.07% OC% ▼ -4.25%
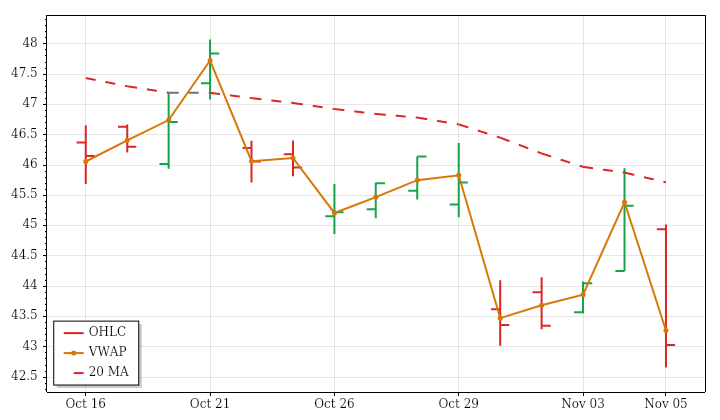
IBIT – Bitcoin Technicals Summary
IBIT's completed November 5 daily session closed at 43.03, down 5.07% from the prior close and 4.25% from the open. Its opening gap lower remained unfilled, and a lower high and lower low ended with price below the prior day's low and session VWAP. The larger prior-close loss includes the opening decline as well as the subsequent intraday weakness.
The near-term downtrend agrees with the downward 15-session price trend. Intermediate conditions are mixed because price is below a still-rising average, while the far-term uptrend remains intact with price above its rising benchmark. Thus, shorter-term deterioration has not produced full alignment across horizons. Range was approximately 2.51 times average despite slightly contracting lookback ranges, and elevated volume followed an increasing activity trend. PSAR and ATR-median remained negative; a next-session high above 45.945 would conditionally reverse PSAR upward.
Glossary: Instrument — ticker symbol; hover for the instrument or company name; Date — session date. DNC% — prior-session close to this session’s close; DOC% — daily session open-to-close percentage change. O — open; H — high; L — low; C — close, all for the table’s daily or weekly session; VWAP — volume-weighted average price; its arrow shows whether the close is above or below VWAP. Vol — period trading volume.
Bias — three directional readings, in order: DNC%, DOC%, then VWAP. ▲ positive/above; ▼ negative/below; — neutral or unavailable. Matching arrows show alignment; opposing arrows show mixed conditions. AVG/Sum — simple average of percentage changes and sum of reported volumes.
Futures Session Fib Grid Analysis – Snapshot
Session Fib Grids normalise market positioning as percentages, making direction and alignment comparable across different asset types.
Latest available snapshot for each instrument; Time(CT) shows the individual update date and time.
| Instrument | Bias | Time(CT) | YSFG | MSFG | WSFG | RSFG | SFG | TSI |
|---|---|---|---|---|---|---|---|---|
| ▼ ES | ▲ ▼ ▼ ▼ ▼ ▼ | 2026-11-05 15:59:57 | ▲ +19 | ▼ -90 | ▼ -145 | ▼ -369 | ▼ -369 | ▼ -243 |
| ▼ NQ | ▼ ▼ ▼ ▼ ▼ ▼ | 2026-11-05 15:59:58 | ▼ -1 | ▼ -77 | ▼ -134 | ▼ -239 | ▼ -239 | ▼ -203 |
| ▼ YM | ▲ ▼ ▼ ▼ ▼ ▼ | 2026-11-05 15:59:59 | ▲ +18 | ▼ -29 | ▼ -53 | ▼ -354 | ▼ -354 | ▼ -267 |
| ▼ EMD | ▲ ▼ ▼ ▼ ▼ ▼ | 2026-11-05 15:59:19 | ▲ +15 | ▼ -65 | ▼ -108 | ▼ -313 | ▼ -313 | ▼ -261 |
| ▼ RTY | ▲ ▼ ▼ ▼ ▼ ▼ | 2026-11-05 15:59:54 | ▲ +20 | ▼ -68 | ▼ -108 | ▼ -313 | ▼ -313 | ▼ -193 |
| ▼ FDAX | ▲ ▲ ▲ ▼ ▼ ▼ | 2026-11-05 15:04:14 | ▲ +35 | ▲ +26 | ▲ +41 | ▼ -107 | ▼ -121 | ▼ -169 |
| ▼ NKD | ▲ ▼ ▼ ▼ ▼ ▼ | 2026-11-05 15:59:59 | ▲ +77 | ▼ -67 | ▼ -130 | ▼ -365 | ▼ -206 | ▼ -296 |
| Instrument | Bias | Time(CT) | YSFG | MSFG | WSFG | RSFG | SFG | TSI |
|---|---|---|---|---|---|---|---|---|
| ▼ BTC | ▼ ▼ ▼ ▼ ▼ ▼ | 2026-11-05 16:15:25 | ▼ -53 | ▼ -13 | ▼ -34 | ▼ -152 | ▼ -145 | ▼ -74 |
| ▼ GC | ▼ ▲ ▲ ▼ ▼ ▼ | 2026-11-05 15:59:58 | ▼ -126 | ▲ +49 | ▲ +114 | ▼ -33 | ▼ -40 | ▼ -115 |
| ▲ CL | ▲ ▼ ▼ ▲ ▲ ▲ | 2026-11-05 15:59:59 | ▲ +157 | ▼ -58 | ▼ -142 | ▲ +44 | ▲ +34 | ▲ +142 |
| ▼ 6E | ▼ ▲ ▲ ▼ ▲ ▼ | 2026-11-05 15:59:57 | ▼ -55 | ▲ +25 | ▲ +52 | ▼ -3 | ▲ +6 | ▼ -47 |
| ▼ ZB | ▼ ▲ ▲ ▼ ▼ ▲ | 2026-10-21 09:39:59 | ▼ -39 | ▲ +77 | ▲ +6 | ▼ -3 | ▼ -2 | ▲ +29 |
Glossary: YSFG — yearly; MSFG — monthly; WSFG — weekly; RSFG — regular trading hours (RTH); SFG — the current session, including pre-market or other sessions. TSI indicates trend strength and power.
Bias shows trend alignment across these six readings. The arrows follow the column order: YSFG, MSFG, WSFG, RSFG, SFG and TSI. Matching arrows show alignment; opposing arrows show mixed conditions.
Futures Higher Time Frame Analysis
Summary of the current state of US Indices Futures based on higher time-frame (HTF) technical analysis as of: 2026-11-05 16:00 -05:00 CT.
US Indices Futures
- ES YSFG/MSFG/WSFG upward, weekly benchmarks mixed, daily pivots UTrend, resistance 7727.25–7738.75 then 7906.25, weekly pivot support 7587.75.
- NQ YSFG upward, MSFG/WSFG below F0%, below 5–100-day benchmarks, pivots DTrend, support 27615.75–27500.75, weekly reversal reference 28901.25.
- YM YSFG/MSFG/WSFG above reference zones, all daily benchmarks rising beneath price, pivots UTrend, resistance 54259/55316, daily reversal reference 52631, support 50859.
- EMD YSFG/MSFG/WSFG above F0%, daily benchmarks reclaimed except 100-day, daily pivots UTrend versus weekly DTrend, resistance 3770.1–3793.9, support 3686.3/3600.3.
- RTY YSFG upward, MSFG/WSFG reclaimed, below declining daily 100-day benchmark, daily pivots UTrend versus weekly DTrend, resistance 2888.7–2889.1/2945.5, support 2800.5/2723.3.
- FDAX YSFG/MSFG upward, WSFG extended at 99%, above all rising benchmarks, pivots/HiLo UTrend, resistance 26765–26876, daily reversal reference 25974, support 24925.
Overall State
- Short-Term: Bullish
- Intermediate-Term: Bullish
- Long-Term: Bullish
Conclusion
HTF alignment remains predominantly bullish, with YM and FDAX leading through rising benchmarks and aligned upward pivot structures. ES and EMD retain broader upward structures while testing overhead benchmark and pivot resistance. RTY’s daily recovery contrasts with its weekly DTrend pivots and daily HiLo DTrend. NQ lags, with MSFG/WSFG below F0%, declining short-term benchmarks and downward pivots, despite an intact yearly uptrend. Recent daily recoveries across the other instruments contrast with NQ’s downswing; nearby resistance tests and elevated ranges distinguish the current recovery phase.
Note: Intra-day counter-trend pullbacks or retracements may occur, HTF is context for informational usage and market structure. Glossary: Session Fib Grids periods of YSFG:’Yearly’, MSFG:’Monthly’, WSFG:’Weekly’
For full details visit: AlphaWebTrader Technicals
SPY Daily View
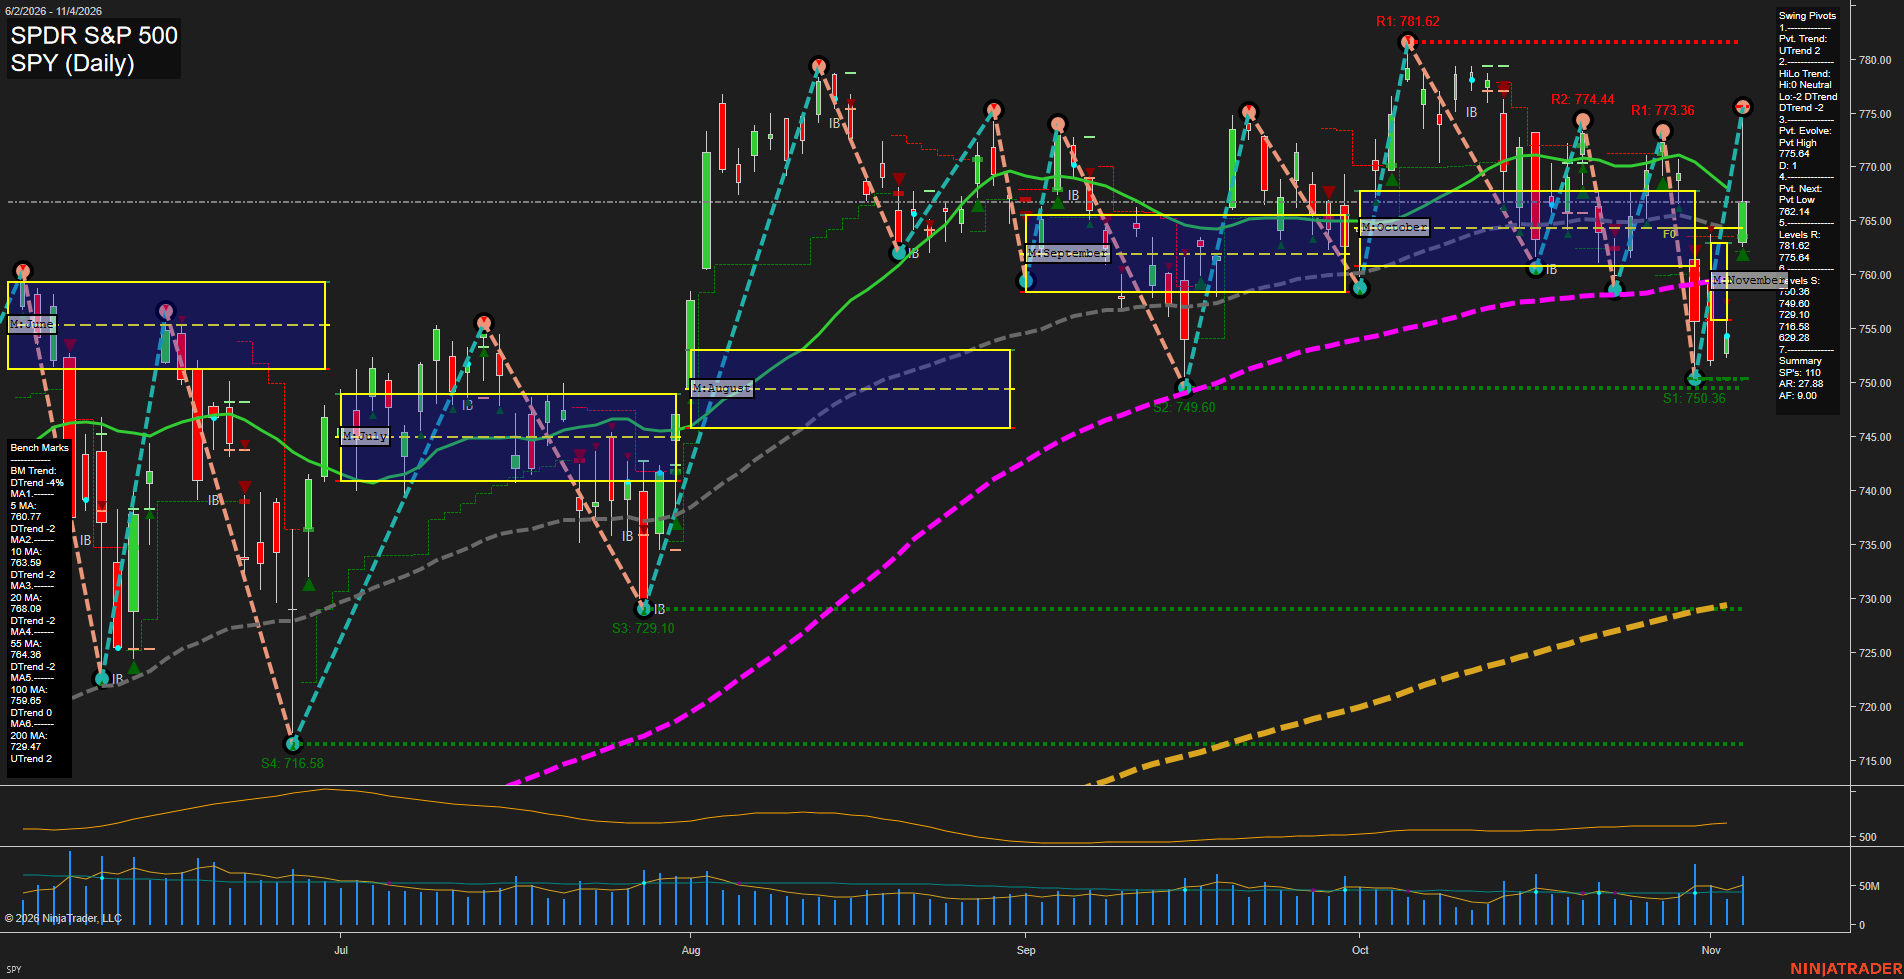
Overall Rating
- Short-Term: Bullish
- Intermediate-Term: Neutral
- Long-Term: Bullish.
Key Insights Summary
SPY/ES-equivalent daily structure reflects a sharp V-style recovery from the 750 area, with price reclaiming the 55-day benchmark and turning the short-term pivot trend upward. The recovery remains high-volatility and rotational rather than a clean intermediate-term breakout because price is testing the declining 20-day average near 768.69 and remains beneath the 773.64 to 775.64 pivot-resistance zone. The 762.14 pivot-next level and 759.36 support define the nearby retracement structure, while a sustained move through the upper pivot zone would place 781.62 in focus. Longer-term structure remains constructive above the rising 200-day average, although the declining 100-day average and mixed intermediate moving averages describe a choppy consolidation phase rather than a fully synchronized trend advance.
View charts on: AlphaWebTrader HTF Charts
ES Daily View
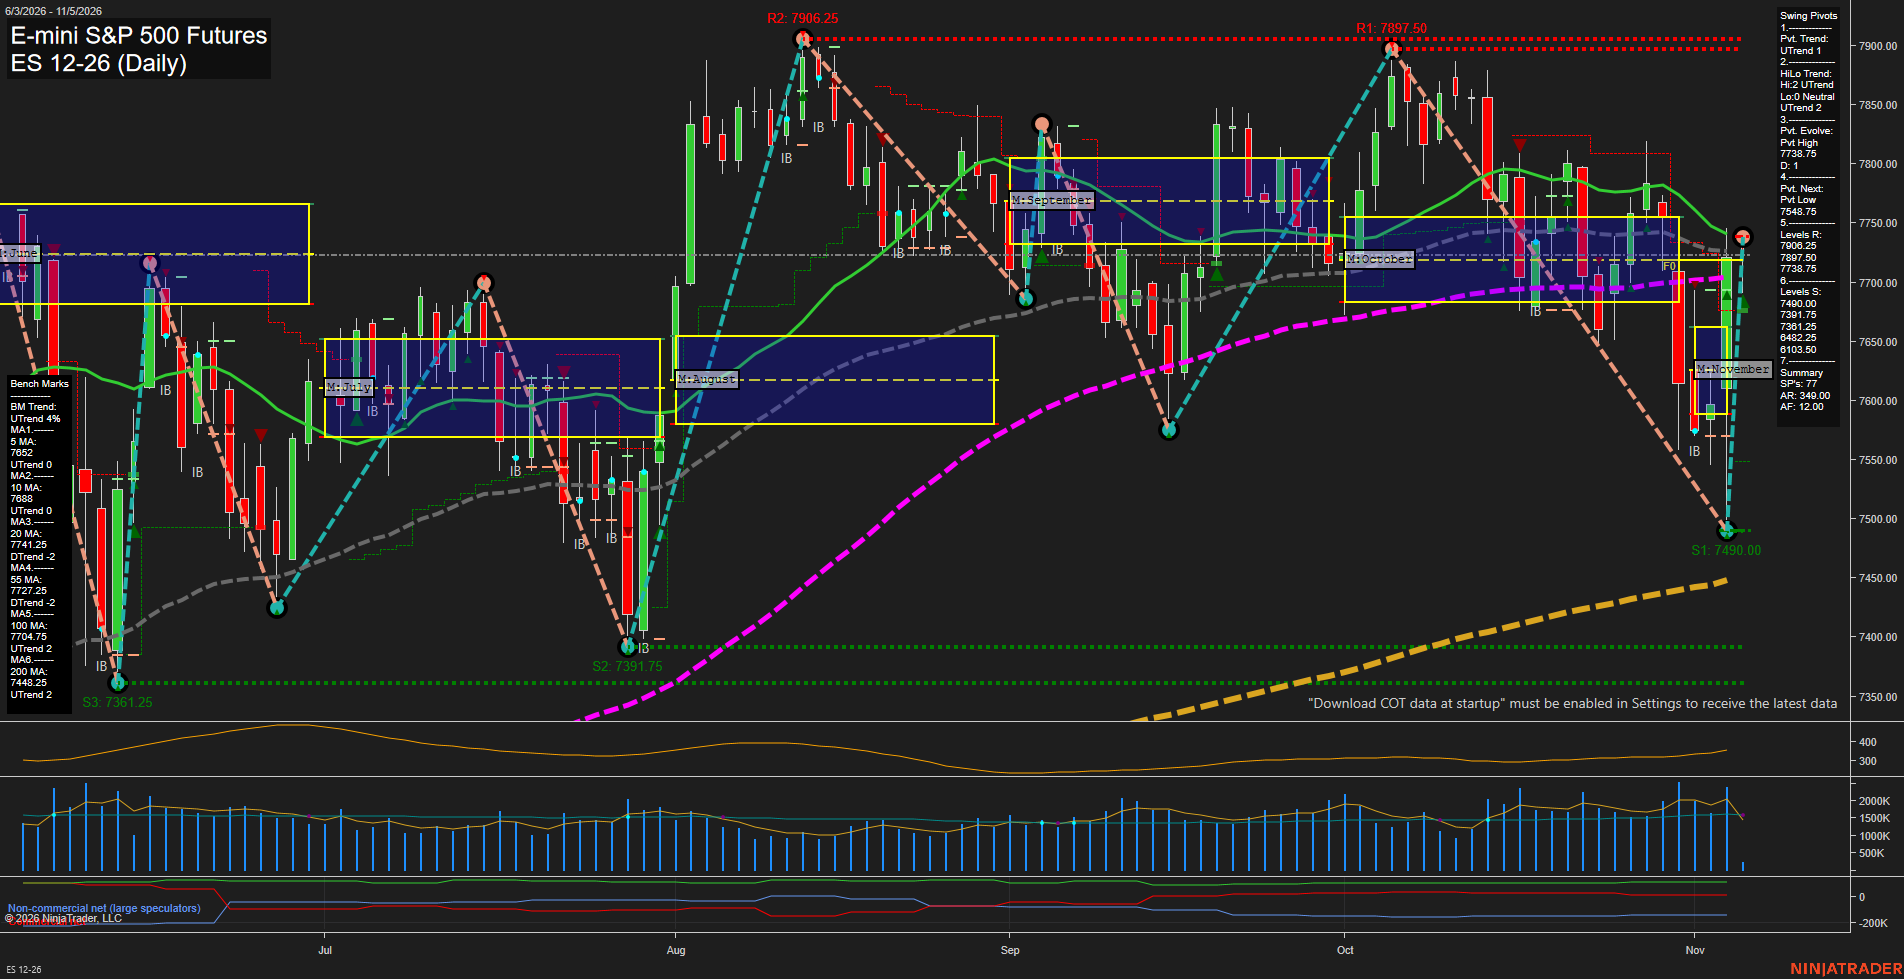
Overall Rating
- Short-Term: Bullish
- Intermediate-Term: Bullish
- Long-Term: Bullish.
Key Insights Summary
The daily chart shows a sharp V-style rebound from the 7490 swing-low area, with large-range upside bars restoring fast momentum and returning price above the weekly and monthly Fib-grid centers. Short-term pivot structure is in UTrend and the intermediate HiLo structure remains UTrend, while the 5-day and 10-day averages have turned upward. Price is testing the 55-day benchmark near 7727.25 and remains just beneath the 20-day average and the active 7738.75 pivot-high level, defining a near-term overhead congestion zone. The broader structure remains constructive as price holds above rising 100-day and 200-day benchmarks, while the November grid, yearly grid, and recent long signals retain an upward directional backdrop. ATR at 349 reflects elevated daily range conditions and the recent recovery has retraced much of the late-October selloff.
View charts on: AlphaWebTrader HTF Charts
QQQ Daily View
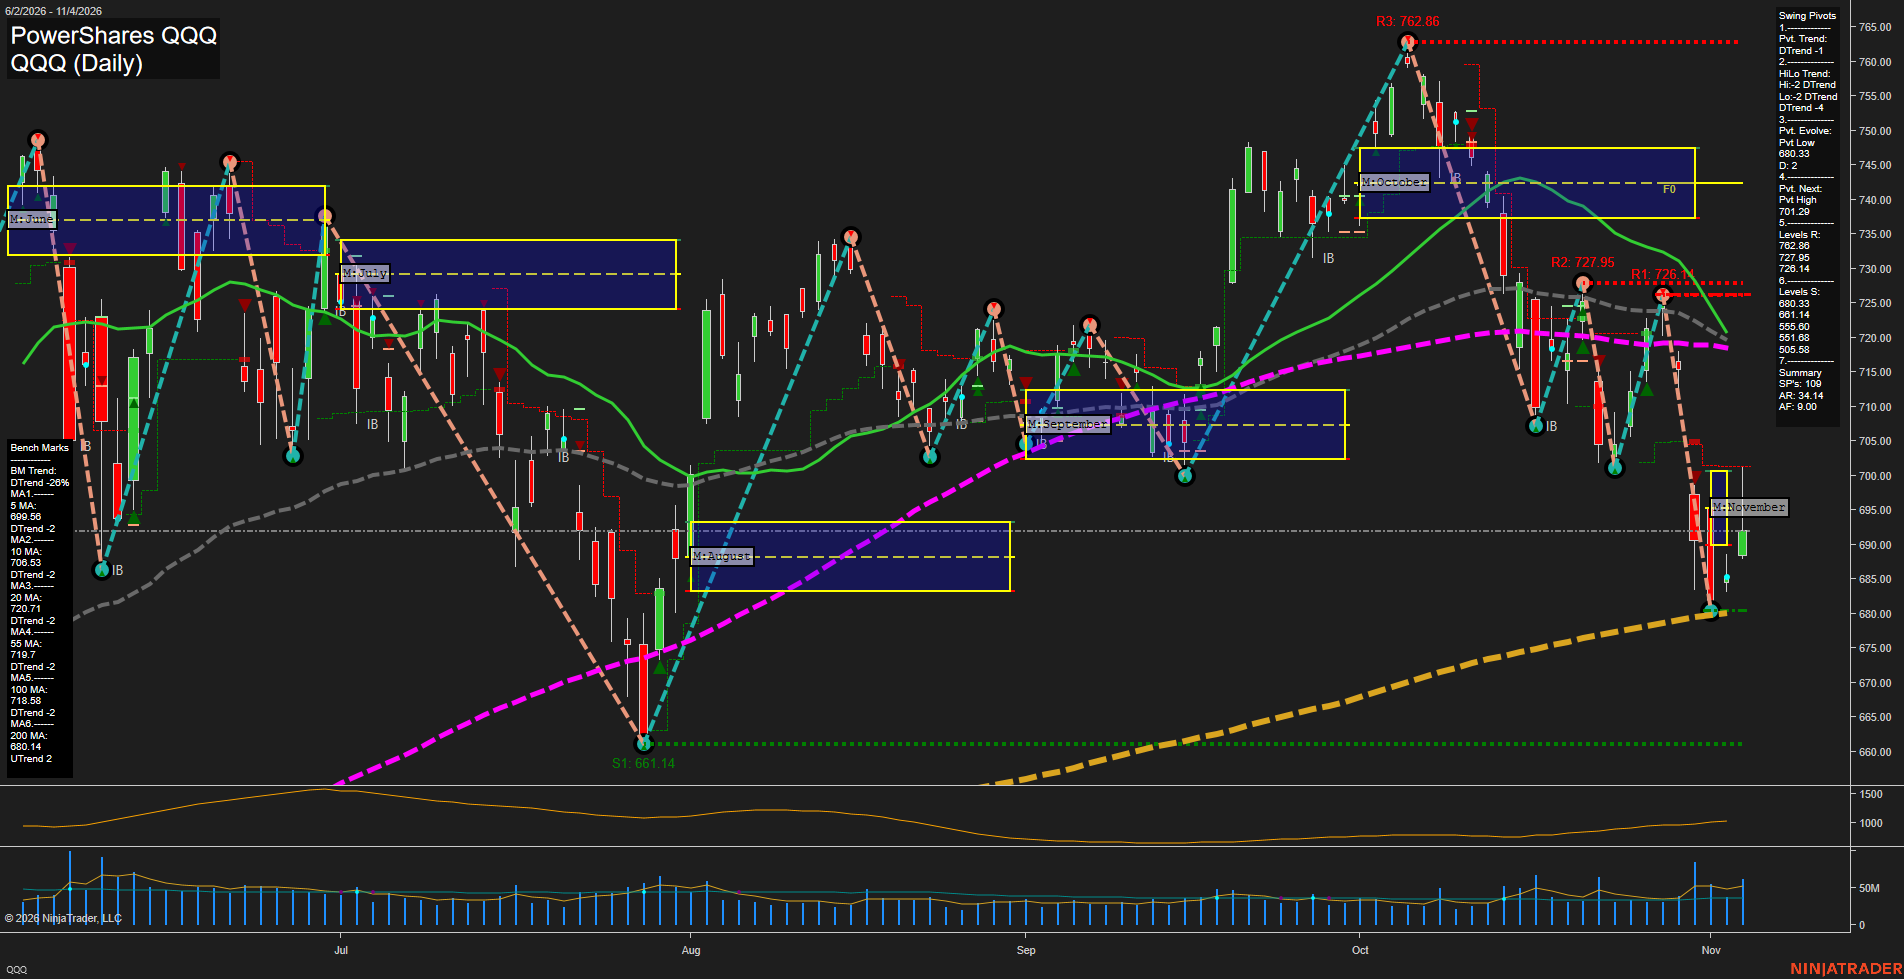
Overall Rating
- Short-Term: Bearish
- Intermediate-Term: Bearish
- Long-Term: Neutral.
Key Insights Summary
QQQ, as a liquid NQ futures proxy, remains in a sharp downside swing after rejection from the 762.86 pivot high. Price is below every short- and intermediate-term benchmark, while both pivot structures remain in DTrend. The 680.33 pivot low and rising 200-day benchmark near 680.14 form the immediate major support confluence. The latest bounce from that area is a countertrend recovery within the broader decline; 701.29 is the defined next pivot threshold, with the 5-day and 10-day averages near 699.56 and 706.53 representing nearby overhead structure. Elevated ATR reflects a fast, high-range price cycle rather than orderly consolidation.
View charts on: AlphaWebTrader HTF Charts
NQ Daily View
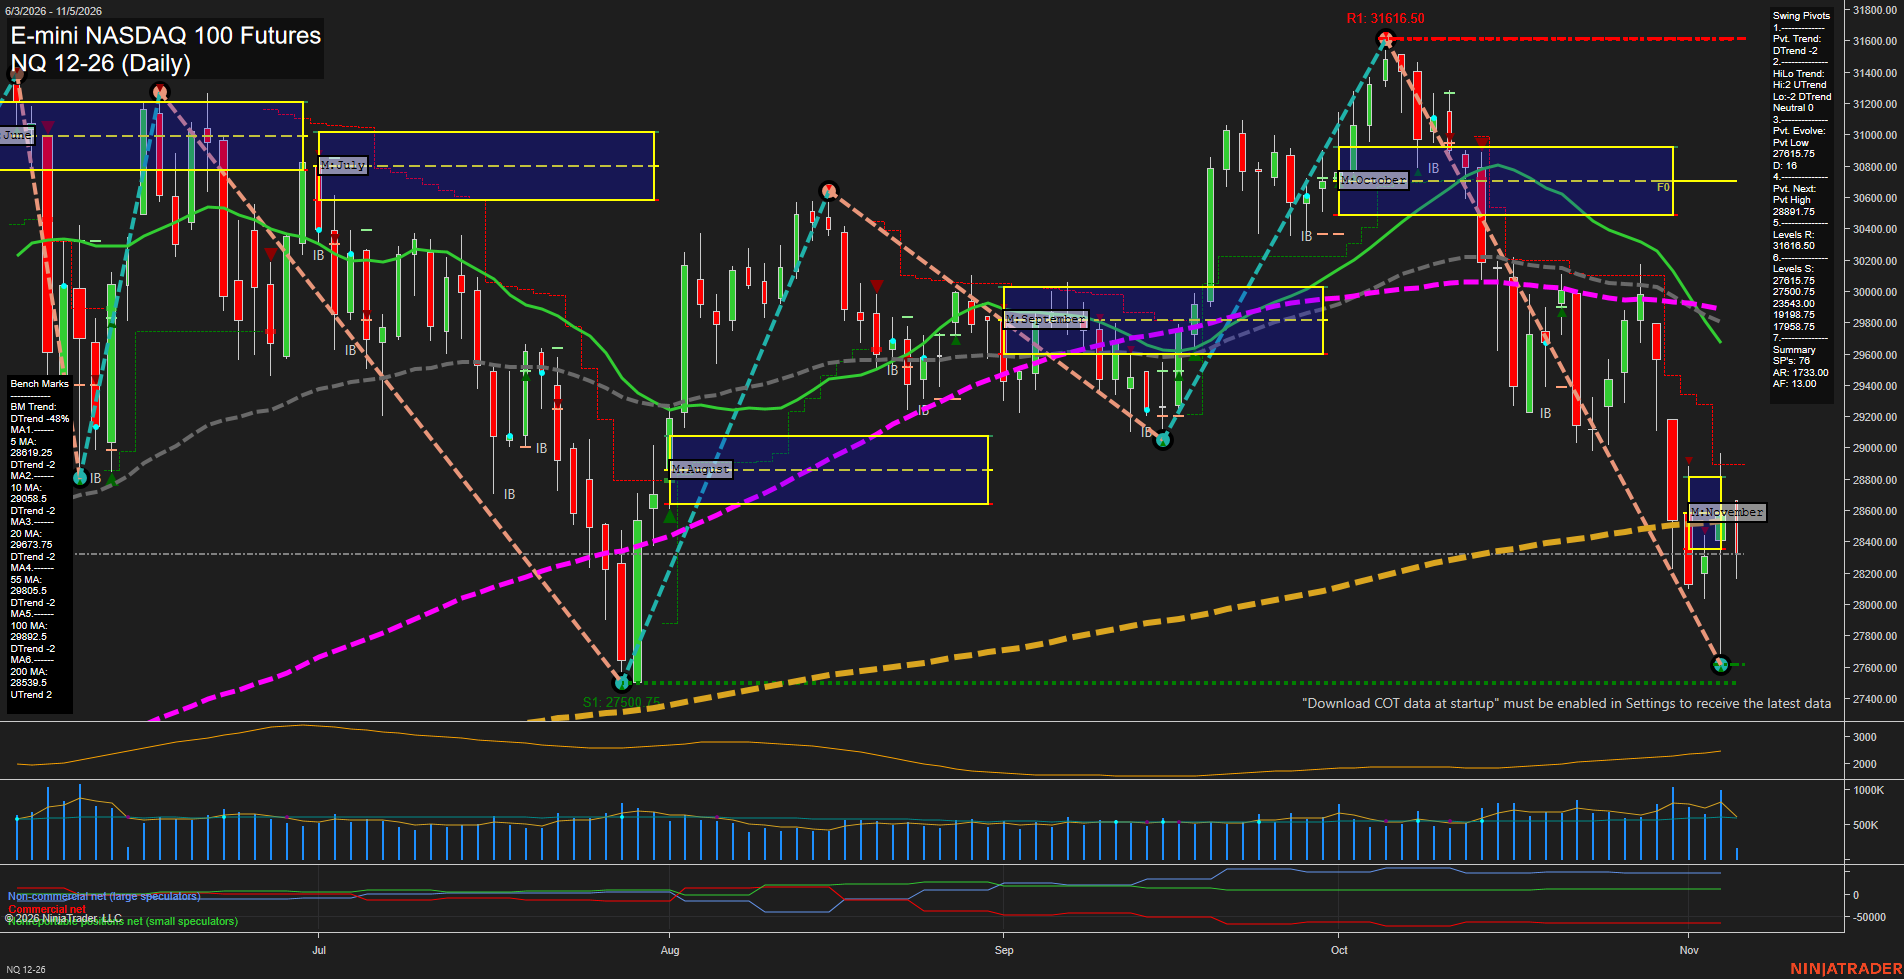
Overall Rating
- Short-Term: Bearish
- Intermediate-Term: Bearish
- Long-Term: Neutral.
Key Insights Summary
Price is in a fast, volatile downswing from the October 31616.50 pivot high, with lower highs and lower lows defining the short-term structure. The November and weekly Fib grids remain below their F0% areas, while price is under the 5-, 10-, 20-, 55-, and 100-day benchmarks. The 27615.75 to 27500.75 pivot-support band is the key nearby downside reference following the sharp selloff and rebound attempt. Long-term conditions are mixed: the annual Fib structure remains positive and price is near the rising 200-day benchmark, but the declining 100-day average and broad intermediate-term weakness keep the larger swing picture neutral rather than constructive.
View charts on: AlphaWebTrader HTF Charts
USO Daily View
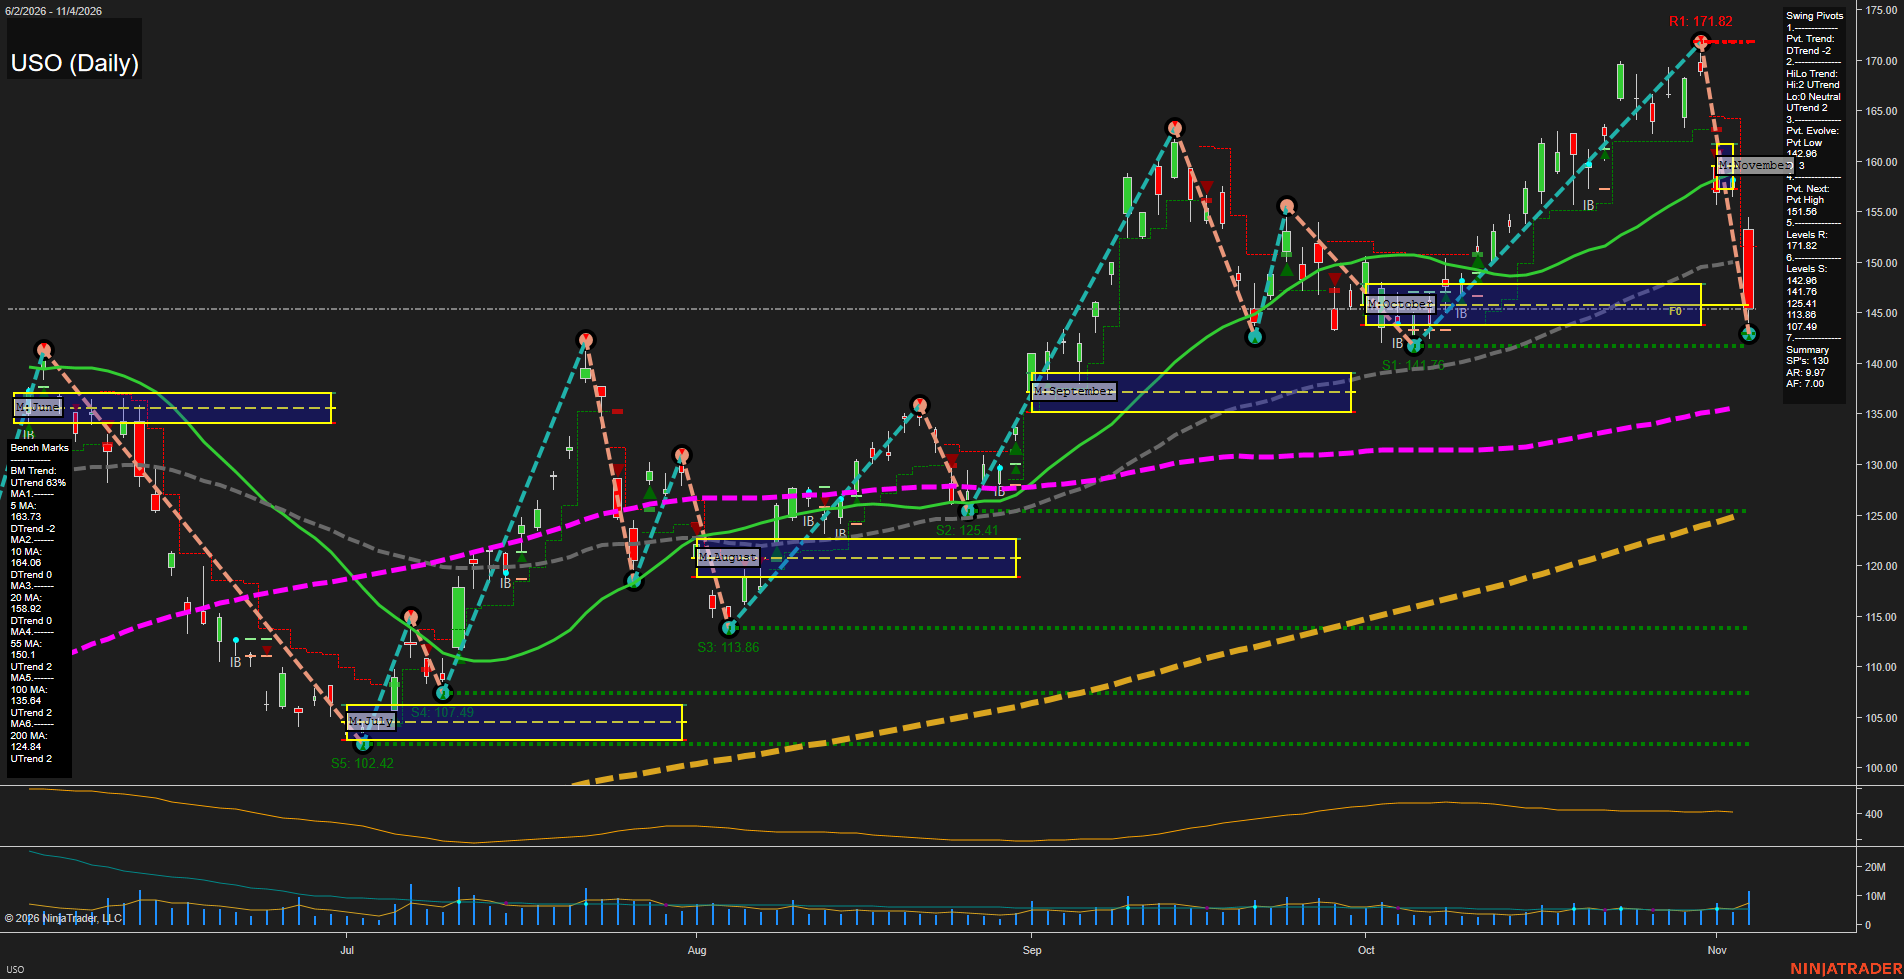
Overall Rating
- Short-Term: Bearish
- Intermediate-Term: Bullish
- Long-Term: Bullish.
Key Insights Summary
USO experienced a sharp, high-momentum reversal from the 171.82 pivot high, producing large-range downside bars and shifting the short-term pivot structure into DTrend. Price is beneath the November MSFG lower boundary and below the 5-, 10-, 20-, and 55-day benchmarks, reflecting a decisive short-term liquidation cycle. The 142.98 pivot low and 141.76 support form the immediate reaction zone. Despite the abrupt selloff, the intermediate HiLo trend remains UTrend and the 100- and 200-day benchmarks continue rising, leaving the broader advance intact while price undergoes a deep countertrend retracement. A recovery through 151.56 would mark the next pivot-structure reversal threshold, while sustained trade below 141.76 would extend the current downside swing toward lower historical support.
View charts on: AlphaWebTrader HTF Charts
CL Daily View
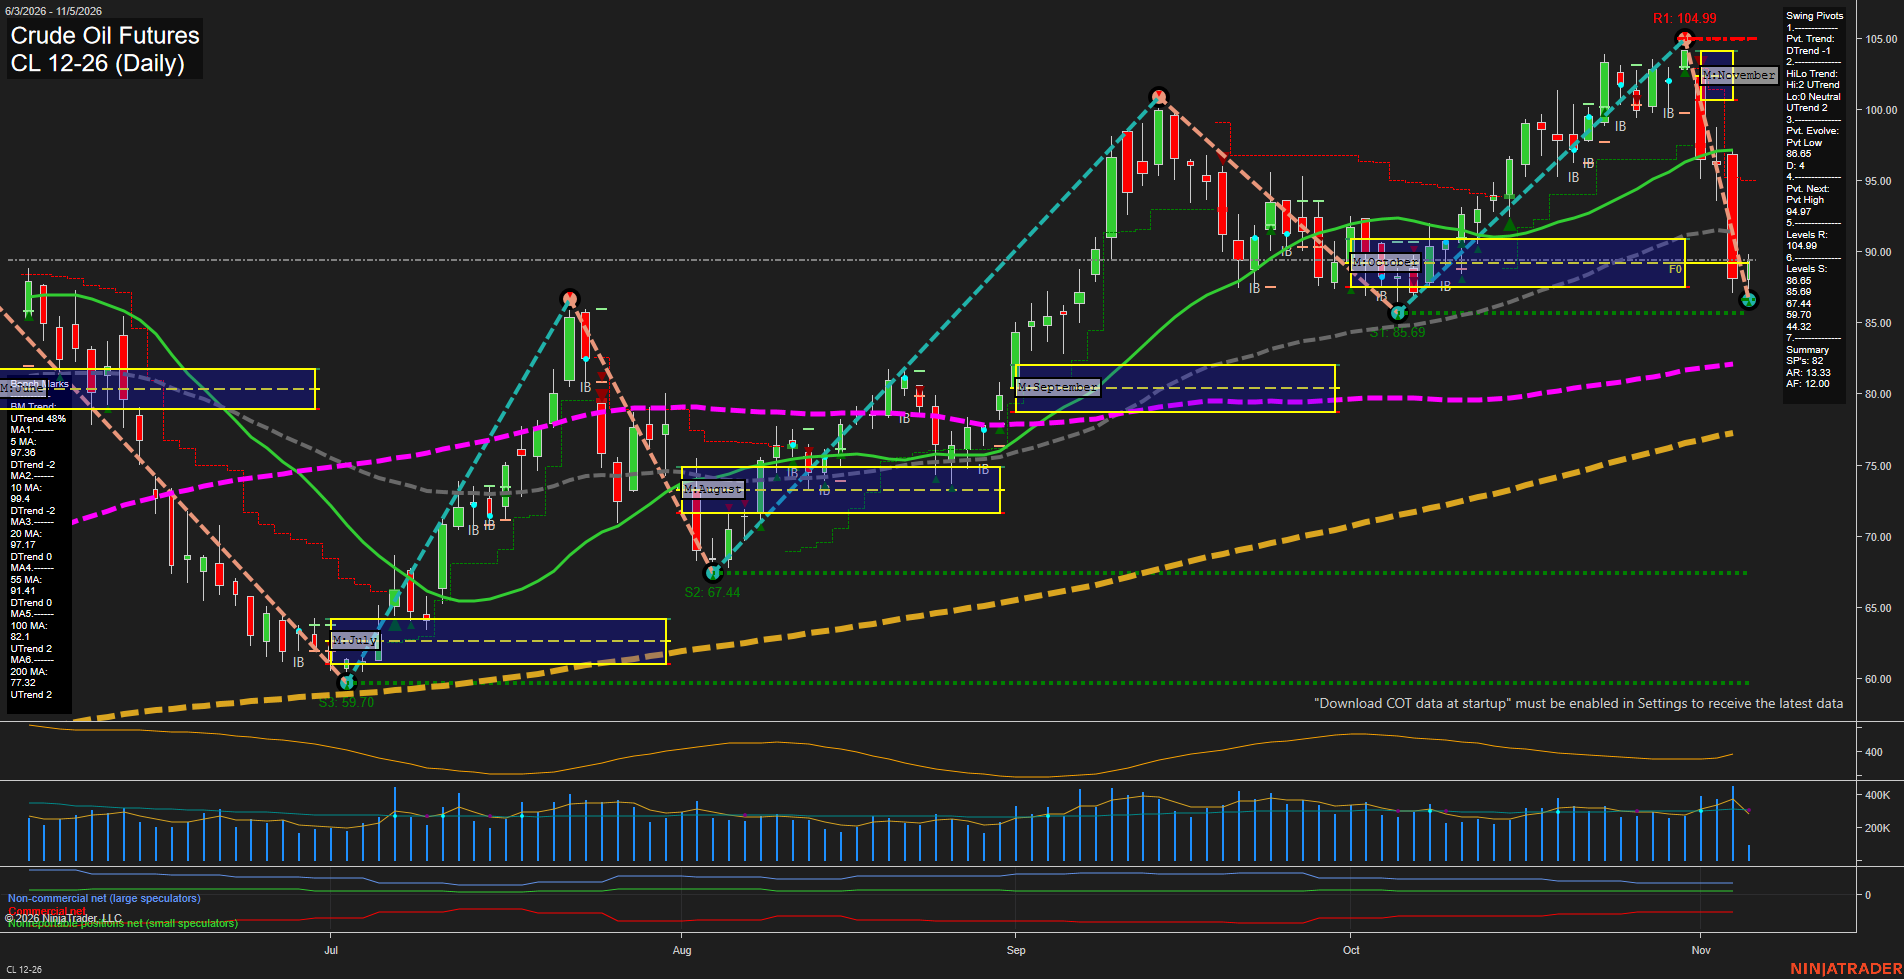
Overall Rating
- Short-Term: Bearish
- Intermediate-Term: Bearish
- Long-Term: Bullish.
Key Insights Summary
Price has undergone a fast, large-range selloff from the 104.99 swing-high resistance area and is trading beneath the weekly and November monthly Fib-grid centers. The short-term pivot structure is in DTrend, with price pressing the 86.65 pivot-low area and nearby 85.69 support after a sharp breakdown below the 5-, 10-, 20-, and 55-day benchmarks. The intermediate structure has weakened materially, although the broader HiLo trend and long-term moving-average structure remain constructive because price is still above rising 100- and 200-day benchmarks. The current action reflects a strong countertrend retracement within the longer-term advance, with 94.97 defining the next pivot-high reversal reference and 104.99 remaining major overhead resistance.
View charts on: AlphaWebTrader HTF Charts
GLD Daily View
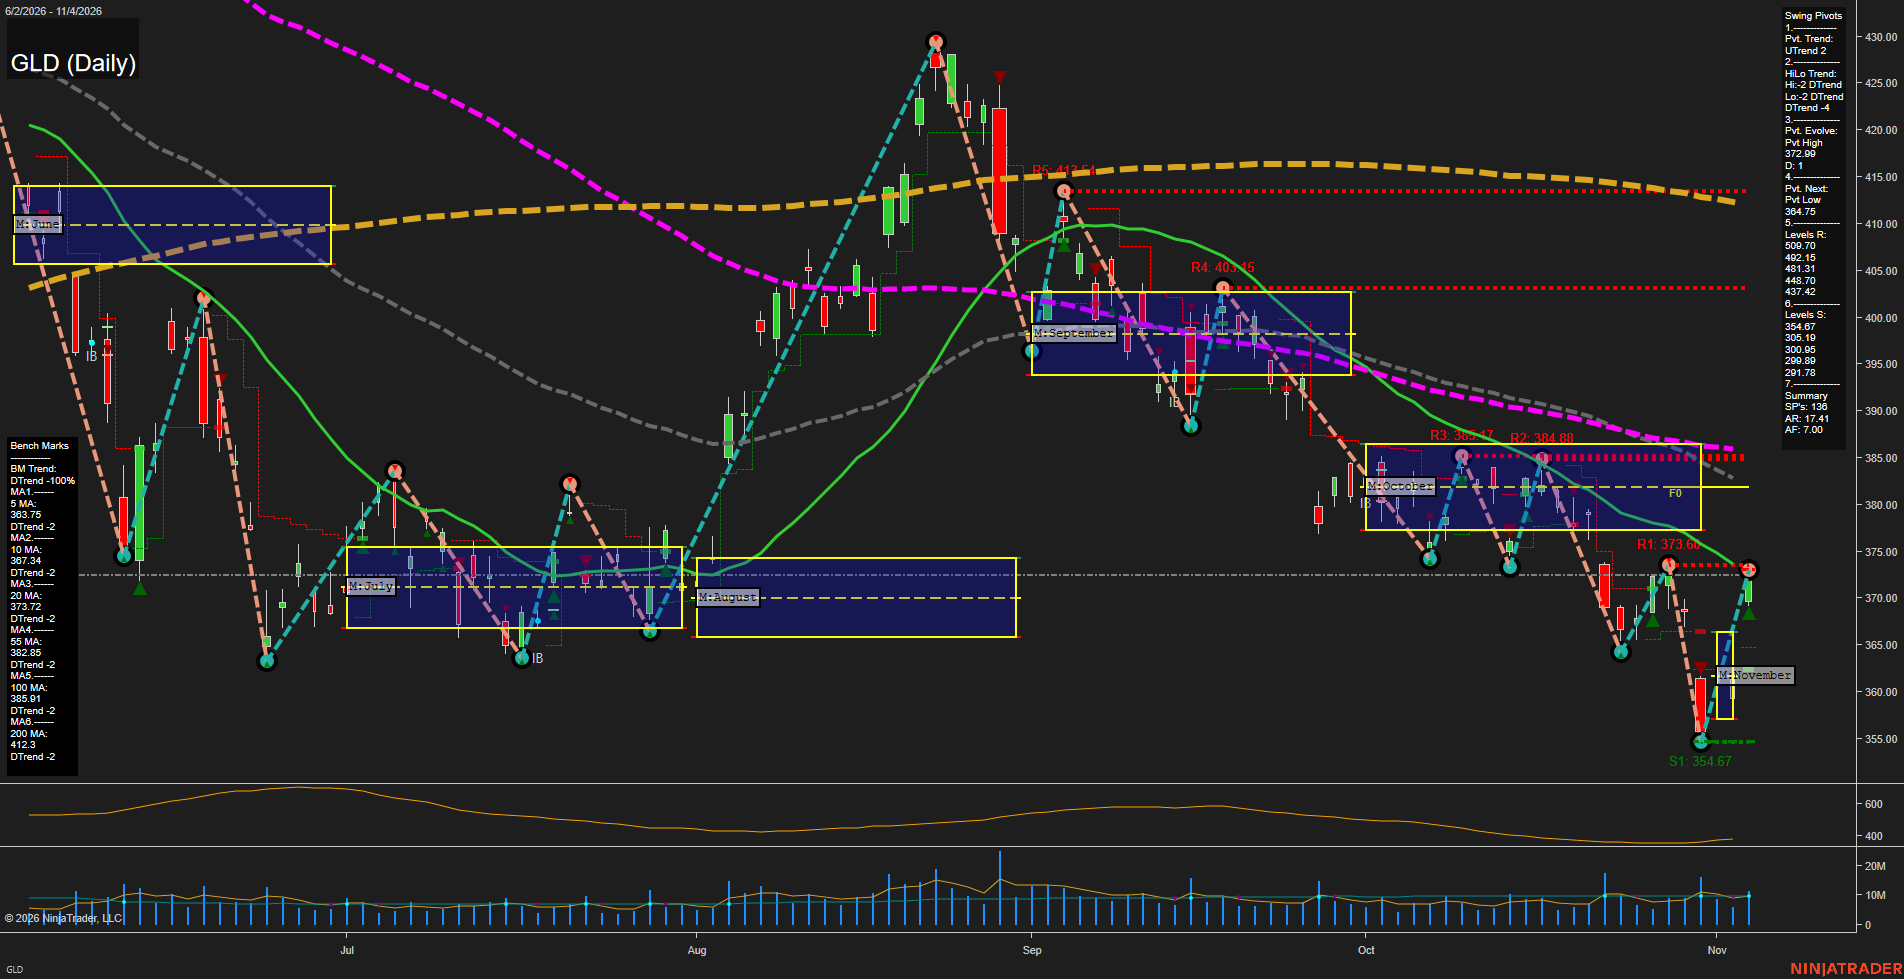
Overall Rating
- Short-Term: Bullish
- Intermediate-Term: Bearish
- Long-Term: Bearish.
Key Insights Summary
From a futures swing-trader perspective, GLD reflects a sharp short-covering recovery from the 354.67 pivot low, producing a short-term UTrend and fast upside momentum. Price is testing the 373.80 pivot-resistance area and remains essentially aligned with the declining 20-day benchmark. The larger structure remains corrective: the intermediate HiLo trend is down, price is below the declining 55-, 100-, and 200-day averages, and the November grid remains neutral beneath its F0% area. The bounce has recovered from an oversold selloff but has not yet altered the broader sequence of lower highs; overhead levels at 384.88, 386.17, and 403.45 define the principal recovery ceiling, while 354.67 remains the dominant swing-low reference.
View charts on: AlphaWebTrader HTF Charts
GC Daily View
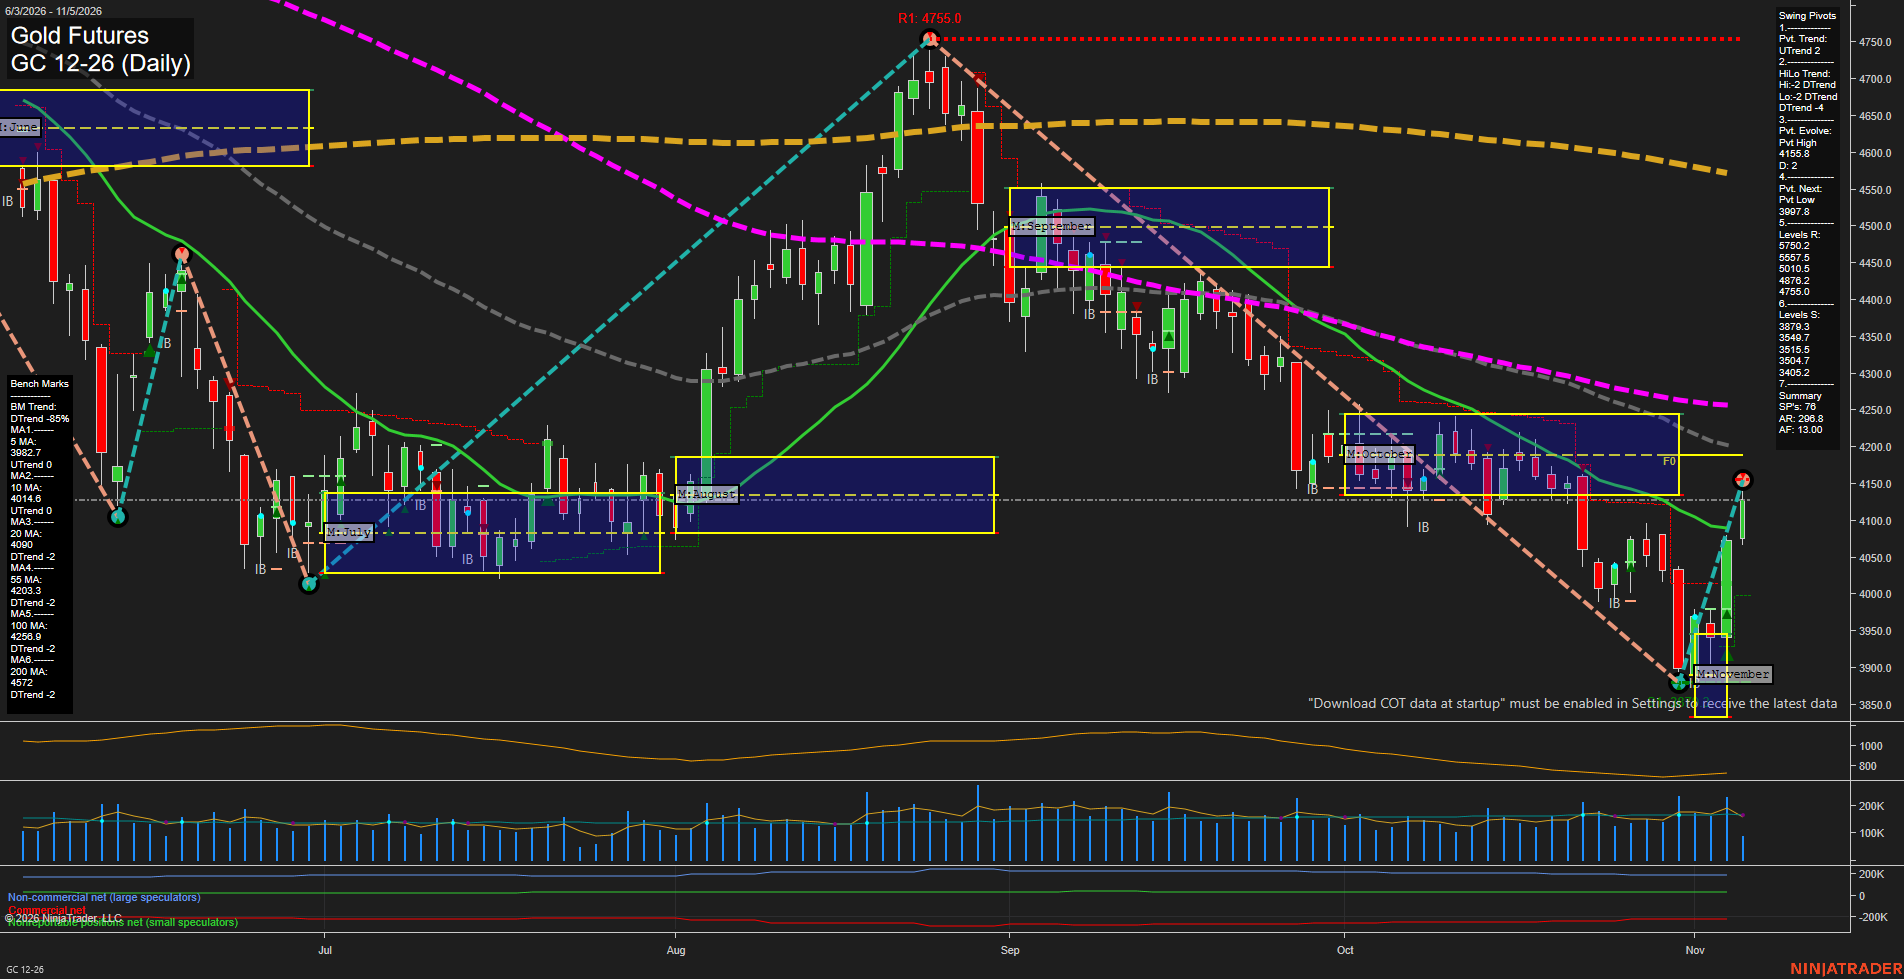
Overall Rating
- Short-Term: Bullish
- Intermediate-Term: Bearish
- Long-Term: Bearish.
Key Insights Summary
Gold has produced a sharp V-style rebound from the 3879 pivot-support area, lifting price above the rising 5-day and 10-day benchmarks and restoring the short-term pivot trend to UTrend. The recovery is fast, but price remains beneath the declining 55-day, 100-day, and 200-day benchmarks, while the intermediate HiLo pivot structure remains DTrend. The 4155.8 evolving pivot high and the 4203.3 to 4258.9 moving-average band define the nearby overhead technical zone; the 3997.8 pivot-low level and 3879.3 support remain the principal downside structure. This reflects a short-term countertrend recovery inside a broader intermediate and long-term corrective decline.
View charts on: AlphaWebTrader HTF Charts
ZB Daily View
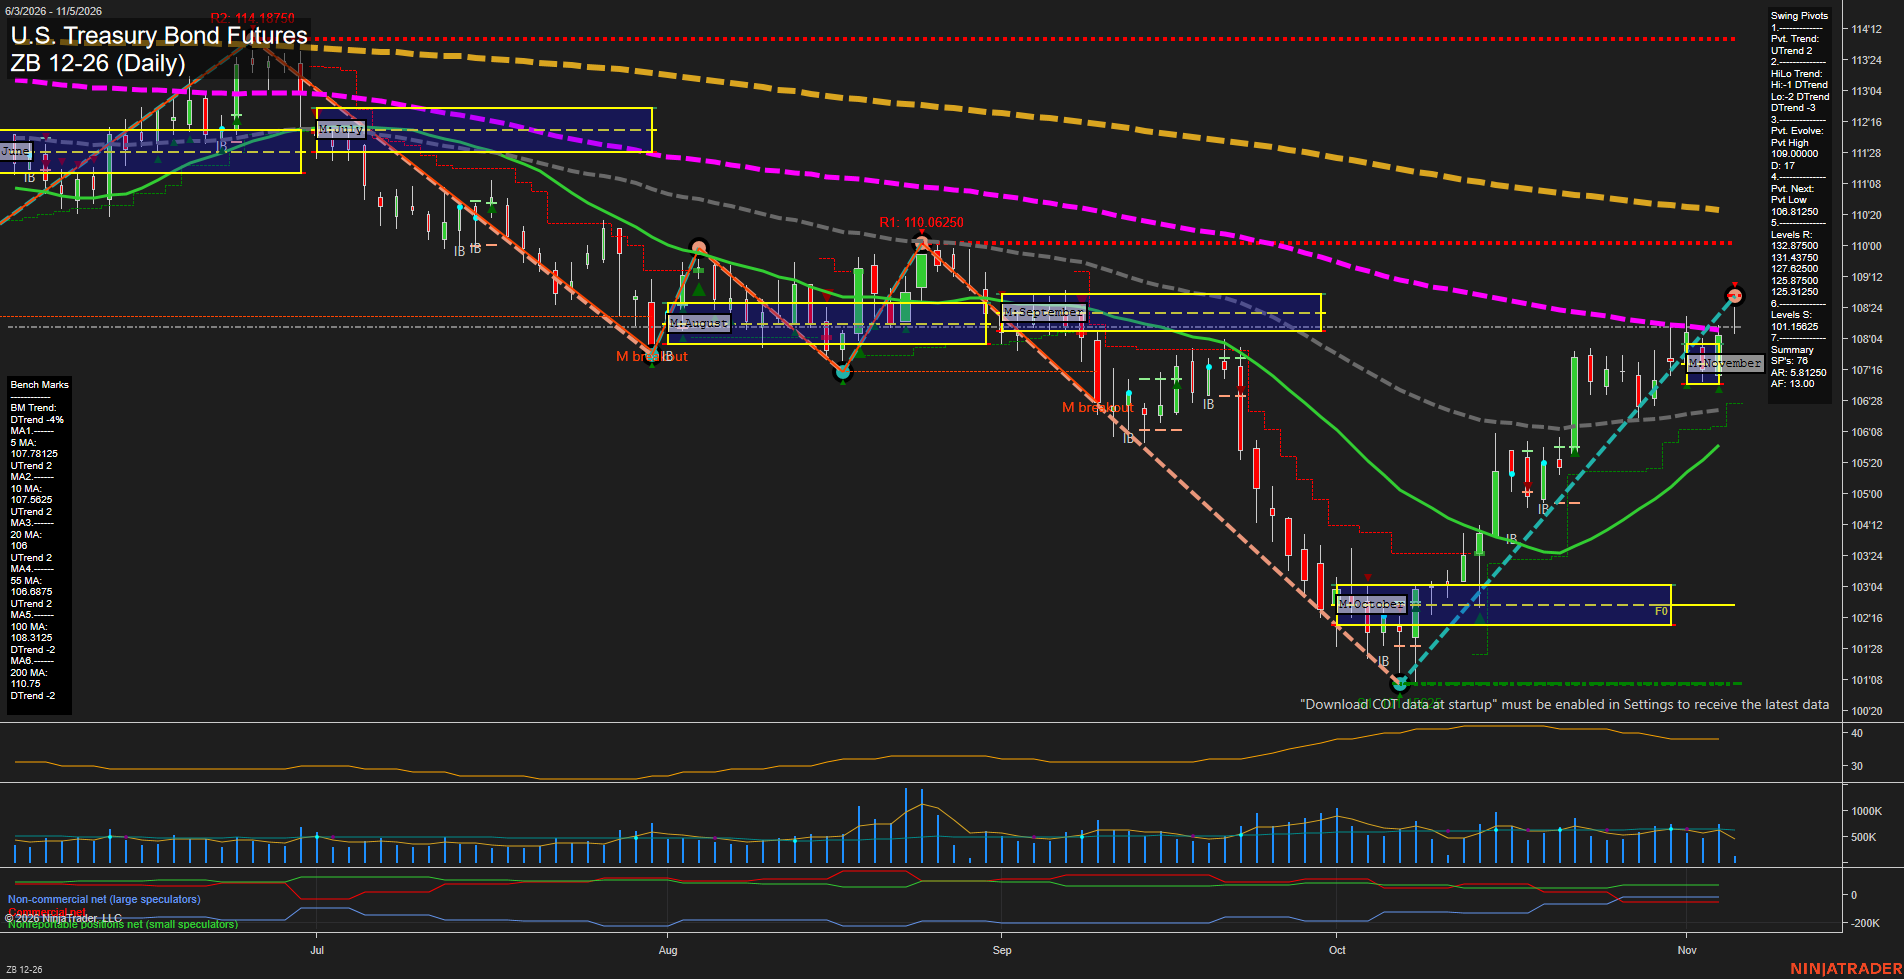
Overall Rating
- Short-Term: Bullish
- Intermediate-Term: Bullish
- Long-Term: Bearish.
Key Insights Summary
The daily structure reflects a strong recovery from the October low, with higher lows, a confirmed short-term UTrend, price above the rising 5, 10, 20, and 55-day benchmarks, and positive weekly and monthly fib-grid alignment. The rebound has approached the declining 100-day average near 108.31250 and the developing 109.00000 pivot-high area, creating an important countertrend test within the broader long-term downtrend. Momentum is constructive but measured rather than impulsive, while ATR near 39 indicates active daily range conditions. The intermediate HiLo structure remains a DTrend and the 100-day and 200-day benchmarks remain downward sloping, so the present advance is technically a recovery leg inside a still-bearish longer-term trend framework.
View charts on: AlphaWebTrader HTF Charts
Sentiment Summary: Negative coverage led at 37%, versus 28% positive and 36% neutral, as November 5’s tech-led selloff followed November 4’s post-election rally; reports linked chip and AI-infrastructure weakness to concerns that Democratic midterm gains would delay data-center construction. Nasdaq weakness, a sharp VIX increase and Treasury gains reflected risk aversion, while robust hyperscaler spending commitments and strong reported earnings provided counterweights. November 5 releases showed jobless claims falling to 189,000 for the week ended October 31 and stronger third-quarter productivity, alongside Fed officials’ calls for gradual rate hikes.
Conclusion: The October jobs report, scheduled for November 6 morning, remains the next immediate macro catalyst.