Monday's bearish stock futures face Fed remarks, Treasury auctions at 11:30 a.m./1 p.m. ET and MARA earnings after the close; Nvidia weakens, oil falls.
Fundamentals: Monday's cautious, tech-focused setup includes Fed speeches from Bowman at 8:40 a.m., Goolsbee at 10 a.m. and Barkin at 12:15 p.m. ET. Treasury auctions bring $95B of 13-week and $82B of 26-week bills at 11:30 a.m., then $58B of three-year notes and $100B of six-week bills at 1 p.m. ET. Nvidia's leadership investigation and semiconductor selling weigh on equities, while oil fell more than 3% as Trump downplayed further Iran strikes. Tomorrow, Tuesday, brings CPI at 8:30 a.m. ET.
Technicals: Stock index futures enter Monday’s session with bearish near-term daily trends following sharp, high-volatility declines. S&P 500 and Nasdaq futures remain in corrective phases, with key support near 7,322–7,325 and 26,368.50, respectively. Dow futures retain a bullish far-term structure, while midcap and Russell 2000 futures carry bearish daily ratings across all horizons. DAX futures show near-term weakness within a longer-term uptrend.
Pre-Market Trading 360° view Market Radar of: holidays, earnings, eco-news, market-news summary, news sentiment, prior session major ETFs, MAG7, Higher Time Frame Analysis Indices Futures Summary, and E-mini S&P500, Nasdaq 100, NYMEX Crude, Gold Futures Daily Chart analysis.
As of: November 9, 2026 07:35 CT
Earnings Radar
Monitoring for earnings releases by the Magnificent 7, AI-tech-related firms, and major financial institutions.
| Date/Day | Impact | Company / Symbol | Time | EPS | Revenue | ||||
|---|---|---|---|---|---|---|---|---|---|
| 2026-11-09 – Monday | Medium | MARA Holdings (MARA) | After close |
|
|
Conclusion: MARA reports today, November 9, after market close; its earnings release remains ahead as of publication. The provided schedule contains no major broad-index earnings catalyst; MARA’s relevance is primarily to crypto-linked equity sentiment.
For full details visit: Yahoo Earnings Calendar
EcoNews Radar U.S. Events
| Date | Impact | Event, Prev, Forecast, Actual | Info |
|---|---|---|---|
| 2026-11-09 Monday 08:40 | Medium | Fed's Bowman speech Prev: — Forecast: — Actual: — | Policy remarks can clarify views on inflation, employment and interest rates; traders monitor them for shifts in the policy outlook that influence yields and equity valuations. |
| 2026-11-09 Monday 10:00 | Medium | Fed's Goolsbee speech Prev: — Forecast: — Actual: — | Remarks offer qualitative insight into economic conditions and monetary policy; traders watch for changes in rate expectations relevant to index futures. |
| 2026-11-09 Monday 11:30 | Medium | 13-Week Bill Auction · $95B Prev: 4.04% Forecast: — Actual: — | Results reveal demand and borrowing costs for short-term government funding; traders monitor money-market conditions and their connection to expected policy rates. |
| 2026-11-09 Monday 11:30 | Medium | 26-Week Bill Auction · $82B Prev: 4.15% Forecast: — Actual: — | Results show investor demand for short-term government debt; traders assess funding conditions and how auction yields compare with prevailing rate expectations. |
| 2026-11-09 Monday 12:15 | Medium | Fed's Barkin speech Prev: — Forecast: — Actual: — | Comments may illuminate the economic outlook and policy priorities; traders monitor potential implications for interest-rate expectations and equity discount rates. |
| 2026-11-09 Monday 13:00 | High | 3-Year Note Auction · $58B Prev: 4.932% Forecast: — Actual: — | Results reveal demand for intermediate government debt and the yield required by investors; traders monitor implications for Treasury yields and equity valuations. |
| 2026-11-09 Monday 13:00 | Medium | 6-Week Bill Auction · $100B Prev: — Forecast: — Actual: — | Results gauge demand for very short-term government debt; traders watch for signals about cash availability and money-market funding conditions. |
| 2026-11-10 Tuesday 04:00 | Medium | Fed's Waller speech Prev: — Forecast: — Actual: — | Policy commentary provides insight into the outlook for inflation and employment; traders monitor any implications for the expected interest-rate path. |
| 2026-11-10 Tuesday 08:15 | Medium | ADP Employment Change 4-week average Prev: 17K Forecast: — Actual: — | Tracks average private-sector employment changes over a rolling period; traders monitor labor demand for clues about growth, wage pressures and monetary policy. |
| 2026-11-10 Tuesday 08:30 | High | Consumer Price Index ex Food & Energy (MoM) Prev: 0.30% Forecast: 0.20% Actual: — | Measures monthly consumer price changes excluding volatile food and energy categories; traders use it to assess underlying inflation momentum and interest-rate expectations. |
| 2026-11-10 Tuesday 08:30 | High | Consumer Price Index (MoM) Prev: 0.60% Forecast: 0.30% Actual: — | Measures the monthly change in the broad consumer basket; traders monitor near-term inflation momentum and its implications for monetary policy and household purchasing power. |
| 2026-11-10 Tuesday 08:30 | High | Consumer Price Index (YoY) Prev: 3.7% Forecast: 3.9% Actual: — | Measures broad consumer price changes from a year earlier; traders assess the inflation backdrop and its implications for policy expectations and equity valuations. |
| 2026-11-10 Tuesday 08:30 | High | Consumer Price Index ex Food & Energy (YoY) Prev: 2.6% Forecast: 2.8% Actual: — | Tracks annual consumer inflation excluding food and energy; traders monitor persistent price pressures that can influence the expected path of interest rates. |
| 2026-11-10 Tuesday 13:00 | High | 10-Year Note Auction · $42B Prev: 5.3% Forecast: — Actual: — | Results gauge demand for benchmark government debt; traders watch auction pricing and participation for implications for longer-term yields and equity discount rates. |
| 2026-11-10 Tuesday 15:30 | Medium | Fed's Bowman speech Prev: — Forecast: — Actual: — | Remarks may clarify the policy outlook and assessment of economic conditions; traders watch for changes in rate expectations affecting index futures. |
| 2026-11-10 Tuesday 16:30 | Low | API Weekly Crude Oil Stock Prev: -5.27M Forecast: — Actual: — | Provides an industry estimate of weekly changes in domestic crude inventories; traders monitor oil supply conditions and potential relevance to energy shares and inflation expectations. |
| 2026-11-10 Tuesday 18:30 | Medium | Fed's Paulson speech Prev: — Forecast: — Actual: — | Policy remarks can provide insight into economic conditions and interest-rate priorities; traders monitor whether the commentary alters expectations for monetary policy. |
| 2026-11-12 Thursday 08:30 | Medium | Initial Jobless Claims Prev: 189K Forecast: 195K Actual: — | Counts new applications for unemployment benefits; traders monitor timely signs of layoffs and labor-market cooling relevant to growth and interest-rate expectations. |
| 2026-11-12 Thursday 09:00 | Medium | Fed's Hammack speech Prev: — Forecast: — Actual: — | Commentary may clarify views on inflation, employment and policy; traders watch for implications for expected interest rates and equity valuations. |
| 2026-11-12 Thursday 10:00 | Medium | Fed's Barr speech Prev: — Forecast: — Actual: — | Remarks can address monetary policy, banking or financial stability; traders monitor the stated focus for implications for rates, credit conditions and financial shares. |
| 2026-11-12 Thursday 10:00 | Medium | Existing Home Sales Change (MoM) Prev: 1.5 Forecast: — Actual: — | Measures the monthly change in completed sales of previously owned homes; traders assess housing demand, interest-rate sensitivity and implications for related industries. |
| 2026-11-12 Thursday 11:30 | Medium | Fed's Goolsbee speech Prev: — Forecast: — Actual: — | Comments provide qualitative insight into the economic and policy outlook; traders monitor any changes in the expected path of interest rates. |
| 2026-11-12 Thursday 11:30 | Medium | 4-Week Bill Auction Prev: 3.89% Forecast: — Actual: — | Results reveal demand for near-term government funding; traders monitor auction yields and participation as indicators of cash demand and money-market conditions. |
| 2026-11-12 Thursday 11:30 | Medium | 17-Week Bill Auction Prev: — Forecast: — Actual: — | Results show demand and borrowing costs for short-term government debt; traders assess funding conditions and the relationship between yields and policy expectations. |
| 2026-11-12 Thursday 11:30 | Medium | 8-Week Bill Auction Prev: — Forecast: — Actual: — | Results gauge investor appetite for short-term government securities; traders monitor cash-market conditions and pricing relative to other money-market instruments. |
| 2026-11-12 Thursday 12:00 | Low | EIA Crude Oil Stocks Change Prev: -0.86M Forecast: — Actual: — | Measures weekly changes in domestic commercial crude inventories; traders monitor supply-demand conditions relevant to oil prices, energy shares and inflation expectations. |
| 2026-11-12 Thursday 13:00 | High | 30-Year Bond Auction · $25B Prev: 5.62% Forecast: — Actual: — | Results reveal demand for long-duration government debt; traders monitor implications for long-term yields, financial conditions and rate-sensitive equity valuations. |
| 2026-11-12 Thursday 13:10 | Medium | Fed's Daly speech Prev: — Forecast: — Actual: — | Remarks may clarify the assessment of economic conditions and policy needs; traders monitor potential changes in interest-rate expectations. |
| 2026-11-12 Thursday 14:00 | Medium | Monthly Budget Statement Prev: -27.0B Forecast: — Actual: — | Reports federal receipts, spending and the resulting fiscal balance; traders monitor financing needs and the fiscal backdrop relevant to Treasury supply and yields. |
| 2026-11-12 Thursday 18:30 | Medium | Fed's Williams speech Prev: — Forecast: — Actual: — | Policy commentary offers insight into the economic outlook and interest-rate considerations; traders monitor implications for yields and equity discount rates. |
| 2026-11-13 Friday 08:30 | High | Producer Price Index ex Food & Energy (MoM) Prev: 0.70% Forecast: 0.30% Actual: — | Measures monthly changes in prices received by domestic producers excluding food and energy; traders monitor underlying pipeline inflation and possible pressure on business margins. |
| 2026-11-13 Friday 08:30 | High | Producer Price Index (MoM) Prev: 1.30% Forecast: 0.40% Actual: — | Tracks monthly changes in prices received by domestic producers; traders assess upstream inflation momentum and potential implications for margins and monetary policy. |
| 2026-11-13 Friday 08:30 | Medium | Producer Price Index (YoY) Prev: 6.3% Forecast: 6.6% Actual: — | Measures annual changes in prices received by domestic producers; traders monitor the broader upstream inflation trend and its relevance to costs and policy expectations. |
| 2026-11-13 Friday 08:30 | High | Producer Price Index ex Food & Energy (YoY) Prev: 5.0% Forecast: 5.0% Actual: — | Tracks annual producer price changes excluding food and energy; traders assess underlying cost pressures and their potential relevance to inflation persistence and corporate margins. |
| 2026-11-13 Friday 10:50 | Medium | Fed's Bowman speech Prev: — Forecast: — Actual: — | Remarks provide qualitative insight into economic conditions and monetary policy; traders monitor implications for the expected rate path and equity valuations. |
| 2026-11-13 Friday 12:00 | Medium | Fed's Daly speech Prev: — Forecast: — Actual: — | Comments may clarify views on labor conditions, inflation and policy; traders watch for changes in interest-rate expectations relevant to index futures. |
| 2026-11-13 Friday 19:00 | Medium | Fed's Jefferson speech Prev: — Forecast: — Actual: — | Policy remarks can illuminate the outlook for inflation, employment and financial conditions; traders monitor any implications for expected interest rates. |
Summary: The calendar centers on U.S. inflation and interest-rate expectations, alongside labor, housing, fiscal and energy indicators.
Conclusion: Scheduled activity is concentrated on Monday, Tuesday, Thursday and Friday in the publication’s local time zone.
NYSE Session Open Gap Radar
Session gaps compare the predicted opening price with the prior session’s close to predict the upcoming session’s opening gap pattern.
| Instrument | Gap | Prior Close | Predicted Open | Gap % |
|---|---|---|---|---|
| IWM | ▲ OGU | 273.67 | 277.70 | ▲ +1.47% |
| GLD | ▲ OGU | 372.52 | 377.94 | ▲ +1.46% |
| DIA | ▲ OGU | 512.22 | 518.60 | ▲ +1.25% |
| IJH | ▲ OGU | 72.11 | 72.95 | ▲ +1.17% |
| SPY | ▲ OGU | 735.29 | 742.22 | ▲ +0.94% |
| QQQ | ▼ IGU | 656.10 | 662.22 | ▲ +0.93% |
| TLT | ▼ IGU | 81.92 | 82.34 | ▲ +0.51% |
| USO | ▼ OGD | 148.41 | 142.80 | ▼ -3.78% |
Before the session opens, the table shows the predicted opening price and gap. Once the session opens, it uses the recorded opening price.
Glossary: IGU — Inside Gap Up: above the prior close, within the prior session’s range. IGD — Inside Gap Down: below the prior close, within that range. OGU — Outside Gap Up: above the prior session’s high. OGD — Outside Gap Down: below the prior session’s low.
As of: 2026-11-09 07:35 CT. Predicted gaps are best estimates as of publication and may change before the regular-session open, particularly when the session is still some time away.
Market News Summary:
Nvidia leadership scrutiny and AI investment concerns dominate equity headlines, while oil falls on reduced prospects of further Iran strikes.
Primary Drivers & Risks:
- Primary Driver: Nvidia weakness and semiconductor selling
- Primary Risk: AI oversight and financing pressures
Tone:
Cautious and technology-focused, with selective positive corporate developments.
Data, Market and System
Geopolitical:
- Trump said on Sunday that further Iran strikes were highly unlikely while negotiations over its nuclear program and reopening the Strait of Hormuz progressed.
- Nvidia’s investigation has drawn national security scrutiny and attention from Democrats pursuing greater oversight.
- Democratic control of Congress creates a changed policy backdrop, while the president retains substantial authority over tariffs and foreign policy.
Oil / Energy:
- Oil fell more than 3% after Trump downplayed the prospect of additional strikes on Iran.
- Power availability and grid access feature as constraints on Amazon’s and Alphabet’s AI chip strategies.
Gold / Metals:
- Barrick reported a slight increase in third-quarter net earnings as higher gold and copper prices and productivity gains offset cost pressures.
- Barrick’s production remained on track for its annual target.
Fed / Financials:
- A Democratic Senate was described as a new hurdle for Trump’s Federal Reserve ambitions.
- The United States severed crypto exchange MEXC from its financial system.
Macro / Other:
- AI coverage highlighted debt financing, valuation concerns and the cost of data center expansion.
- Manufacturing employment was reported to have rebounded, while global automakers targeted the United States as demand weakened elsewhere.
Conclusion:
Nvidia’s leadership investigation and semiconductor weakness are the central equity drivers in the supplied coverage. AI infrastructure oversight and investment costs add to the technology sector’s pressures.
Oil’s decline reflects reduced concern about additional Iran strikes, with nuclear negotiations and Hormuz access remaining central issues. Apple, Tesla and Google provided positive company-specific developments alongside the broader AI concerns.
Market News Sentiment
Sentiment Bias shows the balance of positive and negative news coverage sampled from 2026-11-08 08:58 to 2026-11-09 08:09 ET, covering stocks, energy and gold.
▼ Market news
- Bias
- ▼ -34.51%
- Articles
- 113
- Positive
- ▲ 15.93%
- Neutral
- — 33.63%
- Negative
- ▼ 50.44%
▲ GLD / Gold
- Bias
- ▲ +85.71%
- Articles
- 7
- Positive
- ▲ 85.71%
- Neutral
- — 14.29%
- Negative
- — 0.00%
Sentiment Summary: Gold coverage was 86% positive, driven by Monday’s softer-dollar rebound and Barrick’s November 9 report of higher third-quarter profit as stronger gold and copper prices and productivity gains offset cost pressures. Central-bank buying also featured as a supportive theme, while neutral coverage highlighted gold resistance near $4,148 ahead of the US CPI report scheduled for Tuesday, November 10. That release remains the main counterweight: coverage warned that stronger-than-expected inflation could stall the precious-metals recovery.
Conclusion: The supported cross-market context is a dollar-sensitive gold rebound facing an upcoming inflation test.
▼ USO / Oil
- Bias
- ▼ -50.00%
- Articles
- 8
- Positive
- ▲ 12.50%
- Neutral
- — 25.00%
- Negative
- ▼ 62.50%
Sentiment Summary: Oil coverage was predominantly negative (63%), with prices falling more than 3% Monday, November 9, after Trump said Sunday that further Iran strikes were highly unlikely if nuclear and Strait of Hormuz talks progressed. The main counterweight was continuing supply risk: Rubio reported no imminent diplomatic breakthrough, while attacks on Saudi Arabia and tanker incidents near Hormuz underscored ongoing disruption. Separately, a softer dollar supported gold and silver ahead of Tuesday, November 10’s scheduled US CPI report.
Conclusion: The supported market context is easing oil prices alongside unresolved supply threats and an upcoming inflation catalyst.
Glossary: Sentiment Bias = (positive articles − negative articles) ÷ total articles × 100. It ranges from −100% negative to +100% positive. A reading near zero indicates little directional bias. Neutral articles reduce the score’s strength. ▲ positive; ▼ negative; — balanced. These readings describe news coverage, not market-price direction.
Market Technical Analysis
Analysis of VIX volatility, prior-session major ETFs and mega-cap tech stocks, and real-time futures snapshots and higher-time-frame analysis.
VIX — Market Fear Gauge Daily
| Level | Open | High | MaxVix | Low | MinVix | DNC% | DOC% | VR | MaxVR | MinVR |
|---|---|---|---|---|---|---|---|---|---|---|
| 25.63 | 26.37 | 26.62 | 28.36 | 23.47 | 15.72 | -9.05% | -2.81% | 28.96 | 24.11 | -0.20 |
VIX fell 2.81% from the session's opening level. VIX fell 9.05% versus the previous session close. Expected volatility eased from the period open. VIX is 78.4% up the recent 15-session range (15.72–28.36), in the 70–80% band.
VR: ATN Volatility Ratio (VR): 28.96 – Stocks rose while expected volatility eased. VR is above the maximum of its preceding 15-session VR range (-0.20 to 24.11). VR rose 13.17 points from the previous session, a large shift relative to that range.
Range lookback: preceding 15 completed sessions.
Major ETFs and Mega Cap Tech Stocks
- Nvidia shares declined as its board investigated reports involving CEO Jensen Huang and an alleged foreign operative.
- The board maintained confidence in Huang and stated that there was no evidence of compromised secrets.
- Semiconductor selling followed last week’s congressional elections amid concerns about increased scrutiny of new data center projects.
- Nvidia was reported down 24% from its recent peak, while another report described AMD gaining amid Nvidia’s difficulties.
- Apple Intelligence registered with China’s regulator for use on tablets and laptops.
- Tesla announced the expansion of its robotaxi service to San Antonio.
- Google reportedly plans two variants of its in-house chips, adding to developments in custom AI silicon.
ETF, Mag7, and Cross-Market ETF prior day Insights
Overall Tone
The November 6, 2026 daily session showed a cautiously positive risk tone, with most equity instruments gaining from the open but less uniform results versus the prior close.
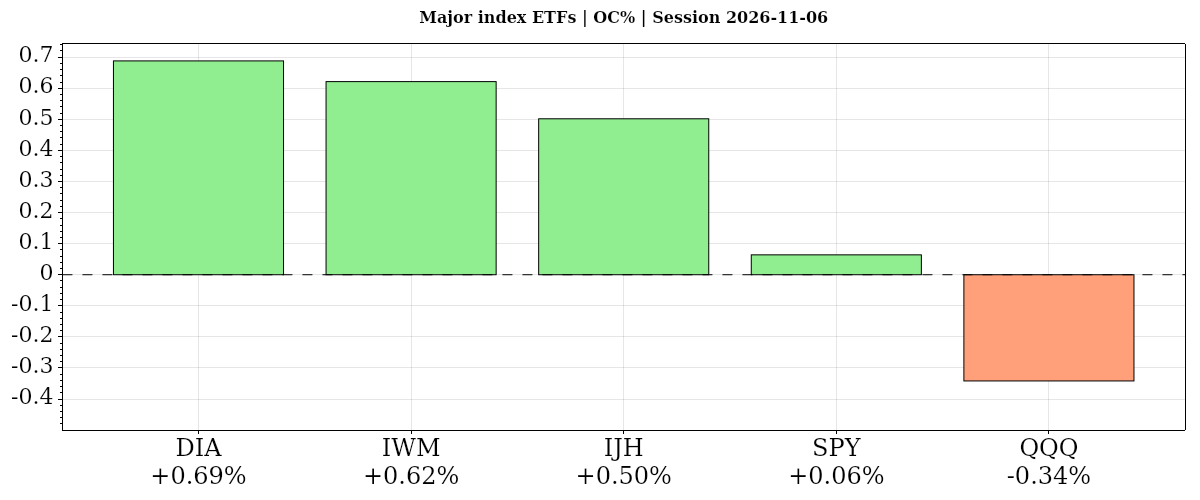
| Instrument | Bias | Date | DNC% | DOC% | O | H | L | C | VWAP | Vol |
|---|---|---|---|---|---|---|---|---|---|---|
| ▲ DIA | ▼ ▲ ▼ | 2026-11-06 | ▼ -0.40% | ▲ +0.69% | 508.72 | 515.98 | 508.66 | 512.22 | ▼ 512.97 | 4,055,599 |
| ▲ IWM | ▲ ▲ ▲ | 2026-11-06 | ▲ +0.99% | ▲ +0.62% | 271.98 | 274.55 | 270.23 | 273.67 | ▲ 273.11 | 25,452,970 |
| ▲ IJH | ▲ ▲ ▲ | 2026-11-06 | ▲ +0.60% | ▲ +0.50% | 71.75 | 72.29 | 71.31 | 72.11 | ▲ 72.02 | 10,450,357 |
| ▲ SPY | ▲ ▲ ▼ | 2026-11-06 | ▲ +0.31% | ▲ +0.06% | 734.82 | 742.21 | 734.58 | 735.29 | ▼ 737.94 | 57,886,092 |
| ▼ QQQ | ▲ ▼ ▼ | 2026-11-06 | ▲ +1.40% | ▼ -0.34% | 658.35 | 664.52 | 653.99 | 656.10 | ▼ 658.82 | 73,107,479 |
| AVG/Sum | — | — | +0.58% | +0.31% | — | — | — | — | — | 170,952,497 |
Index ETFs
Positive confluence: average DNC% +0.58%, DOC% +0.31%. Four of five gained from the open, led by DIA, while QQQ lagged; versus the prior close, QQQ led at +1.40% and DIA alone declined. IWM and IJH closed above VWAP, while QQQ and SPY remained in near-term downtrends.
DIA · D:2026-11-06 NC% ▼ -0.40% OC% ▲ +0.69%
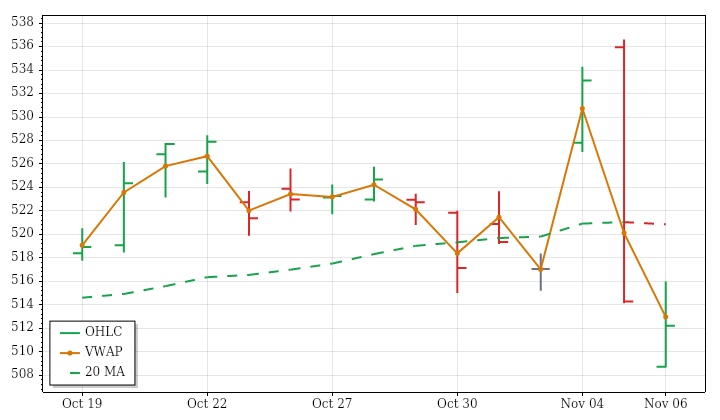
DIA – Dow Jones Technicals Summary
DIA’s completed November 6 daily session closed at 512.22, losing 0.40% against the prior close while recovering 0.69% from the open. The opening gap down was filled, but the close ultimately fell below the previous day’s low and session VWAP. That combination distinguished an intraday recovery from a repair of the daily structure, which still featured a lower high and lower low.
Price remained below near-, intermediate- and far-term averages even though all three averages were rising, creating conflict across every horizon. The declining 15-session price trend reinforced the weakness in price position. The session’s range was about 26% above average, its third consecutive large-range bar, while volume was slightly above average; both fit the lookback’s expansion and rising participation. PSAR turned downward, with a next-session high above 536.60 required for a conditional upward reversal.
IWM · D:2026-11-06 NC% ▲ +0.99% OC% ▲ +0.62%
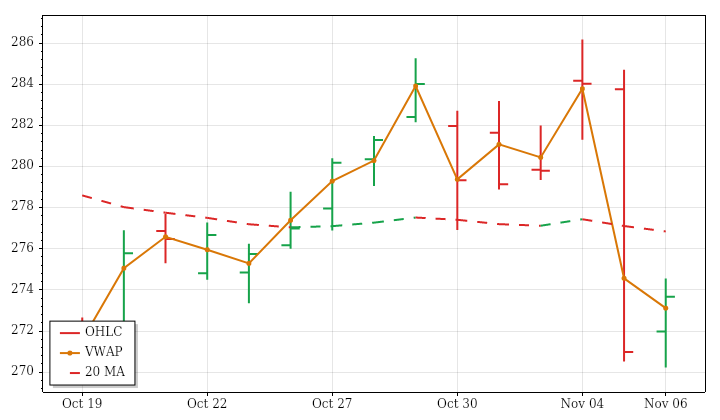
IWM – Small Cap Technicals Summary
IWM’s completed November 6 daily session closed at 273.67, up 0.99% from the prior close and 0.62% from the open. Its opening gap up was filled, followed by a finish above session VWAP. Despite the gain, the session registered a lower high and lower low, and the close remained inside the prior day’s range rather than establishing a stronger daily price structure.
The 15-session price trend was rising but highly choppy. Price remained below its rising near-term average and nearly flat, slightly rising far-term average, while the intermediate-term average was falling above price. This left the latest rebound at odds with an unresolved broader structure. Range was roughly average and volume slightly above average, against expanding ranges and increasing volume over the lookback. PSAR turned downward; a next-session high above 285.373 would conditionally trigger an upward reversal.
IJH · D:2026-11-06 NC% ▲ +0.60% OC% ▲ +0.50%
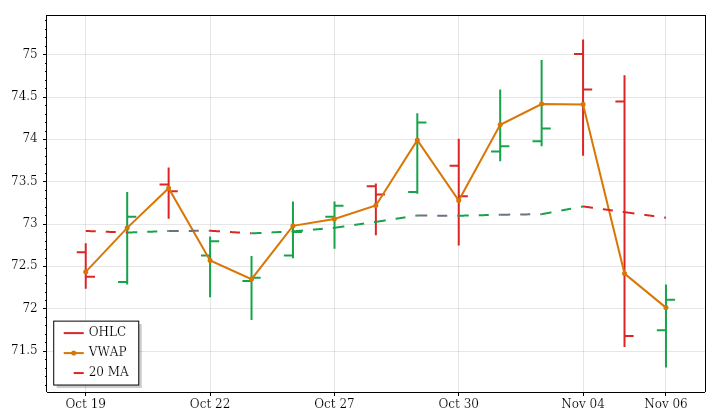
IJH – Mid Cap Technicals Summary
IJH’s completed November 6 daily session ended at 72.11, gaining 0.60% from the prior close and 0.50% from the open. The small opening gap up was filled before the session finished near its high and above VWAP. However, a lower high and lower low, with the close still inside the previous day’s range, limited the significance of the positive finish.
The rising 15-session price trend was choppy and did not establish alignment across horizons. Price remained below rising near- and far-term averages, while the intermediate-term average was falling above it. Volume was about 34% above average, giving the rebound stronger participation, but the range was slightly below average despite an expanding lookback range trend. PSAR had turned downward; a next-session high above 74.9865 would be required for a conditional upward reversal.
SPY · D:2026-11-06 NC% ▲ +0.31% OC% ▲ +0.06%
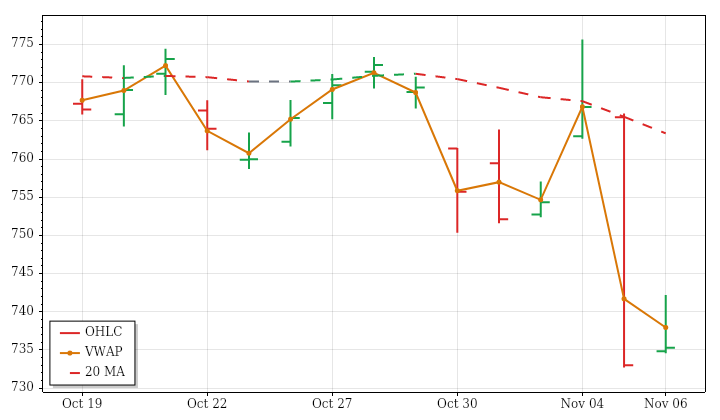
SPY – S&P 500 Technicals Summary
SPY’s completed November 6 daily session closed at 735.29, up 0.31% from the prior close but only 0.06% from the open. Its small opening gap up remained unfilled, accounting for most of the daily gain. Trading stayed inside the previous day’s range, and the finish near the session low and below VWAP showed limited follow-through after the open despite the positive close-to-close return.
Price remained below falling near- and intermediate-term averages and below a still-rising far-term average. The latest gain therefore conflicted with the declining 15-session price trend without resolving the longer-term positional weakness. Range was below average, whereas volume was about 18% above average; lookback ranges and volume were both increasing. PSAR had turned downward, and a next-session high above 773.4935 would be required for a conditional upward reversal.
S&P 500 News and Fundamentals
The S&P 500 fell 4.36% on November 5, having entered the session less than 2% below its October 6 record close. The decline followed Wednesday's post-election rally and marked U.S. stocks' sharpest one-day selloff in more than a year. The index was experiencing its largest drawdown since the start of the Iran war.
QQQ · D:2026-11-06 NC% ▲ +1.40% OC% ▼ -0.34%
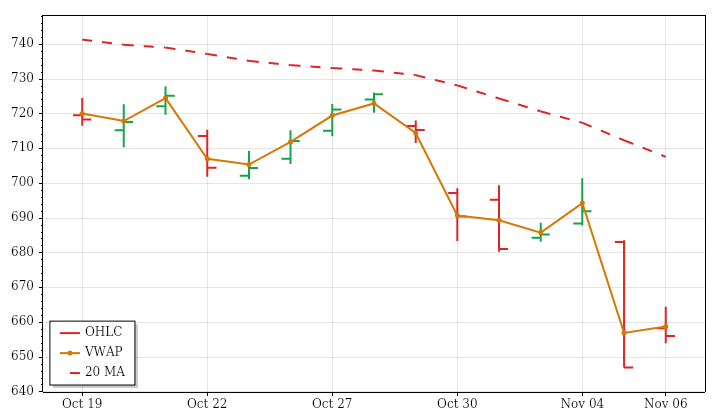
QQQ – Nasdaq 100 Technicals Summary
QQQ’s completed November 6 daily session ended at 656.10, gaining 1.40% from the prior close while slipping 0.34% from the open. The opening gap up remained unfilled, so the daily advance reflected the gap rather than continued progress during the session. An inside bar, a finish near the session low and a close below VWAP all qualified the strength of that positive return.
Near- and intermediate-term averages remained falling above price. The far-term average was still rising, but price traded below it, creating a mixed longer-term condition alongside clear shorter-term weakness. The declining 15-session trend therefore remained consistent with the broader setup. Range was below average, while volume was about 43% above average, contrasting with the lookback’s expansion in both range and participation. A next-session high above 699.4761 would conditionally reverse the downward PSAR state.
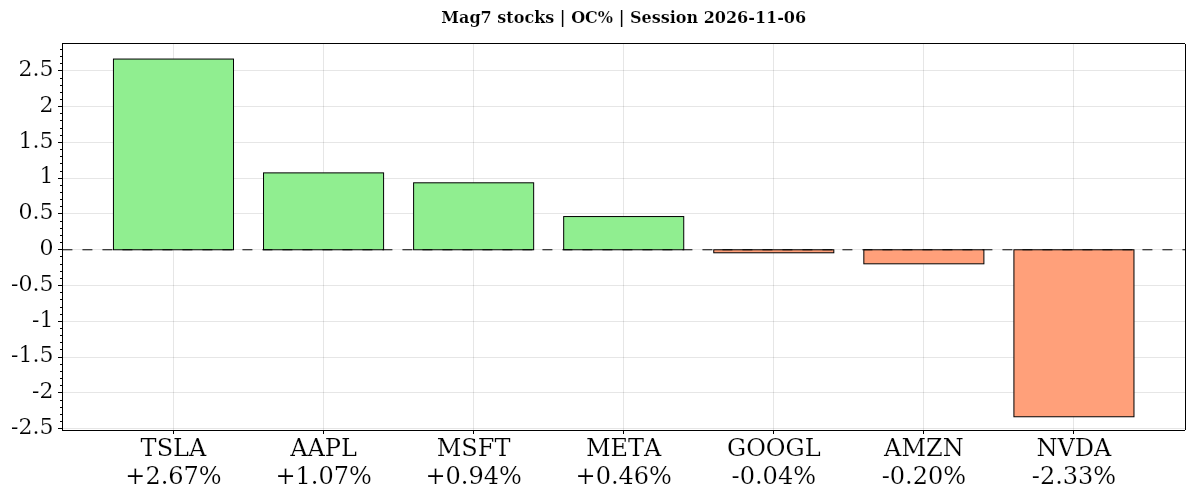
| Instrument | Bias | Date | DNC% | DOC% | O | H | L | C | VWAP | Vol |
|---|---|---|---|---|---|---|---|---|---|---|
| ▲ TSLA | ▲ ▲ ▲ | 2026-11-06 | ▲ +4.23% | ▲ +2.67% | 348.92 | 363.84 | 347.60 | 358.22 | ▲ 358.04 | 36,586,386 |
| ▲ AAPL | ▼ ▲ ▼ | 2026-11-06 | ▼ -0.52% | ▲ +1.07% | 338.73 | 345.79 | 338.30 | 342.37 | ▼ 342.86 | 43,172,096 |
| ▲ MSFT | ▼ ▲ ▼ | 2026-11-06 | ▼ -0.99% | ▲ +0.94% | 525.69 | 538.33 | 524.47 | 530.61 | ▼ 531.95 | 26,275,193 |
| ▲ META | ▲ ▲ ▼ | 2026-11-06 | ▲ +0.84% | ▲ +0.46% | 607.33 | 625.60 | 606.66 | 610.15 | ▼ 616.10 | 15,652,735 |
| ▼ GOOGL | ▲ ▼ ▼ | 2026-11-06 | ▲ +0.78% | ▼ -0.04% | 284.90 | 290.49 | 284.59 | 284.78 | ▼ 286.36 | 36,335,208 |
| ▼ AMZN | ▼ ▼ ▼ | 2026-11-06 | ▼ -0.35% | ▼ -0.20% | 259.81 | 264.18 | 258.53 | 259.30 | ▼ 261.36 | 41,136,304 |
| ▼ NVDA | ▲ ▼ ▼ | 2026-11-06 | ▲ +2.78% | ▼ -2.33% | 191.10 | 194.90 | 185.22 | 186.64 | ▼ 189.04 | 179,191,641 |
| AVG/Sum | — | — | +0.97% | +0.37% | — | — | — | — | — | 378,349,563 |
Mag7 Stocks
Positive confluence: average DNC% +0.97%, DOC% +0.37%. Four of seven gained from the open: TSLA led at +2.67%, while NVDA lagged at -2.33%; versus the prior close, TSLA still led and MSFT lagged. NVDA nevertheless gained 2.78% versus the prior close, but remained below VWAP and falling near-term averages.
TSLA · D:2026-11-06 NC% ▲ +4.23% OC% ▲ +2.67%
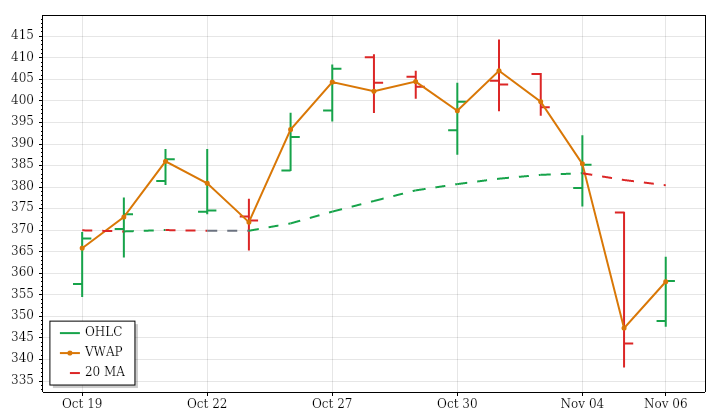
TSLA – Tesla Technicals Summary
TSLA’s completed November 6 daily session closed at 358.22, advancing 4.23% from the prior close and 2.67% from the open. The opening gap up remained unfilled, and the close was marginally above session VWAP. Even so, the session was an inside bar, meaning the strong rebound remained contained within the previous day’s range rather than establishing a new daily high.
Near- and intermediate-term averages were rising, but price remained below both, leaving those horizons mixed. Price also remained below a falling far-term average. The rising but choppy 15-session price trend therefore did not amount to broad trend alignment. Range was above average for a third consecutive large-range session, while volume was below average despite its rising lookback trend. PSAR remained downward; a next-session high above 403.1984 would conditionally trigger an upward reversal.
Tesla News and Fundamentals
Elon Musk said Tesla will wind down Cybertruck production at Gigafactory Texas around mid-2027 to make room for increased Cybercab robotaxi output. Cybertruck sales fell 48% in 2025 and another 38% through September 2026, far below Musk's early vision of 250,000 vehicles annually. The Cybercab shift places greater emphasis on a robotaxi business that still requires customers, regulatory approval and proven economics.
AAPL · D:2026-11-06 NC% ▼ -0.52% OC% ▲ +1.07%
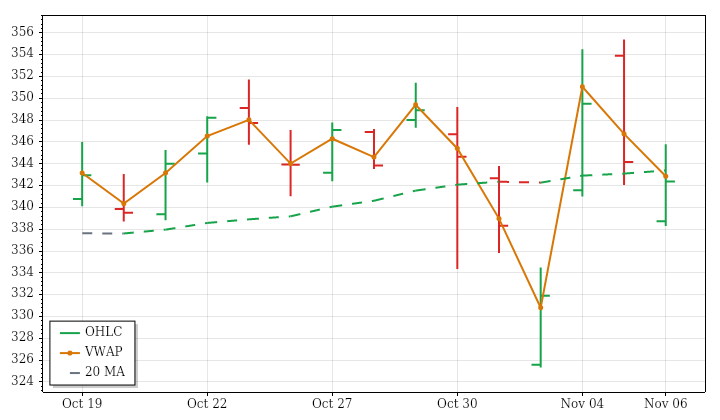
AAPL – Apple Technicals Summary
AAPL’s completed daily session on November 6 closed at 342.37, down 0.52% from the prior close despite gaining 1.07% from the open. The opening gap down was filled, but that recovery did not hold through the close. A lower high and lower low showed continued pressure, although the finish remained inside the previous day’s range. Closing below session VWAP also tempered the intraday rebound.
The broader structure remained stronger than the latest daily return: near-, intermediate- and far-term averages were rising, with price above all three, though only marginally above the near-term benchmark. The mildly declining, highly choppy 15-session price trend therefore conflicted with that alignment. Range was roughly average and volume was subdued, unlike the lookback’s expanding ranges and increasing volume. A next-session low below 329.6873 would conditionally reverse the upward PSAR state.
Apple News and Fundamentals
Apple says software support for its new foldable iPhone Duo is improving after early reviews criticized the lack of Duo-optimized apps at launch. The company also returned to the bond market despite substantial cash holdings. Separately, researcher Derik Kauffman criticized Apple's autocomplete restrictions as a light-touch form of censorship, saying their impact is amplified by the company's scale.
MSFT · D:2026-11-06 NC% ▼ -0.99% OC% ▲ +0.94%
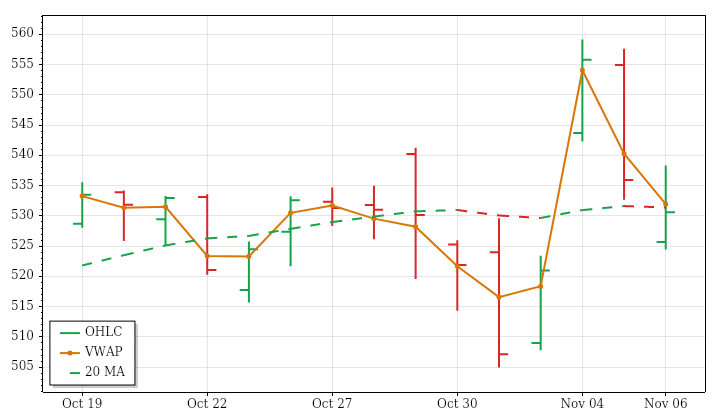
MSFT – Microsoft Technicals Summary
MSFT’s completed November 6 daily session closed at 530.61, down 0.99% from the prior close despite rising 0.94% from the open. The opening gap down was filled, but the recovery faded sufficiently to leave the close below the previous day’s low and session VWAP. A lower high and lower low reinforced the distinction between an intraday rebound and a weaker daily finish.
Price remained just above a falling near-term average, creating mixed short-term conditions, while intermediate- and far-term averages were rising beneath it. Those stronger broader structures contrasted with the latest decline. The slightly rising 15-session price trend showed very little directional progress, consistent with choppy movement rather than persistent gains. Range and volume were both essentially average despite expanding ranges and rising lookback volume. A next-session low below 510.2435 would conditionally reverse the upward PSAR state.
Microsoft News and Fundamentals
Microsoft reported fiscal Q1 2027 revenue of $92.3 billion, up 19% year over year, with Azure growth of 48% and Microsoft Cloud revenue growth of 30%, despite gross-margin compression. People familiar with the matter said Microsoft plans to reduce its neocloud partners while retaining key suppliers and expanding its own infrastructure. The company has offered buyouts to about 60,000 employees. Separately, anti-AI protesters entered its Amsterdam data-center construction site.
META · D:2026-11-06 NC% ▲ +0.84% OC% ▲ +0.46%
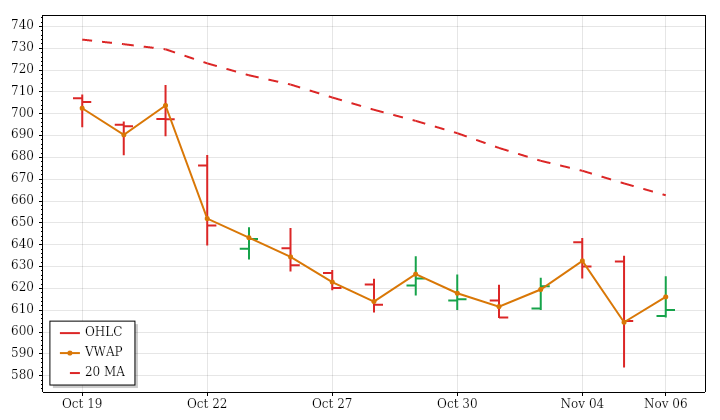
META – Meta Platforms Technicals Summary
META’s completed November 6 daily session finished at 610.15, gaining 0.84% from the prior close and 0.46% from the open. The opening gap up remained unfilled, but the session stayed inside the previous day’s range. A close near the session low and below VWAP qualified the advance: price improved versus the prior close without maintaining a strong position within the day’s trading.
Near- and intermediate-term averages continued falling above price. The far-term average was still rising, but price was below it, leaving that horizon mixed rather than clearly positive. The comparatively persistent 15-session decline therefore remained the dominant backdrop. Range was below average, while volume was only about 58% of average despite rising lookback participation. PSAR remained downward; a next-session high above 640.1255 would be necessary for a conditional upward reversal.
Meta News and Fundamentals
Meta reported negative free cash flow of $2.12 billion in Q3 2026. Price per ad rose 14%, outgrowing impressions for the first time since early 2025. Excluding a $9.89 billion legal charge, operating margin was 35%; costs have outpaced revenue for five consecutive quarters. Meta also launched Spaces for communicating and collaborating with its recently introduced Muse agents. Separately, it is creating Class C nonvoting shares that effectively produce a 2-for-1 split while preserving Mark Zuckerberg's voting control.
GOOGL · D:2026-11-06 NC% ▲ +0.78% OC% ▼ -0.04%
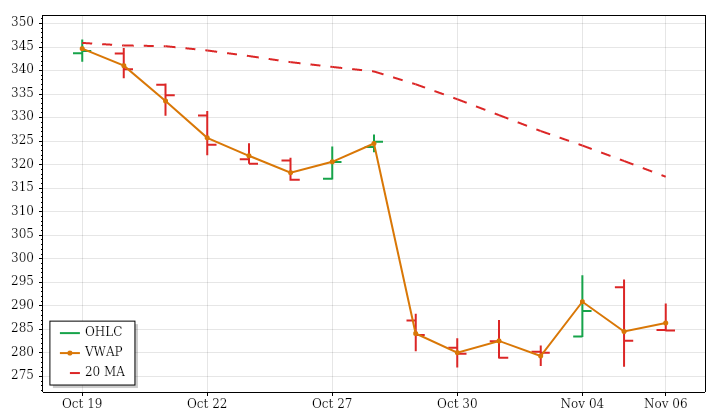
GOOGL – Alphabet Technicals Summary
GOOGL’s completed November 6 daily session closed at 284.78, up 0.78% from the prior close but down 0.04% from the open. The positive daily return largely reflected an opening gap up that remained unfilled, rather than sustained gains after the open. An inside bar, a finish near the session low and a close below VWAP kept the rebound contained within the preceding day’s trading structure.
Near-, intermediate- and far-term averages were all falling above price, so the latest advance conflicted with a consistently declining trend framework. The 15-session price decline also showed substantially more directional persistence than a merely sideways fluctuation. Both range and volume were below average, unlike the lookback’s expanding ranges and rising volume. PSAR remained downward; a next-session high above 295.60 would be needed to trigger a conditional upward reversal.
AMZN · D:2026-11-06 NC% ▼ -0.35% OC% ▼ -0.20%
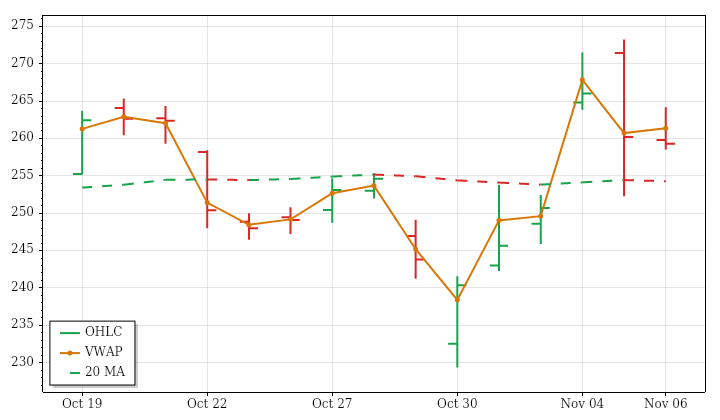
AMZN – Amazon Technicals Summary
AMZN’s completed November 6 daily session ended at 259.30, down 0.35% from the prior close and 0.20% from the open. The small opening gap down was filled, but trading remained contained within the previous day’s range. A finish near the session low and below VWAP indicated that the early recovery did not translate into a strong close.
Near- and intermediate-term conditions remained mixed: price stood above those benchmarks, but both averages were falling. The far-term average was still rising beneath price, leaving longer-term strength in conflict with shorter-term deterioration and the declining 15-session price trend. The latest range and volume were both below average, contrasting with expanding ranges and increasing participation across the lookback. PSAR remained upward; only a next-session low below 242.1716 would trigger its downward reversal.
Amazon News and Fundamentals
Amazon posted its highest operating margin ever, although reported concerns about its cash flow accompanied a premarket share decline. Separately, Amazon began allowing a small group of invited customers to text its Alexa for Shopping AI agent to search for products, compare options and place orders.
NVDA · D:2026-11-06 NC% ▲ +2.78% OC% ▼ -2.33%
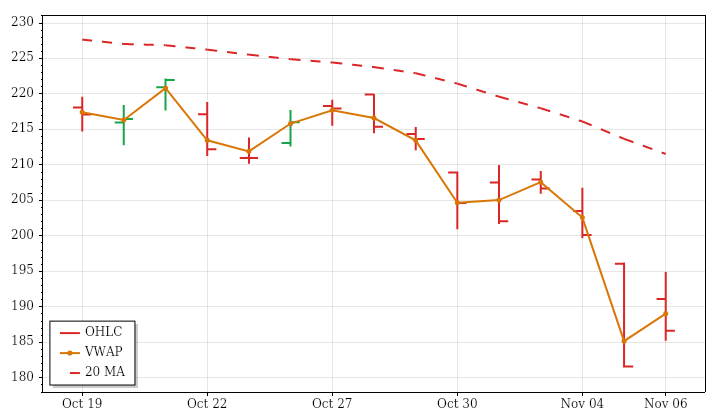
NVDA – Nvidia Technicals Summary
NVDA’s completed November 6 daily session closed at 186.64, up 2.78% from the prior close but down 2.33% from the open. A substantial opening gap up remained unfilled, explaining how a positive daily return coexisted with significant intraday selling. The close below VWAP reinforced that distinction. Despite its unusually wide range, the session remained an inside bar relative to the previous day.
Near- and intermediate-term averages were falling above price. The far-term average was still rising, but price remained below it, leaving the broader framework mixed rather than supportive of the latest advance. The declining 15-session price trend remained intact. Range was roughly 60% above average and volume about 51% above average, extending the lookback’s expansion and increasing participation. PSAR remained downward; a next-session high above 208.8078 would conditionally trigger an upward reversal.
Nvidia News and Fundamentals
Nvidia is finding new ways to support neocloud providers as the industry faces financial strains, potentially exposing it to responsibility for an entire data center rather than just the chips inside. Separately, Nvidia lost slightly more than $447 billion in market capitalization on November 5.
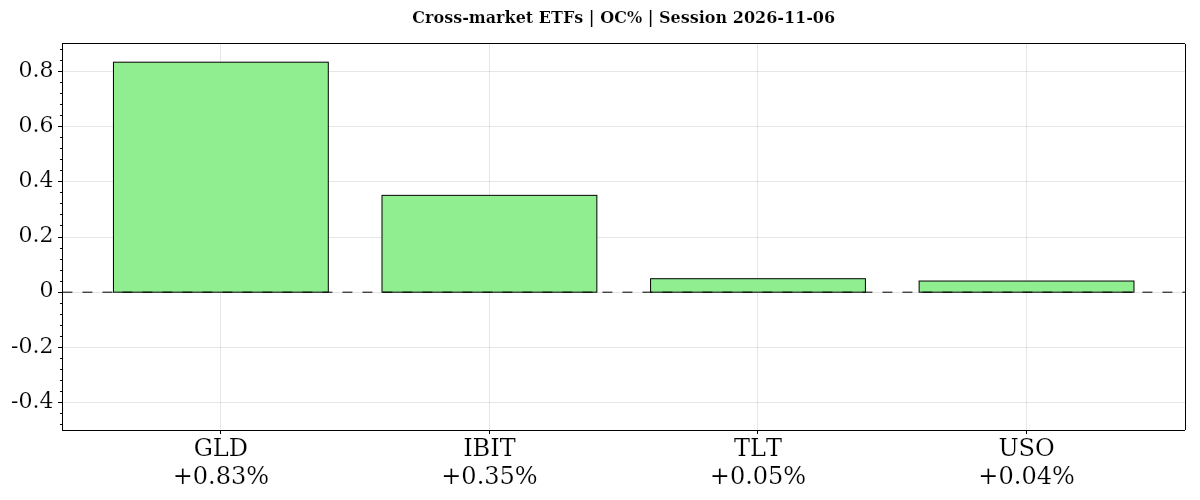
| Instrument | Bias | Date | DNC% | DOC% | O | H | L | C | VWAP | Vol |
|---|---|---|---|---|---|---|---|---|---|---|
| ▲ GLD | ▼ ▲ ▲ | 2026-11-06 | ▼ -0.79% | ▲ +0.83% | 369.44 | 373.76 | 369.26 | 372.52 | ▲ 371.63 | 7,369,584 |
| ▲ IBIT | ▼ ▲ ▲ | 2026-11-06 | ▼ -0.35% | ▲ +0.35% | 42.73 | 43.02 | 42.27 | 42.88 | ▲ 42.75 | 42,529,120 |
| ▲ TLT | ▼ ▲ ▼ | 2026-11-06 | ▼ -0.01% | ▲ +0.05% | 81.88 | 82.42 | 81.71 | 81.92 | ▼ 82.01 | 37,387,828 |
| ▲ USO | ▲ ▲ ▲ | 2026-11-06 | ▲ +0.13% | ▲ +0.04% | 148.35 | 149.41 | 146.70 | 148.41 | ▲ 148.05 | 3,964,479 |
| AVG/Sum | — | — | -0.25% | +0.32% | — | — | — | — | — | 91,251,011 |
Cross-Market ETFs
Mixed: average DNC% -0.26%, DOC% +0.32%. Gold led gains from the open, bitcoin also rose, and bonds and oil were near-flat; versus the prior close, only oil advanced, diverging from mostly higher equities. Gold and bitcoin closed above VWAP despite daily losses, while bonds retained rising shorter-term averages.
GLD · D:2026-11-06 NC% ▼ -0.79% OC% ▲ +0.83%
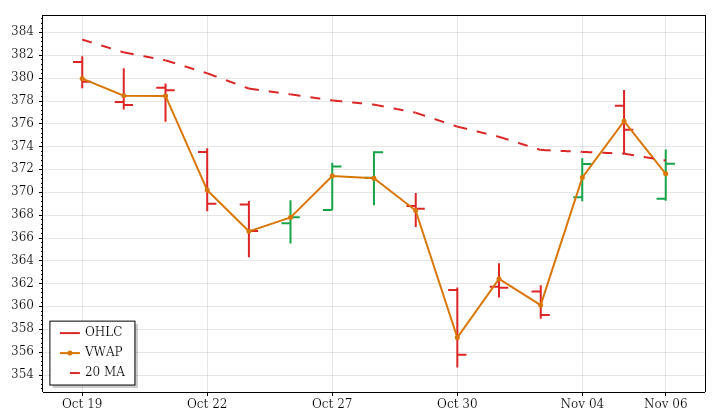
GLD – Gold Technicals Summary
GLD’s completed November 6 daily session finished at 372.52, down 0.79% from the prior close despite advancing 0.83% from the open. The opening gap down remained unfilled, and the close stayed below the previous day’s low. Nevertheless, the finish above session VWAP showed that the intraday recovery had some strength, even though it did not undo the damage relative to the prior session.
Price was above its falling near-term average, leaving that horizon mixed, while intermediate- and far-term averages remained falling above price. The declining 15-session trend therefore aligned with the broader bearish structure rather than the day’s open-to-close gain. Range was above average for a second consecutive large-range session, but volume was below average despite rising lookback participation. PSAR remained upward; a next-session low below 358.1935 would conditionally reverse it downward.
Gold News and Fundamentals
Gold recovered above $4,000 an ounce during the week following Democrats' congressional election sweep, but stronger-than-expected U.S. payrolls subsequently pressured prices. October employment increased by 165,000. On November 6, gold traded near $4,050 after preliminary November consumer sentiment rose to 51 versus expectations of 48, while inflation expectations eased. Walsh Trading's John Weyer identified the Federal Reserve's December decision as an upcoming catalyst for gold and the dollar.
IBIT · D:2026-11-06 NC% ▼ -0.35% OC% ▲ +0.35%
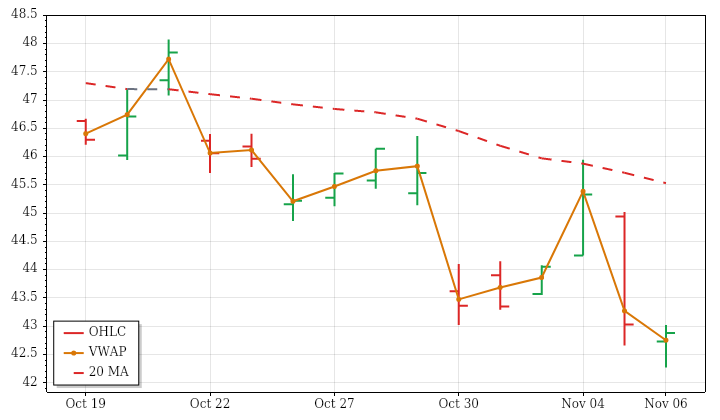
IBIT – Bitcoin Technicals Summary
IBIT’s completed November 6 daily session closed at 42.88, down 0.35% from the prior close but up 0.35% from the open. The opening gap down remained unfilled. Although the session produced a lower high and lower low, the finish stayed inside the previous day’s range, near the session high and above VWAP. Those features describe intraday recovery without reversing the negative daily return.
The trend structure remained divided. Price was below a falling near-term average and below a still-rising intermediate-term average, while remaining above its rising far-term average. Thus, the declining 15-session price trend represented shorter-term weakness within a stronger long-term framework. Range was below average and volume was close to average, contrasting with expanding ranges and rising lookback volume. PSAR remained downward; a next-session high above 45.3938 would conditionally reverse that state.
TLT · D:2026-11-06 NC% ▼ -0.01% OC% ▲ +0.05%
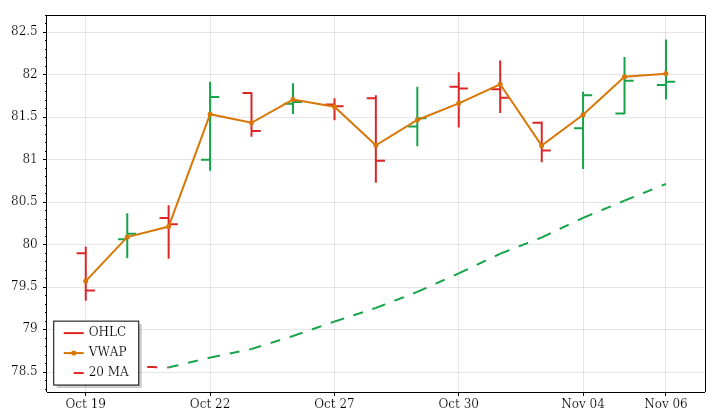
TLT – Long-Term Treasury Bonds Technicals Summary
TLT’s completed November 6 daily session finished at 81.92, almost unchanged from the prior close, with a 0.01% decline and a 0.05% gain from the open. The small opening gap down was filled. A higher high and higher low extended the improving daily structure, but the close remained inside the prior day’s range and below VWAP, showing that the wider movement produced little net progress.
Near- and intermediate-term averages were rising beneath price, aligning with the upward 15-session price trend. The far-term average was still falling above price, however, so shorter-term strength remained embedded in a weaker long-term framework. This was the third consecutive large-range session, with slightly above-average volume; both matched the lookback’s expanding ranges and increasing participation. PSAR turned upward, but a next-session low below 80.9663 would conditionally reverse it downward.
USO · D:2026-11-06 NC% ▲ +0.13% OC% ▲ +0.04%
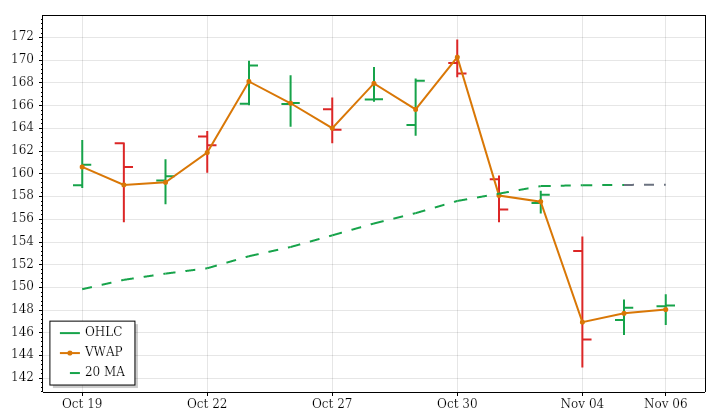
USO – Oil Technicals Summary
USO’s completed November 6 daily session closed at 148.41, up 0.13% from the prior close and just 0.04% from the open. The small opening gap up was filled. Price made a higher high and higher low and exceeded the preceding inside bar’s high, but the close remained within the prior day’s range. Finishing above VWAP offered a positive intraday detail without substantial net progress.
Price remained below rising near- and intermediate-term averages, leaving those horizons mixed, while the far-term average continued rising beneath price. The declining 15-session trend thus contrasted with the stronger long-term structure. Range was only about 58% of average, consistent with lookback contraction, while subdued volume ran against the lookback’s increasing participation. PSAR remained downward; a next-session high above 164.5495 would be required for a conditional upward reversal.
Oil News and Fundamentals
WTI and Brent remained range-bound as falling distillate inventories, resilient U.S. jobs growth and Middle East supply constraints supported oil prices. FGE NexantECA's Fereidun Fesharaki said supply, demand and low inventories justified oil at $80–$90 a barrel, but forecast that oversupply would push prices toward $65–$70 by roughly November 2027.
Glossary: Instrument — ticker symbol; hover for the instrument or company name; Date — session date. DNC% — prior-session close to this session’s close; DOC% — daily session open-to-close percentage change. O — open; H — high; L — low; C — close, all for the table’s daily or weekly session; VWAP — volume-weighted average price; its arrow shows whether the close is above or below VWAP. Vol — period trading volume.
Bias — three directional readings, in order: DNC%, DOC%, then VWAP. ▲ positive/above; ▼ negative/below; — neutral or unavailable. Matching arrows show alignment; opposing arrows show mixed conditions. AVG/Sum — simple average of percentage changes and sum of reported volumes.
Futures Session Fib Grid Analysis – Snapshot
Session Fib Grids normalise market positioning as percentages, making direction and alignment comparable across different asset types.
Latest available snapshot for each instrument; Time(CT) shows the individual update date and time.
| Instrument | Bias | Time(CT) | YSFG | MSFG | WSFG | RSFG | SFG | TSI |
|---|---|---|---|---|---|---|---|---|
| ▲ ES | ▲ ▼ ▲ ▲ ▼ ▲ | 2026-11-09 07:38:33 | ▲ +30 | ▼ -53 | ▲ +35 | ▲ +60 | ▼ -3 | ▲ +111 |
| ▲ NQ | ▲ ▼ ▲ ▲ ▼ ▲ | 2026-11-09 07:38:34 | ▲ +15 | ▼ -50 | ▲ +22 | ▲ +48 | ▼ -6 | ▲ +103 |
| ▲ YM | ▲ ― ▲ ▲ ▲ ▲ | 2026-11-09 07:38:27 | ▲ +27 | — 0 | ▲ +35 | ▲ +49 | ▲ +3 | ▲ +151 |
| ▲ EMD | ▲ ▼ ▲ ▲ ▲ ▲ | 2026-11-09 07:38:33 | ▲ +29 | ▼ -14 | ▲ +30 | ▲ +46 | ▲ +4 | ▲ +157 |
| ▲ RTY | ▲ ▼ ▲ ▲ ▲ ▲ | 2026-11-09 07:38:33 | ▲ +33 | ▼ -19 | ▲ +42 | ▲ +71 | ▲ +2 | ▲ +120 |
| ▲ FDAX | ▲ ▲ ▲ ▲ ▲ ▲ | 2026-11-09 07:38:25 | ▲ +33 | ▲ +23 | ▲ +54 | ▲ +87 | ▲ +9 | ▲ +225 |
| ▲ NKD | ▲ ▼ ▲ ▲ ▼ ▲ | 2026-11-09 07:38:34 | ▲ +103 | ▼ -41 | ▲ +23 | ▲ +35 | ▼ -2 | ▲ +91 |
| Instrument | Bias | Time(CT) | YSFG | MSFG | WSFG | RSFG | SFG | TSI |
|---|---|---|---|---|---|---|---|---|
| ▼ BTC | ▼ ▼ ▼ ▼ ▼ ▼ | 2026-11-09 07:38:33 | ▼ -58 | ▼ -23 | ▼ -31 | ▼ -3 | ▼ -14 | ▼ -25 |
| ▼ GC | ▼ ▲ ▲ ▼ ▲ ▲ | 2026-11-09 07:38:35 | ▼ -119 | ▲ +58 | ▲ +28 | ▼ -3 | ▲ +4 | ▲ +132 |
| ▼ CL | ▲ ▼ ▼ ▼ ▼ ▼ | 2026-11-09 07:38:33 | ▲ +148 | ▼ -80 | ▼ -34 | ▼ -78 | ▼ -3 | ▼ -186 |
| ▼ 6E | ▼ ▲ ▲ ▼ ▼ ▲ | 2026-11-09 07:38:35 | ▼ -57 | ▲ +14 | ▲ +36 | ▼ -6 | ▼ -1 | ▲ +80 |
| ▲ ZB | ▼ ▲ ▲ ▲ ▲ ▲ | 2026-11-09 07:38:26 | ▼ -26 | ▲ +22 | ▲ +13 | ▲ +6 | ▲ +22 | ▲ +153 |
Glossary: YSFG — yearly; MSFG — monthly; WSFG — weekly; RSFG — regular trading hours (RTH); SFG — the current session, including pre-market or other sessions. TSI indicates trend strength and power.
Bias shows trend alignment across these six readings. The arrows follow the column order: YSFG, MSFG, WSFG, RSFG, SFG and TSI. Matching arrows show alignment; opposing arrows show mixed conditions.
Futures Higher Time Frame Analysis
Summary of the current state of US Indices Futures based on higher time-frame (HTF) technical analysis as of: 2026-11-09 07:35 -06:00 CT.
US Indices Futures
- ES YSFG/WSFG above F0%, MSFG below F0%, declining 5–20-week benchmarks, pivot DTrend, support 7322.25, resistance 7535.00–7683.25.
- NQ YSFG/WSFG above F0%, MSFG below F0%, below 5–20-week benchmarks, pivot DTrend, support 26368.50, reversal thresholds 27812.50 daily/28789.00 weekly.
- YM YSFG/WSFG above F0%, MSFG below center, below 5–20-week benchmarks, weekly HiLo UTrend, support 50859–50891, reversal thresholds 52435 daily/53377 weekly.
- EMD YSFG/WSFG above F0%, MSFG below F0%, below all daily benchmarks, pivot DTrend, support 3560.7, reversal thresholds 3679.1 daily/3772.7 weekly.
- RTY YSFG/WSFG above F0%, MSFG below F0%, below all daily benchmarks, daily HiLo DTrend, support 2714.2, reversal threshold 2813.7, resistance 2888.7.
- FDAX YSFG/WSFG above F0%, MSFG below F0%, above rising 20-week benchmark, pivot DTrend, support 25965/24925, reversal threshold 26451, resistance 26784–26847.
Overall State
- Short-Term: Bearish
- Intermediate-Term: Bearish
- Long-Term: Bullish
Conclusion
Daily downside pivot structures correlate across the indices, with MSFG positioning below center despite YSFG and WSFG holding above F0%. Weekly DTrend pivots reflect retracements within broader rising long-term benchmark structures. EMD and RTY show greater daily benchmark weakness, remaining below all averages; YM and FDAX retain stronger long-term daily benchmark alignment. Nearby swing supports define the current structural tests, while pivot-reversal thresholds mark overhead recovery references. FDAX’s recent MSFG and WSFG short signals coexist with its current above-F0% weekly positioning.
Note: Intra-day counter-trend pullbacks or retracements may occur, HTF is context for informational usage and market structure. Glossary: Session Fib Grids periods of YSFG:’Yearly’, MSFG:’Monthly’, WSFG:’Weekly’
For full details visit: AlphaWebTrader Technicals
SPY Daily View
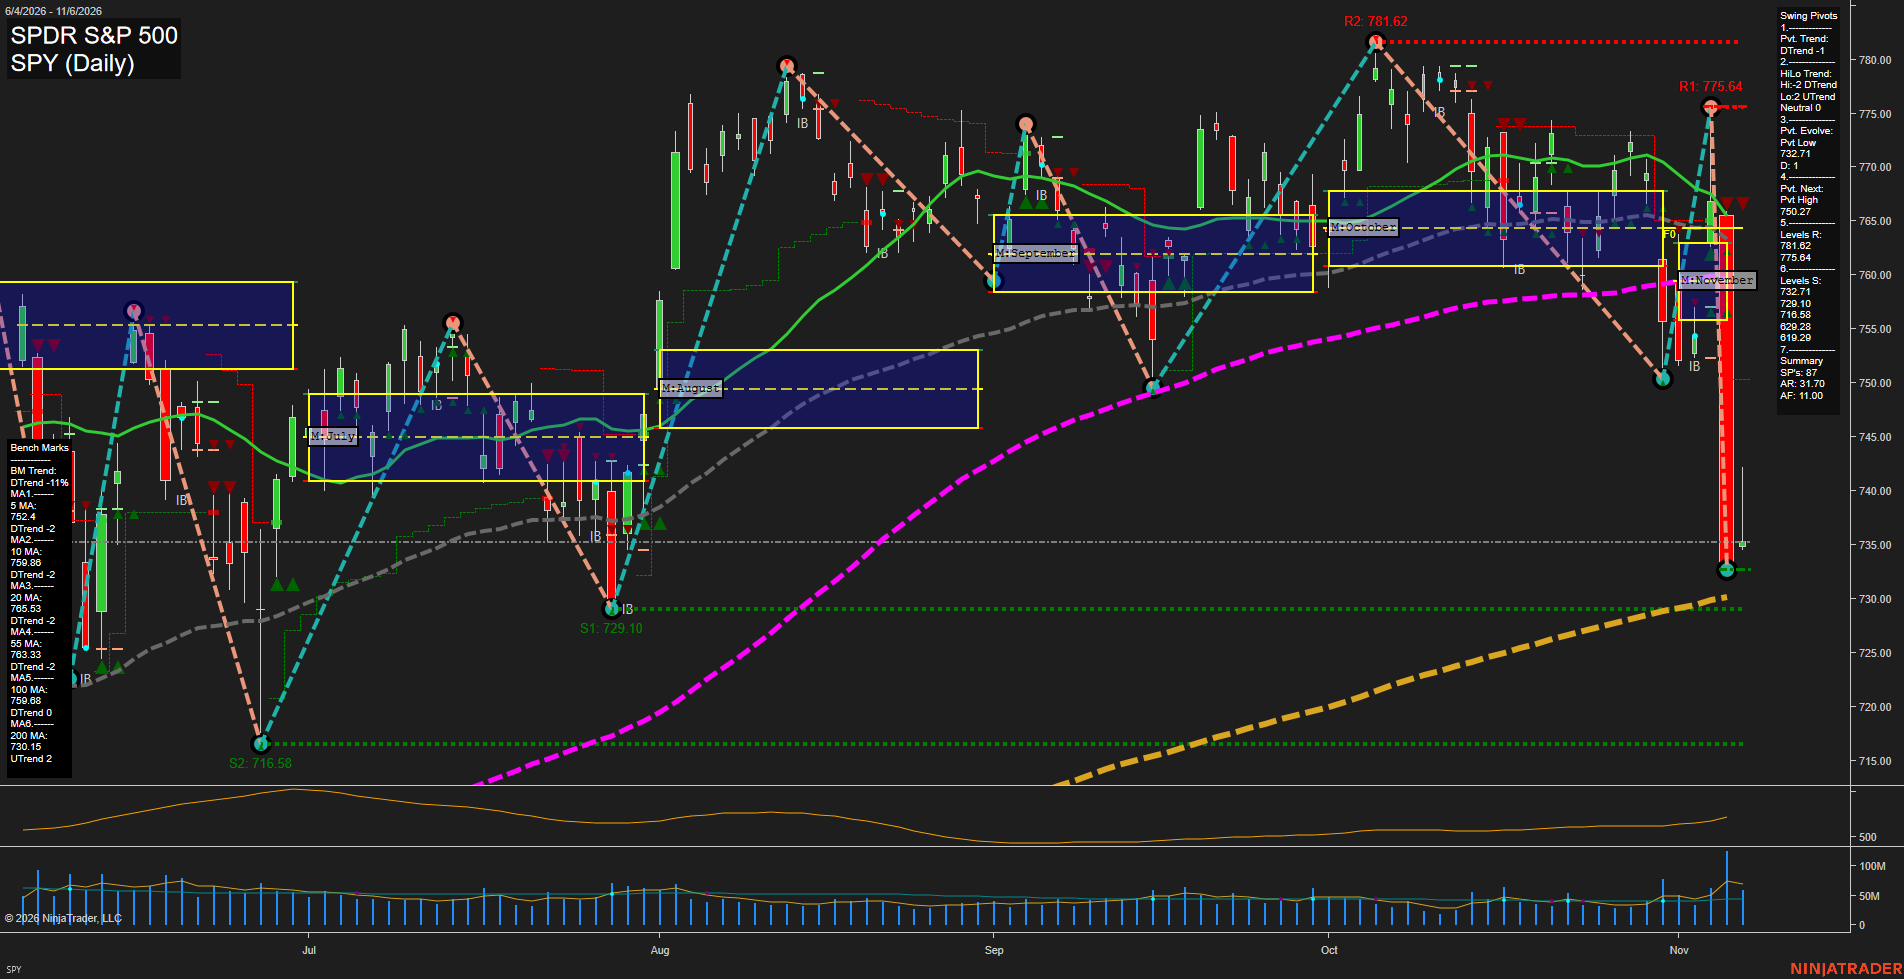
Overall Rating
- Short-Term: Bearish
- Intermediate-Term: Bearish
- Long-Term: Neutral.
Key Insights Summary
The futures swing structure is decisively risk-off in the short and intermediate horizons: a large-range decline drove SPY beneath all 5 through 100-day benchmarks and below the November MSFG range. Both pivot trend measures are DTrend, confirming a lower-high/lower-low sequence after the October high near 781.62. Price is testing the 732.71 pivot-low area immediately above the rising 200-day benchmark at 730.15; this creates a major long-term inflection zone. A sustained break beneath 729.10 would expose the prior 716.58 swing support, while a countertrend recovery would first confront 750.27, then the densely clustered 5-to-100-day average band from roughly 752 to 766. Elevated range expansion and increasing volume characterize the current selloff, indicating fast downside momentum rather than orderly consolidation.
View charts on: AlphaWebTrader HTF Charts
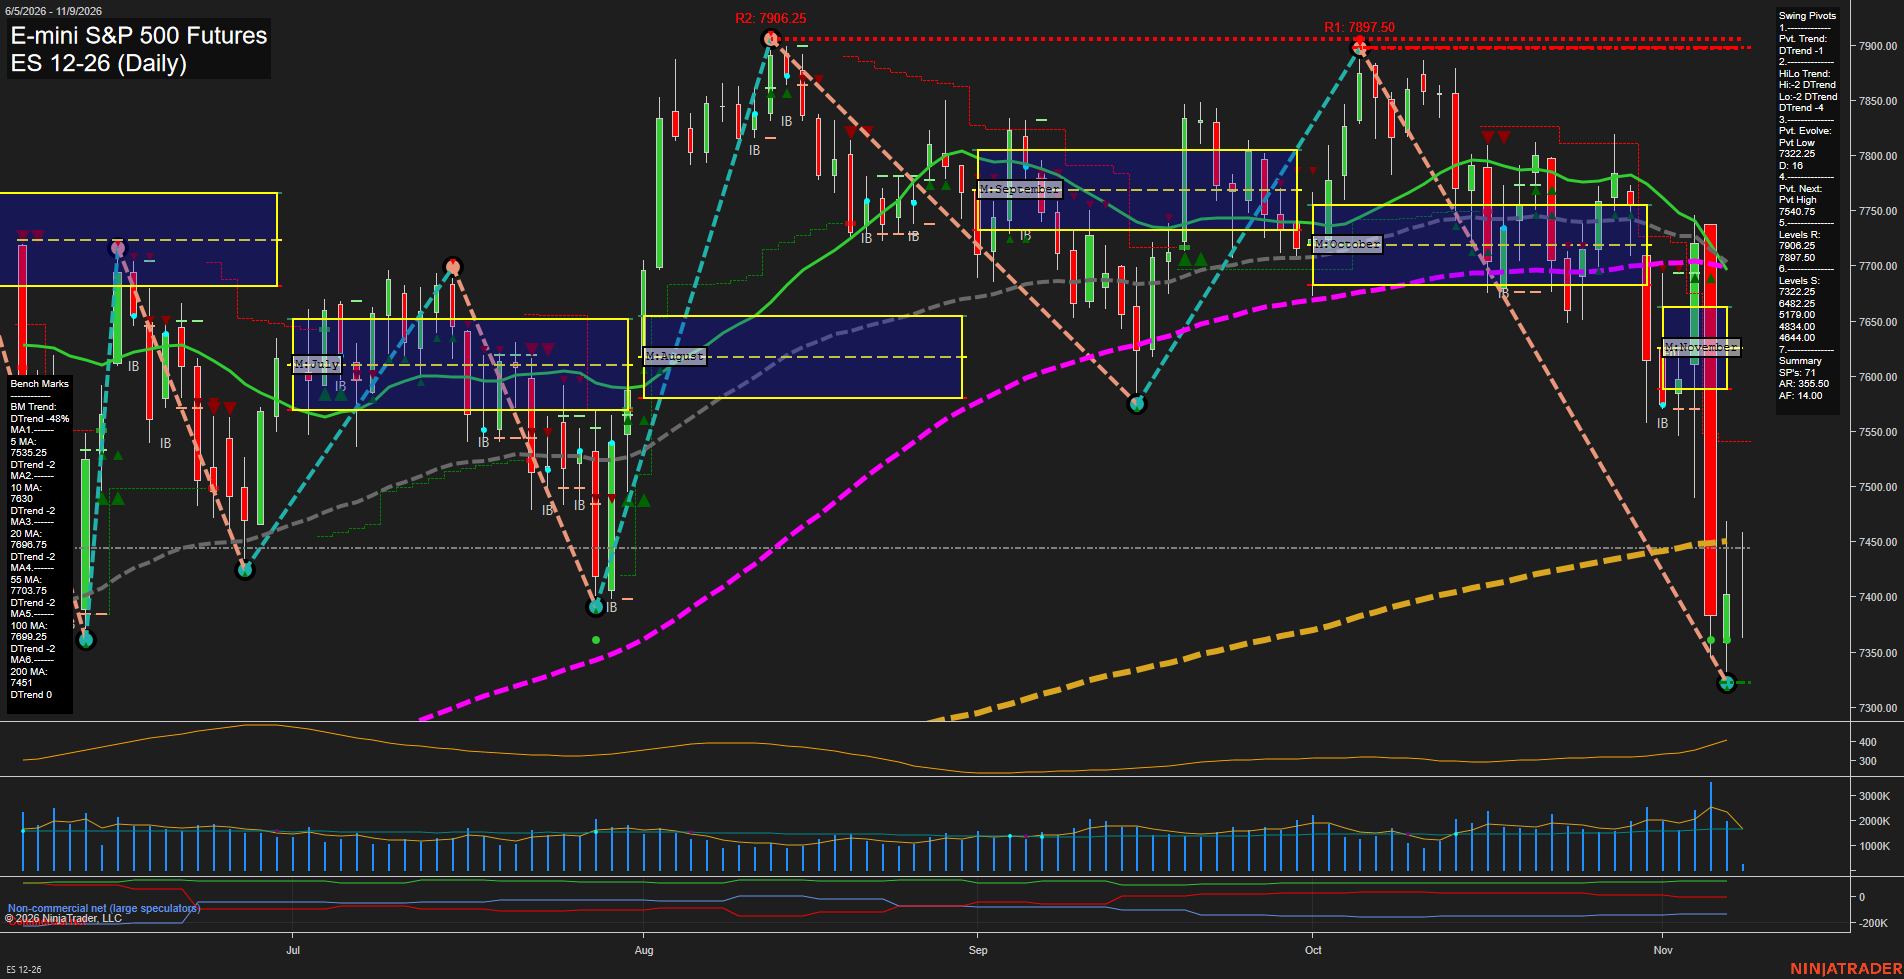
ES Daily View
Overall Rating
- Short-Term: Bearish
- Intermediate-Term: Bearish
- Long-Term: Neutral.
Key Insights Summary
The daily structure reflects a sharp, high-volatility downside expansion from the October recovery high, with price breaking beneath every short- and intermediate-term benchmark and undercutting the 200-day average. The active short-term and intermediate-term pivot trends are both down, confirmed by the new 7325 pivot low and lower-high sequence from the 7900 area. Weekly positioning remains above its F0% reference and the yearly grid remains positive, preserving a longer-cycle recovery backdrop; however, the November monthly grid is decisively below F0%, showing that the current swing phase is a material countertrend decline within that broader yearly context. The 7540.75 pivot threshold and 7522.25 support area frame the immediate rebound/rejection zone, while elevated ATR and expanding volume characterize a fast, liquidation-style move rather than orderly consolidation.
View charts on: AlphaWebTrader HTF Charts
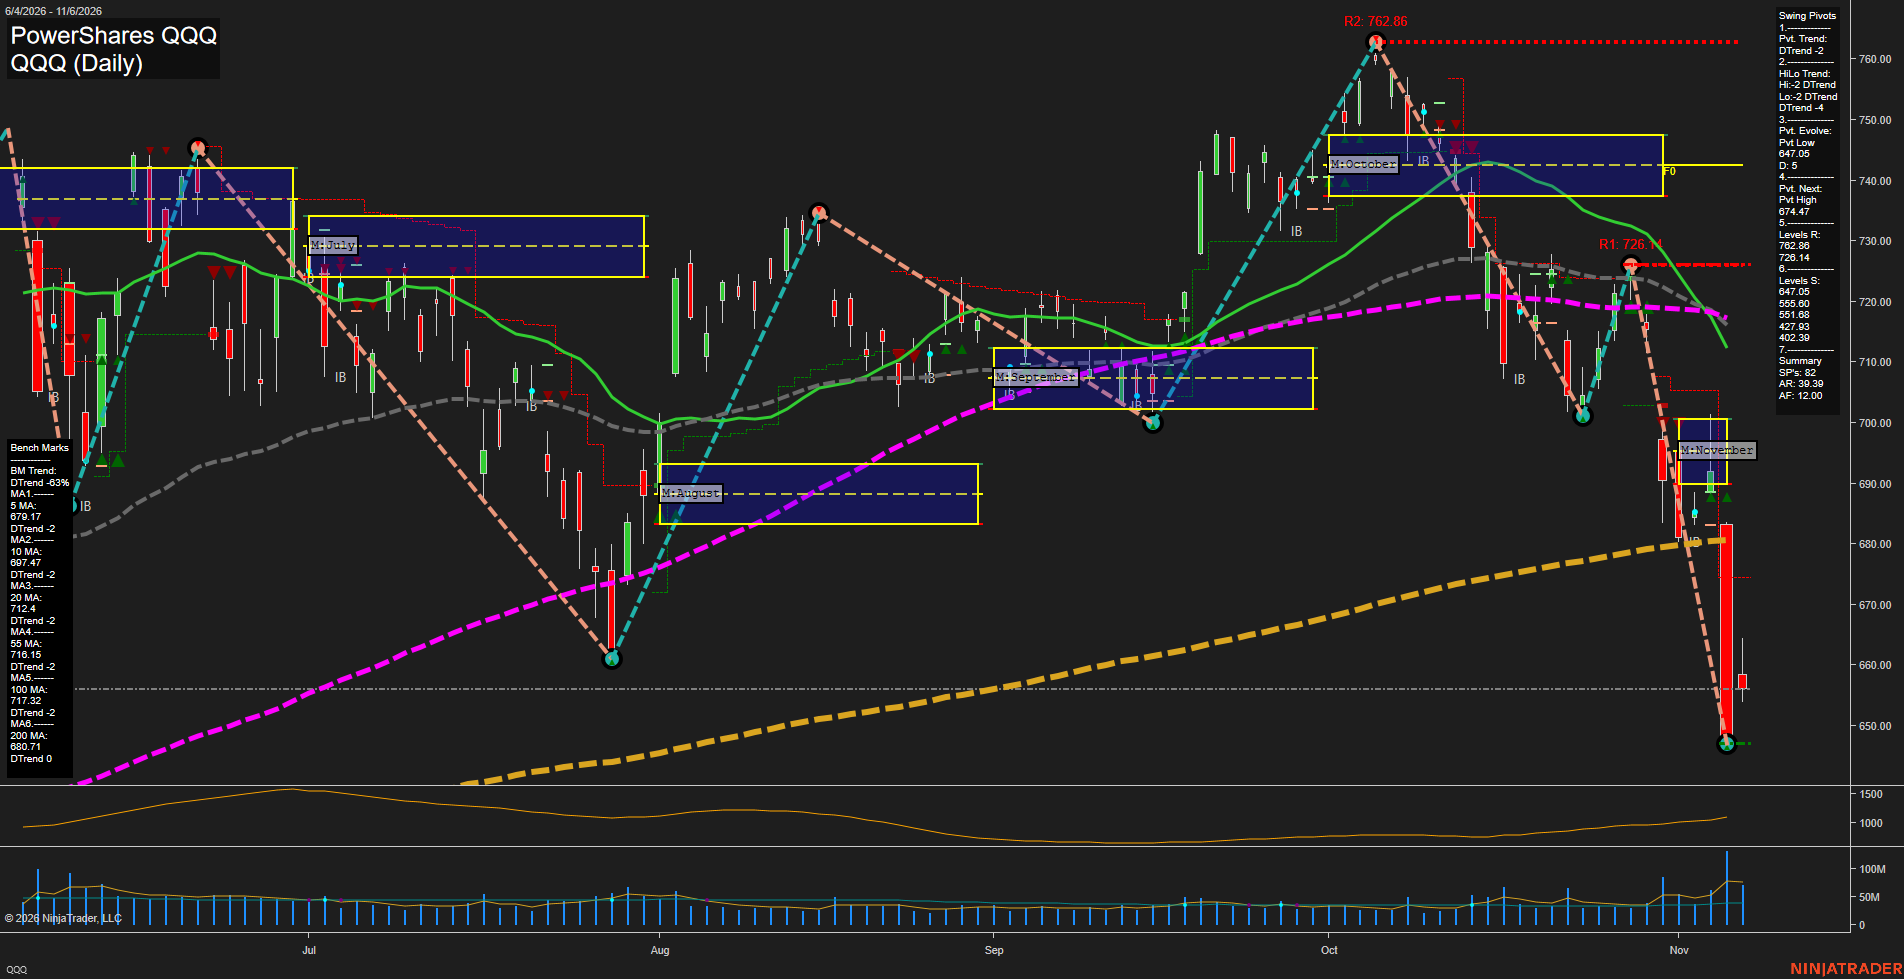
QQQ Daily View
Overall Rating
- Short-Term: Bearish
- Intermediate-Term: Bearish
- Long-Term: Bearish.
Key Insights Summary
QQQ, and by extension Nasdaq futures structure, reflects an impulsive downside swing: large-range bars, fast downside momentum, and price below every listed benchmark. The 647.05 pivot low is the active short-term structure reference, while 674.47 is the next opposing pivot threshold and 679.17 to 697.47 is a dense short-term moving-average overhead zone. The November MSFG is decisively below its NTZ/F0 area, confirming an intermediate bearish displacement rather than ordinary consolidation. Elevated volatility and expanding volume behavior characterize a liquidation-style move; the pivot sequence remains lower-high/lower-low until a new pivot high is established.
View charts on: AlphaWebTrader HTF Charts
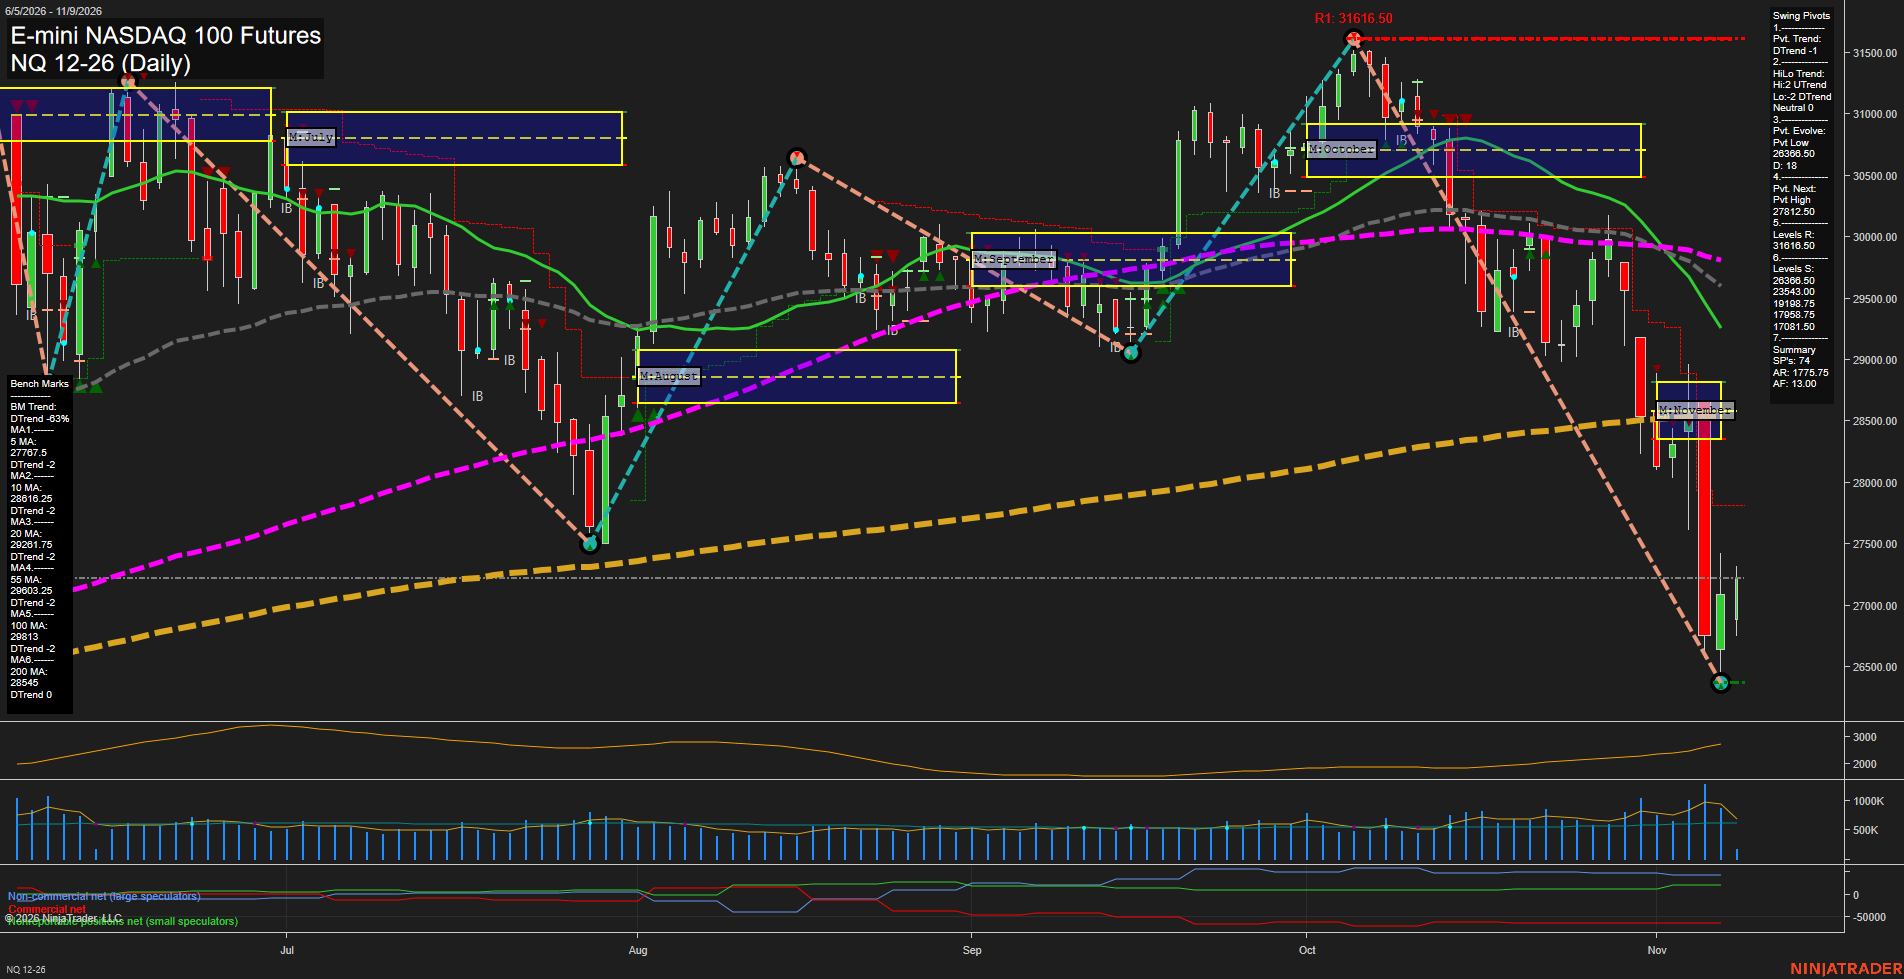
NQ Daily View
Overall Rating
- Short-Term: Bearish
- Intermediate-Term: Bearish
- Long-Term: Neutral.
Key Insights Summary
Price action reflects a high-volatility liquidation leg from the October peak, with large daily ranges, accelerating momentum, lower highs, and a break beneath all short- and intermediate-term benchmark averages. The weekly fib structure remains positive, producing a counter-trend rebound from the 26368.50 pivot low, but the monthly grid remains negative and the pivot trend is still down. The 27812.50 pivot-next level and declining 5-day average define the first recovery threshold, while 26368.50 is the active structural support. The longer-term yearly grid remains above its centerline, although declining 100-day and 200-day benchmarks show that the broader advance has shifted into a substantial corrective phase.
View charts on: AlphaWebTrader HTF Charts
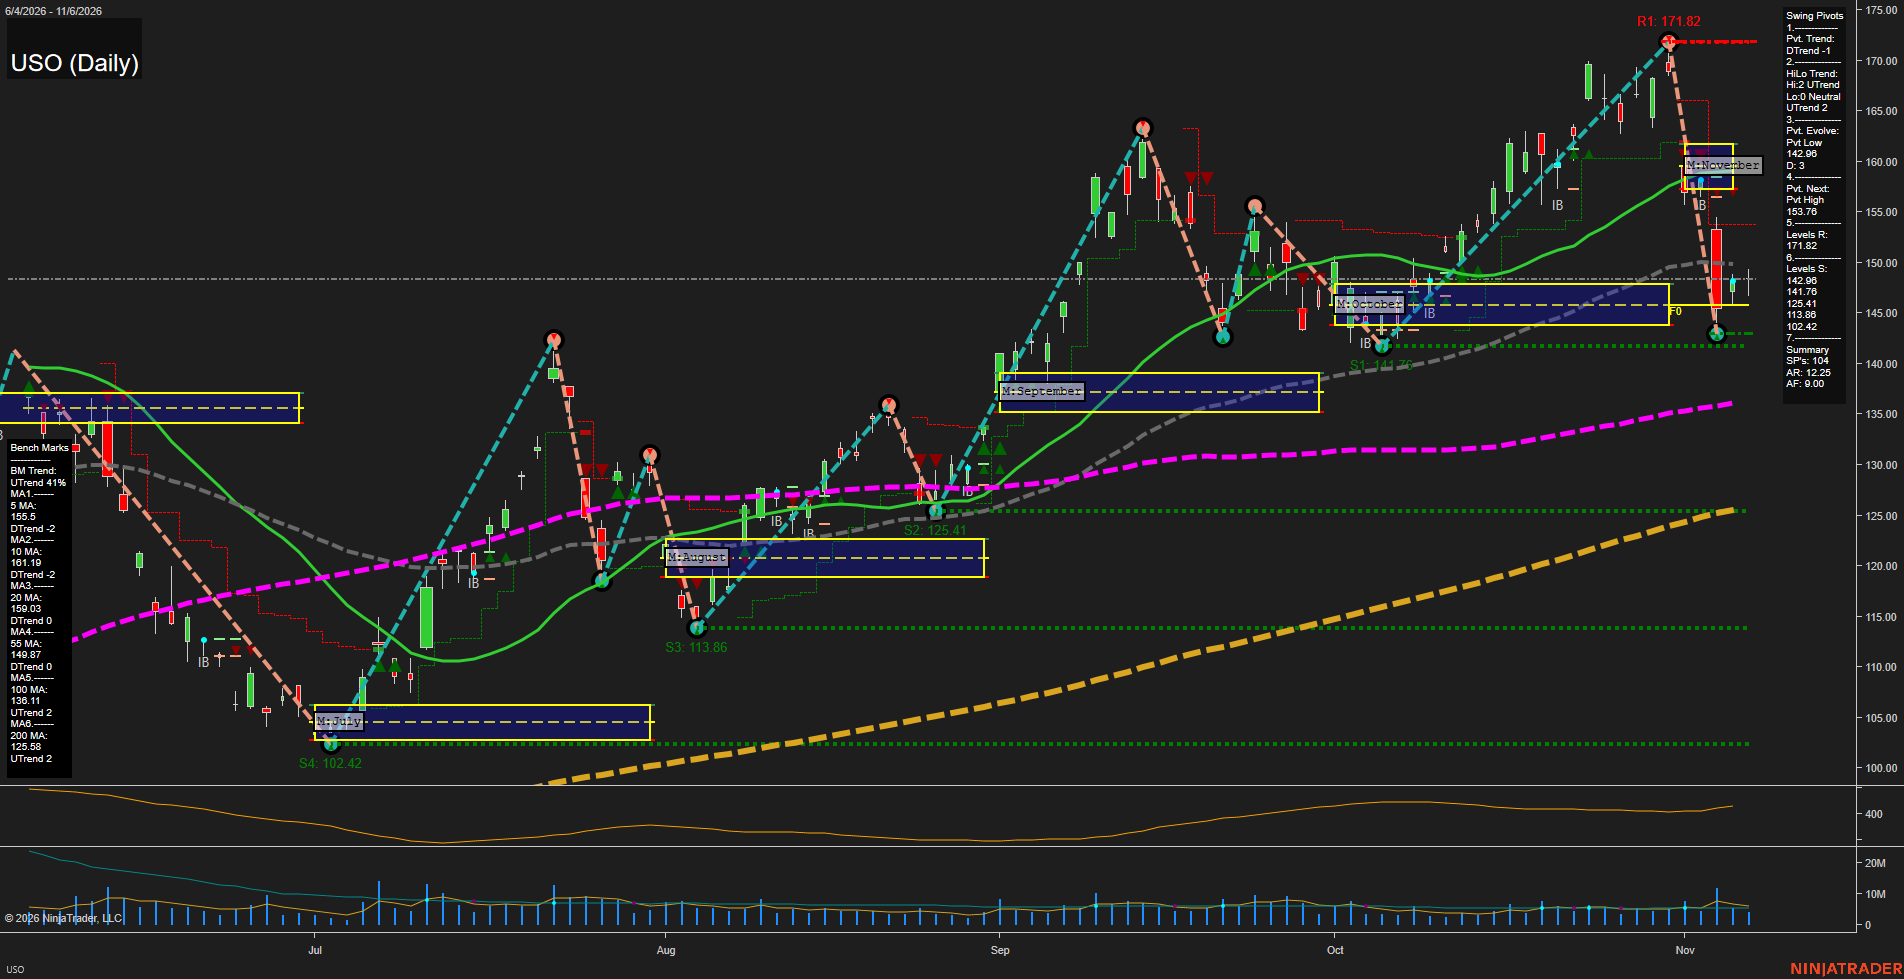
USO Daily View
Overall Rating
- Short-Term: Bearish
- Intermediate-Term: Neutral
- Long-Term: Bullish.
Key Insights Summary
USO reflects a sharp, high-volatility futures-style liquidation from the 171.82 pivot high into the 142.98 pivot low, followed by a rebound to 147.96. Short-term structure remains bearish because price is below the declining 5-, 10-, and 20-day benchmarks, while 153.76 is the next pivot reversal threshold. The 141.76 support area remains the immediate reference beneath price. Intermediate structure is mixed: the broader HiLo trend remains positive, but price is marginally below the 55-day benchmark after the rapid selloff. Long-term structure remains constructive, with price holding above rising 100- and 200-day averages; the decline is currently a substantial retracement within that larger upward trend.
View charts on: AlphaWebTrader HTF Charts
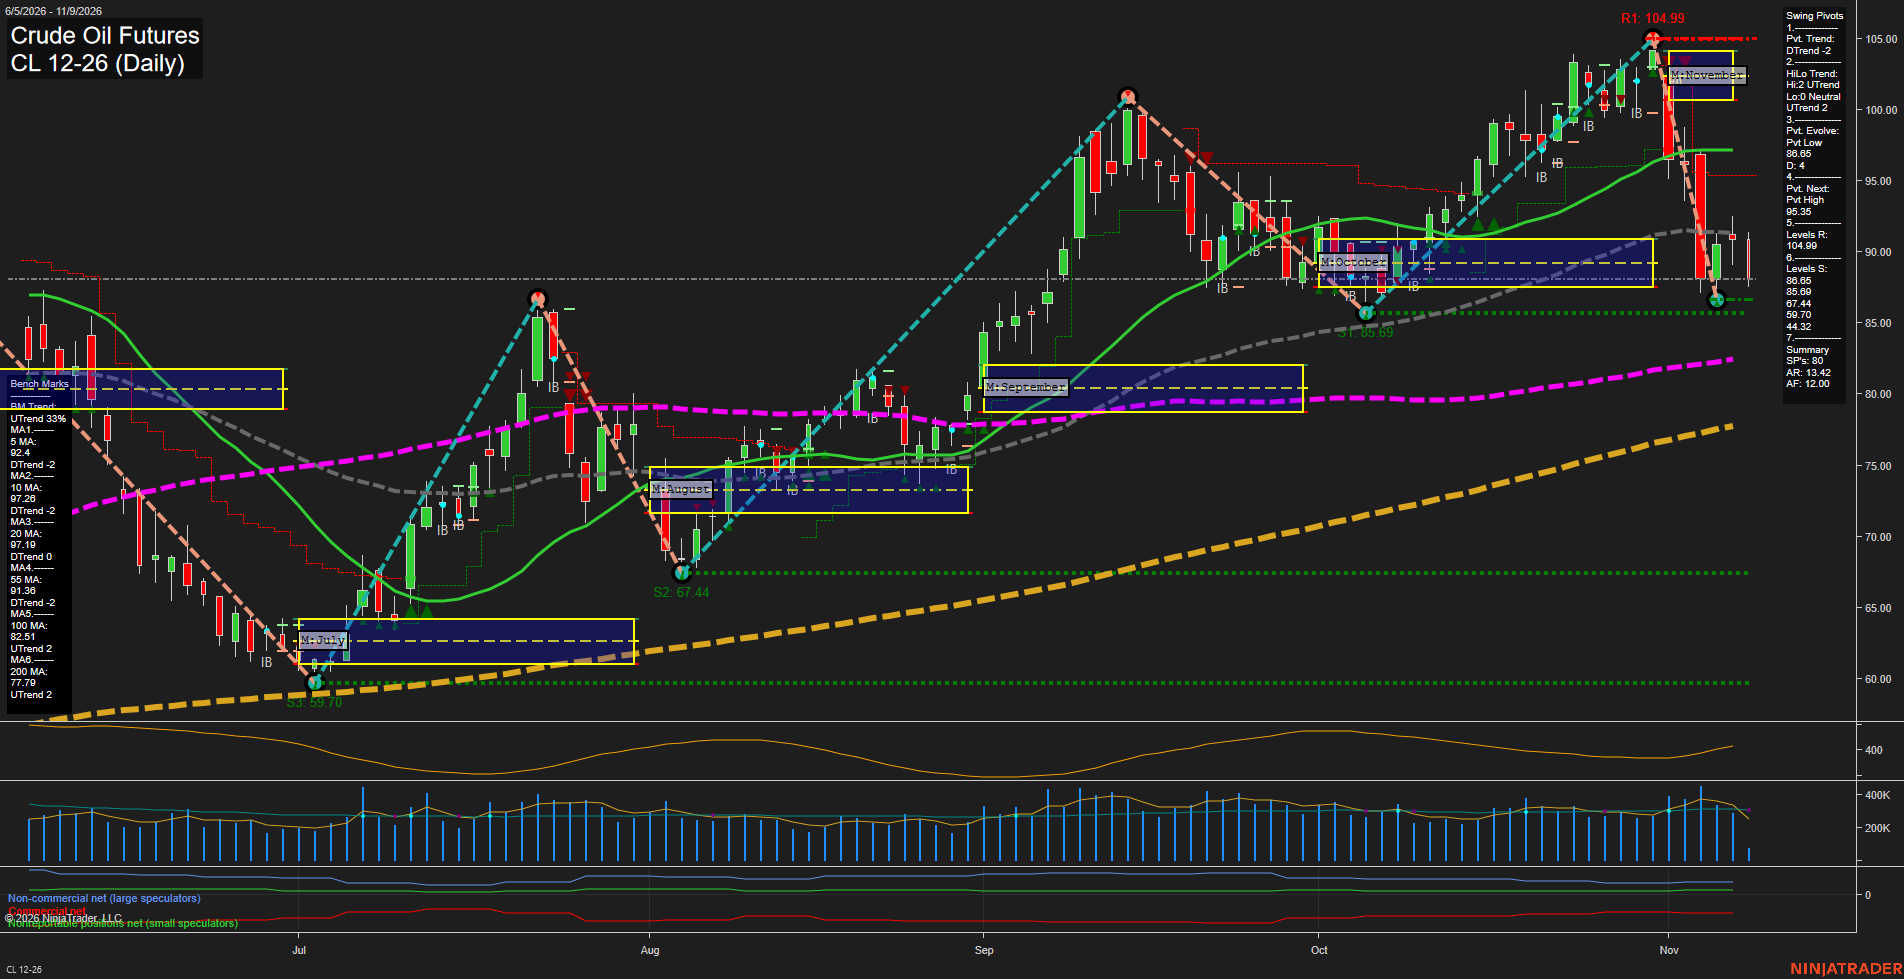
CL Daily View
Overall Rating
- Short-Term: Bearish
- Intermediate-Term: Bearish
- Long-Term: Bullish.
Key Insights Summary
CL has shifted from the late-October advance into a sharp, high-volatility selloff, with large daily bars driving price beneath the weekly and November F0% areas and below the 5-, 10-, 20-, and 55-day benchmarks. The short-term pivot structure is in DTrend, while the 88.65 to 87.44 support band is the immediate downside reference area following the rebound from the recent pivot low. Intermediate structure is pressured by the monthly grid and declining intermediate moving averages, although the HiLo pivot trend remains UTrend. The broader yearly structure remains constructive because price is still above rising 100- and 200-day benchmarks; the current decline therefore reads as a strong countertrend retracement within the larger 2026 advance.
View charts on: AlphaWebTrader HTF Charts
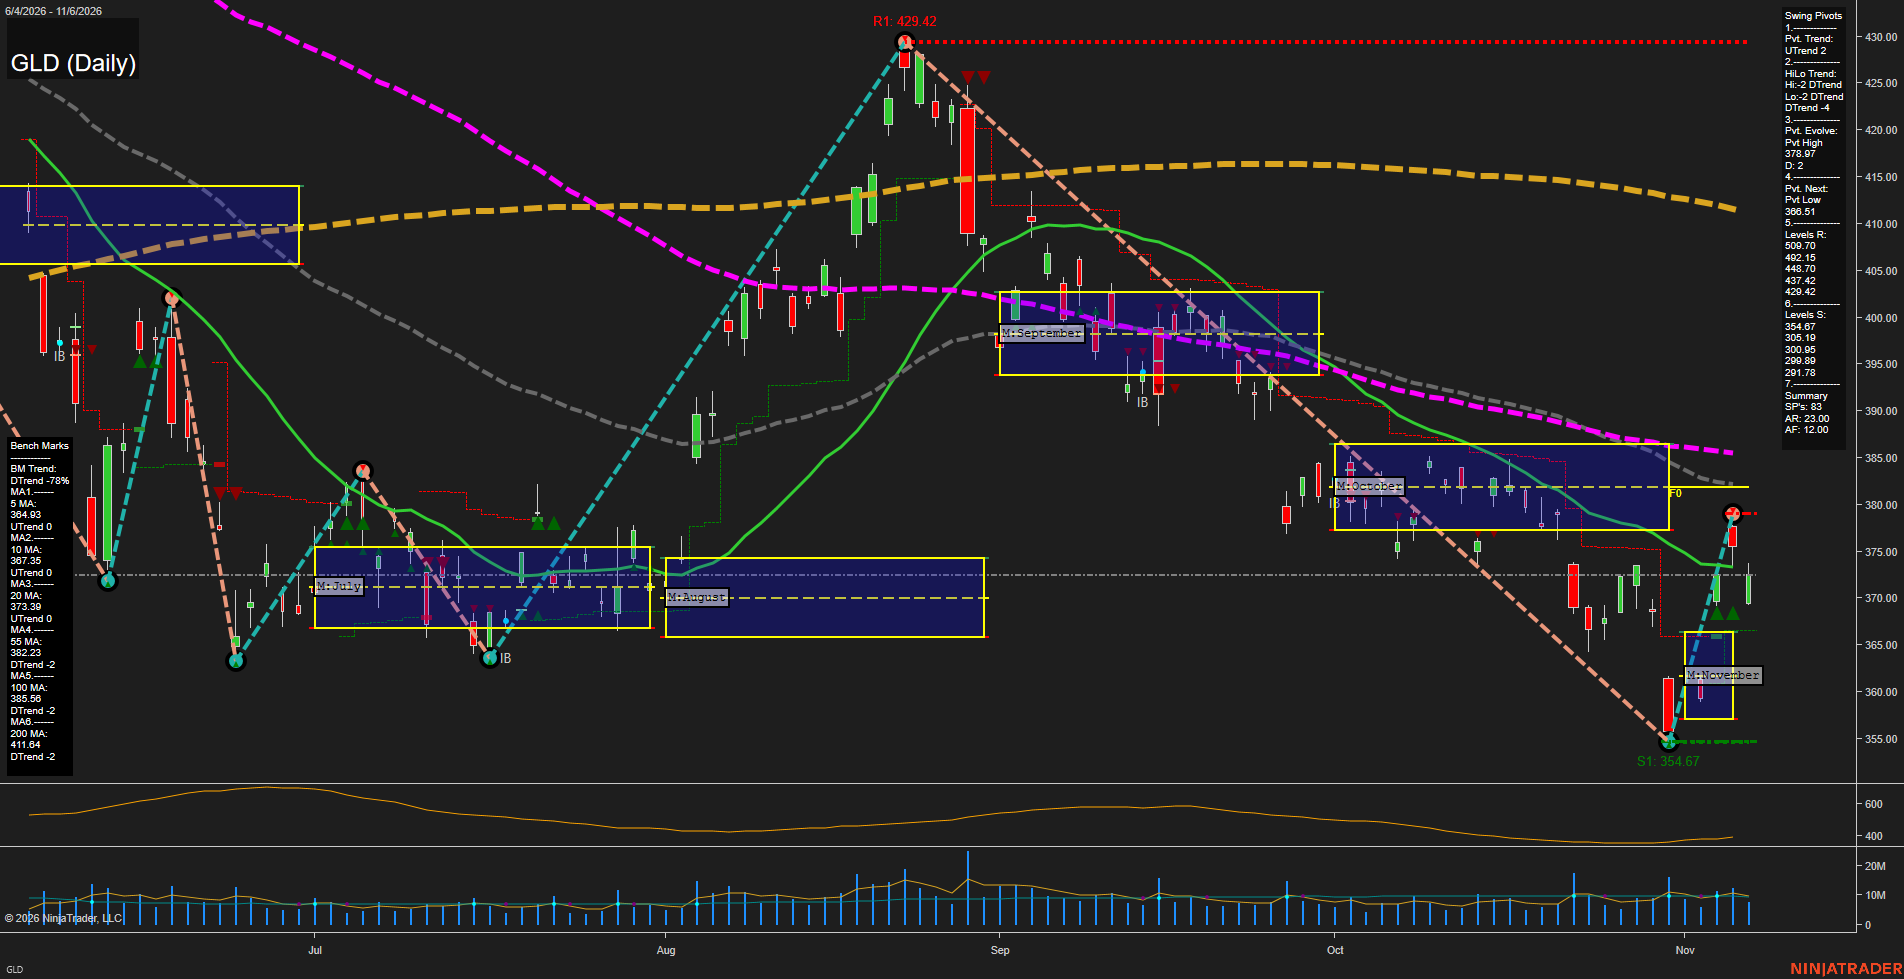
GLD Daily View
Overall Rating
- Short-Term: Bullish
- Intermediate-Term: Bearish
- Long-Term: Bearish.
Key Insights Summary
GLD reflects a short-term rebound from the 354.67 swing low, confirmed by the UTrend pivot condition and recovering 5-day benchmark. The rebound remains counter-trend on the intermediate and long-term structure: price is below the 20-, 55-, 100-, and 200-day benchmark cluster, while the HiLo trend remains DTrend. The 378.97 evolving pivot high and 382.23 to 385.56 benchmark area define the nearby overhead recovery zone, while 368.51 is the immediate pivot reversal reference and 364.67 is the principal nearby swing support. From a futures swing-trader perspective, the market is displaying elevated daily range behavior and a sharp reflex bounce inside a broader lower-high, lower-low decline rather than a confirmed intermediate trend reversal.
View charts on: AlphaWebTrader HTF Charts
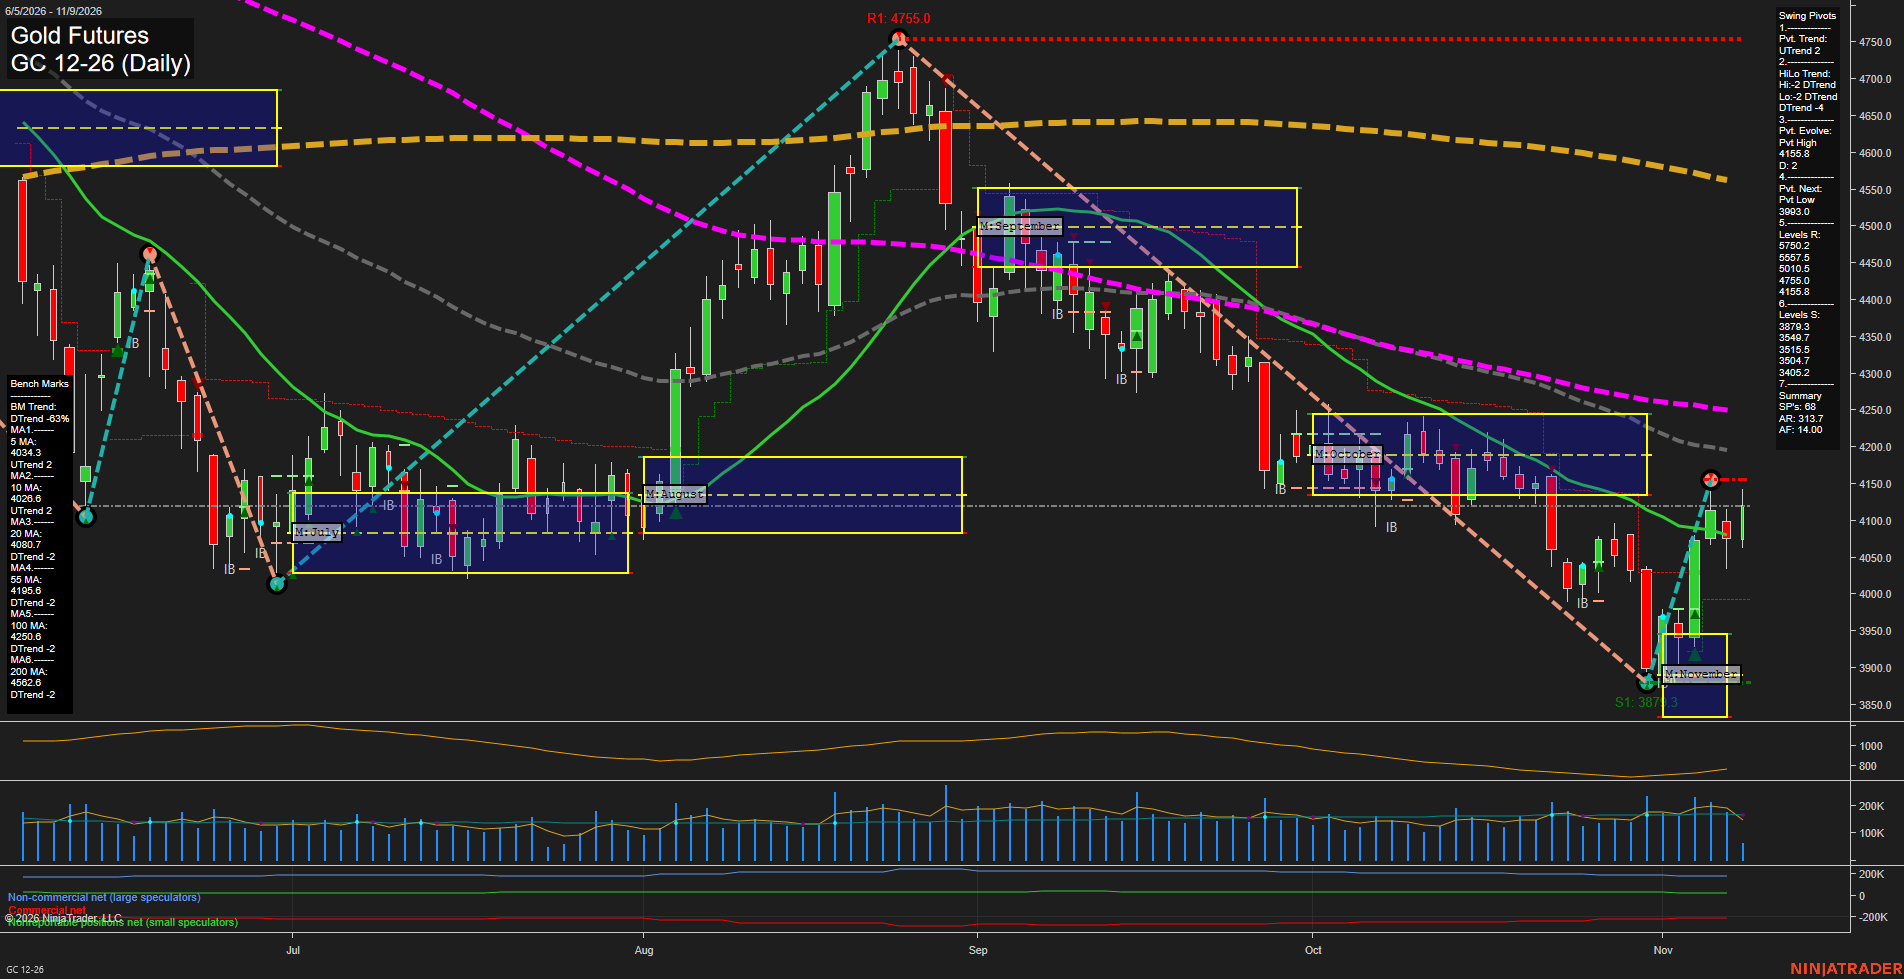
GC Daily View
Overall Rating
- Short-Term: Bullish
- Intermediate-Term: Bearish
- Long-Term: Bearish.
Key Insights Summary
Gold has produced a sharp short-term V-recovery from the 3879.3 swing-low support area, restoring the short-term pivot trend to UTrend and lifting price above the rising 10-day and declining 20-day benchmarks. The recovery remains counter-trend on the broader structure: the HiLo pivot trend is DTrend, price remains beneath the 55-, 100-, and 200-day averages, and the yearly fib-grid bias remains below. The 4155.8 pivot-high resistance is the immediate technical ceiling, with the 4195.8 55-day average and October range overhead. Price action is volatile and directional after the November low, while the medium-sized bars and elevated ATR reflect an active retracement within the larger decline.
View charts on: AlphaWebTrader HTF Charts
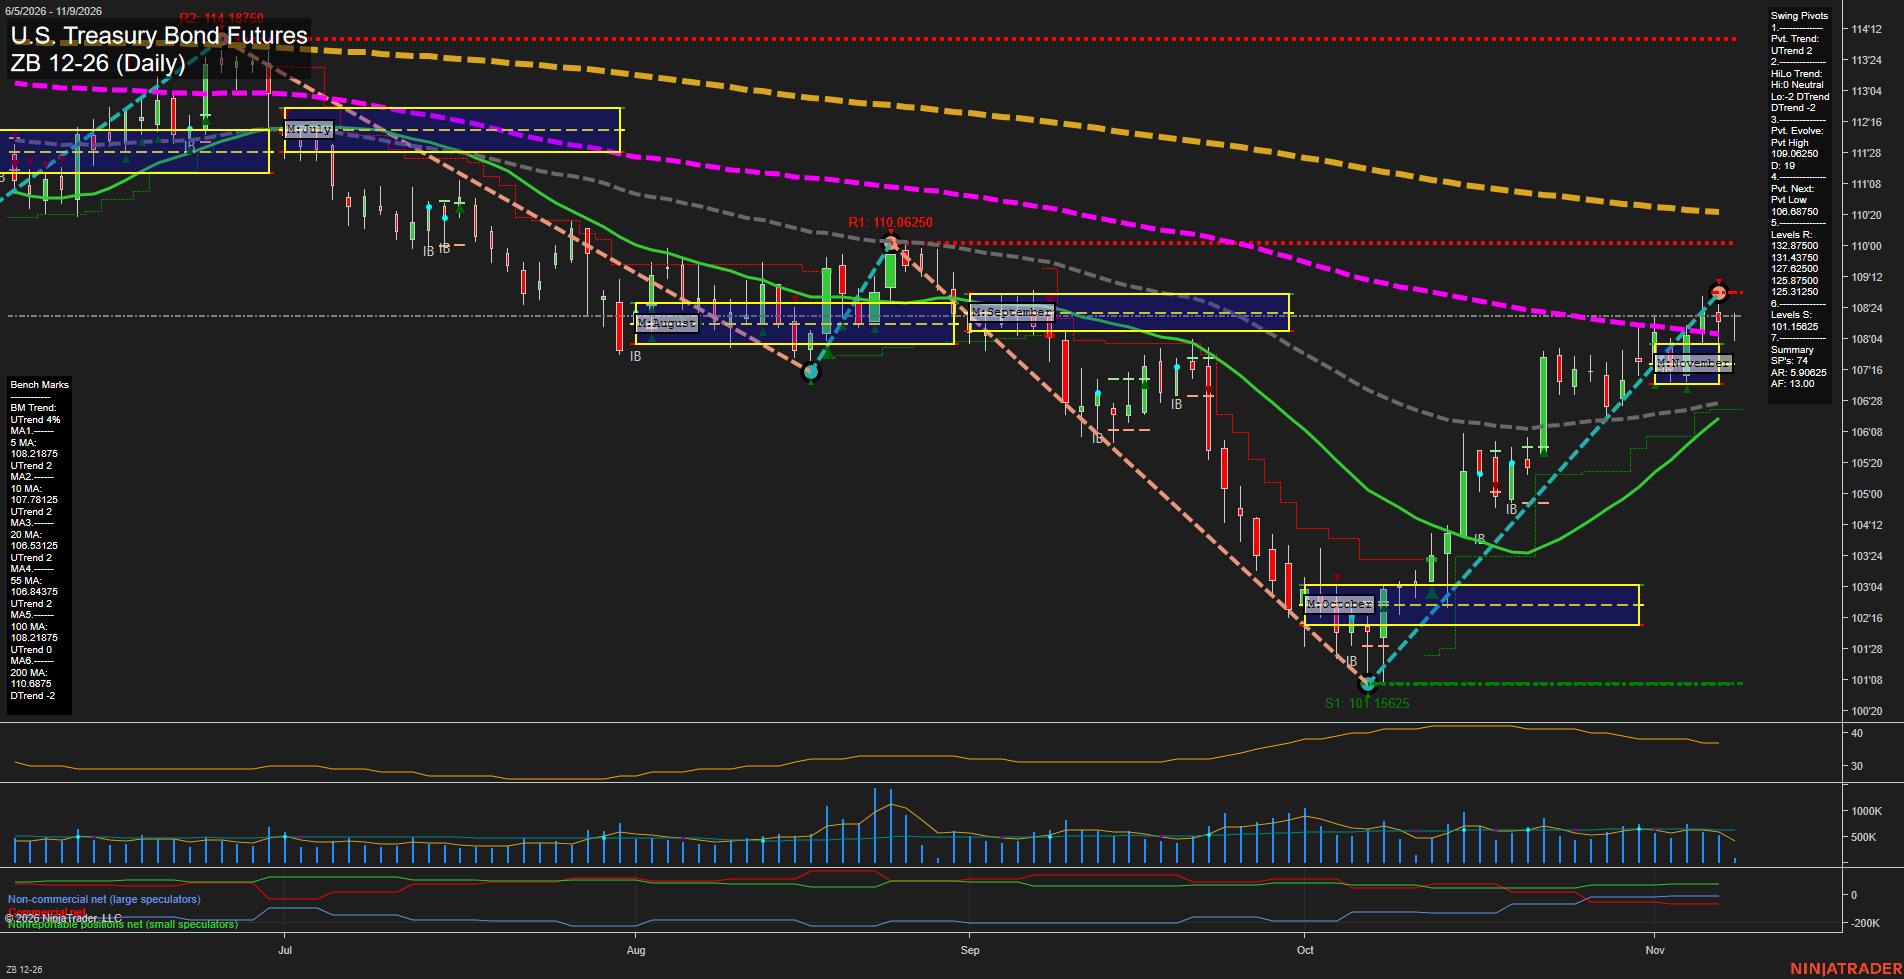
ZB Daily View
Overall Rating
- Short-Term: Bullish
- Intermediate-Term: Bullish
- Long-Term: Bearish.
Key Insights Summary
ZB has produced a sharp V-style recovery from the October 101'15 low, with higher lows and a fast short-term pivot advance carrying price above the weekly and November F0%/NTZ references. The 5-, 10-, and 20-day benchmarks are rising, while the current pivot structure remains in UTrend; however, price is pressing beneath the 55-day average near 108'27 and the developing pivot-high reference at 109'06. Intermediate momentum is constructive but remains counter to the broader HiLo DTrend and the declining 200-day benchmark. The advance is therefore a strong short-term rebound within a still-lower long-term price structure, with 106'21 as the indicated next pivot reversal level and 109'06 as the nearby swing ceiling.
View charts on: AlphaWebTrader HTF Charts
Sentiment Summary: Negative coverage led at 50% versus 16% positive, centered on Nvidia’s November 8 announcement of an independent investigation into reports CEO Jensen Huang was targeted by foreign intelligence; shares fell roughly 4–5% overnight and premarket on November 9. Last week’s post-midterm semiconductor selloff also reflected concerns over AI data-center oversight and spending, but U.S. stock futures rose Monday morning and Asian equities mostly rebounded, with solid Friday U.S. jobs data supporting Japan’s recovery.
Conclusion: Upcoming CPI, PPI and AI-related earnings add event risk to a market still heavily influenced by technology shares.