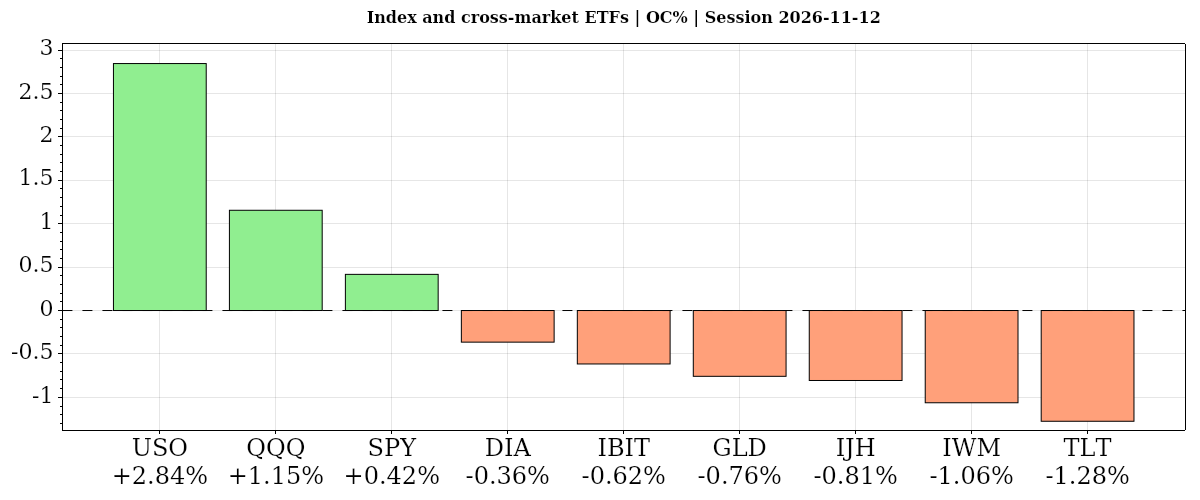
S&P 500 and Nasdaq-100 ETFs rose from Thursday’s open but closed below prior levels. Oil gained as gold and Treasury bonds fell; jobless claims hit 200,000.
Fundamentals: Stocks and tech closed higher Thursday despite sharp losses in Nvidia and Nebius amid leadership and China-related scrutiny. Oil rose, while gold and bonds declined. Initial jobless claims reached 200,000 versus 195,000 expected, and the $25 billion 30-year Treasury auction yielded 5.441%. Fed commentary remained in focus, with Williams scheduled to speak at 6:30 p.m. ET.
Technicals: The S&P 500 and Nasdaq-100 ETFs rose 0.42% and 1.15% from the open, respectively, but finished 0.35% and 0.32% below their prior closes. Nvidia rebounded 10.06% from its open yet closed down 4.34% versus the prior close. Small caps weakened, while stock-index futures showed near-term recoveries within unresolved corrections. The oil ETF gained 2.84% from the open; gold and far-term Treasury ETFs fell 0.76% and 1.28%.
After Market Close daily snapshot: market news summary and sentiment, major ETFs, Magnificent 7 analysis, Indices Futures Higher Time Frame Analysis, and E-mini S&P500, Nasdaq 100, NYMEX Crude, Gold Futures Daily Chart analysis.
As of: November 12, 2026 06:15 CT
EcoNews Radar U.S. Events Day Recap
| Date | Impact | Event, Prev, Forecast, Actual | Info |
|---|---|---|---|
| 2026-11-12 Thursday 08:30 | Medium | Initial Jobless Claims Prev: 189K Forecast: 195K Actual: 200K | Counts new applications for unemployment benefits, offering a timely gauge of layoffs that traders monitor for labor-market conditions and interest-rate expectations. |
| 2026-11-12 Thursday 09:00 | Medium | Fed's Hammack speech Prev: — Forecast: — Actual: — | Remarks can clarify views on inflation, employment and monetary policy, helping traders assess the interest-rate outlook relevant to equity valuations. |
| 2026-11-12 Thursday 10:00 | Medium | Fed's Barr speech Prev: — Forecast: — Actual: — | Remarks may address monetary policy or financial-system conditions, which traders monitor for implications for rates, credit availability and equity sentiment. |
| 2026-11-12 Thursday 10:00 | Medium | Existing Home Sales Change (MoM) Prev: 1.5 Forecast: — Actual: -5.5 | Measures the monthly percentage change in completed sales of previously owned homes, providing insight into housing demand and the economy’s sensitivity to borrowing costs. |
| 2026-11-12 Thursday 11:15 | Medium | Fed's Goolsbee speech Prev: — Forecast: — Actual: — | Commentary can reveal assessments of economic activity and inflation, helping traders evaluate the potential policy path and its implications for equity valuations. |
| 2026-11-12 Thursday 11:30 | Medium | 4-Week Bill Auction · $115B Prev: 3.89% Forecast: — Actual: 3.955% | Results show short-term government funding costs and investor demand for cash-like securities, offering context for money-market rates and liquidity conditions. |
| 2026-11-12 Thursday 11:30 | Medium | 8-Week Bill Auction · $110B Prev: — Forecast: — Actual: — | Results indicate investor demand and government borrowing costs at the short end of the yield curve, which traders monitor for funding conditions and rate expectations. |
| 2026-11-12 Thursday 12:00 | Low | EIA Crude Oil Stocks Change Prev: -0.86M Forecast: -1.10M Actual: 4.66M | Tracks weekly changes in commercial crude inventories, informing assessments of petroleum supply and demand that matter for energy shares and inflation expectations. |
| 2026-11-12 Thursday 13:00 | High | 30-Year Bond Auction · $25B Prev: 5.62% Forecast: — Actual: 5.441% | Results reveal demand for long-duration government debt and its financing cost, relevant to long-term yields and the discount rates used to value equities. |
| 2026-11-12 Thursday 13:00 | Medium | 17-Week Bill Auction · $75B Prev: — Forecast: — Actual: — | Results gauge demand for short-dated government debt and its financing cost, helping traders assess money-market conditions and the near-term rate environment. |
| 2026-11-12 Thursday 13:10 | Medium | Fed's Daly speech Prev: — Forecast: — Actual: — | Remarks provide insight into policymakers’ economic assessments and policy preferences, which traders monitor for potential shifts in interest-rate expectations. |
| 2026-11-12 Thursday 13:30 | Medium | Fed's Schmid speech Prev: — Forecast: — Actual: — | Commentary may illuminate views on inflation persistence and labor conditions, helping traders interpret the monetary-policy outlook affecting equity valuations. |
| 2026-11-12 Thursday 14:00 | Medium | Monthly Budget Statement Prev: -27.0B Forecast: -298.6B Actual: -404.1B | Reports federal receipts, spending and the resulting surplus or deficit, providing context for Treasury financing needs and the fiscal backdrop. |
| 2026-11-12 Thursday 18:30 | Medium | Fed's Williams speech Prev: — Forecast: — Actual: — | Remarks can offer insight into the economic outlook and policy direction, which traders monitor for implications for rates and equity discounting. |
Summary: The calendar centers on U.S. policy communication and government financing, alongside updates on economic conditions.
Conclusion: The sole high-impact entry is the long-term Treasury auction.
Market News Summary:
Nvidia’s leadership change and China-related scrutiny dominated the November 12 afternoon headlines, alongside AI-stock losses and mixed semiconductor commentary.
Primary Drivers & Risks:
- Primary Driver: Nvidia leadership exit and AI-stock selling
- Primary Risk: China-related investigations and technology-sector concentration
Tone:
Predominantly negative, with retail buying and semiconductor resilience providing counterpoints.
Data, Market and System
Geopolitical:
- Federal prosecutors were reportedly investigating whether Alice Huang participated in moving Super Micro Computer products into China.
- Nvidia retained outside investigators to examine allegations that Jensen Huang was targeted by a foreign intelligence effort.
- Alibaba and other Chinese stocks faced pressure as Nvidia-related revelations intensified scrutiny of Chinese companies’ access to U.S. technology.
- A U.S. Democratic senator requested an assessment of whether Nvidia is too big to fail.
Gold / Metals:
- Gold traded back below $4,000 an ounce after a reported 13% decline, while Société Générale estimated $3.3 billion in potential index-rebalancing purchases in early 2027.
- BlackRock commentary highlighted continuing demand support for gold and silver despite near-term price weakness.
Fed / Financials:
- Fed official Mary Daly said the central bank has time to calibrate rate hikes.
- The Federal Reserve announced a new meeting schedule for 2027, without policy details in the supplied excerpt.
Conclusion:
Nvidia’s leadership departure and sharp share decline were the central equity-market developments in the supplied coverage. Nebius’s losses extended the negative backdrop across AI infrastructure stocks.
China-related investigations and regulatory scrutiny added to technology-sector risks, while retail buying and reported semiconductor resilience tempered the selling narrative. Fed rate-hike commentary and precious-metals weakness provided secondary context.
Market News Sentiment
Sentiment Bias shows the balance of positive and negative news coverage sampled from 2026-11-11 16:01 to 2026-11-12 15:58 ET, covering stocks, energy and gold.
▼ Market news
- Bias
- ▼ -36.07%
- Articles
- 305
- Positive
- ▲ 17.38%
- Neutral
- — 29.18%
- Negative
- ▼ 53.44%
▼ GLD / Gold
- Bias
- ▼ -37.50%
- Articles
- 16
- Positive
- ▲ 18.75%
- Neutral
- — 25.00%
- Negative
- ▼ 56.25%
Sentiment Summary: Coverage was predominantly negative (56% versus 19% positive), linking gold’s decline to $3,864 on November 12 to dollar strength, rising Treasury yields and Fed tightening expectations following November 10’s hotter-than-expected CPI report. Gold miners also fell, while November 12’s above-forecast jobless claims and weaker October home sales failed to halt bullion’s losses. The main counterweight was reported underlying demand support, alongside Société Générale’s estimate of $3.3 billion in potential index-rebalancing buying in early 2027 rather than an immediate catalyst.
Conclusion: Rising yields and dollar strength dominated this cross-market backdrop, with the November 13 producer-price report still ahead.
▼ USO / Oil
- Bias
- ▼ -37.50%
- Articles
- 16
- Positive
- ▲ 25.00%
- Neutral
- — 12.50%
- Negative
- ▼ 62.50%
Sentiment Summary: Negative coverage led at 63% versus 25% positive, reflecting oil declines late November 11 and early November 12 on peace-talk hopes and rising supply, followed by the November 12 EIA release showing a 4.7-million-barrel crude build against an expected 700,000-barrel draw. The counterweight was Thursday’s oil rebound after Trump said no Iran deal was needed and reports of Houthi attacks on Saudi Aramco facilities renewed escalation concerns, alongside tight distillate supplies.
Conclusion: For index futures, reported inflation and Treasury-yield pressures remained relevant despite earlier oil weakness, with coverage noting that lower crude prices were no longer reducing borrowing costs.
Glossary: Sentiment Bias = (positive articles − negative articles) ÷ total articles × 100. It ranges from −100% negative to +100% positive. A reading near zero indicates little directional bias. Neutral articles reduce the score’s strength. ▲ positive; ▼ negative; — balanced. These readings describe news coverage, not market-price direction.
Market Technical Analysis
Analysis of VIX volatility, the completed session in major ETFs and mega-cap tech stocks, and futures snapshots and higher-time-frame analysis.
VIX — Market Fear Gauge Daily
| Level | Open | High | MaxVix | Low | MinVix | DNC% | DOC% | VR | MaxVR | MinVR |
|---|---|---|---|---|---|---|---|---|---|---|
| 18.70 | 18.87 | 18.99 | 28.36 | 17.38 | 16.21 | +6.92% | -0.90% | 19.54 | 56.57 | -6.27 |
VIX fell 0.90% from the session's opening level. VIX rose 6.92% versus the previous session close. Expected volatility eased from the period open. VIX is 20.5% up the recent 15-session range (16.21–28.36), in the 20–30% band.
VR: ATN Volatility Ratio (VR): 19.54 – Stocks fell while expected volatility rose. VR is around the middle of its preceding 15-session VR range (-6.27 to 56.57), in the 40–50% band. VR rose 11.86 points from the previous session, a moderate shift relative to that range.
Range lookback: preceding 15 completed sessions.
Major ETFs and Mega Cap Tech Stocks
- Nvidia fell 14% following Jensen Huang’s resignation before narrowing its losses, with retail buyers helping limit the decline.
- Truist and Craig-Hallum downgraded Nvidia to Hold, citing leadership, corporate culture and China-related concerns.
- Nebius dropped nearly 20% amid disappointing forward guidance and AI-sector turbulence, while its daily leveraged inverse ETF gained approximately 39%.
- One semiconductor commentary reported that Nvidia’s leadership change did not push the sector to new lows despite extreme bearish sentiment.
- Materials approached resistance amid improved participation, although the sector pulled back during the morning.
- Microsoft faced commentary about AI competition in office productivity software, alongside reported revenue growth of 17.91% year over year and elevated valuation.
- A Microsoft outage affected Outlook, Teams and Microsoft 365, while Google and Amazon Web Services users also reported service issues.
ETF, Mag7, and Cross-Market ETF Insights
Overall Tone
The November 12, 2026 daily session showed uneven risk appetite from the open, with selective gains contrasting with broader weakness versus the prior close.
| Instrument | Bias | Date | DNC% | DOC% | O | H | L | C | VWAP | Vol |
|---|---|---|---|---|---|---|---|---|---|---|
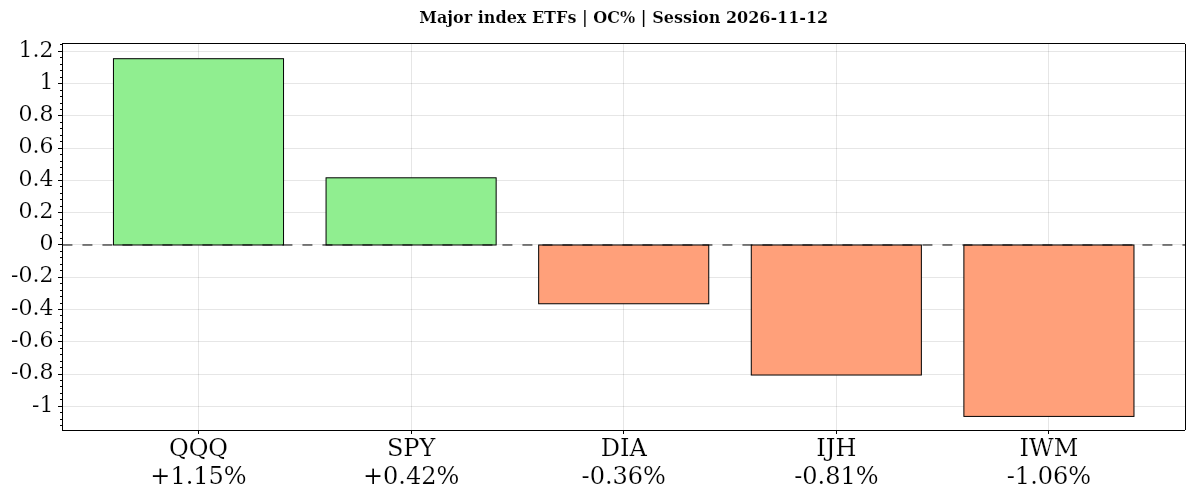
| ▲ QQQ | ▼ ▲ ▼ | 2026-11-12 | ▼ -0.32% | ▲ +1.15% | 680.32 | 694.56 | 679.83 | 688.17 | ▼ 688.22 | 36,151,395 |
| ▲ SPY | ▼ ▲ ▼ | 2026-11-12 | ▼ -0.35% | ▲ +0.42% | 753.98 | 763.04 | 753.67 | 757.12 | ▼ 758.40 | 36,920,936 |
| ▼ DIA | ▼ ▼ ▼ | 2026-11-12 | ▼ -0.38% | ▼ -0.36% | 524.38 | 527.05 | 522.23 | 522.47 | ▼ 524.58 | 1,684,600 |
| ▼ IJH | ▼ ▼ ▼ | 2026-11-12 | ▼ -1.18% | ▼ -0.81% | 74.45 | 74.66 | 73.77 | 73.85 | ▼ 74.17 | 8,669,525 |
| ▼ IWM | ▼ ▼ ▼ | 2026-11-12 | ▼ -1.64% | ▼ -1.06% | 281.43 | 282.20 | 278.04 | 278.44 | ▼ 279.85 | 22,469,842 |
| AVG/Sum | — | — | -0.77% | -0.13% | — | — | — | — | — | 105,896,298 |
Index ETFs
Negative confluence: average DNC% -0.77%, DOC% -0.13%. Two of five gained from the open: QQQ led, followed by SPY; IWM lagged, behind IJH and DIA. All five fell versus the prior close, with QQQ most resilient; its intermediate and longer-term averages remained falling.
QQQ · D:2026-11-12 NC% ▼ -0.32% OC% ▲ +1.15%
QQQ – Nasdaq 100 Technicals Summary
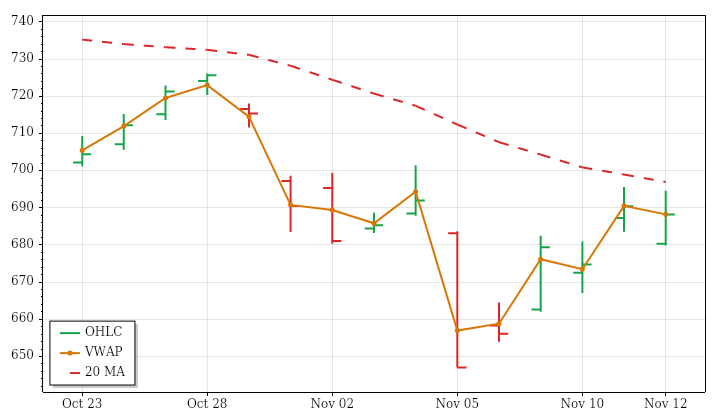
QQQ's completed daily session on November 12 closed at 688.17, down 0.32% from the prior close but up 1.15% from the open. The opening gap lower was filled, although the recovery did not preserve a positive close-to-close return. Price recorded lower daily extremes and finished inside the prior day's range. The close was effectively at VWAP, marginally below it, leaving little closing separation from the session's traded average.
Price was above a falling near-term average, creating a mixed short-term picture, while intermediate- and far-term averages remained falling above price. The daily rebound therefore conflicted with the broader downward structure. Range exceeded average, consistent with the prior 15 sessions' expansion, but volume was below average despite rising lookback participation. A fresh bullish PSAR state conflicted with bearish ATR-median conditions. A next-session low below 649.476 would trigger a bearish PSAR reversal.
SPY · D:2026-11-12 NC% ▼ -0.35% OC% ▲ +0.42%
SPY – S&P 500 Technicals Summary
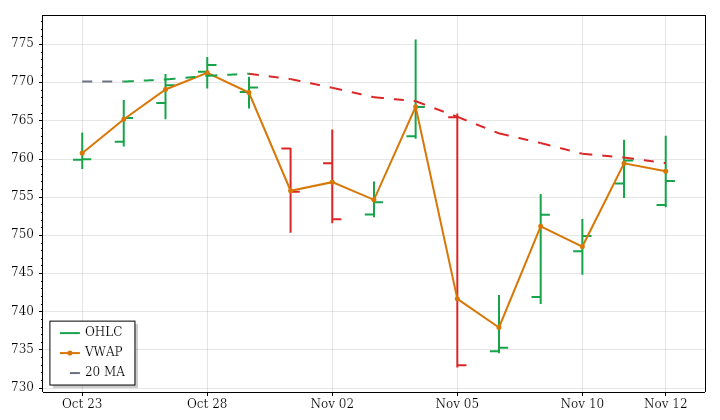
SPY's completed daily session on November 12 closed at 757.12, down 0.35% from the prior close despite gaining 0.42% from the open. Its opening gap lower was filled, but the recovery faded enough to leave the daily return negative. An outside bar showed movement beyond both prior-day extremes, while the close returned inside that earlier range and remained below VWAP, limiting the strength of the intraday recovery.
The near-term picture was mixed, with price above a falling average. Intermediate conditions remained bearish, whereas the far-term average continued rising beneath price. This left recent weakness in conflict with the longer-term uptrend. Daily range was approximately average and volume below average, unlike the expanding ranges and increasing volume across the prior 15 sessions. PSAR and ATR-median remained bearish; a next-session high above 765.9284 would trigger a bullish PSAR reversal.
DIA · D:2026-11-12 NC% ▼ -0.38% OC% ▼ -0.36%
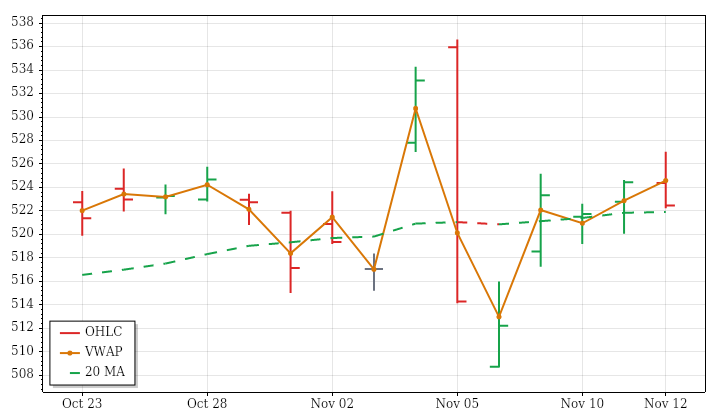
DIA – Dow Jones Technicals Summary
DIA's completed daily session on November 12 closed at 522.47, down 0.38% from the prior close and 0.36% from the open. Price traded on both sides of the open and established a higher high and higher low, but finished near the session low, below VWAP and inside the preceding day's range. The higher daily extremes therefore did not translate into a stronger closing position.
The near-term picture remained mixed: price was above its short-term average, but that average was falling. Intermediate- and far-term averages were still rising beneath price, creating a conflict between recent weakness and the longer-term structure. The 15-session price trend was slightly downward and highly uneven. Daily range was below average, while volume was only about 43% of average, despite both expanding over the lookback. A next-session high above 527.05 would trigger a bullish PSAR reversal.
IJH · D:2026-11-12 NC% ▼ -1.18% OC% ▼ -0.81%
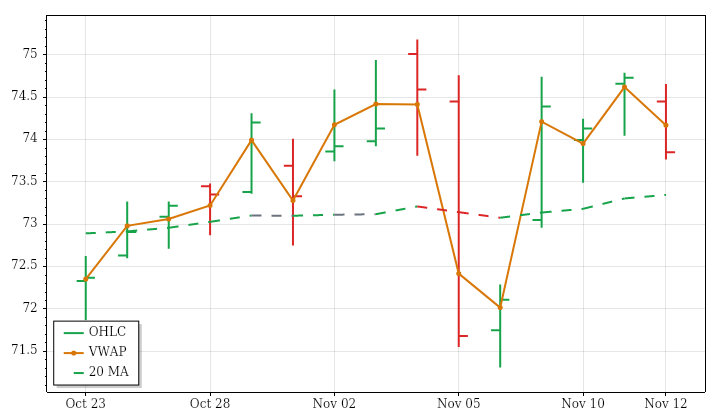
IJH – Mid Cap Technicals Summary
IJH's completed daily session on November 12 ended at 73.85, down 1.18% from the prior close and 0.81% from the open. Its opening gap lower remained unfilled, and the session produced a lower high and lower low. The finish beneath the preceding day's low, near the session low and below VWAP made the daily action weaker than the still-positive near-term moving-average structure suggested.
Price remained only slightly above its rising near-term average. Intermediate conditions were mixed because price was above a falling average, while the far-term position was also mixed, sitting below a marginally rising average. The prior 15 sessions showed an uneven upward price trend alongside expanding ranges and increasing volume. This session's range was below average and volume slightly above average. Fresh bullish PSAR and ATR-median states conflicted with the decline; a next-session low below 71.484 would reverse PSAR bearishly.
IWM · D:2026-11-12 NC% ▼ -1.64% OC% ▼ -1.06%
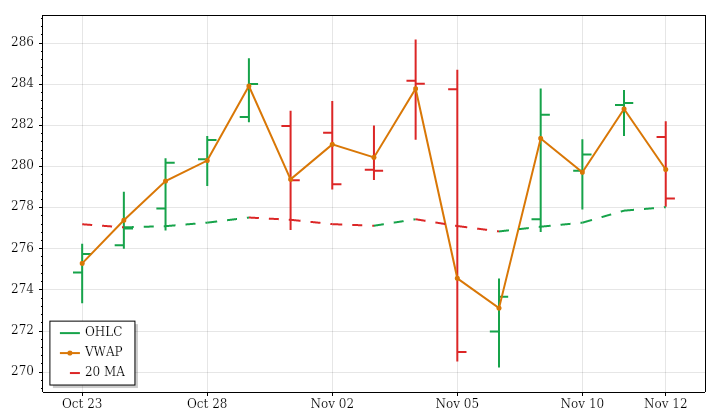
IWM – Small Cap Technicals Summary
IWM's completed daily session on November 12 closed at 278.44, down 1.64% from the prior close and 1.06% from the open. An opening gap lower remained unfilled. Lower daily extremes and a finish below the prior day's low showed continued weakness, while the close near the session low and below VWAP confirmed a soft intraday outcome rather than a recovery from the opening decline.
The near-term structure was mixed because price lay below an average that was still rising. Intermediate- and far-term averages were falling above price, aligning those horizons with the latest decline despite a slightly positive 15-session price trend. Range and volume were modestly below average, contrasting with their increasing lookback trends. PSAR remained bearish while ATR-median had turned bullish, leaving indicator disagreement. A next-session high above 283.72 would trigger a bullish PSAR reversal, not confirm one in advance.
| Instrument | Bias | Date | DNC% | DOC% | O | H | L | C | VWAP | Vol |
|---|---|---|---|---|---|---|---|---|---|---|
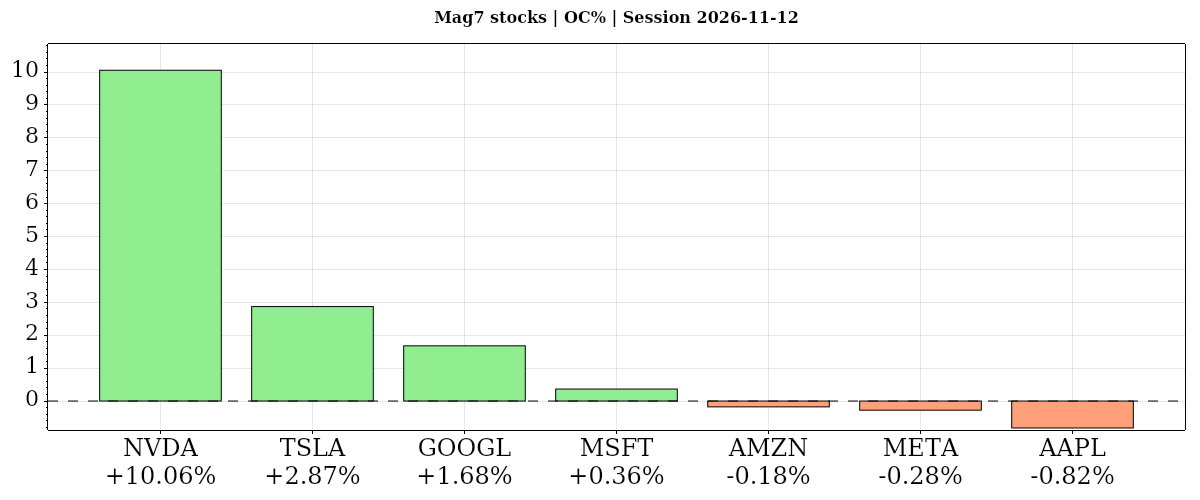
| ▲ NVDA | ▼ ▲ ▲ | 2026-11-12 | ▼ -4.34% | ▲ +10.06% | 151.00 | 167.14 | 148.80 | 166.19 | ▲ 162.11 | 737,439,600 |
| ▲ TSLA | ▲ ▲ ▲ | 2026-11-12 | ▲ +1.69% | ▲ +2.87% | 386.36 | 401.22 | 385.20 | 397.45 | ▲ 394.43 | 28,789,343 |
| ▲ GOOGL | ▲ ▲ ▲ | 2026-11-12 | ▲ +1.79% | ▲ +1.68% | 293.77 | 302.56 | 293.69 | 298.70 | ▲ 298.61 | 35,309,726 |
| ▲ MSFT | ▲ ▲ ▼ | 2026-11-12 | ▲ +0.36% | ▲ +0.36% | 521.10 | 529.66 | 520.00 | 523.00 | ▼ 524.40 | 17,942,629 |
| ▼ AMZN | ▲ ▼ ▼ | 2026-11-12 | ▲ +0.48% | ▼ -0.18% | 267.92 | 273.60 | 267.20 | 267.44 | ▼ 269.39 | 33,792,591 |
| ▼ META | ▼ ▼ ▼ | 2026-11-12 | ▼ -0.82% | ▼ -0.28% | 625.35 | 630.32 | 618.92 | 623.61 | ▼ 623.84 | 10,230,543 |
| ▼ AAPL | ▼ ▼ ▼ | 2026-11-12 | ▼ -0.21% | ▼ -0.82% | 357.81 | 359.37 | 354.41 | 354.88 | ▼ 356.44 | 30,716,075 |
| AVG/Sum | — | — | -0.15% | +1.96% | — | — | — | — | — | 894,220,507 |
Mag7 Stocks
Mixed: average DNC% -0.15%, DOC% +1.96%. Four of seven gained from the open, led by NVDA’s 10.06%, while AAPL lagged; versus the prior close, GOOGL led and NVDA fell 4.34%. NVDA closed above VWAP despite aligned moving-average downtrends; AMZN and MSFT gained versus the prior close but finished below VWAP.
NVDA · D:2026-11-12 NC% ▼ -4.34% OC% ▲ +10.06%
NVDA – Nvidia Technicals Summary
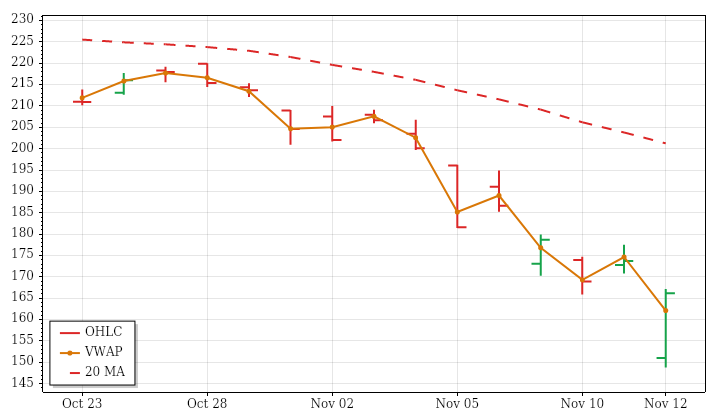
NVDA's completed daily session on November 12 closed at 166.19, down 4.34% from the prior close despite rallying 10.06% from the open. A deep opening gap lower remained unfilled, explaining the contrast between the daily loss and strong intraday rebound. Price finished near the session high and above VWAP, yet remained below the preceding day's low after recording lower daily extremes.
Near-, intermediate- and far-term averages were all falling above price, so the rebound occurred within an aligned bearish structure rather than establishing a reversal. The 15-session price trend was also decisively downward. Intraday range reached about 2.6 times average and volume nearly four times average, amplifying the lookback's expanding ranges and rising participation. PSAR and ATR-median remained bearish despite the recovery from the open. A next-session high above 181.4839 would trigger a bullish PSAR reversal.
Nvidia News and Fundamentals
Jensen Huang resigned as Nvidia CEO on November 12 following reports of an affair with a suspected Chinese spy and a separate affair with a subordinate. Nvidia retained Joon Kim and Wachtell, Lipton, Rosen & Katz to investigate allegations that Huang was targeted by a foreign intelligence effort. Nvidia shares initially plunged 14% before narrowing their losses.
TSLA · D:2026-11-12 NC% ▲ +1.69% OC% ▲ +2.87%
TSLA – Tesla Technicals Summary
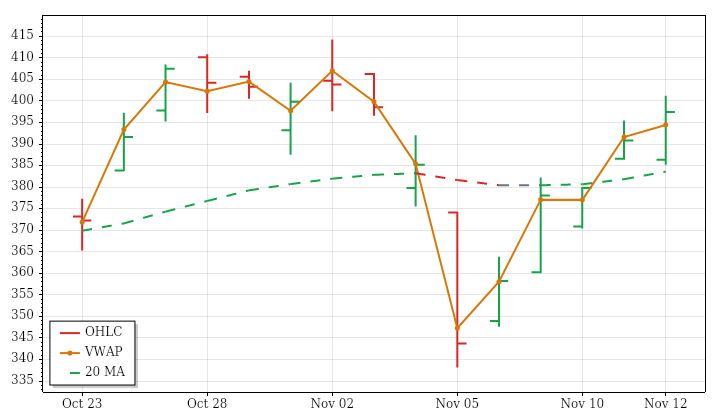
TSLA's completed daily session on November 12 closed at 397.45, up 1.69% from the prior close and 2.87% from the open. The stronger open-to-close gain followed an opening gap lower that was subsequently filled. Price formed an outside bar and finished above the preceding day's high and above VWAP, giving the daily advance a stronger closing structure than a simple recovery to the prior close.
Near- and intermediate-term averages were rising beneath price, although the near-term average was almost flat. Far-term conditions remained mixed because price stood above a falling average. The prior 15-session price trend was downward with very little directional efficiency, illustrating the uneven backdrop. Daily range was above average and volume below average, consistent with expanding ranges and declining participation. Fresh bullish PSAR conflicted with bearish ATR-median; a next-session low below 341.3035 would trigger a bearish PSAR reversal.
Tesla News and Fundamentals
Tesla is expected to end Cybertruck production in fall 2027, eventually repurposing space at Gigafactory Texas for its driverless Cybercab. Tesla also reportedly surpassed Waymo in the number of registered autonomous vehicles in Texas. In Europe, Finland became the 11th EU country to grant provisional approval for Tesla’s Full Self-Driving system, ahead of an EU-wide vote expected in December 2026.
GOOGL · D:2026-11-12 NC% ▲ +1.79% OC% ▲ +1.68%
GOOGL – Alphabet Technicals Summary
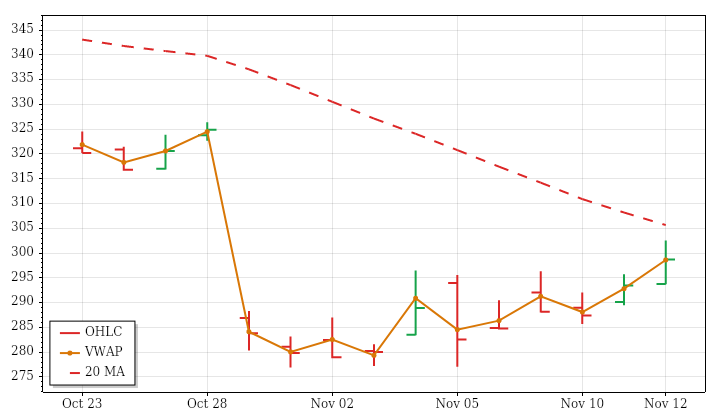
GOOGL's completed daily session on November 12 closed at 298.70, up 1.79% from the prior close and 1.68% from the open. A higher high and higher low accompanied a finish above the preceding day's high. The close was just above VWAP, showing a positive session outcome without a large separation from the traded average. Range exceeded its recent average, while volume remained below average.
The advance challenged, but did not resolve, the broader downward structure. Price stood above a still-falling near-term average, leaving that horizon mixed, while intermediate- and far-term averages continued falling above price. The prior 15 sessions also retained a downward price trend, expanding ranges and decreasing volume. PSAR was bullish, whereas ATR-median remained bearish, underscoring the conflicting signals. A next-session low below 279.9999 would trigger a bearish PSAR reversal; the daily gain alone did not establish a broader trend change.
MSFT · D:2026-11-12 NC% ▲ +0.36% OC% ▲ +0.36%
MSFT – Microsoft Technicals Summary
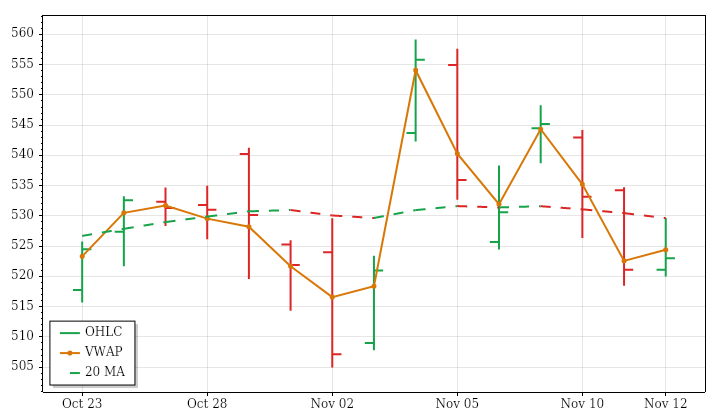
MSFT's completed daily session on November 12 closed at 523, gaining 0.36% both from the prior close and from the open. Price traded on either side of the open but remained within the preceding day's range, producing an inside bar. The positive close did not reclaim session VWAP, so the advance coexisted with a closing position below the day's traded average rather than broad technical alignment.
Near- and intermediate-term conditions remained mixed: their averages were rising, but price was below both. The far-term uptrend stayed intact, with price well above its rising longer-term average. The preceding 15-session advance had low directional efficiency, reflecting substantial back-and-forth movement. Daily range and volume were below average despite expanding ranges and increasing volume over that window. PSAR and ATR-median remained bullish; a next-session low below 518.45 would trigger a bearish PSAR reversal.
Microsoft News and Fundamentals
Microsoft experienced an outage on November 12 affecting Outlook, Teams and Microsoft 365 users. Microsoft confirmed that the Outlook disruption prevented users from accessing their inboxes.
AMZN · D:2026-11-12 NC% ▲ +0.48% OC% ▼ -0.18%
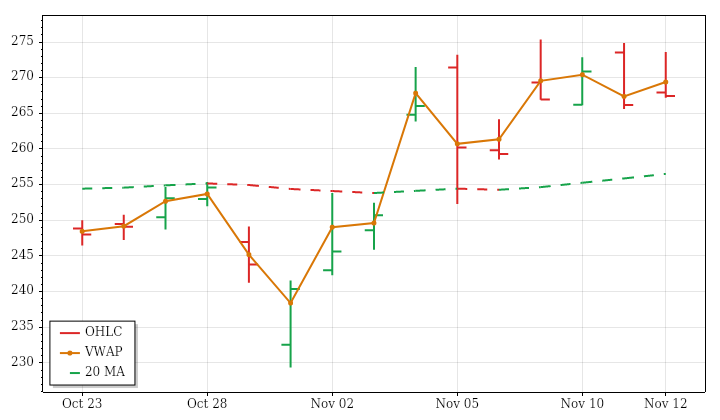
AMZN – Amazon Technicals Summary
AMZN's completed daily session on November 12 ended at 267.44, gaining 0.48% from the prior close despite slipping 0.18% from the open. The opening gap higher remained unfilled, preserving the daily gain, but the stock finished near the session low and below VWAP. An inside bar and a close within the prior day's range showed containment rather than a fresh directional expansion.
Near-, intermediate- and far-term moving-average trends remained aligned upward, although the intermediate average was rising only marginally. This constructive structure contrasted with the day's softer intraday finish. Range and volume were below their prior 15-session averages, opposing the lookback's expanding-range and increasing-volume trends. Very low directional efficiency also showed that the broader advance was uneven. PSAR remained bullish, with a next-session low below 260.9051 required to trigger a bearish reversal.
Amazon News and Fundamentals
Amazon’s proposed data center campus in Walla Walla County, Washington, drew protests from residents concerned about water supplies, agriculture and transparency. Separately, on November 12, Amazon provided a one-year update on Future Ready 2030, its $2.5 billion education and skills-training commitment. It said $1 billion had been committed to Career Choice, alongside new credential programs and expanded AWS Skill Builder and Machine Learning University tools.
META · D:2026-11-12 NC% ▼ -0.82% OC% ▼ -0.28%
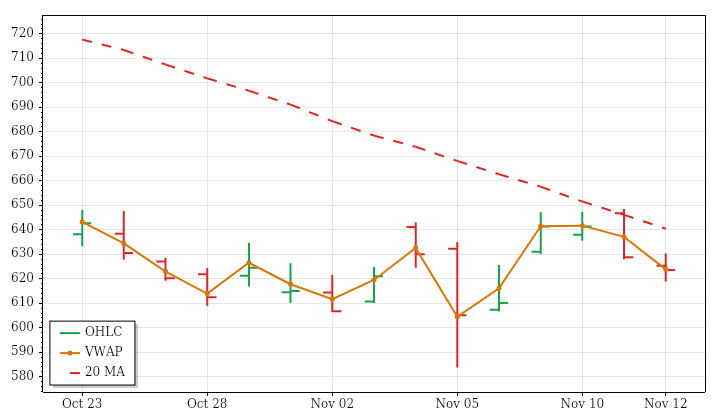
META – Meta Platforms Technicals Summary
META's completed daily session on November 12 closed at 623.61, down 0.82% from the prior close and 0.28% from the open. The opening gap lower was filled, but that recovery did not hold through the close. Price recorded a lower high and lower low, breached the preceding outside bar's low and finished beneath the prior day's low. The close was only slightly below VWAP, indicating little separation from the session's traded average.
Near- and intermediate-term averages were falling above price, matching the declining 15-session price trend. The far-term structure remained mixed, with price below a still-rising average. Range was subdued and volume roughly 40% of average, consistent with contracting ranges and decreasing volume across the lookback. Bullish PSAR and a fresh bullish ATR-median state conflicted with that weaker structure. A next-session low below 601.4206 would trigger a bearish PSAR reversal.
Meta News and Fundamentals
A UK regulator fined Meta over repeated inaccuracies in WhatsApp Business data.
AAPL · D:2026-11-12 NC% ▼ -0.21% OC% ▼ -0.82%
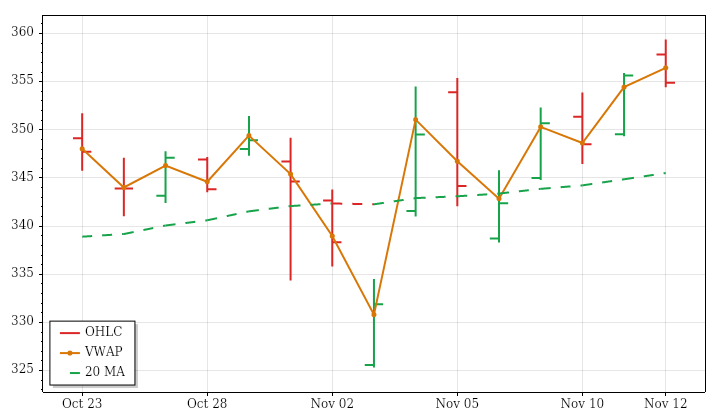
AAPL – Apple Technicals Summary
AAPL's completed daily session on November 12 closed at 354.88, down 0.21% from the prior close and 0.82% from the open. An opening gap higher was filled, and the stock finished near the session low and below VWAP. Although it recorded a higher high and higher low, the close remained inside the prior day's range, making the session a retreat rather than a sustained upside extension.
That weakness contrasted with aligned near-, intermediate- and far-term uptrends, with price still above rising averages across all three horizons. The preceding 15-session advance had limited directional efficiency, indicating considerable back-and-forth movement. Daily range and volume were both below average, despite expanding ranges and increasing volume over that lookback. PSAR remained bullish; a next-session low below 340.1028 would trigger a bearish reversal, rather than one already being confirmed.
Apple News and Fundamentals
Apple reported fiscal 2026 revenue of $478.8 billion, up 15% from the prior year and compared with $108 billion in fiscal 2011. New CEO John Ternus is pursuing further growth with an R&D budget that has reached $45.8 billion.
| Instrument | Bias | Date | DNC% | DOC% | O | H | L | C | VWAP | Vol |
|---|---|---|---|---|---|---|---|---|---|---|
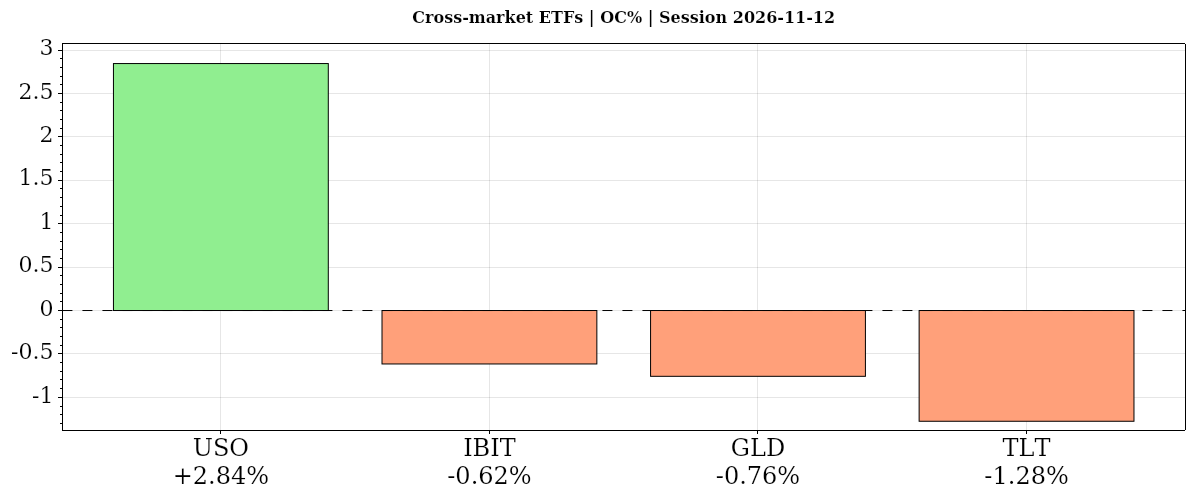
| ▲ USO | ▲ ▲ ▲ | 2026-11-12 | ▲ +3.25% | ▲ +2.84% | 142.03 | 146.45 | 141.49 | 146.07 | ▲ 144.58 | 5,564,591 |
| ▼ IBIT | ▼ ▼ ▼ | 2026-11-12 | ▼ -4.45% | ▼ -0.62% | 40.61 | 40.84 | 40.23 | 40.36 | ▼ 40.48 | 55,693,543 |
| ▼ GLD | ▼ ▼ ▼ | 2026-11-12 | ▼ -2.82% | ▼ -0.76% | 357.60 | 357.76 | 352.91 | 354.89 | ▼ 354.89 | 13,148,545 |
| ▼ TLT | ▼ ▼ ▼ | 2026-11-12 | ▼ -1.48% | ▼ -1.28% | 80.75 | 80.81 | 79.72 | 79.72 | ▼ 79.98 | 46,006,419 |
| AVG/Sum | — | — | -1.37% | +0.05% | — | — | — | — | — | 120,413,098 |
Cross-Market ETFs
Mixed: average DNC% -1.38%, DOC% +0.05%. Only oil gained from the open, while bonds lagged; oil also rose versus the prior close, diverging from equities, while bitcoin fell most. Gold and bitcoin declines were largely opening gaps; gold’s moving-average downtrends remained aligned, while bonds declined on above-average range and volume.
USO · D:2026-11-12 NC% ▲ +3.25% OC% ▲ +2.84%
USO – Oil Technicals Summary
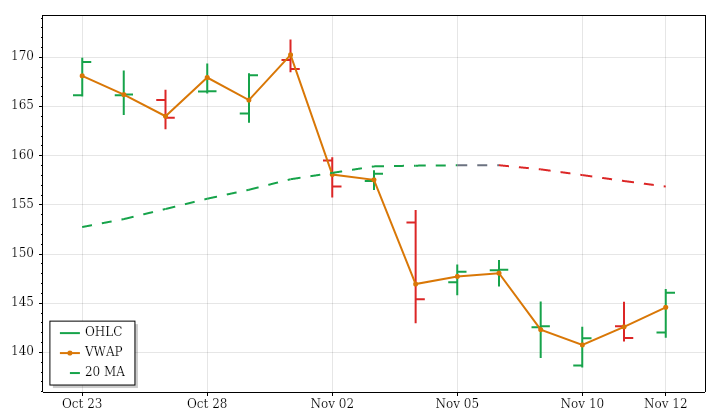
USO's completed daily session on November 12 closed at 146.07, advancing 3.25% from the prior close and 2.84% from the open. The opening gap higher remained unfilled. A higher high and higher low accompanied a close above the preceding day's high, near the session high and above VWAP. Those features showed a strong daily advance, with range above average and volume only slightly above average.
The rebound nevertheless left price below its falling near-term average. Intermediate conditions were mixed because price remained below a rising average, while the far-term uptrend stayed intact beneath price. The session therefore challenged shorter-term weakness without resolving the conflict across horizons. Over the prior 15 sessions, price had trended downward as ranges expanded and volume eased. PSAR and ATR-median remained bearish; a next-session high above 151.2913 would trigger a bullish PSAR reversal.
Oil News and Fundamentals
U.S. commercial crude inventories unexpectedly rose by 4.7 million barrels to 414.4 million barrels, the EIA reported on November 12, versus expectations for a 700,000-barrel decline. Oil futures jumped after President Donald Trump said the U.S. did not need a deal with Iran. Separate reporting identified tight U.S. distillate supplies and Middle East shipping risks as supportive factors for oil, despite strong crude production.
IBIT · D:2026-11-12 NC% ▼ -4.45% OC% ▼ -0.62%
IBIT – Bitcoin Technicals Summary
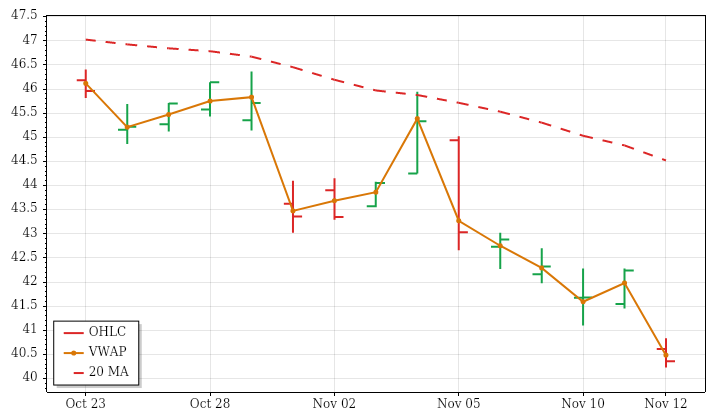
IBIT's completed daily session on November 12 closed at 40.36, losing 4.45% from the prior close but only 0.62% from the open. The distinction reflects a substantial opening gap lower that remained unfilled. Price made a lower high and lower low, breached the preceding inside bar's low and finished below the prior day's low. A close near the session low and below VWAP reinforced the weak daily finish.
Near- and intermediate-term averages were falling above price, consistent with the declining 15-session price trend. The far-term picture was mixed because price had fallen below an average that was still rising. Despite the large close-to-close loss, the intraday range was below average; volume was about 30% above average. Lookback ranges and volume were both increasing. Bearish trend signals remained in place; a next-session high above 42.7743 would trigger a bullish PSAR reversal.
GLD · D:2026-11-12 NC% ▼ -2.82% OC% ▼ -0.76%
GLD – Gold Technicals Summary
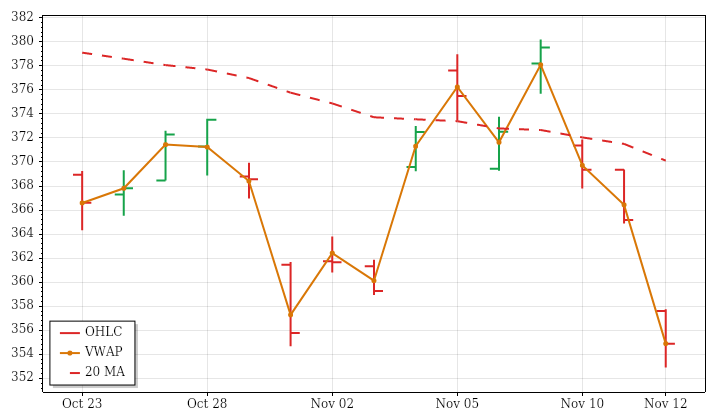
GLD's completed daily session on November 12 fell 2.82% from the prior close to 354.89, with a smaller 0.76% decline from the open. Most of the loss came through an opening gap lower that remained unfilled. A lower high, lower low and close beneath the prior day's low reinforced the weak structure. The finish was effectively at VWAP, only fractionally below it, rather than materially detached from the session's traded average.
Near-, intermediate- and far-term averages were all falling above price, aligning the session's decline with the broader bearish structure despite a slightly positive 15-session price trend. Range was above average and volume about 39% above average, reversing the lookback's contraction and declining participation. Price finished close to its 52-week low. The ATR-median turned bearish; a next-session high above 380.18 would be needed for a bullish PSAR reversal.
Gold News and Fundamentals
Gold fell below $4,000 an ounce on November 12, with spot prices reaching $3,864 after October existing-home sales dropped 5.5% to an annualized 3.75 million. Reports linked pressure on gold to hotter-than-expected inflation and rising yields, with the 10-year Treasury yield near 5%. Weekly jobless claims rose to 200,000, above forecasts. Société Générale estimated that index rebalancing could generate $3.3 billion in gold buying in the new year.
TLT · D:2026-11-12 NC% ▼ -1.48% OC% ▼ -1.28%
TLT – Long-Term Treasury Bonds Technicals Summary
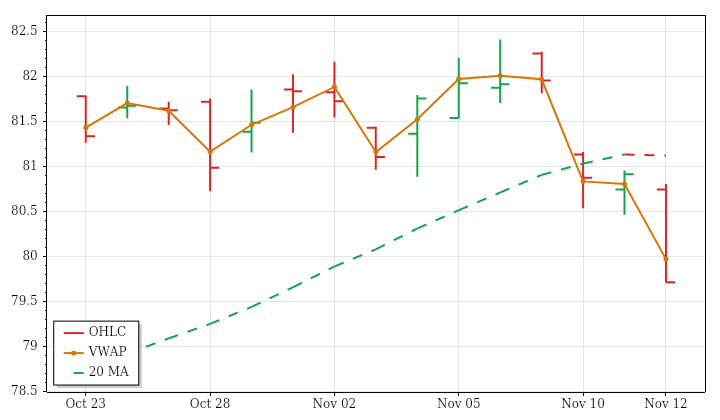
TLT's completed daily session on November 12 closed at 79.72, falling 1.48% from the prior close and 1.28% from the open. The opening gap lower remained unfilled, followed by lower daily extremes and a close beneath the preceding day's low. Finishing near the session low and below VWAP reinforced the negative daily structure. Range was about 1.7 times average, accompanied by above-average volume.
That expansion contrasted with contracting ranges and decreasing volume over the preceding 15 sessions, whose price trend was only slightly downward and uneven. Near- and intermediate-term conditions were mixed because price lay below averages that were still rising. The far-term average was falling above price, aligning the longer horizon with the latest weakness. ATR-median crossed bearishly and PSAR remained bearish. A next-session high above 82.058 would trigger a bullish PSAR reversal rather than represent an existing recovery signal.
Glossary: Instrument — ticker symbol; hover for the instrument or company name; Date — session date. DNC% — prior-session close to this session’s close; DOC% — daily session open-to-close percentage change. O — open; H — high; L — low; C — close, all for the table’s daily or weekly session; VWAP — volume-weighted average price; its arrow shows whether the close is above or below VWAP. Vol — period trading volume.
Bias — three directional readings, in order: DNC%, DOC%, then VWAP. ▲ positive/above; ▼ negative/below; — neutral or unavailable. Matching arrows show alignment; opposing arrows show mixed conditions. AVG/Sum — simple average of percentage changes and sum of reported volumes.
Futures Session Fib Grid Analysis – Snapshot
Session Fib Grids normalise market positioning as percentages, making direction and alignment comparable across different asset types.
Latest available snapshot for each instrument; Time(CT) shows the individual update date and time.
| Instrument | Bias | Time(CT) | YSFG | MSFG | WSFG | RSFG | SFG | TSI |
|---|---|---|---|---|---|---|---|---|
| ▲ ES | ▲ ▲ ▲ ▲ ▲ ▲ | 2026-11-12 18:17:20 | ▲ +48 | ▲ +7 | ▲ +105 | ▲ +44 | ▲ +8 | ▲ +109 |
| ▲ NQ | ▲ ▼ ▲ ▲ ▲ ▲ | 2026-11-12 18:17:14 | ▲ +44 | ▼ -1 | ▲ +93 | ▲ +60 | ▲ +8 | ▲ +128 |
| ▼ YM | ▲ ▲ ▲ ▼ ▲ ▲ | 2026-11-12 18:17:16 | ▲ +35 | ▲ +24 | ▲ +67 | ▼ -3 | ▲ +9 | ▲ +66 |
| ▼ EMD | ▲ ▲ ▲ ▼ ▲ ▲ | 2026-11-12 18:15:32 | ▲ +39 | ▲ +21 | ▲ +77 | ▼ -25 | ▲ +7 | ▲ +49 |
| ▼ RTY | ▲ ▼ ▲ ▼ ▲ ▼ | 2026-11-12 18:17:12 | ▲ +36 | ▼ -10 | ▲ +56 | ▼ -35 | ▲ +6 | ▼ -12 |
| ▼ FDAX | ▲ ▲ ▲ ▼ ▼ ▲ | 2026-11-12 18:17:03 | ▲ +51 | ▲ +74 | ▲ +124 | ▼ -35 | ▼ -6 | ▲ +47 |
| ▲ NKD | ▲ ▼ ▲ ▲ ▲ ▲ | 2026-11-12 18:17:17 | ▲ +133 | ▼ -11 | ▲ +74 | ▲ +12 | ▲ +12 | ▲ +194 |
| Instrument | Bias | Time(CT) | YSFG | MSFG | WSFG | RSFG | SFG | TSI |
|---|---|---|---|---|---|---|---|---|
| ▼ BTC | ▼ ▼ ▼ ▼ ▼ ▼ | 2026-11-12 18:17:13 | ▼ -70 | ▼ -46 | ▼ -86 | ▼ -52 | ▼ -4 | ▼ -98 |
| ▼ GC | ▼ ― ▼ ▼ ▲ ▲ | 2026-11-12 18:17:18 | ▼ -168 | — 0 | ▼ -88 | ▼ -44 | ▲ +9 | ▲ +25 |
| ▲ CL | ▲ ▼ ▼ ▲ ▼ ▲ | 2026-11-12 18:17:19 | ▲ +152 | ▼ -79 | ▼ -23 | ▲ +47 | ▼ -3 | ▲ +32 |
| ▼ 6E | ▼ ▼ ▼ ▼ ▼ ▼ | 2026-11-12 18:17:16 | ▼ -69 | ▼ -45 | ▼ -80 | ▼ -54 | ▼ -5 | ▼ -105 |
| ▼ ZB | ▼ ▼ ▼ ▼ ▼ ▼ | 2026-11-12 18:16:21 | ▼ -41 | ▼ -40 | ▼ -107 | ▼ -83 | ▼ -8 | ▼ -77 |
Glossary: YSFG — yearly; MSFG — monthly; WSFG — weekly; RSFG — regular trading hours (RTH); SFG — the current session, including pre-market or other sessions. TSI indicates trend strength and power.
Bias shows trend alignment across these six readings. The arrows follow the column order: YSFG, MSFG, WSFG, RSFG, SFG and TSI. Matching arrows show alignment; opposing arrows show mixed conditions.
Futures Higher Time Frame Analysis
Summary of the current state of US Indices Futures based on higher time-frame (HTF) technical analysis as of: 2026-11-12 16:00 -05:00 CT.
US Indices Futures
- ES YSFG up, MSFG down, WSFG up, benchmarks mixed, daily pivots recovering; support 7322.25, resistance 7666.50–7698.75, weekly reversal threshold 7683.25.
- NQ YSFG up, MSFG down, WSFG up, intermediate benchmarks declining, daily pivots recovering; support 26366.50, resistance 28566.5–28697.00, weekly reversal threshold 28789.00.
- YM grids bullish, benchmarks mixed, daily HiLo down versus weekly higher highs/lows; support 50859–50891, resistance 52850–52889, weekly reversal threshold 53377.
- EMD grids bullish, daily fast benchmarks rising, weekly fast benchmarks declining, weekly pivot down; support 3560.7, resistance 3750.3–3771.4, weekly reversal threshold 3773.1.
- RTY YSFG/WSFG up, latest MSFG short signal, benchmarks mixed, weekly pivot down; support 2714.2, resistance 2850.5–2862.2, daily reversal threshold 2754.6.
- FDAX grids bullish, all benchmarks rising, pivots upward; evolving high/resistance 27084, daily support 25695, weekly support 24925, reversal thresholds 26140 daily/25512 weekly.
Overall State
- Short-Term: Bullish
- Intermediate-Term: Neutral
- Long-Term: Bullish
Conclusion
Daily recoveries and upward WSFG readings provide short-term directional alignment, although EMD and RTY retain bearish weekly short-term ratings and recent TR120 short signals. Intermediate structure remains divided: ES, NQ and RTY lag through monthly weakness or declining benchmarks, while YM and FDAX retain bullish ratings across both timeframes. FDAX leads in benchmark and pivot alignment; EMD retains conflicting daily and weekly structures. Broadly upward YSFG readings and rising weekly long-term benchmarks underpin the long-term assessment, despite mixed daily evidence. Nearby resistance clusters and unresolved weekly pivot reversals distinguish the broader recovery from confirmed trend alignment.
Note: Intra-day counter-trend pullbacks or retracements may occur, HTF is context for informational usage and market structure. Glossary: Session Fib Grids periods of YSFG:’Yearly’, MSFG:’Monthly’, WSFG:’Weekly’
For full details visit: AlphaWebTrader Technicals
SPY Daily View
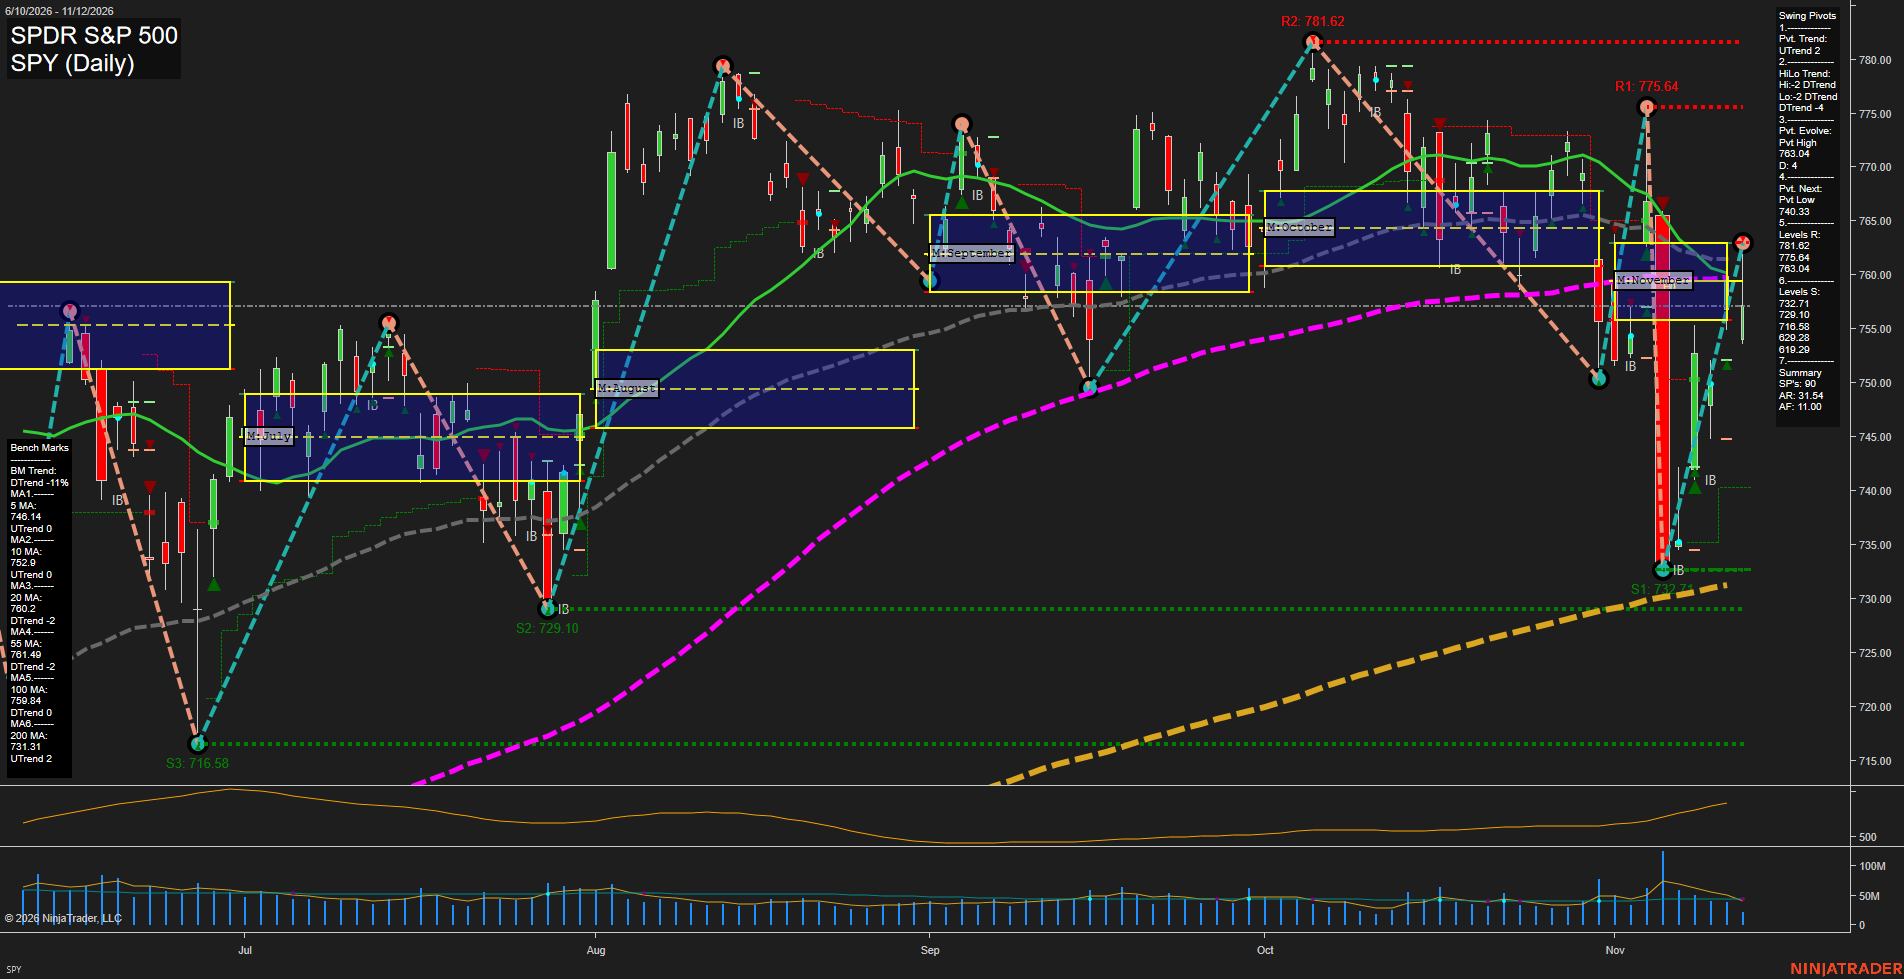
Overall Rating
- Short-Term: Bullish
- Intermediate-Term: Bearish
- Long-Term: Neutral.
Key Insights Summary
From a futures swing trader’s perspective, SPY shows a short-term recovery within an intermediate-term downswing, rather than a confirmed broad trend reversal. The sharp decline from 775.64 to 732.71 tested the rising 200-day benchmark region, followed by a fast rebound to an evolving pivot high of 763.04. Rising 5- and 10-day benchmarks support the recovery, but the latest candle sits beneath the clustered 100-, 20- and 55-day benchmarks near 759.84–761.49, indicating renewed overhead resistance. Lower pivot highs and lows keep the intermediate structure bearish; 763.04, 775.64 and 781.62 define successive resistance levels, while 732.71 and 729.10 mark nearby structural support. The selloff produced a pronounced volume spike, with lighter participation during the subsequent rebound. Weekly and yearly grids and named trade-signal readings are not visible, so their neutral entries represent unavailable confirmation rather than observed neutral signals. News and seasonal effects cannot be established from this chart. These are SPY reference levels, not directly transferable futures contract prices.
View charts on: AlphaWebTrader HTF Charts
ES Daily View
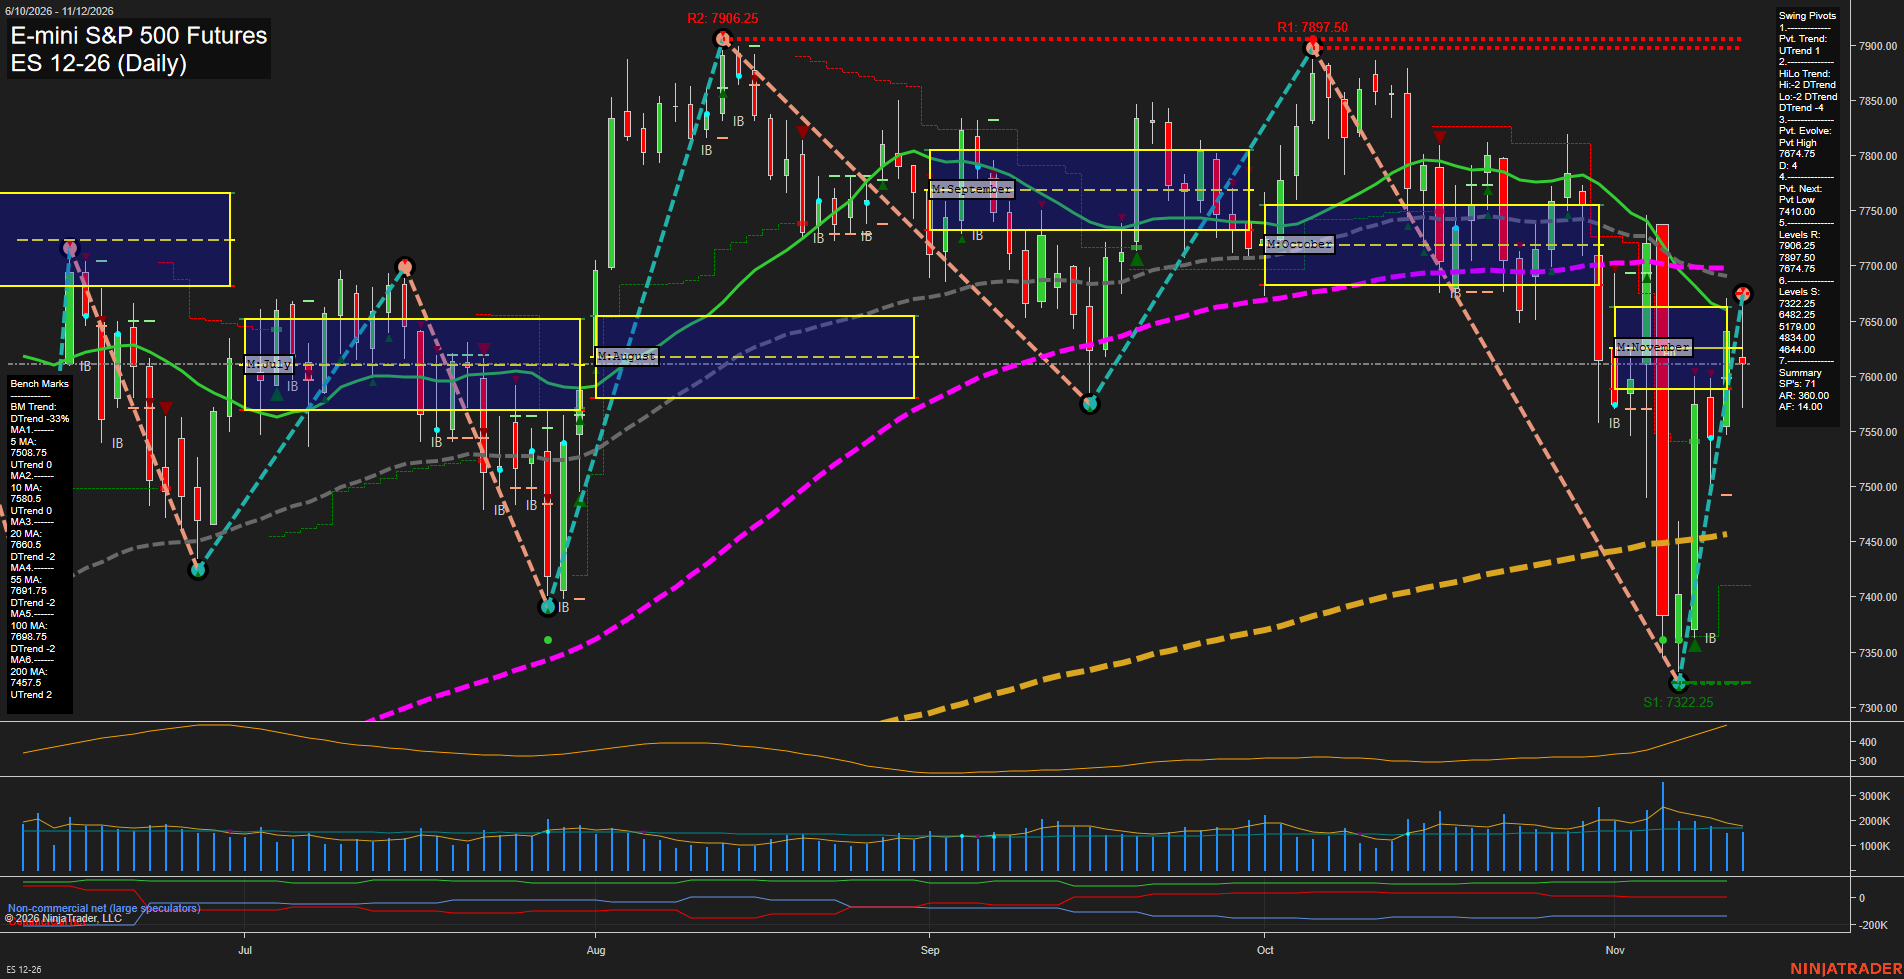
Overall Rating
- Short-Term: Bullish
- Intermediate-Term: Bearish
- Long-Term: Neutral.
Key Insights Summary
The daily structure shows a sharp V-shaped recovery from 7322.25, with an evolving swing high at 7674.75. Rising 5-day and 10-day benchmarks, an upward pivot trend and positive weekly positioning support a bullish short-term assessment. The latest smaller candle indicates that the rebound is losing speed near overhead resistance. Intermediate-term conditions remain bearish: the monthly grid is negative, the high/low pivot structure remains downward, and price sits below declining 20-day and 55-day benchmarks. The recent monthly long signal therefore represents a recovery attempt rather than confirmed intermediate-term trend alignment. Resistance is concentrated around 7666.50–7698.75, followed by the major swing highs at 7897.50 and 7906.25. Longer-term evidence is mixed, with positive yearly positioning and a rising 200-day benchmark offset by a declining 100-day benchmark. Elevated ATR and the large recent daily ranges characterize a volatile countertrend rebound within a still-damaged intermediate structure. No long-term TR720 signal or news catalyst is supplied, and seasonality alone does not establish trend confirmation.
View charts on: AlphaWebTrader HTF Charts
QQQ Daily View
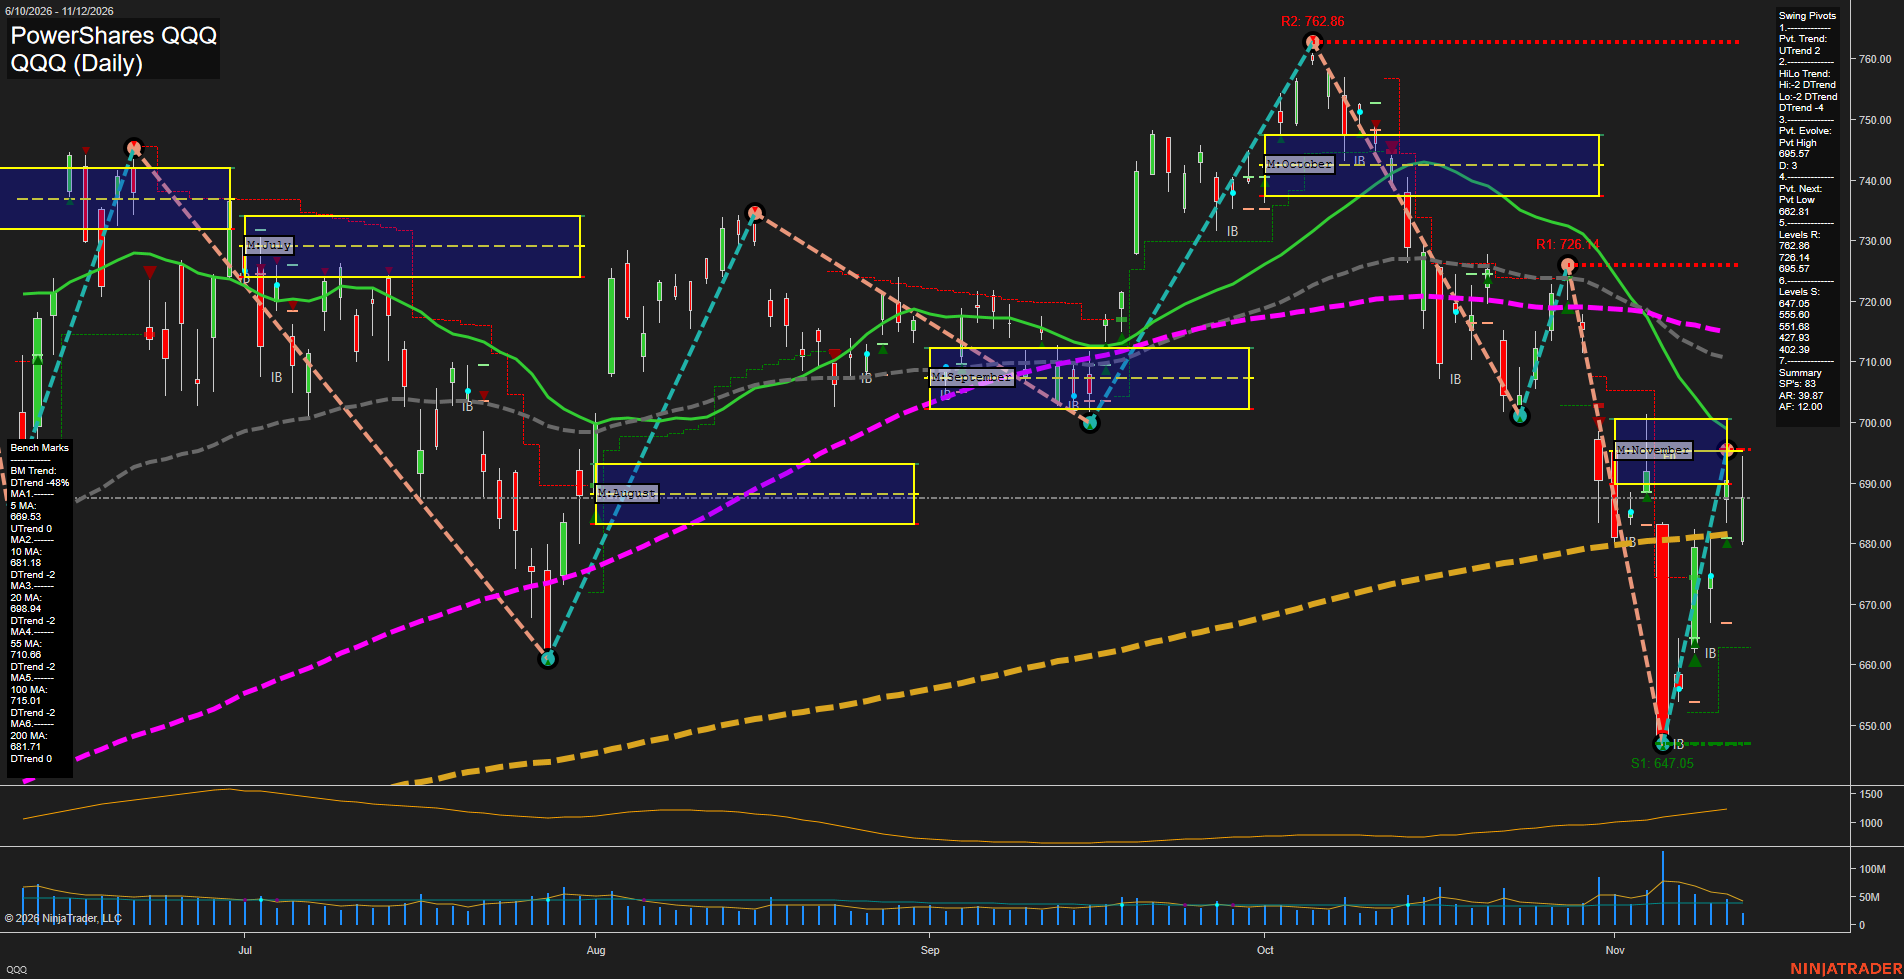
Overall Rating
- Short-Term: Neutral
- Intermediate-Term: Bearish
- Long-Term: Bearish.
Key Insights Summary
From a futures swing trader’s perspective, QQQ shows a fast countertrend recovery within a broader declining structure, rather than a confirmed trend reversal. The rebound from 647.05 reached evolving pivot resistance at 695.57, near the November grid center, before retreating below the grid’s lower boundary around 690. Short-term pivot improvement conflicts with mixed short-term benchmarks, while declining intermediate benchmarks and lower swing highs and lows preserve the broader bearish structure. Price remains near the 10-day and 200-day benchmark area around 681–682, with the 20-day benchmark near 699 overhead. Large daily ranges and a rising ATR plot indicate expanding volatility; the supplied ATR and VOLMA figures above cannot be independently verified from visible numerical labels. Weekly and yearly grids and named trade-signal summaries are not visible, so their neutral entries reflect unavailable confirmation. These are QQQ reference levels, not executable Nasdaq futures prices; futures basis and contract rollover can create differences. The image alone does not establish news or seasonal drivers.
View charts on: AlphaWebTrader HTF Charts
NQ Daily View
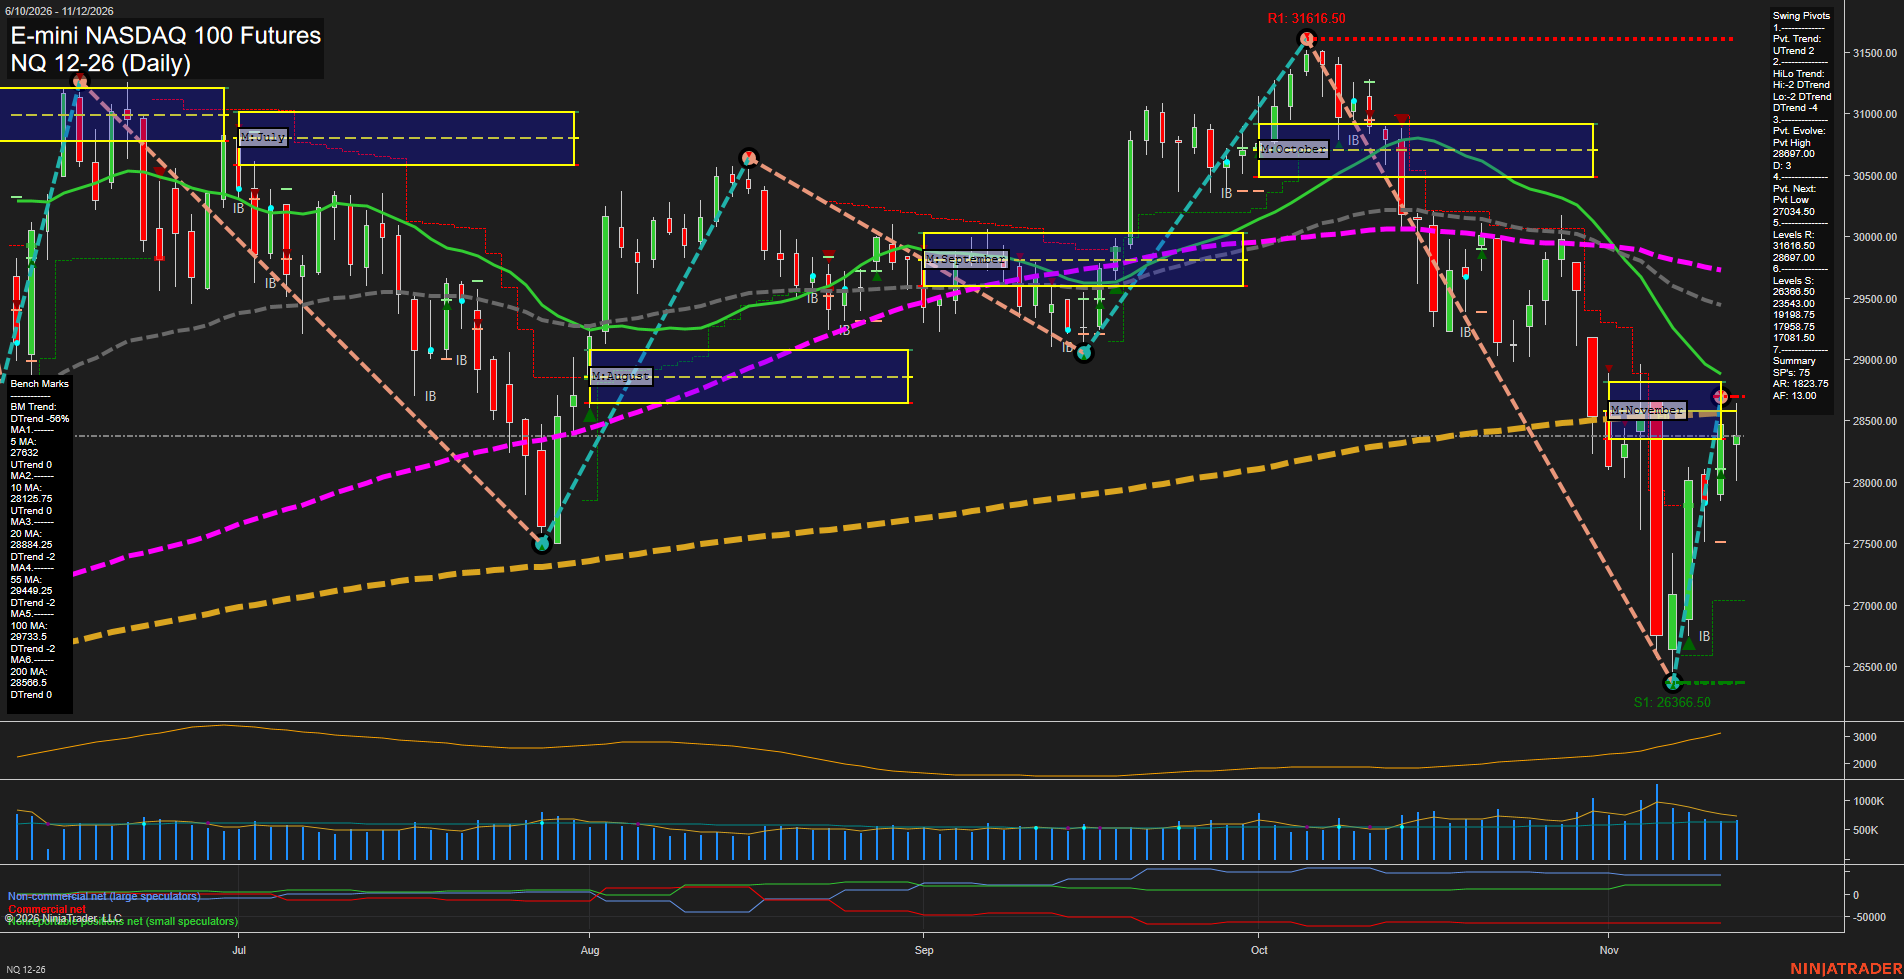
Overall Rating
- Short-Term: Bullish
- Intermediate-Term: Bearish
- Long-Term: Bearish.
Key Insights Summary
The swing-trading picture is a sharp countertrend recovery within a broader declining structure. The rebound from 26366.50 to an evolving pivot high of 28697.00 has turned the short-term pivot trend and both fast benchmarks upward, consistent with the weekly grid and November 9 long signals. However, the intermediate pivot structure still shows declining highs and lows, while price remains below the falling 20-, 55- and 100-day benchmarks. The 200-day benchmark at 28566.5 and pivot resistance at 28697.00 form an overhead resistance cluster; the latest small candle reflects a pause after the rapid recovery. Monthly weakness contrasts with positive weekly and yearly grid readings, explaining the divergence between bullish short-term momentum and bearish broader benchmark evidence. Elevated ATR underscores the unusually wide recent swings. The image does not establish a news catalyst or validate a seasonal explanation.
View charts on: AlphaWebTrader HTF Charts
USO Daily View
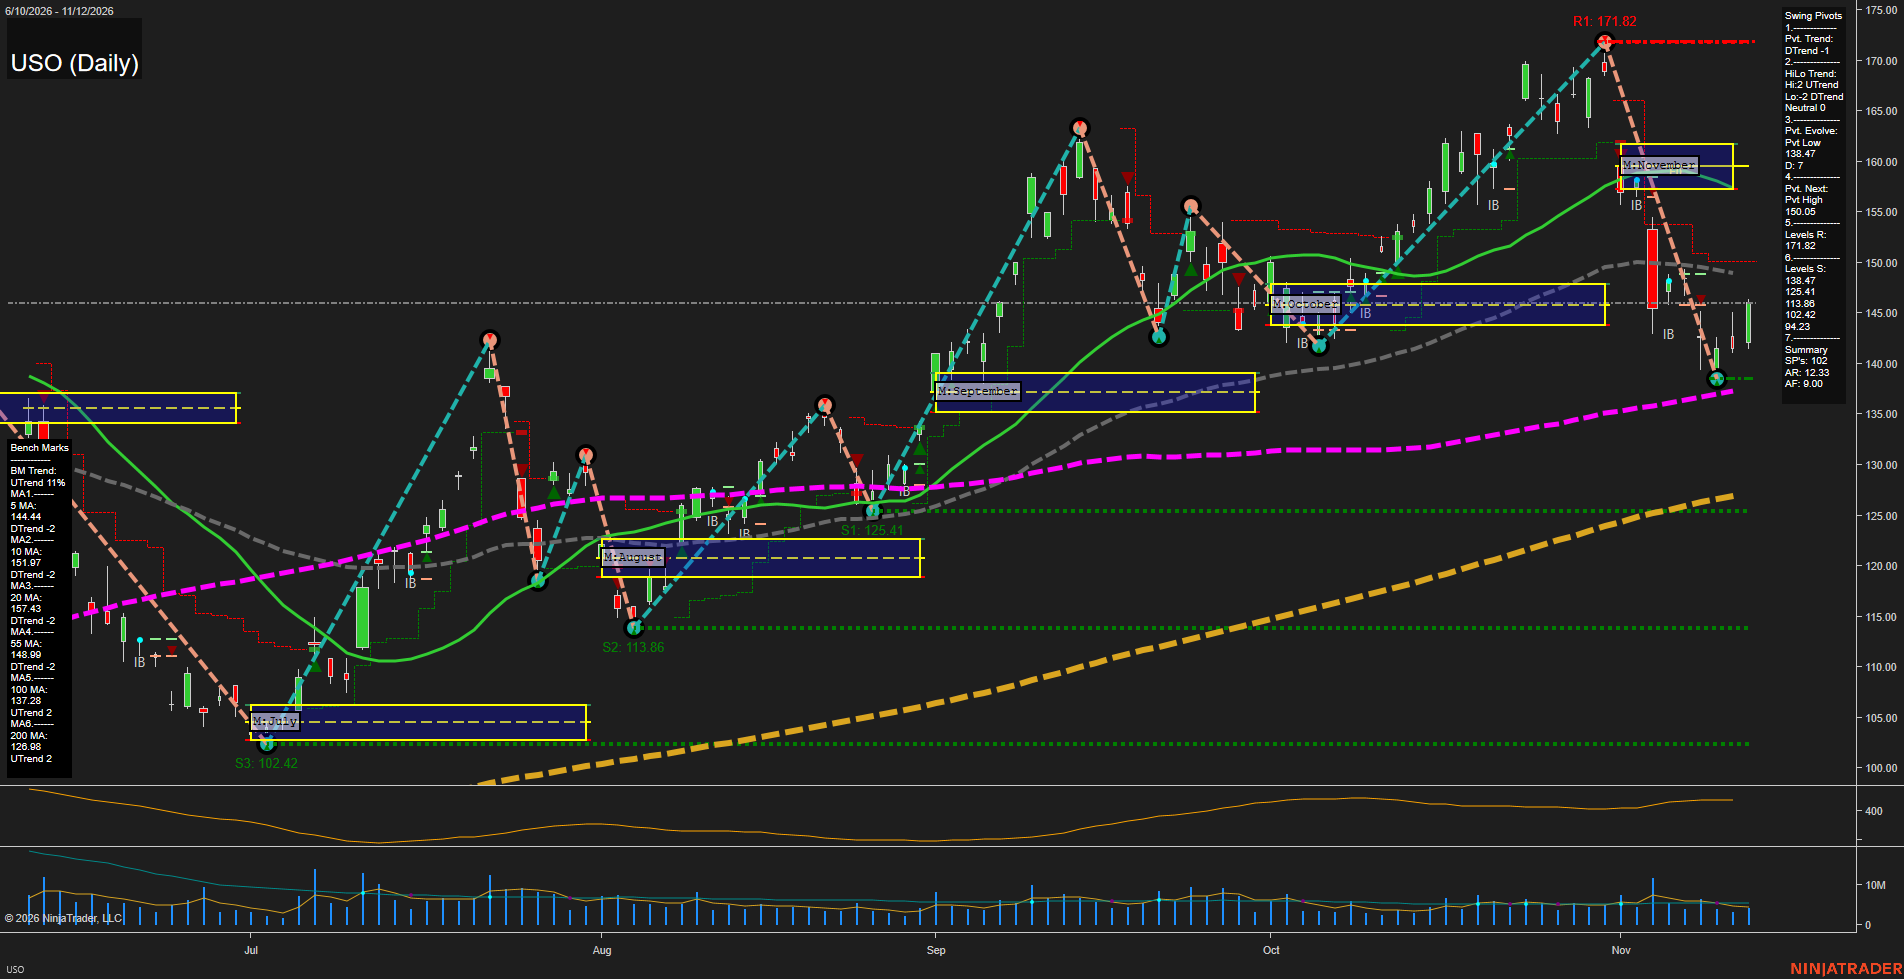
Overall Rating
- Short-Term: Bearish
- Intermediate-Term: Bearish
- Long-Term: Bullish.
Key Insights Summary
From a futures swing trader’s perspective, USO shows a sharp corrective downswing within a still-rising long-term structure. The decline from 171.82 to 138.47 was approximately 19.4%; the latest rebound has recovered the 5-day benchmark but remains below the declining 10-, 20- and 55-day averages. The 148.99 benchmark and 150.05 opposite-pivot threshold define the nearest overhead technical cluster. Support at 138.47 sits just above the rising 100-day average at 137.28. The pivot summary explicitly reports a neutral HiLo trend, reflecting conflicting high- and low-pivot trends. Although the grid fields above are neutral placeholders, price visibly sits below November’s monthly neutral zone, approximately 157–162, reinforcing intermediate-term weakness. The rebound remains a countertrend move rather than a confirmed upside pivot reversal. Weekly and yearly grids and named strategy signals are not visible; news and seasonal explanations cannot be established from this chart. The last price is estimated because its black marker is not legible; ATR and VOLMA reproduce the supplied template values rather than independently verified panel readings. USO is an oil-futures-linked ETF, so its price levels are not crude futures contract levels.
View charts on: AlphaWebTrader HTF Charts
CL Daily View
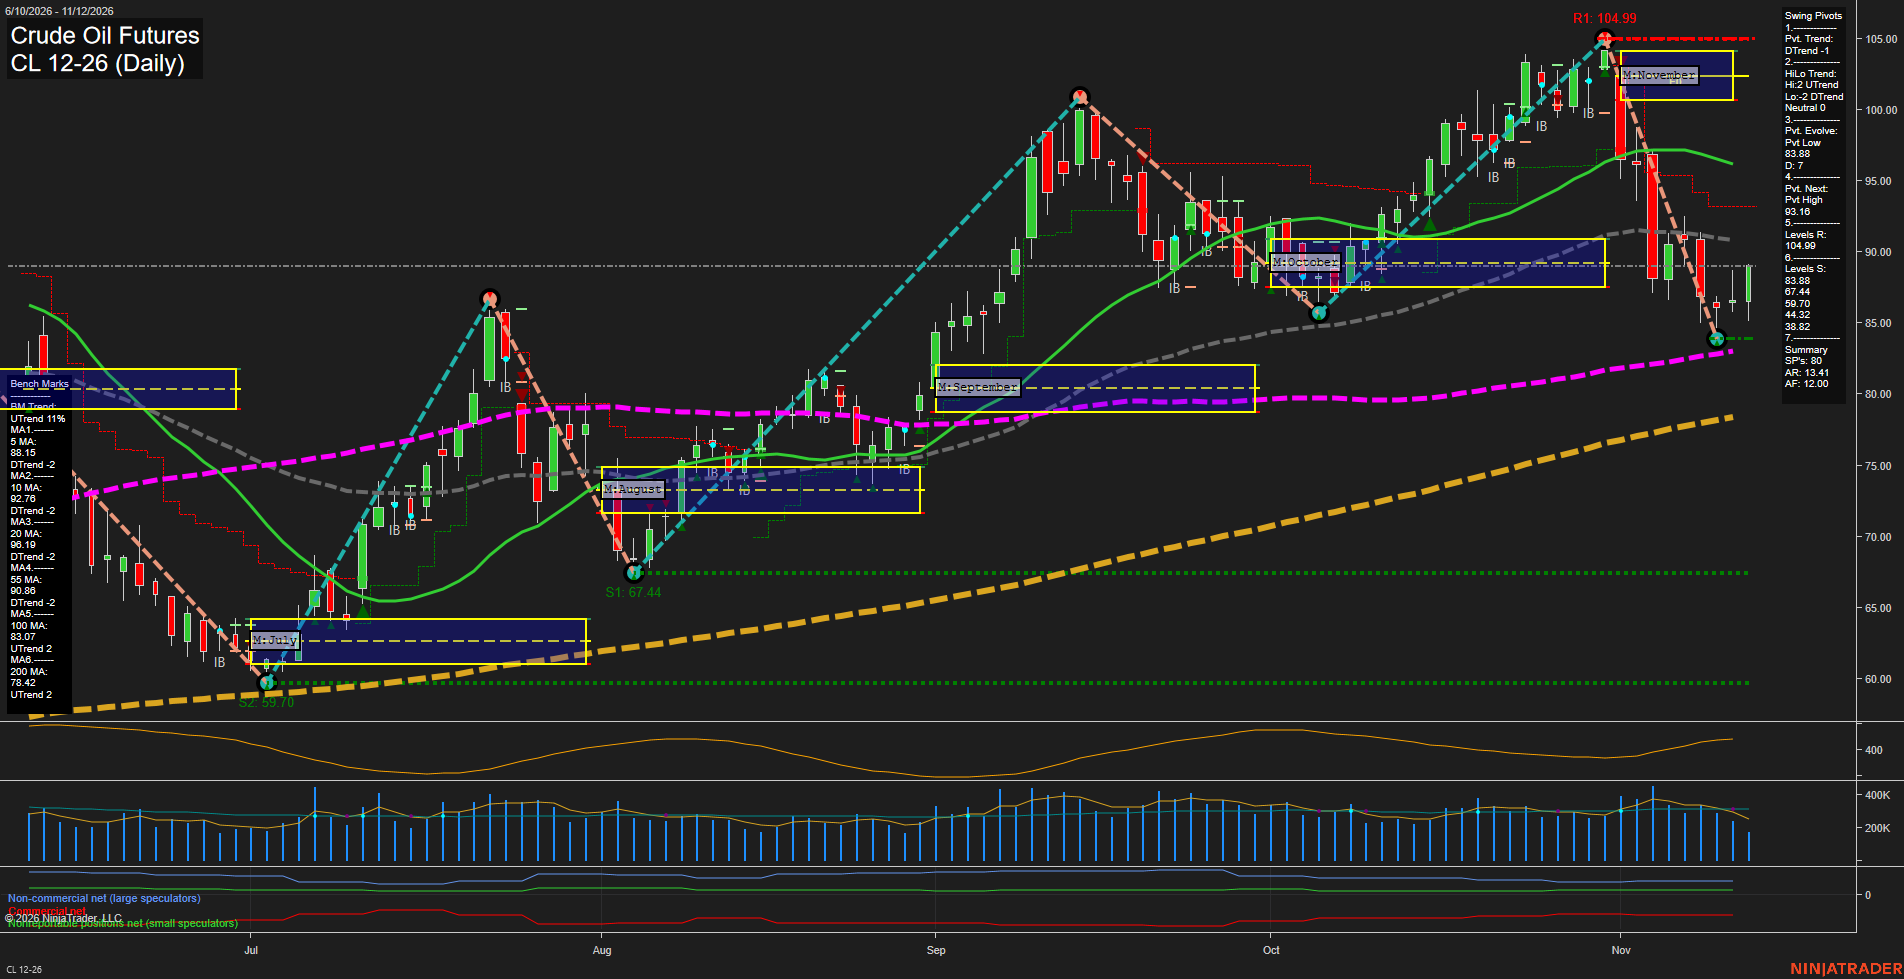
Overall Rating
- Short-Term: Bearish
- Intermediate-Term: Bearish
- Long-Term: Bullish.
Key Insights Summary
The swing-trading picture is a sharp corrective selloff within a still-rising long-term trend. The decline from 104.99 to the evolving 83.88 pivot low broke the prior upswing, while the mixed high/low pivot structure leaves the intermediate pivot trend neutral. Price has rebounded toward 89 and recovered above the falling five-day benchmark, but remains below the falling 10-, 20- and 55-day benchmarks and November’s NTZ. The latest TR120 long signal therefore describes a countertrend recovery rather than broad bullish alignment; the weekly short signal remains directionally consistent with the weaker weekly and monthly grids. The 90.86–93.16 area contains the 55-day benchmark, 10-day benchmark and next pivot reversal threshold, while 83.88 support sits near the rising 100-day benchmark at 83.07. Rising long-term averages and the positive yearly grid preserve the broader bullish backdrop. Elevated daily ranges emphasize the volatility of this correction. The chart alone does not establish a news catalyst or a seasonal explanation.
View charts on: AlphaWebTrader HTF Charts
GLD Daily View
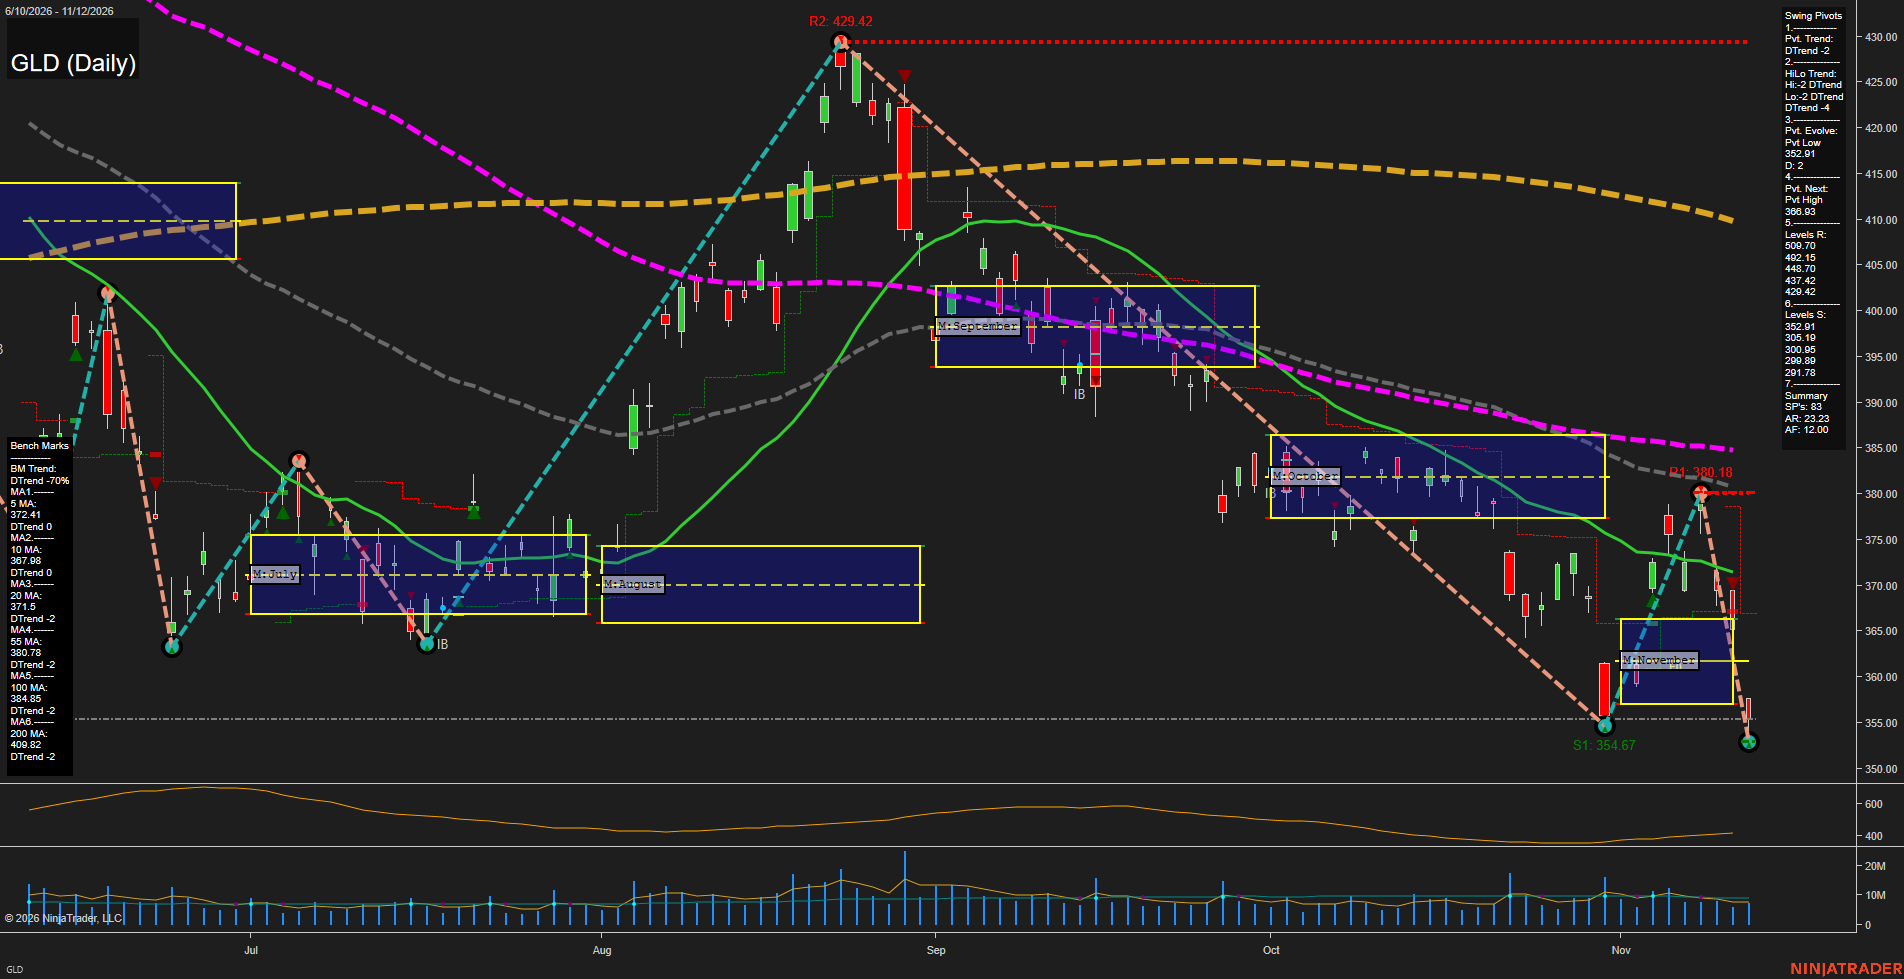
Overall Rating
- Short-Term: Bearish
- Intermediate-Term: Bearish
- Long-Term: Bearish.
Key Insights Summary
From a futures swing trader’s perspective, GLD shows aligned downside trends rather than an isolated pullback. The rebound from 354.67 to 380.18 failed, followed by a sharp decline to an evolving 352.91 low, extending the lower-high/lower-low structure. Price is below all six declining benchmarks and below November’s monthly neutral zone, approximately 357–366, indicating renewed downside expansion after the rebound. The latest bar appears to recover modestly from its low, but this has not reversed the pivot downtrend; the summary identifies 366.93 as the next opposite-pivot reversal threshold. The nearby chart-marked 380.18 swing high is distinct from the resistance levels listed in the summary. Weekly and yearly grids and named trade-signal readings are not visible, so their directions cannot be verified. GLD is an ETF proxy for gold, not a futures contract; futures basis and contract-specific pricing are not represented. News and seasonal catalysts cannot be established from this chart. ATR and VOLMA above retain the supplied template values rather than independently verified panel readings.
View charts on: AlphaWebTrader HTF Charts
GC Daily View
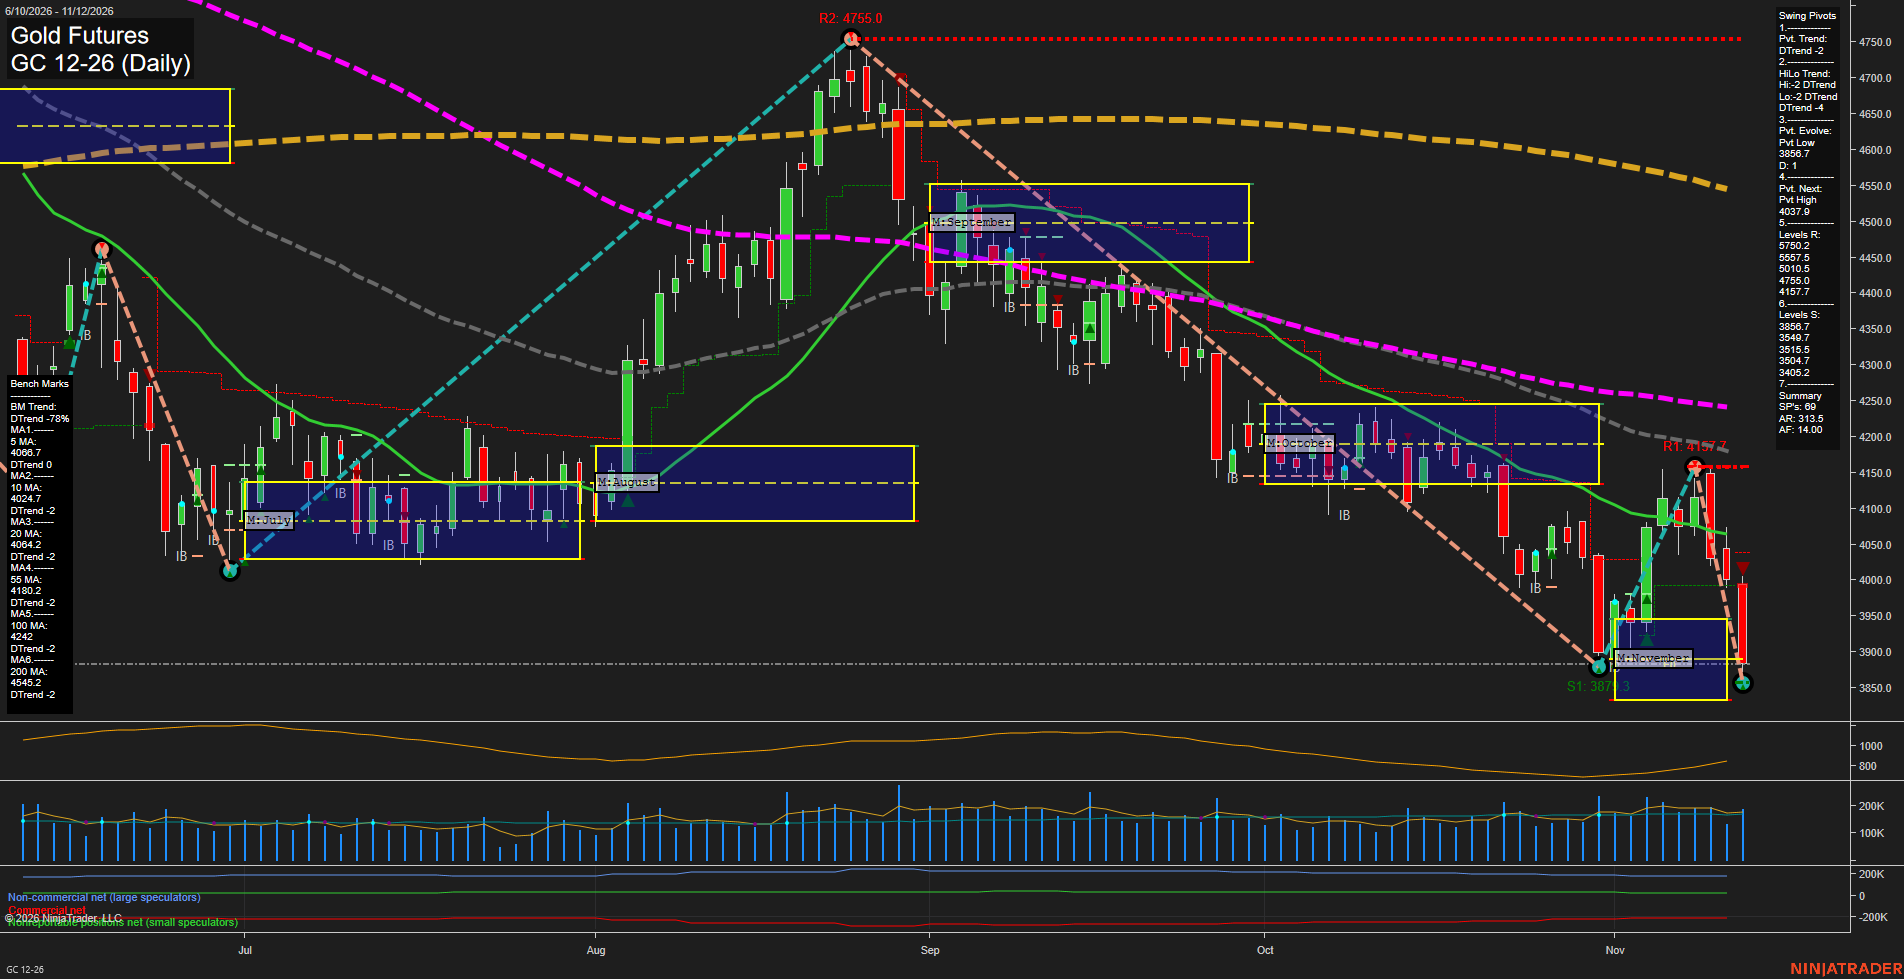
Overall Rating
- Short-Term: Bearish
- Intermediate-Term: Bearish
- Long-Term: Bearish.
Key Insights Summary
From a futures swing-trading perspective, the rebound from 3877.3 to 4157.7 now reads as a countertrend rally followed by renewed selling. The evolving 3856.7 pivot low undercuts the prior low, reinforcing the lower-high/lower-low structure. Large bearish bars and price below all six declining benchmarks show downside momentum aligned across time horizons. Weekly, monthly and yearly grid trends reinforce that bearish assessment, as do the supplied short signals. Price is near the monthly grid center and recent lows, while 4157.7 remains the nearest listed overhead swing resistance. The 4037.9 next-pivot threshold is a structural reversal reference rather than an established resistance pivot. No intermediate-term MSFG trade signal or news catalyst is supplied, and this chart alone does not establish a seasonal explanation.
View charts on: AlphaWebTrader HTF Charts
ZB Daily View
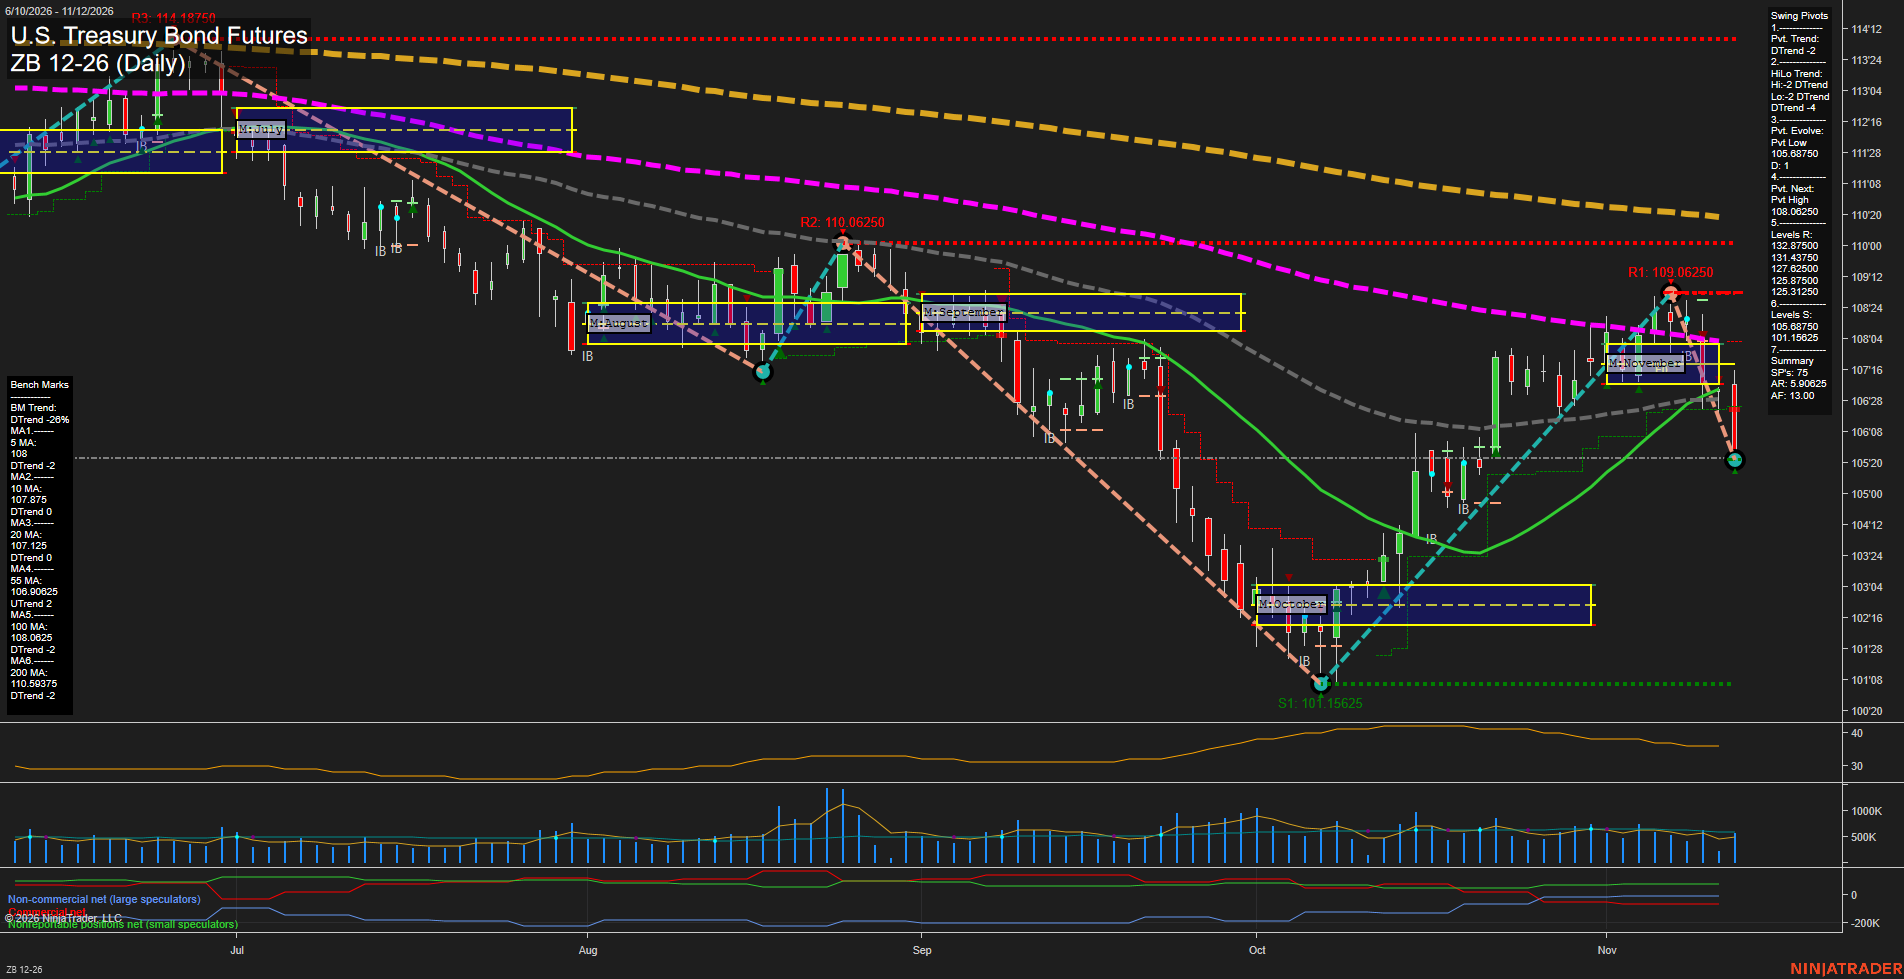
Overall Rating
- Short-Term: Bearish
- Intermediate-Term: Bearish
- Long-Term: Bearish.
Key Insights Summary
The October recovery from 101.15625 reversed at 109.06250, below the prior visible swing highs at 110.06250 and 114.18750. This lower-high sequence places the recovery within a broader bearish structure rather than a confirmed trend reversal. Recent large declining candles show accelerating downside momentum, with price below November’s neutral trading zone and all six benchmark averages. The rising 55-day average is the principal countertrend exception, but price has fallen beneath it. The evolving low at 105.68750 is the immediate support reference, followed by the October low at 101.15625; the next opposite-pivot threshold is 108.06250. Weekly, monthly and yearly grid readings reinforce the bearish alignment. ATR has eased from its October peak despite the sharp recent decline. Named trade-signal readings and news or seasonal catalysts are not supplied, so they cannot be independently assessed.
View charts on: AlphaWebTrader HTF Charts
Sentiment Summary: Negative coverage dominated at 53% versus 17% positive, centered on Nvidia’s November 12 announcement of Jensen Huang’s resignation following November 11 board-removal reports; leadership uncertainty, China-related investigations and analyst downgrades weighed on AI stocks and Nasdaq futures overnight. October existing-home sales, released November 12, fell 5.5% to their lowest since 2010, adding economic weakness to the coverage. The main counterweight was intraday recovery in the S&P 500 and Nasdaq as Nvidia’s selling eased and AMD and Broadcom rallied, following November 11’s CoreWeave-led rebound.
Conclusion: Mega-cap concentration remains a material index risk ahead of Nvidia’s November 17 after-close earnings.