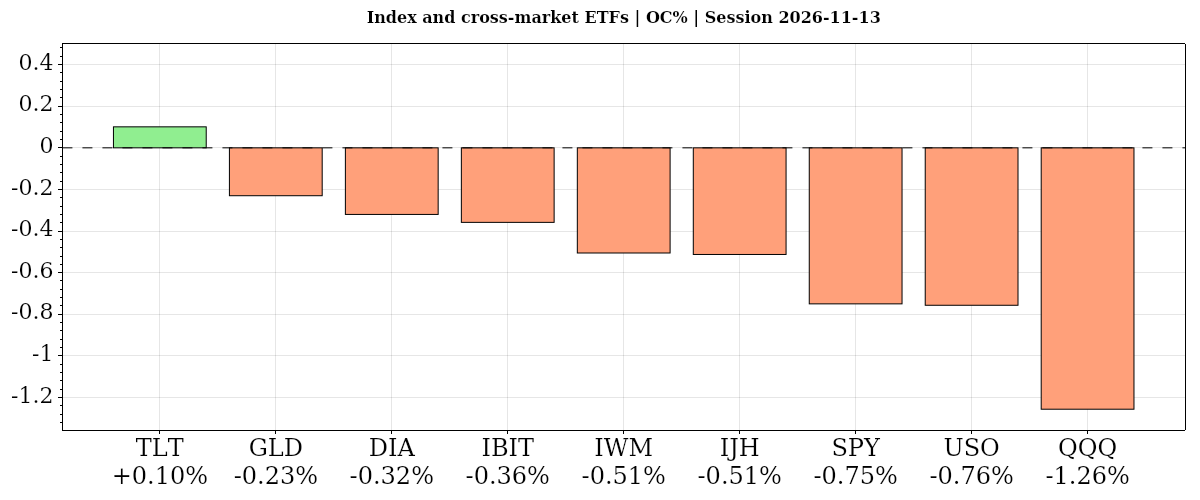
Stocks and tech fell Friday as Nvidia slid and chip selling weighed. Oil and gold eased from the open; far-term Treasuries closed 0.43% lower.
Fundamentals: Stocks and technology shares fell at Friday’s NYSE close as Nvidia’s leadership uncertainty and broader semiconductor selling weighed on equities. Apple gained 0.99%, while Microsoft recovered after a service outage. Oil and gold declined, while bonds rose. Monthly producer prices increased 0.3%, below the 0.4% forecast, with core PPI matching expectations. Fed Vice Chair Jefferson’s speech remained scheduled for 7 p.m. ET, after the cash-equity close.
Technicals: Stocks weakened in Friday's completed session: the S&P 500 ETF fell 0.75% from its open and the Nasdaq-100 ETF lost 1.26%. Nvidia dropped 4.15% from its open, while Meta gained 2.31%. Oil and gold ETFs slipped 0.76% and 0.23%, respectively, although gold finished 0.16% above its prior close. far-term Treasury bonds rose 0.10% from the open but closed 0.43% below their prior close. Futures charts showed volatile rebounds within unresolved U.S. equity corrections.
After Market Close daily snapshot: market news summary and sentiment, major ETFs, Magnificent 7 analysis, Indices Futures Higher Time Frame Analysis, and E-mini S&P500, Nasdaq 100, NYMEX Crude, Gold Futures Daily Chart analysis.
As of: November 13, 2026 06:15 CT
EcoNews Radar U.S. Events Day Recap
| Date | Impact | Event, Prev, Forecast, Actual | Info |
|---|---|---|---|
| 2026-11-13 Friday 08:30 | High | Producer Price Index ex Food & Energy (MoM) Prev: 0.70% Forecast: 0.30% Actual: 0.30% | Measures monthly changes in producer selling prices excluding food and energy. Traders monitor underlying cost pressures for implications for interest-rate expectations and equity valuations. |
| 2026-11-13 Friday 08:30 | High | Producer Price Index (MoM) Prev: 1.30% Forecast: 0.40% Actual: 0.30% | Tracks monthly changes in prices received by domestic producers. Traders watch for pipeline inflation pressures that may influence monetary policy expectations and corporate margins. |
| 2026-11-13 Friday 08:30 | Medium | Producer Price Index (YoY) Prev: 6.3% Forecast: 6.6% Actual: 6.5% | Measures changes in producer selling prices over a year. Traders use it to assess the broader inflation trend and its implications for interest rates and equity valuations. |
| 2026-11-13 Friday 08:30 | High | Producer Price Index ex Food & Energy (YoY) Prev: 5.0% Forecast: 5.0% Actual: 5.0% | Tracks annual producer-price changes excluding food and energy. Traders monitor persistent cost pressures that may inform the policy outlook and expectations for business margins. |
| 2026-11-13 Friday 08:45 | Medium | Fed's Goolsbee speech Prev: — Forecast: — Actual: — | Offers potential insight into a policymaker’s economic assessment and policy preferences. Traders monitor remarks for signals that could alter rate expectations and index-futures sentiment. |
| 2026-11-13 Friday 09:00 | Medium | Fed's Daly speech Prev: — Forecast: — Actual: — | Provides an opportunity for commentary on inflation, employment and monetary policy. Traders watch for guidance that may affect expected interest rates and equity valuations. |
| 2026-11-13 Friday 09:45 | Medium | Fed's Logan speech Prev: — Forecast: — Actual: — | May clarify a policymaker’s assessment of economic conditions and the appropriate policy stance. Traders monitor any implications for the expected rate path and financial conditions. |
| 2026-11-13 Friday 10:30 | Medium | Fed's Collins speech Prev: — Forecast: — Actual: — | Offers potential updates on the economic outlook and monetary-policy considerations. Traders assess remarks for changes in policy expectations relevant to index futures. |
| 2026-11-13 Friday 10:50 | Medium | Fed's Bowman speech Prev: — Forecast: — Actual: — | May provide perspective on inflation risks, employment and policy settings. Traders watch for signals affecting interest-rate expectations and the discount rates applied to equities. |
| 2026-11-13 Friday 19:00 | Medium | Fed's Jefferson speech Prev: — Forecast: — Actual: — | Offers potential insight into central-bank leadership’s economic outlook and policy thinking. Traders monitor remarks for implications for the expected rate path and equity valuations. |
Summary: The calendar centers on U.S. producer inflation and Federal Reserve communication.
Conclusion: The scheduled commentary extends beyond the regular U.S. cash-equity session.
Market News Summary:
Nvidia’s leadership transition and renewed inflation concerns dominated Friday’s technology-heavy market coverage.
Primary Drivers & Risks:
- Primary Driver: Nvidia leadership upheaval and semiconductor selling
- Primary Risk: Inflation pressure and December rate-hike concerns
Tone:
Cautious, with broad AI-sector pressure and selective defensive rotation.
Data, Market and System
Geopolitical:
- Chinese technology stocks faced pressure as investors prepared for tighter chip restrictions following the departure of Huang, an influential advocate for sales to Chinese companies.
- Ukrainian President Volodymyr Zelenskiy said continuing Starshield restrictions were hampering operations inside Ukraine.
Oil / Energy:
- Falling oil prices helped improve equity-market sentiment Monday before inflation concerns interrupted the rebound.
Gold / Metals:
- Gold broke below $4,000 an ounce and erased the previous week’s gains as persistent inflation and concerns about higher interest rates weighed on prices.
Fed / Financials:
- Hotter-than-anticipated inflation data sent stock futures lower Tuesday and intensified rate-hike concerns.
- Federal Reserve Governor Christopher Waller signaled that a December interest-rate increase was probable.
Macro / Other:
- SpaceX announced plans to spend more than $74 billion on two AI supercomputing campuses in Texas and Arizona, while an Arizona permit faced opposition from a petition with 2,400 signatures.
- National Economic Council Director Kevin Hassett denied a report that he was leaving the White House in the coming weeks.
Conclusion:
Nvidia’s leadership uncertainty and widening semiconductor weakness dominated the equity backdrop. Its substantial S&P 500 weight made the disruption relevant beyond individual technology stocks.
Persistent inflation and December rate-hike concerns added pressure across equities and gold. Apple’s gain and Microsoft’s recovery provided selective offsets, while large AI infrastructure spending plans contrasted with weaker AI-stock sentiment.
Market News Sentiment
Sentiment Bias shows the balance of positive and negative news coverage sampled from 2026-11-12 16:00 to 2026-11-13 15:59 ET, covering stocks, energy and gold.
▼ Market news
- Bias
- ▼ -32.53%
- Articles
- 289
- Positive
- ▲ 15.22%
- Neutral
- — 37.02%
- Negative
- ▼ 47.75%
▼ GLD / Gold
- Bias
- ▼ -28.57%
- Articles
- 14
- Positive
- ▲ 21.43%
- Neutral
- — 28.57%
- Negative
- ▼ 50.00%
Sentiment Summary: Gold coverage was negative overall (50% negative versus 21% positive), with November 12 losses tied to rising Treasury yields, dollar strength and Fed rate-hike concerns. On November 13, tame monthly PPI and cooler October headline CPI failed to offset persistent core inflation, rising real yields and concerns about December tightening; Goldman Sachs also cut its year-end gold target to $4,150. Bargain hunting supported an early Friday rebound from a 13-month low, but later coverage reported gold unable to hold above $4,000.
Conclusion: Rates and dollar pressure remained the dominant cross-market context despite softer headline inflation readings.
▼ USO / Oil
- Bias
- ▼ -44.44%
- Articles
- 18
- Positive
- ▲ 16.67%
- Neutral
- — 22.22%
- Negative
- ▼ 61.11%
Sentiment Summary: Oil coverage was 61% negative versus 17% positive, led by Friday’s IEA outlook for a fourth-quarter surplus as Gulf exports recover, alongside rising U.S. inventories and emergency-stock releases set to accelerate through February. October global supply reached 105.4 million barrels daily, exceeding demand; persistent Middle East shipping disruptions provided a counterweight, supporting Friday’s crude rebound. For equities, falling oil reportedly helped Monday’s sentiment, but Friday’s reported 6.5% annual wholesale-inflation increase highlighted price pressures extending beyond energy, with expensive diesel raising transportation costs.
Conclusion: Softer crude prices coexist with broader inflation pressures, limiting a uniformly favorable cross-market interpretation.
Glossary: Sentiment Bias = (positive articles − negative articles) ÷ total articles × 100. It ranges from −100% negative to +100% positive. A reading near zero indicates little directional bias. Neutral articles reduce the score’s strength. ▲ positive; ▼ negative; — balanced. These readings describe news coverage, not market-price direction.
Market Technical Analysis
Analysis of VIX volatility, the completed session in major ETFs and mega-cap tech stocks, and futures snapshots and higher-time-frame analysis.
VIX — Market Fear Gauge Daily
| Level | Open | High | MaxVix | Low | MinVix | DNC% | DOC% | VR | MaxVR | MinVR |
|---|---|---|---|---|---|---|---|---|---|---|
| 19.29 | 18.32 | 20.92 | 28.36 | 18.13 | 16.21 | +3.16% | +5.29% | 8.69 | 56.57 | -6.27 |
VIX rose 5.29% from the session's opening level. VIX rose 3.16% versus the previous session close. Expected volatility rose from the period open. VIX is 25.3% up the recent 15-session range (16.21–28.36), in the 20–30% band.
VR: ATN Volatility Ratio (VR): 8.69 – Stocks fell while expected volatility rose. VR is in the lower part of its preceding 15-session VR range (-6.27 to 56.57), in the 20–30% band. VR fell 10.85 points from the previous session, a moderate shift relative to that range.
Range lookback: preceding 15 completed sessions.
Major ETFs and Mega Cap Tech Stocks
- Nvidia traded lower Friday following Jensen Huang’s Thursday resignation, with its board reporting that no search firm had been selected to identify a permanent successor.
- Nvidia accounts for more than 5% of the S&P 500, giving its leadership disruption substantial index relevance.
- AMD and other chip stocks fell Friday as investors reassessed the AI trade, reversing the initial supplier-diversification optimism that supported several Nvidia rivals Thursday.
- Apple rose 0.99% as investors sought relatively defensive technology exposure during the AI selloff.
- Microsoft shares recovered Friday after an outage disrupted Outlook, Teams and Copilot services across more than 70 countries.
- The Nasdaq briefly entered correction territory during the recent rocky stretch, while an early-week rebound faded amid renewed inflation concerns.
- Regulators reviewing Union Pacific’s $72 billion railroad merger expressed serious concerns after reviewing its CEO’s remarks.
ETF, Mag7, and Cross-Market ETF Insights
Overall Tone
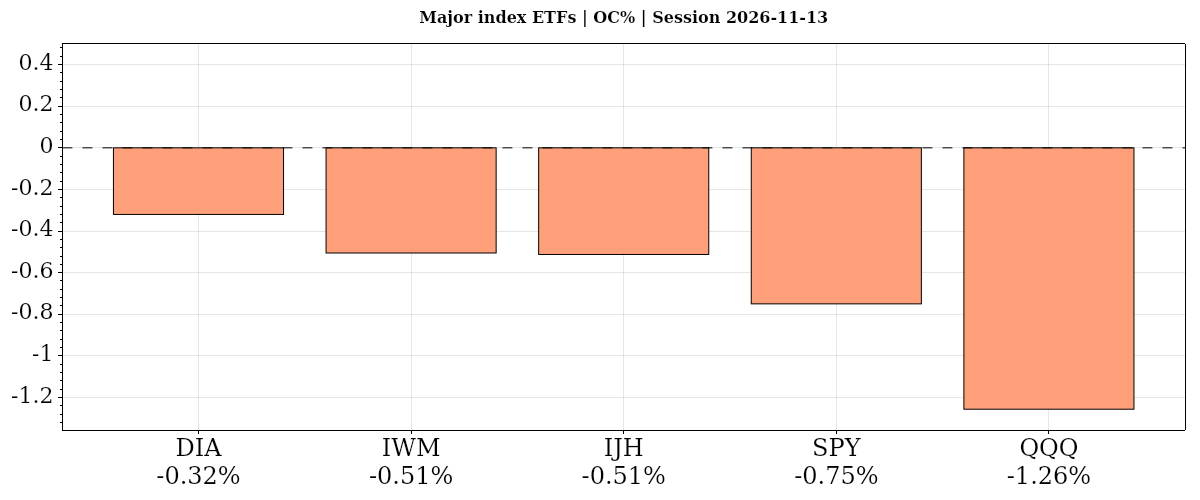
The November 13, 2026 daily session showed a cautious risk tone, with widespread losses from the open and weaker prior-close comparisons across most groups.
| Instrument | Bias | Date | DNC% | DOC% | O | H | L | C | VWAP | Vol |
|---|---|---|---|---|---|---|---|---|---|---|
| ▼ DIA | ▲ ▼ ▲ | 2026-11-13 | ▲ +0.13% | ▼ -0.32% | 524.83 | 524.99 | 519.70 | 523.15 | ▲ 522.34 | 2,226,667 |
| ▼ IWM | ▼ ▼ ▲ | 2026-11-13 | ▼ -0.32% | ▼ -0.51% | 278.95 | 279.17 | 274.67 | 277.54 | ▲ 276.87 | 17,313,803 |
| ▼ IJH | ▼ ▼ ▲ | 2026-11-13 | ▼ -0.12% | ▼ -0.51% | 74.14 | 74.19 | 73.03 | 73.76 | ▲ 73.60 | 4,903,541 |
| ▼ SPY | ▼ ▼ ▲ | 2026-11-13 | ▼ -0.36% | ▼ -0.75% | 760.07 | 760.12 | 745.20 | 754.37 | ▲ 752.69 | 36,139,201 |
| ▼ QQQ | ▼ ▼ ▲ | 2026-11-13 | ▼ -1.20% | ▼ -1.26% | 688.54 | 688.75 | 671.68 | 679.89 | ▲ 678.09 | 39,641,356 |
| AVG/Sum | — | — | -0.38% | -0.67% | — | — | — | — | — | 100,224,568 |
Index ETFs
Negative confluence: average DNC% -0.37% versus the prior close, DOC% -0.67% from the open. All five index ETFs fell from the open, with DIA holding up best and QQQ weakest; DIA alone gained versus the prior close, while mid- and small-caps declined. QQQ retained aligned moving-average downtrends.
DIA · D:2026-11-13 NC% ▲ +0.13% OC% ▼ -0.32%
DIA – Dow Jones Technicals Summary
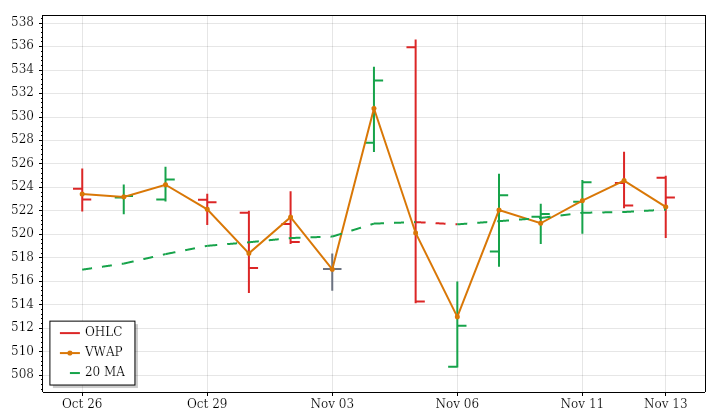
DIA’s completed November 13 daily session finished at 523.15, up 0.13% versus the prior close but down 0.32% from the open. The opening gap was filled, and the session produced a lower high and lower low before closing inside the previous day’s range. Finishing above VWAP provided a counterweight to that intraday weakness, rather than evidence of an unambiguously strong session.
The trend picture remained uneven. Price stood above a falling near-term benchmark, while intermediate- and far-term structures continued rising. The 15-session price trend was slightly negative and highly choppy. Latest range and volume were below average despite expanding ranges and increasing volume across that lookback. A fresh bullish ATR-median crossover conflicted with downward PSAR; a next-session high above 527.05 would conditionally reverse PSAR upward.
IWM · D:2026-11-13 NC% ▼ -0.32% OC% ▼ -0.51%
IWM – Small Cap Technicals Summary
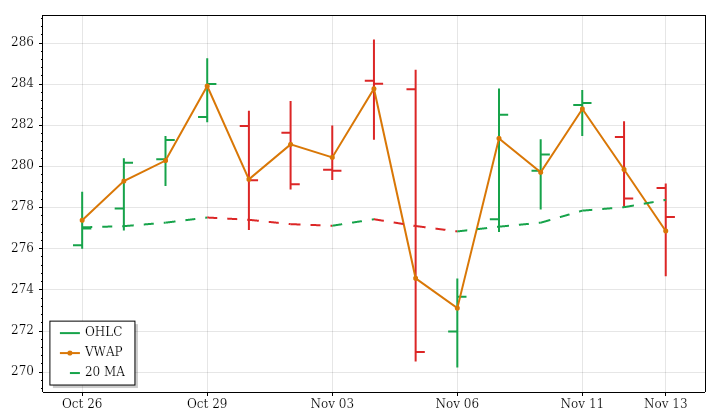
IWM’s completed November 13 daily session closed at 277.54, losing 0.32% versus the prior close and 0.51% from the open after filling a small opening gap higher. A lower high and lower low culminated in a finish below the prior day’s low. The close nevertheless held above VWAP, an intraday offset that did not remove the weaker daily price structure.
Price remained below a rising near-term benchmark, leaving that horizon mixed, while intermediate- and far-term structures were downward. The slight upward trend over the preceding 15 sessions had very little net progress relative to its back-and-forth movement. Latest range was essentially average and volume was below average, contrasting with expanding ranges and increasing activity over the lookback. Bullish ATR-median conflicted with bearish PSAR; a next-session high above 282.371 would conditionally reverse PSAR upward.
IJH · D:2026-11-13 NC% ▼ -0.12% OC% ▼ -0.51%
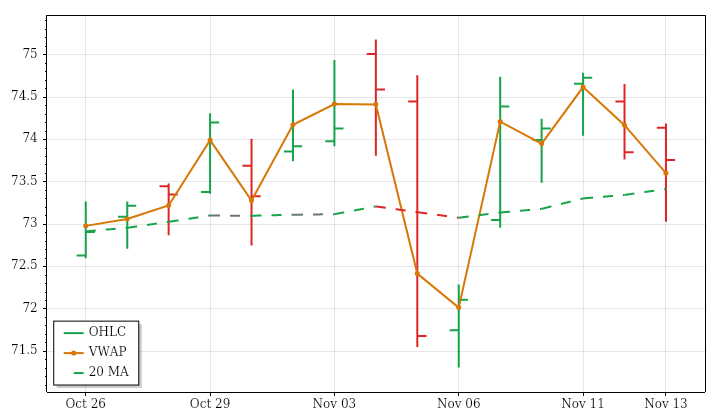
IJH – Mid Cap Technicals Summary
IJH’s completed November 13 daily session filled its opening gap and finished at 73.76, down 0.12% versus the prior close and 0.51% from the open. A lower high, lower low and close beneath the previous day’s low marked deterioration in the daily structure. Nevertheless, the finish remained above VWAP, making the session less uniformly weak than the prior-day comparison alone suggests.
All three trend horizons were mixed: price sat below rising near- and far-term benchmarks but above a falling intermediate benchmark. That lack of alignment matched the choppy, modestly upward 15-session price trend. The latest range was slightly above average, consistent with lookback expansion, while volume was substantially below average despite its increasing lookback trend. PSAR and ATR-median remained upward; a next-session low below 71.6493 would conditionally reverse PSAR downward.
SPY · D:2026-11-13 NC% ▼ -0.36% OC% ▼ -0.75%
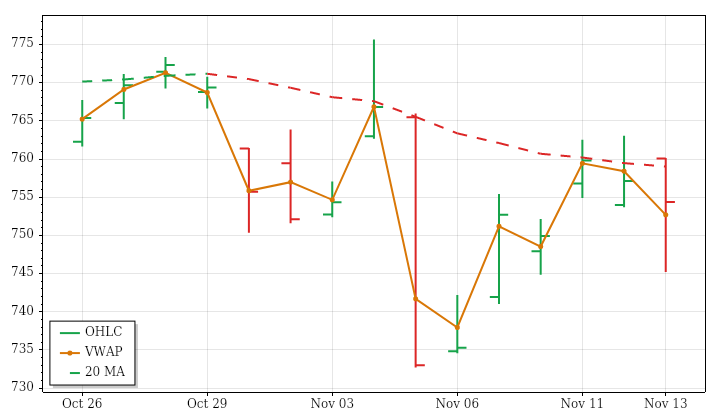
SPY – S&P 500 Technicals Summary
SPY’s completed November 13 daily session surrendered its opening gap higher and closed at 754.37, down 0.36% versus the prior close and 0.75% from the open. A lower high and lower low included a breach of the previous outside bar’s low, but the finish returned inside the prior day’s range. The close also remained above VWAP, tempering an otherwise weaker daily structure.
The near-term picture was mixed, with price above a falling benchmark; the intermediate trend was down while the far-term uptrend persisted. That conflict distinguished the latest decline from a fully aligned bearish structure. Range reached about 154% of average, consistent with lookback expansion, but volume was below average despite increasing over the preceding 15 sessions. Both technical trend states were bearish; a next-session high above 764.2675 would conditionally reverse PSAR upward.
S&P 500 News and Fundamentals
Goldman Sachs forecast that the S&P 500 would reach 8,700 over the next 12 months. The bank said more attractive valuations following a sharp selloff could support positive returns despite slower earnings growth.
QQQ · D:2026-11-13 NC% ▼ -1.20% OC% ▼ -1.26%
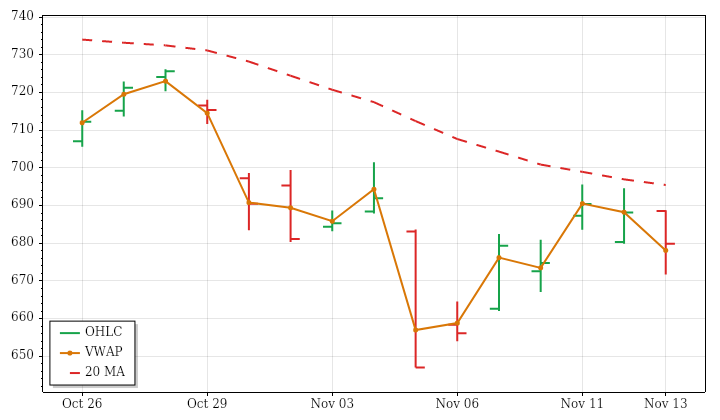
QQQ – Nasdaq 100 Technicals Summary
QQQ’s completed November 13 daily session closed at 679.89, down 1.20% versus the prior close and 1.26% from the open. Its small opening gap higher was filled, and a lower high and lower low accompanied the decline. The finish remained inside the previous day’s range and above VWAP, providing some intraday contrast without changing the negative daily return.
Near-, intermediate- and far-term trends were aligned downward, although the close was almost level with the falling near-term benchmark. The latest range was about 127% of average, consistent with expanding ranges over the preceding 15 sessions and a second consecutive large-range bar. Volume was below average despite its increasing lookback trend. Upward PSAR conflicted with the bearish ATR-median state; a next-session low below 651.7807 would conditionally trigger a downward PSAR reversal.
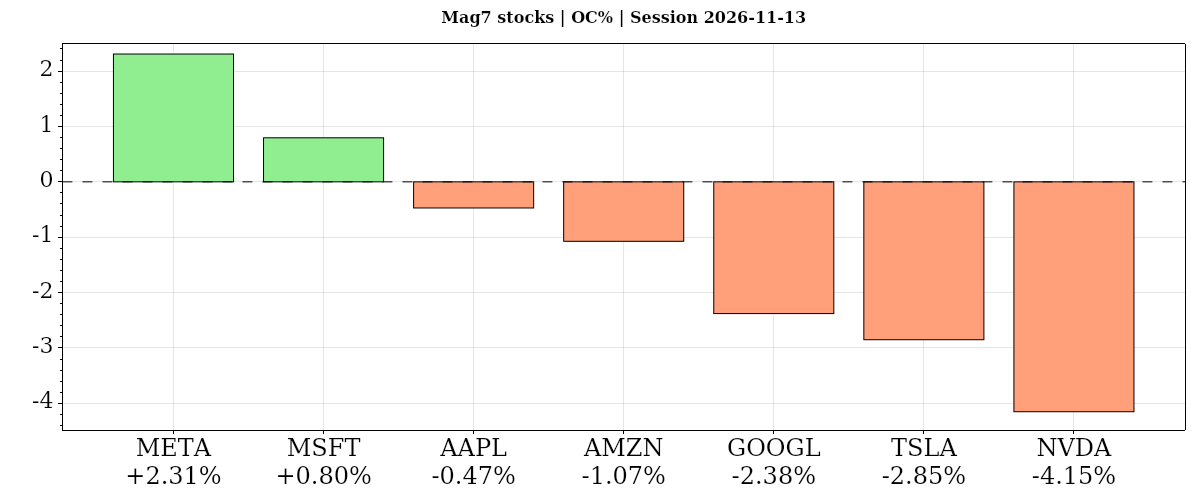
| Instrument | Bias | Date | DNC% | DOC% | O | H | L | C | VWAP | Vol |
|---|---|---|---|---|---|---|---|---|---|---|
| ▲ META | ▲ ▲ ▲ | 2026-11-13 | ▲ +2.90% | ▲ +2.31% | 627.21 | 643.91 | 624.79 | 641.69 | ▲ 636.04 | 15,099,051 |
| ▲ MSFT | ▲ ▲ ▲ | 2026-11-13 | ▲ +0.17% | ▲ +0.80% | 519.75 | 526.42 | 513.82 | 523.88 | ▲ 522.87 | 25,513,557 |
| ▼ AAPL | ▲ ▼ ▼ | 2026-11-13 | ▲ +0.39% | ▼ -0.47% | 357.96 | 360.83 | 355.75 | 356.27 | ▼ 357.72 | 39,188,111 |
| ▼ AMZN | ▼ ▼ ▲ | 2026-11-13 | ▼ -0.29% | ▼ -1.07% | 269.56 | 270.05 | 263.91 | 266.66 | ▲ 266.40 | 29,909,494 |
| ▼ GOOGL | ▼ ▼ ▼ | 2026-11-13 | ▼ -0.98% | ▼ -2.38% | 302.98 | 304.97 | 293.44 | 295.77 | ▼ 297.11 | 30,753,344 |
| ▼ TSLA | ▼ ▼ ▼ | 2026-11-13 | ▼ -1.82% | ▼ -2.85% | 401.68 | 404.40 | 385.83 | 390.22 | ▼ 391.33 | 32,236,590 |
| ▼ NVDA | ▼ ▼ ▲ | 2026-11-13 | ▼ -2.01% | ▼ -4.15% | 169.91 | 170.00 | 158.39 | 162.85 | ▲ 161.97 | 362,985,199 |
| AVG/Sum | — | — | -0.23% | -1.12% | — | — | — | — | — | 535,685,346 |
Mag7 Stocks
Negative confluence: average DNC% -0.23% versus the prior close, DOC% -1.12% from the open. Only Meta and Microsoft gained from the open; Meta led both comparisons, while Nvidia lagged both and Tesla and Alphabet also weakened. Nvidia’s decline accompanied above-average range and volume within aligned downtrends, whereas Meta’s advance left its intermediate trend falling.
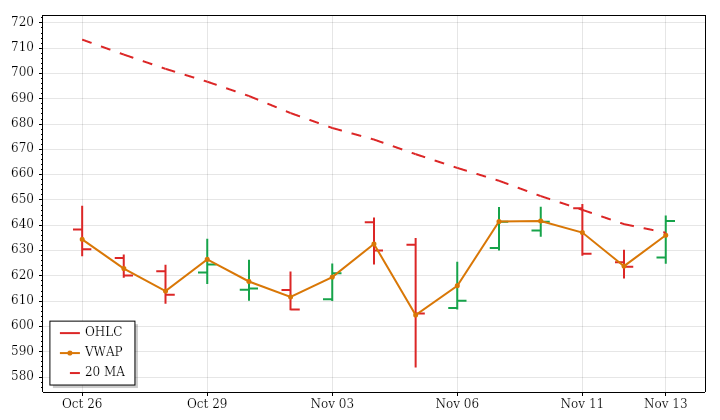
META · D:2026-11-13 NC% ▲ +2.90% OC% ▲ +2.31%
META – Meta Platforms Technicals Summary
META’s completed November 13 daily session advanced to 641.69, gaining 2.90% versus the prior close and 2.31% from the open. The opening gap remained unfilled, and a higher high and higher low led to a finish above the prior day’s high, near the session high and above VWAP. These features made the latest session clearly stronger than the surrounding mixed trend structure.
Price stood above a falling near-term benchmark, while the intermediate trend remained downward and the far-term trend upward. The rally therefore improved price position without producing agreement across horizons. Range was modestly above average, consistent with expanding ranges over the preceding 15 sessions, but volume was below average alongside a declining activity trend. Both technical trend states were upward; a next-session low below 608.475 would conditionally trigger a bearish PSAR reversal.
Meta News and Fundamentals
Meta is testing a prediction-market app with employees, The Wall Street Journal reported on November 13. The app remains under development and lets employees wager on questions or events using an internal currency called “cred,” rather than real money.
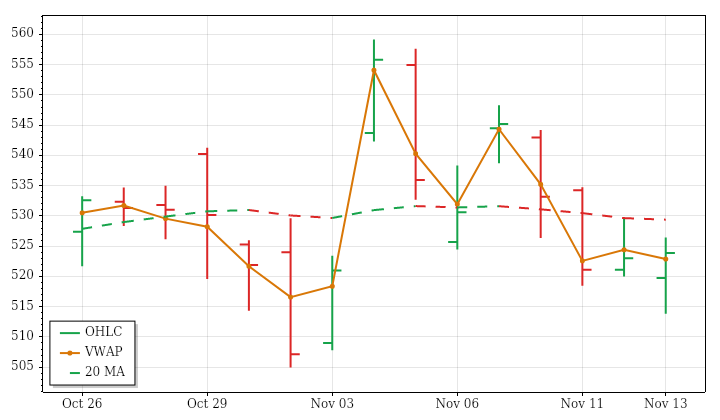
MSFT · D:2026-11-13 NC% ▲ +0.17% OC% ▲ +0.80%
MSFT – Microsoft Technicals Summary
MSFT’s completed November 13 daily session recovered from an opening gap down to close at 523.88, up 0.17% versus the prior close and 0.80% from the open. It filled the gap and finished near the session high, above VWAP and inside the previous day’s range. However, a lower high and lower low showed that the intraday recovery did not erase the weaker day-to-day structure.
Near- and intermediate-term conditions remained mixed because price was below rising benchmarks, while the far-term uptrend stayed intact. The preceding 15 sessions showed almost no net directional efficiency despite a slightly positive price trend. Latest range and volume were below average, unlike their expanding and increasing lookback trends. PSAR was bearish and ATR-median crossed downward; a next-session high above 559.15 would conditionally reverse PSAR upward.
Microsoft News and Fundamentals
A Microsoft 365 outage that began Thursday, November 12, disrupted Outlook, Teams, Copilot and other workplace applications across more than 70 countries. The disruption affected businesses, schools and government offices, leaving users unable to access email and chat services. On November 13, Microsoft reported encouraging recovery progress and said service was returning to normal, although restoration efforts continued into a second day.
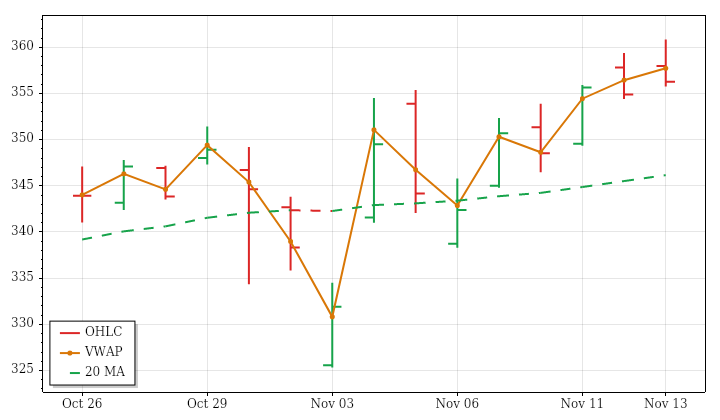
AAPL · D:2026-11-13 NC% ▲ +0.39% OC% ▼ -0.47%
AAPL – Apple Technicals Summary
AAPL’s completed November 13 daily session retained a gain of 0.39% versus the prior close, but fell 0.47% from the open to finish at 356.27. The opening gap remained unfilled, preserving the positive daily return despite intraday weakness. A higher high and higher low contrasted with a finish near the session low and below VWAP, showing that the stronger opening position did not translate into sustained buying.
Near-, intermediate- and far-term trends remained aligned upward, so the session’s retreat conflicted with rather than overturned the broader structure. The preceding 15 sessions showed modest upward progress with considerable back-and-forth movement. The latest range and volume were below average, unlike the lookback’s expanding ranges but consistent with declining volume. PSAR remained upward; a next-session low below 344.2482 would conditionally trigger a bearish reversal.
Apple News and Fundamentals
Apple reported record revenue and earnings per share for fiscal Q4 2026. Rising memory and research-and-development costs were identified as potential margin pressures ahead.
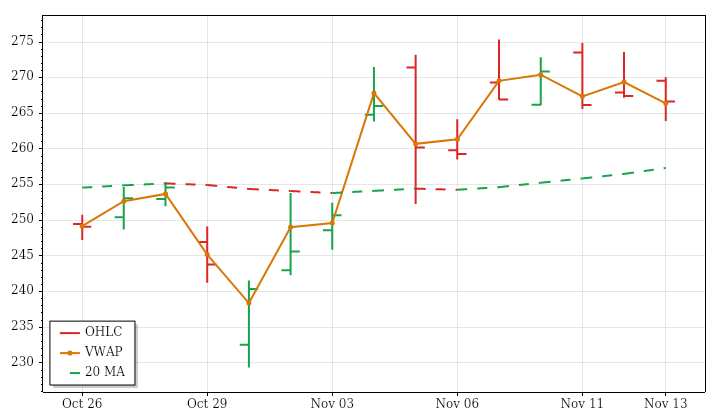
AMZN · D:2026-11-13 NC% ▼ -0.29% OC% ▼ -1.07%
AMZN – Amazon Technicals Summary
AMZN’s completed November 13 daily session reversed an opening gain, filled its gap and closed at 266.66. That represented a 0.29% loss versus the prior close and a larger 1.07% decline from the open. A lower high, lower low and finish beneath the prior day’s low gave the session a weaker structure, although the close remained slightly above VWAP.
The decline ran against aligned near-, intermediate- and far-term uptrends, with price still above rising benchmarks across all three horizons. The broader 15-session advance therefore remained distinct from the latest pullback. Both range and volume were below average, with volume only about 56% of normal, contrasting with expanding ranges and increasing activity over the lookback. PSAR still pointed upward; only a next-session low below 263.7921 would trigger its bearish reversal condition.
Amazon News and Fundamentals
Amazon plans to build World Product Graph, an initiative providing shoppers information about virtually every product available online, including items Amazon does not stock, Reuters reported on November 13, citing an internal document and unnamed sources. Amazon also launched a Ring drone camera for indoor home-security checks. AWS CEO Matt Garman said space-based data centers were unlikely to be practical for another decade or two, citing launch costs, heat management, radiation and server costs.
GOOGL · D:2026-11-13 NC% ▼ -0.98% OC% ▼ -2.38%
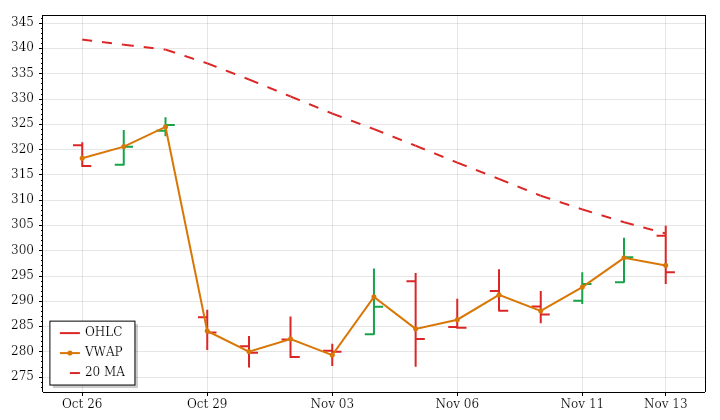
GOOGL – Alphabet Technicals Summary
GOOGL’s completed November 13 daily session surrendered an opening gap higher and closed at 295.77, down 0.98% versus the prior close and 2.38% from the open. An outside bar captured movement beyond both ends of the previous day’s range, yet the finish returned inside that range and below VWAP. This was the second consecutive large-range session, emphasizing substantial two-way movement rather than a smooth decline.
Price remained above its falling near-term benchmark, leaving that horizon mixed, while intermediate- and far-term downtrends stayed aligned. The latest weakness therefore fit the broader bearish structure despite the near-term positional offset. Range reached about 152% of average, consistent with lookback expansion, but below-average volume matched the declining activity trend. Upward PSAR conflicted with the bearish ATR-median state; a next-session low below 282.4969 would conditionally reverse PSAR downward.
TSLA · D:2026-11-13 NC% ▼ -1.82% OC% ▼ -2.85%
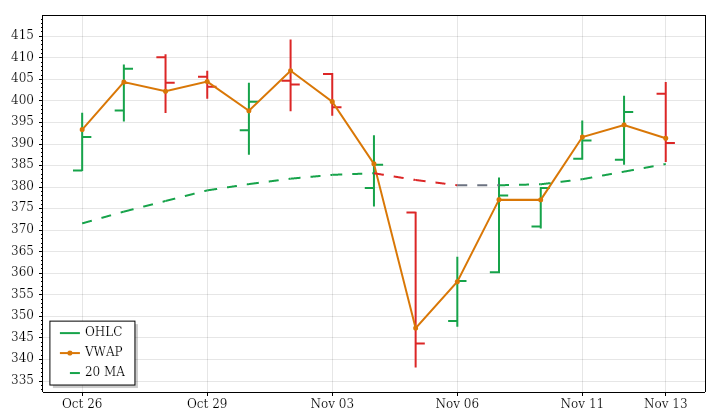
TSLA – Tesla Technicals Summary
TSLA’s completed November 13 daily session reversed an opening gap higher and closed at 390.22, down 1.82% versus the prior close and 2.85% from the open. Despite a higher high and higher low, the gap was filled and the finish fell below VWAP, inside the previous day’s range. The session therefore combined an initially stronger price position with a materially weaker intraday outcome.
Near- and far-term conditions were mixed because price remained above falling benchmarks, while the intermediate trend stayed upward. The latest decline did not establish agreement across those horizons. Range was about 122% of average, consistent with expanding ranges and a second consecutive large-range session; below-average volume matched the declining lookback trend. ATR-median crossed upward alongside bullish PSAR, conflicting with the daily loss. A next-session low below 347.6132 would conditionally reverse PSAR downward.
NVDA · D:2026-11-13 NC% ▼ -2.01% OC% ▼ -4.15%
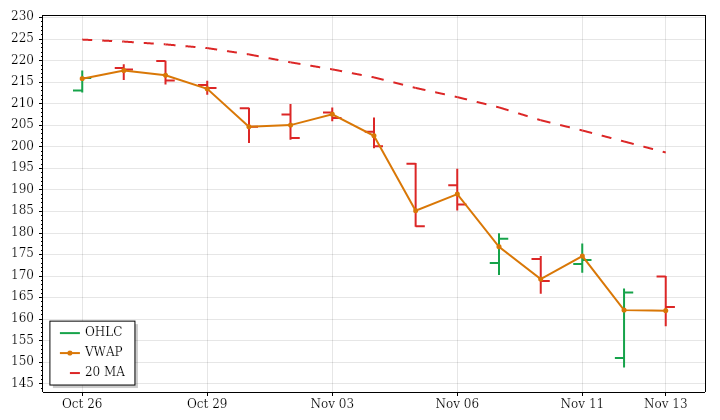
NVDA – Nvidia Technicals Summary
NVDA’s completed November 13 daily session reversed an opening gap higher and closed at 162.85, down 2.01% versus the prior close and 4.15% from the open. The gap was filled, but the session still recorded a higher high and higher low and finished inside the previous day’s range. Closing above VWAP offered a limited intraday counterpoint to the substantial open-to-close decline.
Near-, intermediate- and far-term downtrends were aligned, making the latest loss consistent with the broader structure. Range was about 150% of average and volume roughly 159%, matching the preceding 15 sessions’ expanding ranges and increasing activity. This was also the second consecutive large-range session, underscoring the breadth of recent movement. PSAR and ATR-median remained bearish; a next-session high above 174.9471 would conditionally trigger an upward PSAR reversal.
Nvidia News and Fundamentals
Jensen Huang resigned as Nvidia CEO on Thursday, November 12, following reports of extramarital affairs, including an alleged relationship with a suspected Chinese spy. CFO Colette Kress became interim CEO. Nvidia's board told CNBC on November 13 that it had not yet selected a search firm to identify a permanent successor. Experts said Huang's departure removed an influential advocate for chip sales to China, increasing investor concerns about further restrictions.
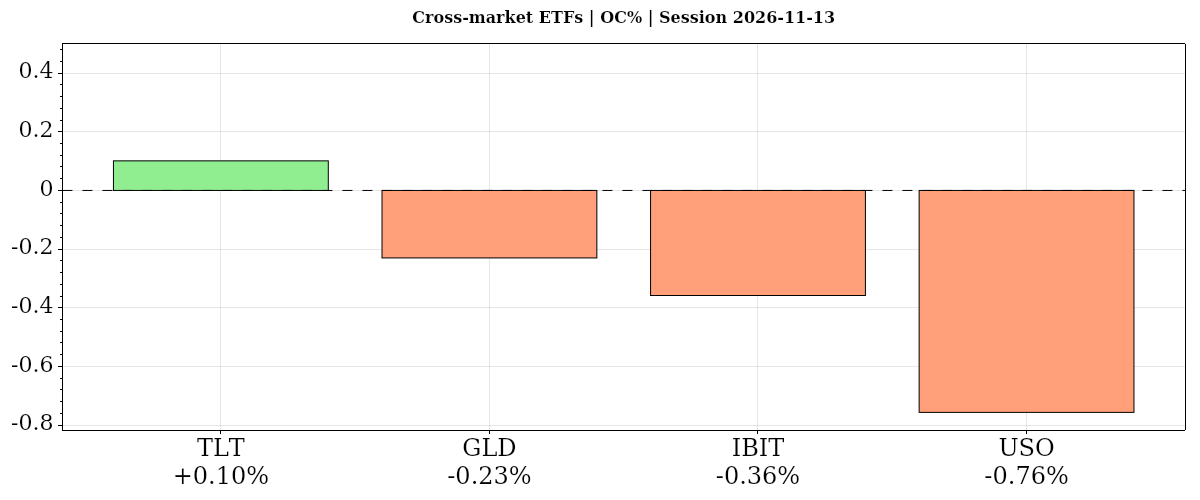
| Instrument | Bias | Date | DNC% | DOC% | O | H | L | C | VWAP | Vol |
|---|---|---|---|---|---|---|---|---|---|---|
| ▲ TLT | ▼ ▲ ▼ | 2026-11-13 | ▼ -0.43% | ▲ +0.10% | 79.30 | 79.64 | 79.11 | 79.38 | ▼ 79.41 | 30,830,681 |
| ▼ GLD | ▲ ▼ ▼ | 2026-11-13 | ▲ +0.16% | ▼ -0.23% | 356.27 | 357.32 | 354.41 | 355.45 | ▼ 355.63 | 11,900,050 |
| ▼ IBIT | ▼ ▼ ▲ | 2026-11-13 | ▼ -3.52% | ▼ -0.36% | 39.08 | 39.27 | 38.49 | 38.94 | ▲ 38.91 | 52,237,550 |
| ▼ USO | ▼ ▼ ▼ | 2026-11-13 | ▼ -0.34% | ▼ -0.76% | 146.69 | 147.02 | 144.53 | 145.58 | ▼ 145.58 | 1,934,596 |
| AVG/Sum | — | — | -1.03% | -0.31% | — | — | — | — | — | 96,902,877 |
Cross-Market ETFs
Negative confluence: average DNC% -1.03% versus the prior close, DOC% -0.31% from the open. Bonds alone edged up from the open but remained down versus the prior close; oil lagged intraday, while bitcoin suffered the largest prior-close loss. Gold gained versus the prior close, diverging from broad equities despite persistent moving-average downtrends.
TLT · D:2026-11-13 NC% ▼ -0.43% OC% ▲ +0.10%
TLT – Long-Term Treasury Bonds Technicals Summary
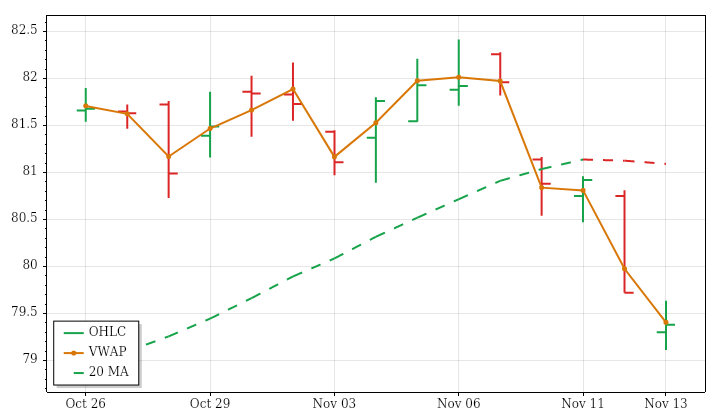
TLT’s completed November 13 daily session closed at 79.38, down 0.43% versus the prior close despite gaining 0.10% from the open. The opening gap down remained unfilled, explaining why the small intraday recovery still left a negative daily return. A lower high, lower low and finish beneath the previous day’s low reinforced that weakness, while the close also remained slightly below VWAP.
Near- and intermediate-term structures were mixed because price was below rising benchmarks, whereas the far-term trend remained downward. The latest session thus agreed with the longer-term direction without confirming uniformly falling trends at every horizon. Range and volume were both below average, contrasting with expanding ranges and increasing volume over the preceding 15 sessions. ATR-median turned bearish alongside downward PSAR; a next-session high above 81.6159 would conditionally reverse PSAR upward.
GLD · D:2026-11-13 NC% ▲ +0.16% OC% ▼ -0.23%
GLD – Gold Technicals Summary
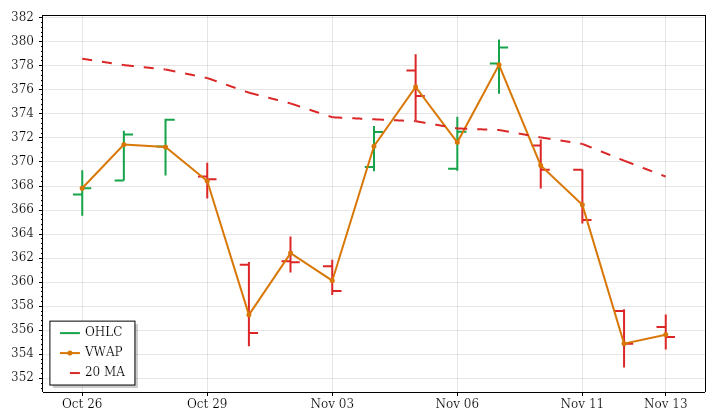
GLD’s completed November 13 daily session edged up 0.16% versus the prior close to 355.45, but lost 0.23% from the open after filling its opening gap. Trading stayed inside the prior day’s range, and the close was slightly below VWAP. This was a contained daily gain rather than a clear improvement in the underlying price structure, with the finish still close to the supplied 52-week low.
Near-, intermediate- and far-term trends remained aligned downward, placing the small prior-close advance against the prevailing direction. The latest range was only about two-thirds of average while volume reached roughly 129% of average: activity increased without a correspondingly broad price move. The preceding 15 sessions also showed increasing volume and expanding ranges. Both technical trend states were newly bearish; a next-session high above 378.8165 would conditionally reverse PSAR upward.
Gold News and Fundamentals
Gold failed to sustain prices above $4,000 an ounce and surrendered the previous week's gains amid concerns about persistent inflation and a potential Federal Reserve rate increase in December. An early November 13 rebound followed Thursday's slide to a 13-month low, but rising real yields continued to pressure prices. Goldman Sachs cut its year-end gold forecast from $4,650 to $4,150 an ounce and its year-end 2027 forecast from $5,400 to $4,800, citing the Fed's hawkish shift and changed investor positioning.
IBIT · D:2026-11-13 NC% ▼ -3.52% OC% ▼ -0.36%
IBIT – Bitcoin Technicals Summary
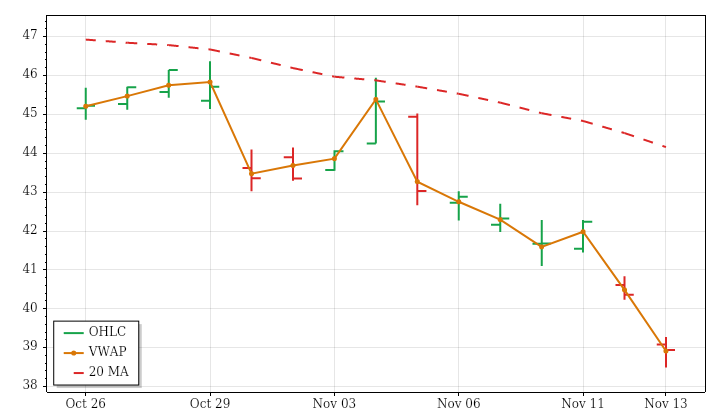
IBIT’s completed November 13 daily session closed at 38.94, down 3.52% versus the prior close but only 0.36% from the open. Most of the daily loss therefore came through the opening gap down, which remained unfilled. A lower high, lower low and close below the prior day’s low reinforced the weak structure, even though the finish was marginally above session VWAP.
Near- and intermediate-term downtrends agreed with the latest decline. The far-term picture was mixed because price remained below a still-rising benchmark, rather than confirming a fully aligned longer-term decline. The latest trading range was below average despite expanding ranges over the preceding 15 sessions, while above-average volume matched the lookback’s increasing activity. Both technical trend states remained bearish. A next-session high above 41.9175 would conditionally trigger an upward PSAR reversal.
USO · D:2026-11-13 NC% ▼ -0.34% OC% ▼ -0.76%
USO – Oil Technicals Summary
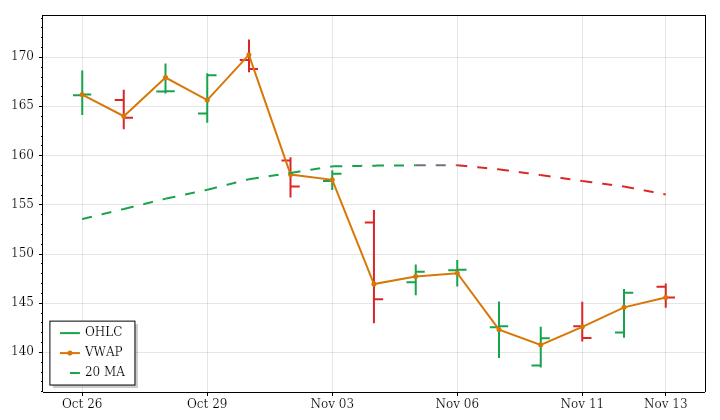
USO’s completed November 13 daily session closed at 145.58, down 0.34% versus the prior close and 0.76% from the open after filling its opening gap higher. The session formed a higher high and higher low, but finished inside the previous day’s range and almost exactly at VWAP, fractionally below it. This combined improved daily extremes with an unsuccessful attempt to retain the opening gain.
The near-term structure was mixed, with price barely above a falling benchmark. Intermediate conditions were also mixed because price was below a rising benchmark, while the far-term uptrend remained intact. The latest range was only about 56% of average and volume roughly 35%, contrasting with lookback range expansion but matching declining activity. PSAR and ATR-median remained bearish; a next-session high above 148.727 would conditionally trigger an upward PSAR reversal.
Oil News and Fundamentals
The International Energy Agency said on November 13 that the global oil market was expected to return to surplus in the fourth quarter of 2026, for the first time since the Iran war began, as Gulf exports recovered. Oil prices nevertheless rose as traders weighed continued disruptions to Middle Eastern shipments against prospects for U.S.-Iran diplomacy and rising U.S. crude and fuel inventories. Hartree Partners strategist Ed Morse said oil could return to $50 a barrel, depending on OPEC and the war's outcome.
Glossary: Instrument — ticker symbol; hover for the instrument or company name; Date — session date. DNC% — prior-session close to this session’s close; DOC% — daily session open-to-close percentage change. O — open; H — high; L — low; C — close, all for the table’s daily or weekly session; VWAP — volume-weighted average price; its arrow shows whether the close is above or below VWAP. Vol — period trading volume.
Bias — three directional readings, in order: DNC%, DOC%, then VWAP. ▲ positive/above; ▼ negative/below; — neutral or unavailable. Matching arrows show alignment; opposing arrows show mixed conditions. AVG/Sum — simple average of percentage changes and sum of reported volumes.
Futures Session Fib Grid Analysis – Snapshot
Session Fib Grids normalise market positioning as percentages, making direction and alignment comparable across different asset types.
Latest available snapshot for each instrument; Time(CT) shows the individual update date and time.
| Instrument | Bias | Time(CT) | YSFG | MSFG | WSFG | RSFG | SFG | TSI |
|---|---|---|---|---|---|---|---|---|
| ▼ ES | ▲ ▼ ▲ ▼ ▼ ▼ | 2026-11-13 15:59:59 | ▲ +39 | ▼ -21 | ▲ +72 | ▼ -59 | ▼ -59 | ▼ -33 |
| ▼ NQ | ▲ ▼ ▲ ▼ ▼ ▼ | 2026-11-13 15:59:59 | ▲ +29 | ▼ -26 | ▲ +57 | ▼ -57 | ▼ -57 | ▼ -36 |
| ▼ YM | ▲ ▲ ▲ ▼ ▼ ▲ | 2026-11-13 15:59:55 | ▲ +32 | ▲ +15 | ▲ +56 | ▼ -25 | ▼ -25 | ▲ +45 |
| ▼ EMD | ▲ ▲ ▲ ▼ ▼ ▲ | 2026-11-13 15:59:49 | ▲ +35 | ▲ +7 | ▲ +59 | ▼ -26 | ▼ -26 | ▲ +21 |
| ▼ RTY | ▲ ▼ ▲ ▼ ▼ ▼ | 2026-11-13 15:59:58 | ▲ +32 | ▼ -25 | ▲ +35 | ▼ -32 | ▼ -32 | ▼ -11 |
| ▲ FDAX | ▲ ▲ ▲ ▲ ▲ ▲ | 2026-11-13 15:04:01 | ▲ +52 | ▲ +78 | ▲ +129 | ▲ +20 | ▲ +7 | ▲ +54 |
| ▼ NKD | ▲ ▼ ▲ ▼ ▼ ▲ | 2026-11-13 15:59:34 | ▲ +124 | ▼ -20 | ▲ +59 | ▼ -17 | ▼ -19 | ▲ +21 |
| Instrument | Bias | Time(CT) | YSFG | MSFG | WSFG | RSFG | SFG | TSI |
|---|---|---|---|---|---|---|---|---|
| ▼ BTC | ▼ ▼ ▼ ▼ ▼ ▼ | 2026-11-13 18:13:29 | ▼ -80 | ▼ -66 | ▼ -140 | ▼ -34 | ▼ -108 | ▼ -57 |
| ▲ GC | ▼ ▼ ▼ ▲ ▼ ▲ | 2026-11-13 15:59:57 | ▼ -169 | ▼ -1 | ▼ -89 | ▲ +1 | ▼ -4 | ▲ +39 |
| ▼ CL | ▲ ▼ ▼ ▼ ▼ ▲ | 2026-11-13 15:59:59 | ▲ +153 | ▼ -77 | ▼ -19 | ▼ -4 | ▼ -11 | ▲ +20 |
| ▼ 6E | ▼ ▼ ▼ ▼ ▼ ▼ | 2026-11-13 15:59:45 | ▼ -71 | ▼ -56 | ▼ -102 | ▼ -42 | ▼ -38 | ▼ -104 |
| ▲ ZB | ▼ ▼ ▼ ▲ ▲ ▲ | 2026-11-13 15:59:55 | ▼ -42 | ▼ -44 | ▼ -115 | ▲ +8 | ▲ +14 | ▲ +29 |
Glossary: YSFG — yearly; MSFG — monthly; WSFG — weekly; RSFG — regular trading hours (RTH); SFG — the current session, including pre-market or other sessions. TSI indicates trend strength and power.
Bias shows trend alignment across these six readings. The arrows follow the column order: YSFG, MSFG, WSFG, RSFG, SFG and TSI. Matching arrows show alignment; opposing arrows show mixed conditions.
Futures Higher Time Frame Analysis
Summary of the current state of US Indices Futures based on higher time-frame (HTF) technical analysis as of: 2026-11-13 16:00 -05:00 CT.
US Indices Futures
- ES YSFG bullish, MSFG down, WSFG up, falling weekly benchmarks, daily lower pivots, resistance 7648–7705, support 7322.25–7353.
- NQ YSFG bullish, MSFG down, WSFG up, declining short weekly benchmarks, daily lower pivots, resistance 28697–28789, support 26366.50.
- YM YSFG bullish, MSFG/WSFG up, rising long benchmarks, opposing daily/weekly pivot trends, resistance 52850–52888, reversal threshold 53377, support 50859–50891.
- EMD YSFG bullish, MSFG/WSFG up, mixed benchmarks, daily lower highs, resistance 3709 and 3750.3–3773.1, support 3560.7.
- RTY YSFG bullish, MSFG down, WSFG up, declining daily benchmarks, medium-term lower highs, resistance 2862.2–2888.7, reversal threshold 2754.6, support 2714.2.
- FDAX YSFG/MSFG/WSFG bullish, above all rising benchmarks, daily higher pivots, resistance 27084, reversal thresholds 26140/25512, daily/weekly support 25695/24925.
Overall State
- Short-Term: Neutral
- Intermediate-Term: Bearish
- Long-Term: Bullish
Conclusion
Upward WSFG readings accompany rebounds across US indices, but daily recoveries remain divergent from weaker weekly near-term structures. MSFG weakness in ES, NQ and RTY aligns with unresolved intermediate corrections. Bullish yearly positioning and rising longer weekly benchmarks preserve the broader bullish structure, although NQ, EMD and RTY retain bearish daily far-term ratings. ES resistance at 7648–7705 and NQ resistance at 28697–28789 frame their recovery structures. Recent ES long signals contrast with newer EMD and RTY short signals. RTY remains comparatively weaker; YM retains bullish weekly intermediate structure. FDAX shows the strongest cross-timeframe alignment, despite conflicting November 6 short signals, with 27084 defining resistance.
Note: Intra-day counter-trend pullbacks or retracements may occur, HTF is context for informational usage and market structure. Glossary: Session Fib Grids periods of YSFG:’Yearly’, MSFG:’Monthly’, WSFG:’Weekly’
For full details visit: AlphaWebTrader Technicals
SPY Daily View
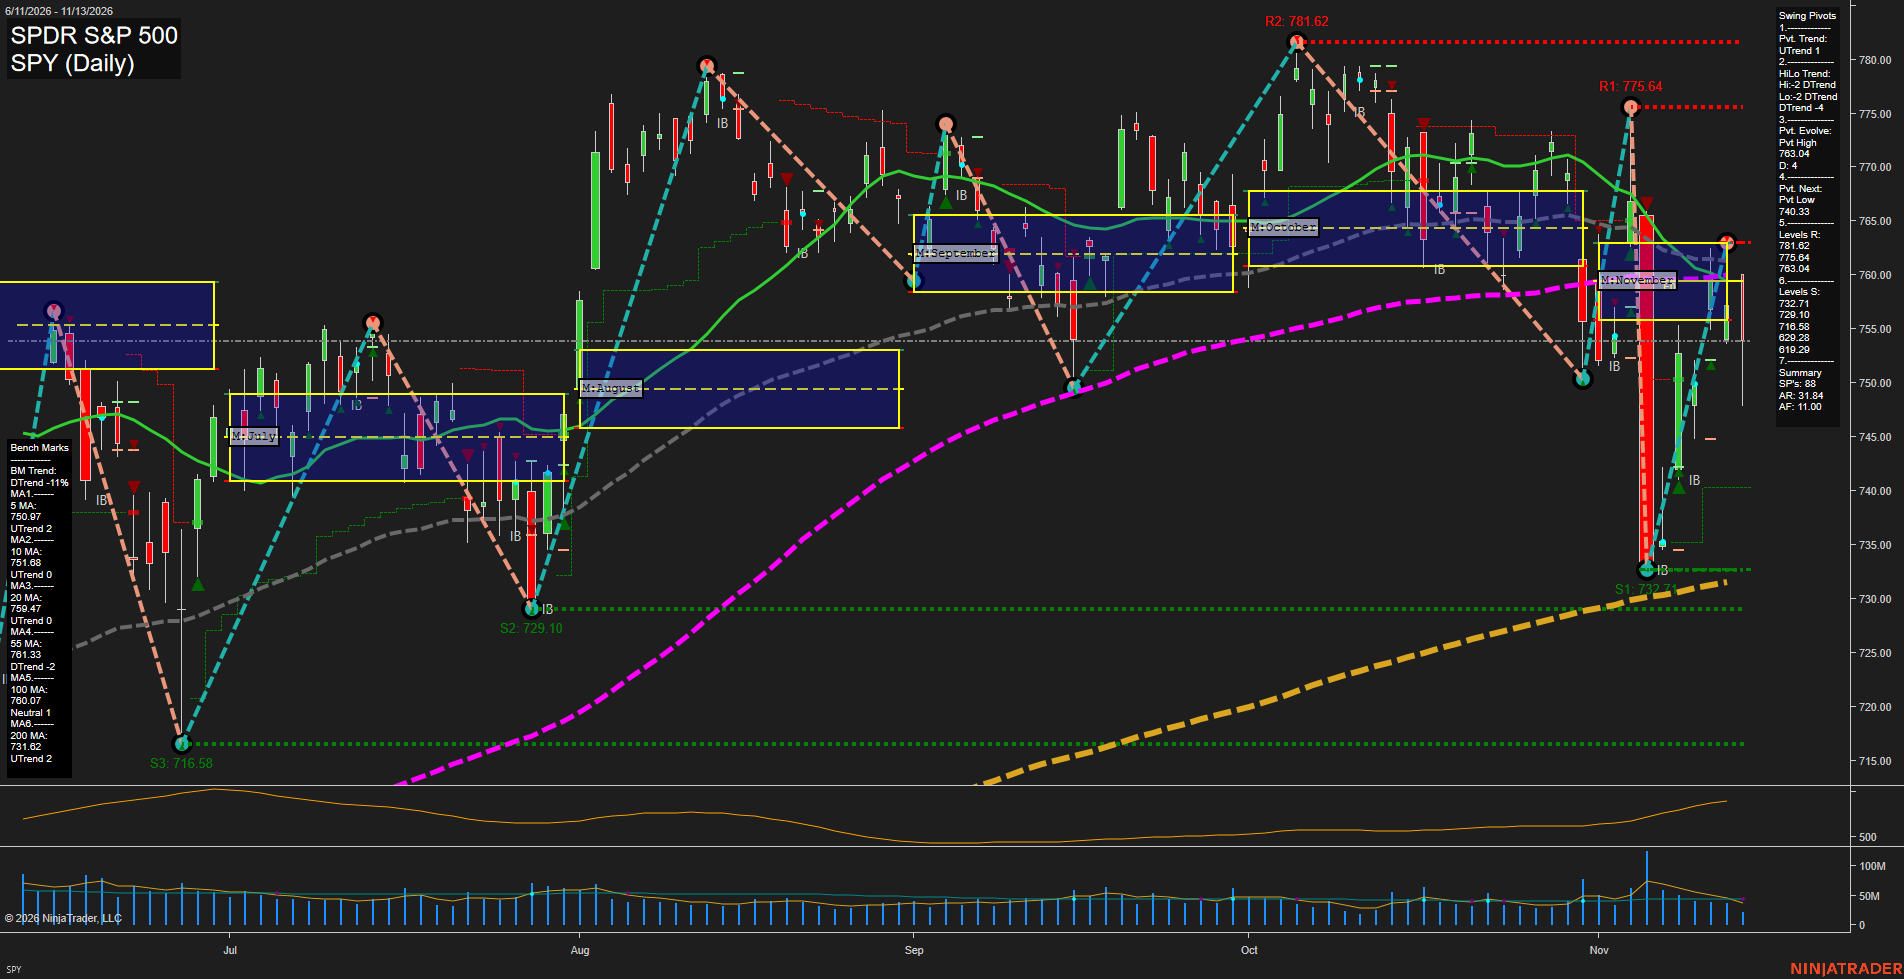
Overall Rating
- Near-Term: Bullish
- Medium-Term: Bearish
- Far-Term: Neutral.
Key Insights Summary
From a futures swing trader’s perspective, SPY shows a near-term recovery within a broader corrective structure, rather than a confirmed trend continuation. The rebound from 732.71 produced an evolving pivot high at 763.04, but the latest large-range reversal returned price below November’s neutral zone and the clustered 20-, 55- and 100-day benchmarks near 759–761. Short-term averages and the current pivot trend remain positive, while lower medium-term pivot highs and lows retain a bearish backdrop. Rising ATR and November’s sharp two-way swings characterize an expanded-volatility, whipsaw-prone regime. The 732.71 support sits close to the rising 200-day average at 731.62, with 729.10 beneath it. These are SPY reference prices, not executable futures levels. Weekly and yearly grids, named strategy signals, and news catalysts are not visible; their direction cannot be independently established from this image.
View charts on: AlphaWebTrader HTF Charts
ES Daily View
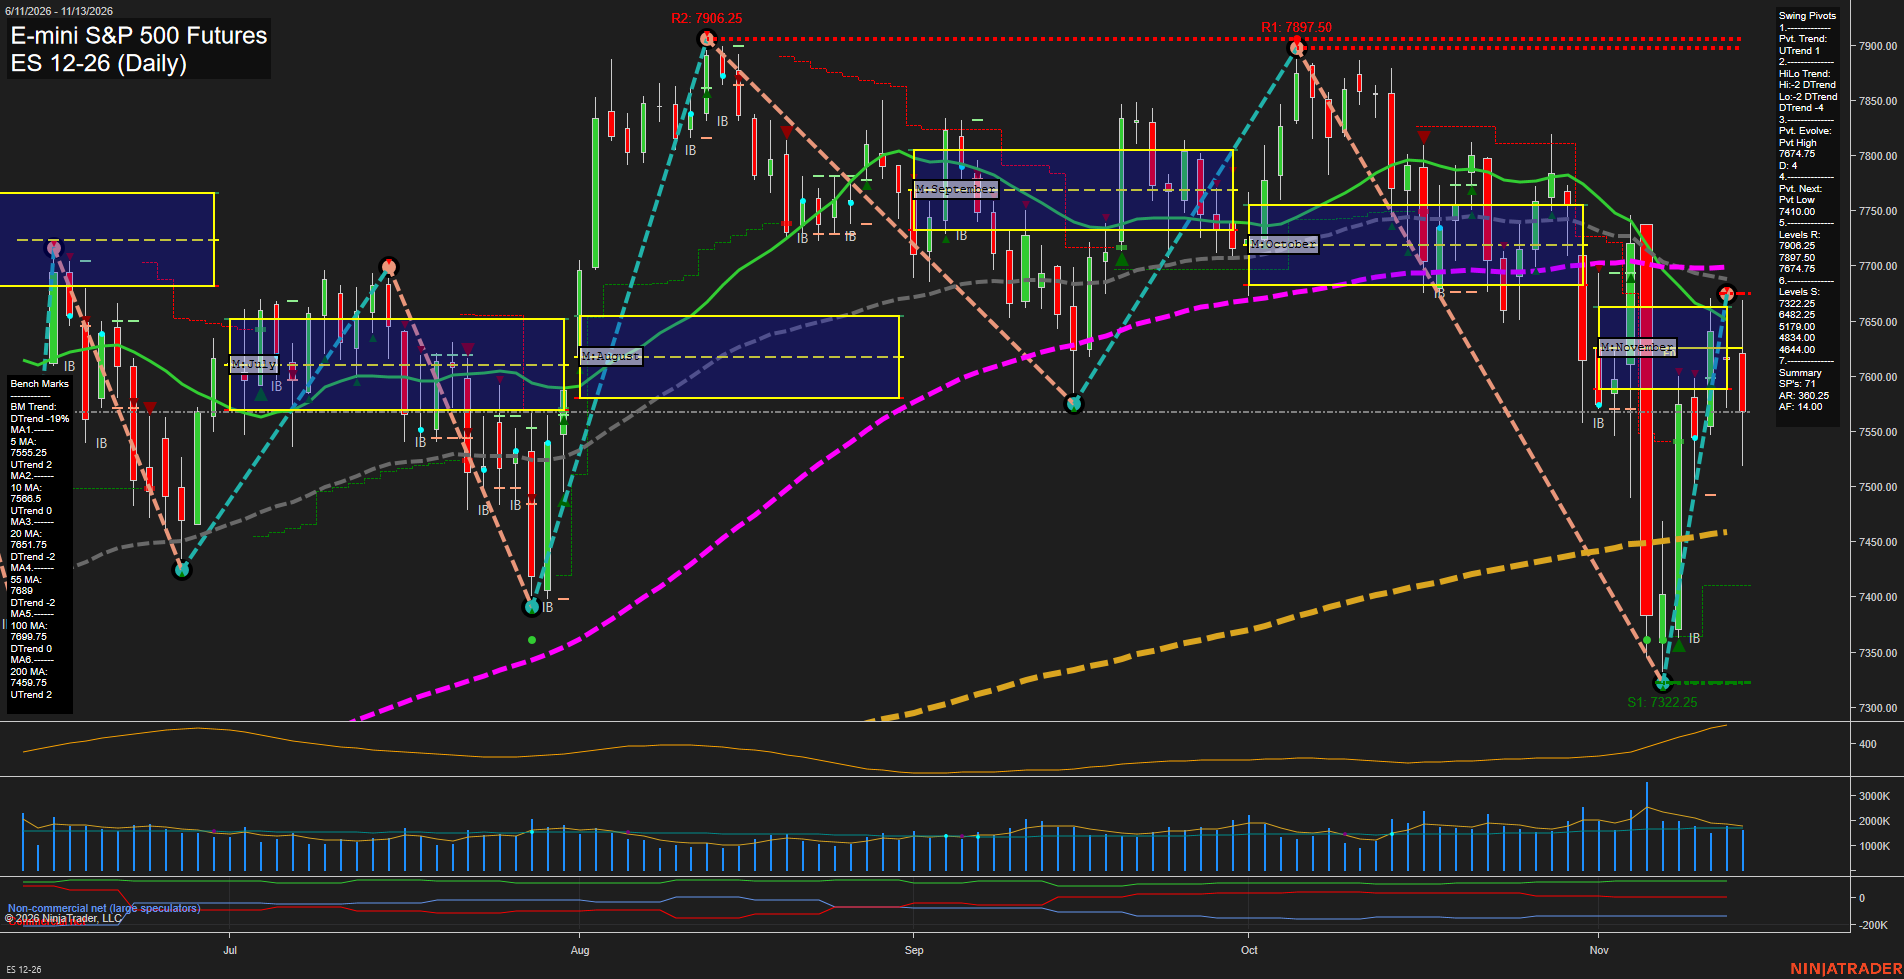
Overall Rating
- Near-Term: Bullish
- Medium-Term: Bearish
- Far-Term: Bullish.
Key Insights Summary
ES shows a near-term recovery within a still-bearish medium-term swing structure. The rebound from 7322.25 to 7674.75 formed a sharp V-shaped recovery, but the latest large red candle signals rejection and renewed selling pressure. Price has returned to the rising 5- and 10-day benchmarks while remaining below the declining 20-, 55- and 100-day benchmarks. Near-term bullish readings retain a majority through the weekly grid, pivot trend, short-term averages and latest TR120 long signal, although the earlier weekly short signal remains a conflicting input. Medium-term lower highs and lower lows, a negative monthly grid and falling benchmarks outweigh the recent monthly long signal. Resistance clusters around 7651.75–7699.75, below the major 7897.50–7906.25 swing highs. The 7410.00 pivot-reversal threshold and 7322.25 swing low define the downside structure. The rising 200-day average and positive yearly grid support a bullish far-term majority, tempered by the declining 100-day average. Elevated volatility makes this a fast, two-way recovery rather than an established medium-term trend reversal; the chart alone does not establish a news or seasonal catalyst.
View charts on: AlphaWebTrader HTF Charts
QQQ Daily View
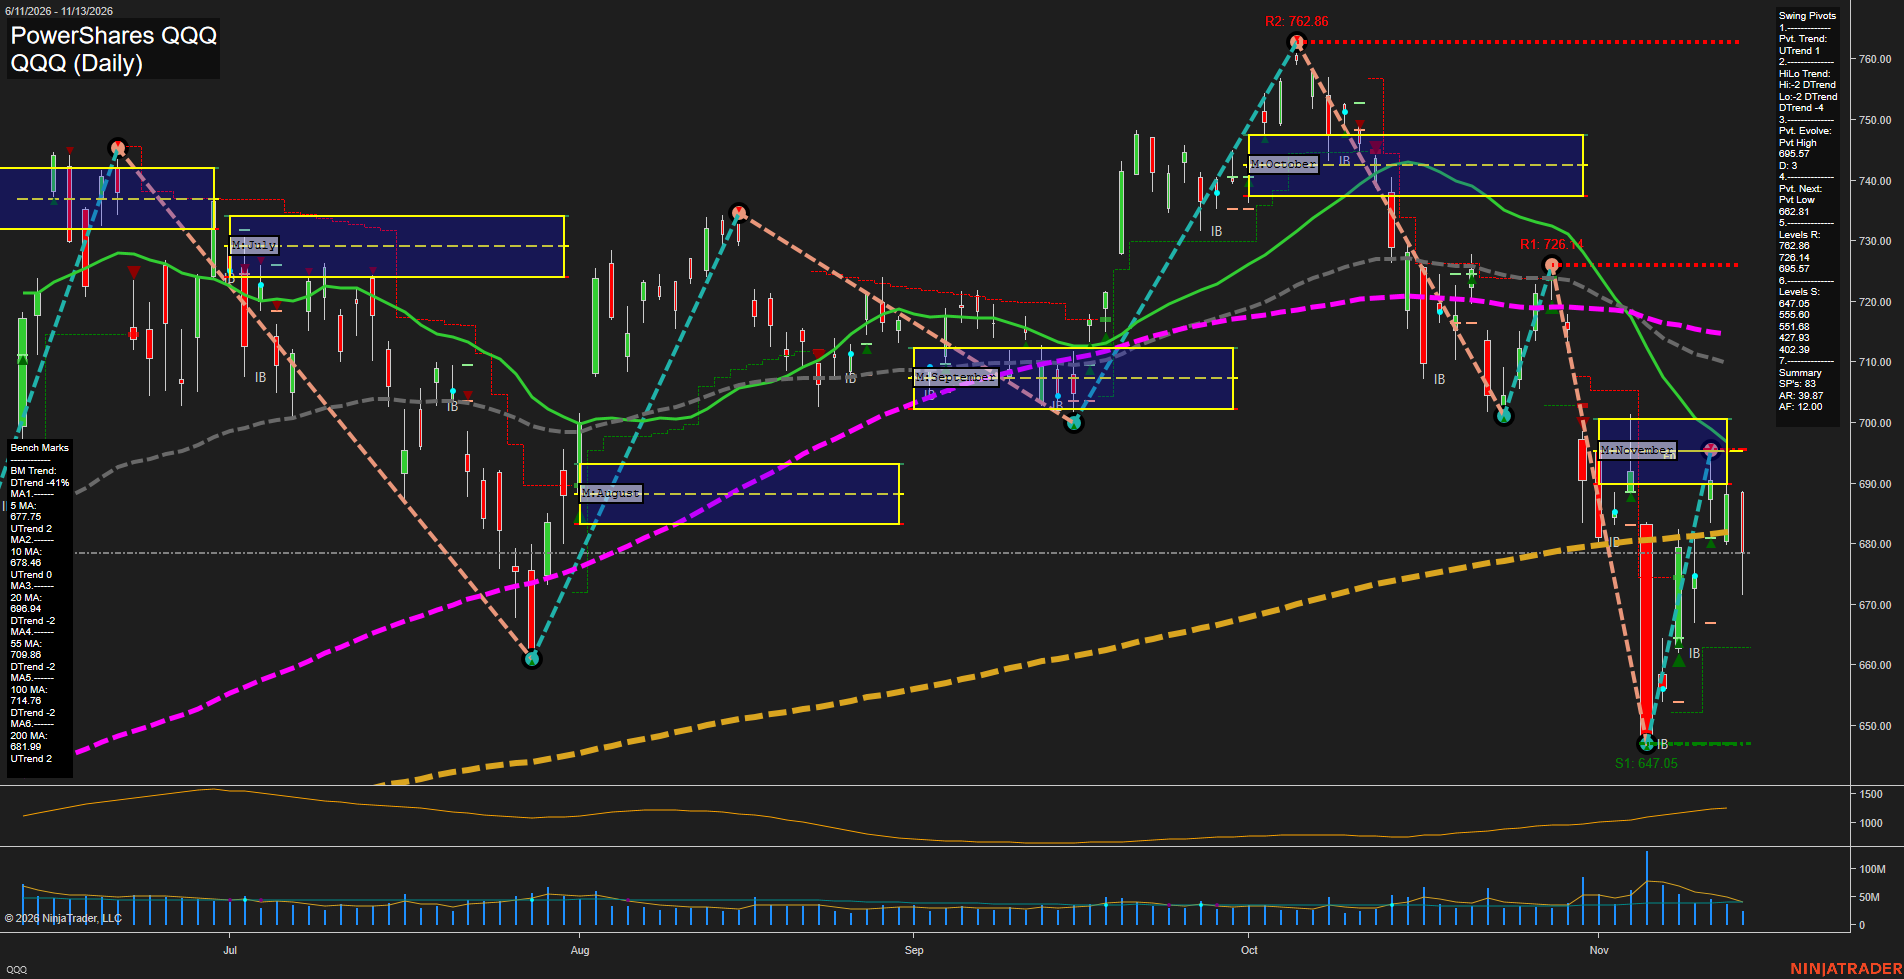
Overall Rating
- Near-Term: Bullish
- Medium-Term: Bearish
- Far-Term: Neutral.
Key Insights Summary
From a futures swing trader’s perspective, QQQ shows a near-term recovery within a broader corrective structure, rather than a confirmed sustained reversal. The rebound from 647.05 established an evolving pivot high at 695.57, but the latest large bearish candle returned price toward the 5-day and 10-day averages and below the rising 200-day benchmark. The near-term bullish rating reflects the pivot trend and rising short averages, although immediate price momentum has weakened. Falling 20-day, 55-day and 100-day averages, together with the medium-term lower-high/lower-low structure, retain a bearish intermediate backdrop. November’s visible monthly neutral zone is approximately 690–701, with its midpoint near 695.57; price is below that zone despite the neutral grid placeholders above. The rebound therefore resembles a countertrend recovery followed by rejection around monthly equilibrium. The next opposite-pivot threshold is 662.81, distinct from established support at 647.05. QQQ provides Nasdaq equity context, not directly transferable futures price levels. Weekly and yearly grid readings, named trade-signal outputs, news catalysts and seasonal confirmation are not available in this image.
View charts on: AlphaWebTrader HTF Charts
NQ Daily View
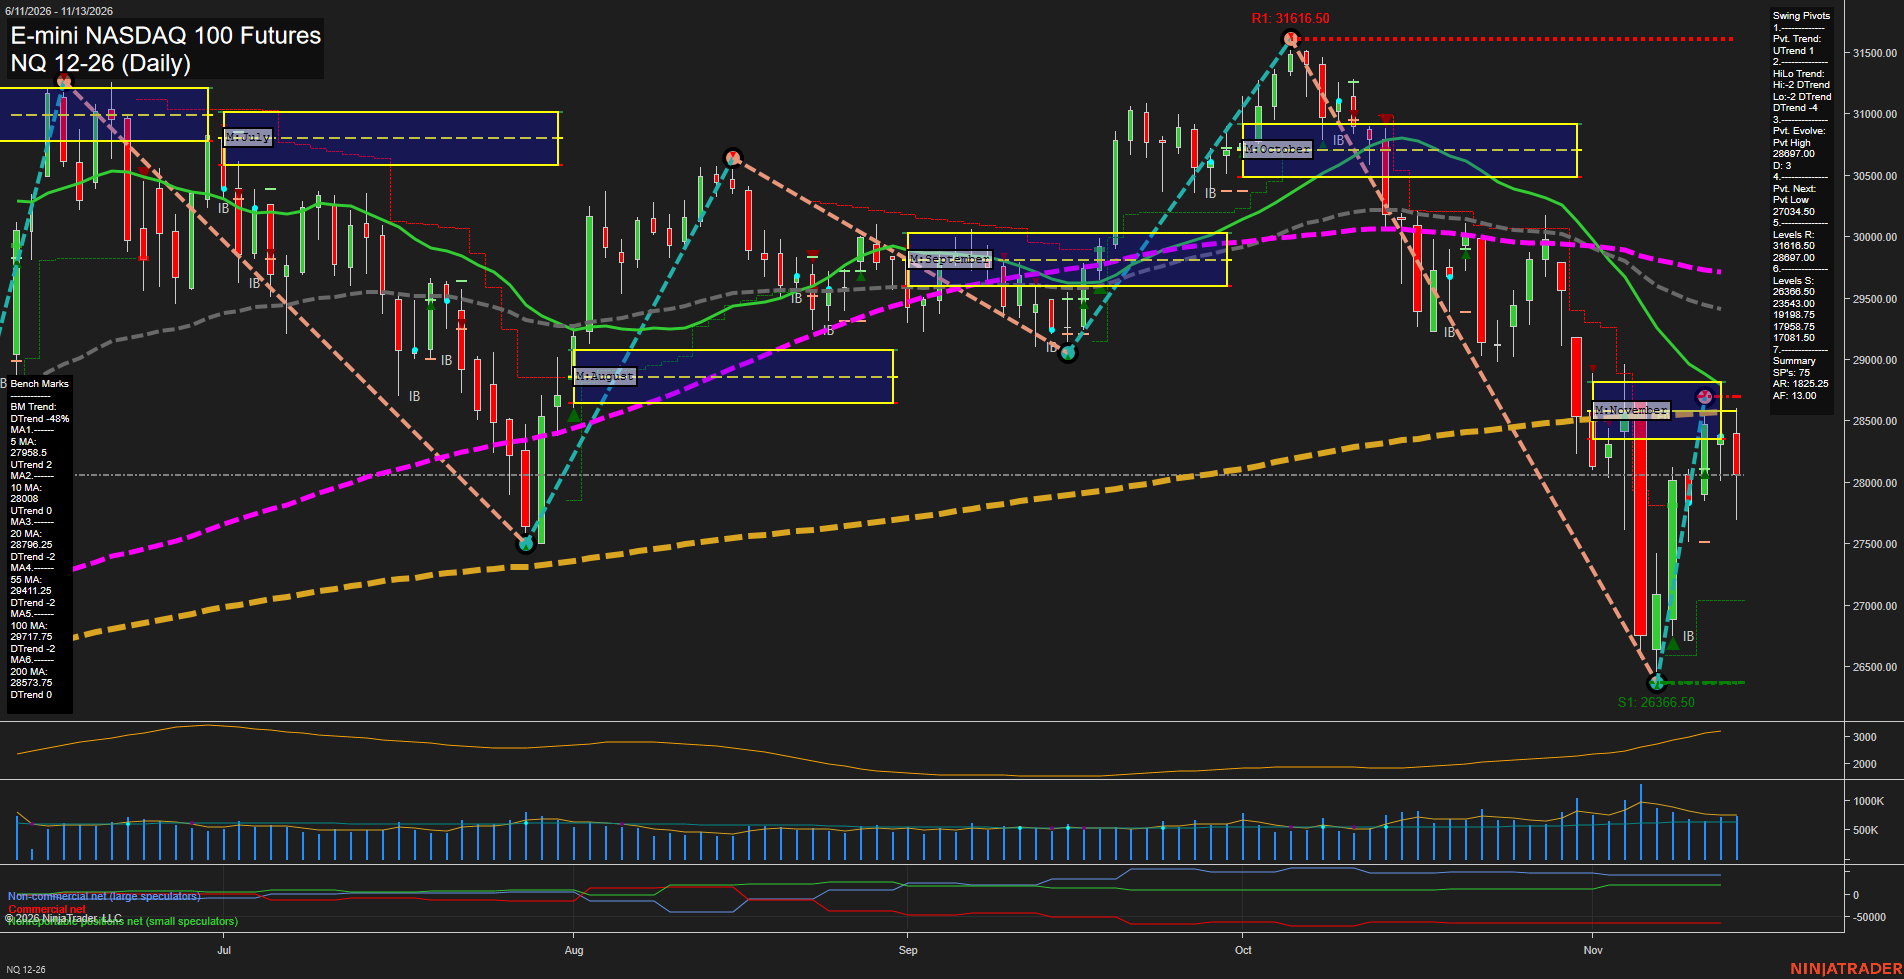
Overall Rating
- Near-Term: Bullish
- Medium-Term: Bearish
- Far-Term: Bearish.
Key Insights Summary
The swing-trading picture is a sharp countertrend recovery within a broader corrective structure. The rebound from 26366.50 to 28697.00 supports the near-term upward pivot trend, rising 5- and 10-day benchmarks, and bullish weekly grid. However, the latest large red candle shows renewed selling after the rebound reached the November NTZ and the 200-day benchmark area. Price remains below the monthly NTZ and all four longer benchmarks, while medium-term pivot highs and lows remain in a downtrend. This leaves the recovery technically distinct from a confirmed broader trend reversal. The 28697.00 pivot marks nearby resistance, 27034.50 is the next pivot-reversal threshold, and 26366.50 remains established swing support. Elevated ATR and wide daily ranges characterize a volatile rebound-and-retracement environment. The positive yearly grid contrasts with weakening longer benchmarks, explaining the mixed horizon signals; the chart alone does not establish a news-driven or seasonal explanation.
View charts on: AlphaWebTrader HTF Charts
USO Daily View
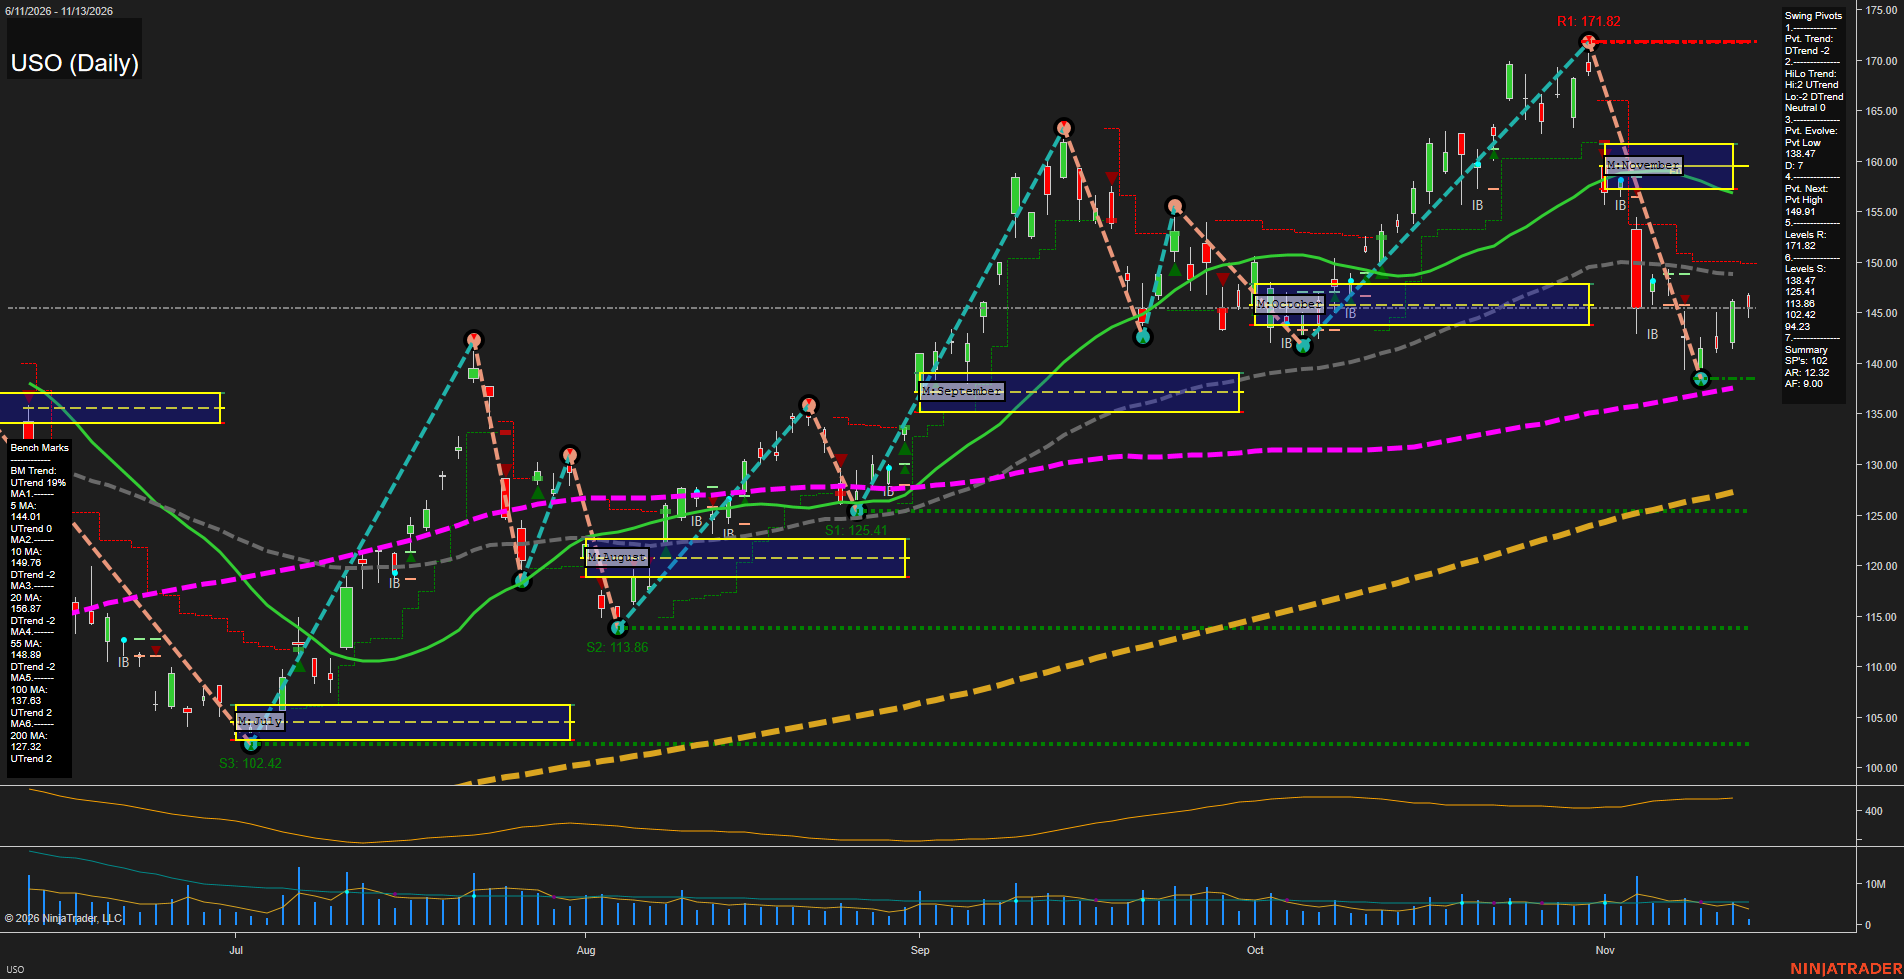
Overall Rating
- Near-Term: Bearish
- Medium-Term: Bearish
- Far-Term: Bullish.
Key Insights Summary
From a futures swing-trading perspective, USO shows a countertrend rebound within a sharp near-term downswing. The decline from 171.82 to 138.47 interrupted the preceding rally, while the latest recovery has lifted price above its 5-day average without recovering the declining 10-, 20-, or 55-day benchmarks. The 148.89–149.91 area combines overhead benchmark resistance with the next pivot-reversal threshold. The November monthly grid lies well above price, approximately 157–162, indicating a bearish price location despite the neutral grid fields above. Medium-term pivot structure is mixed, with rising highs but falling lows. Longer-term structure remains constructive because price holds above rising 100- and 200-day averages; 138.47 support sits near the 100-day benchmark. Weekly/yearly grids and named signal-system readings are not displayed, and no news or seasonal catalyst can be verified from this chart. USO is an oil-futures-linked fund, so these price levels describe the fund rather than a specific crude-oil futures contract.
View charts on: AlphaWebTrader HTF Charts
CL Daily View
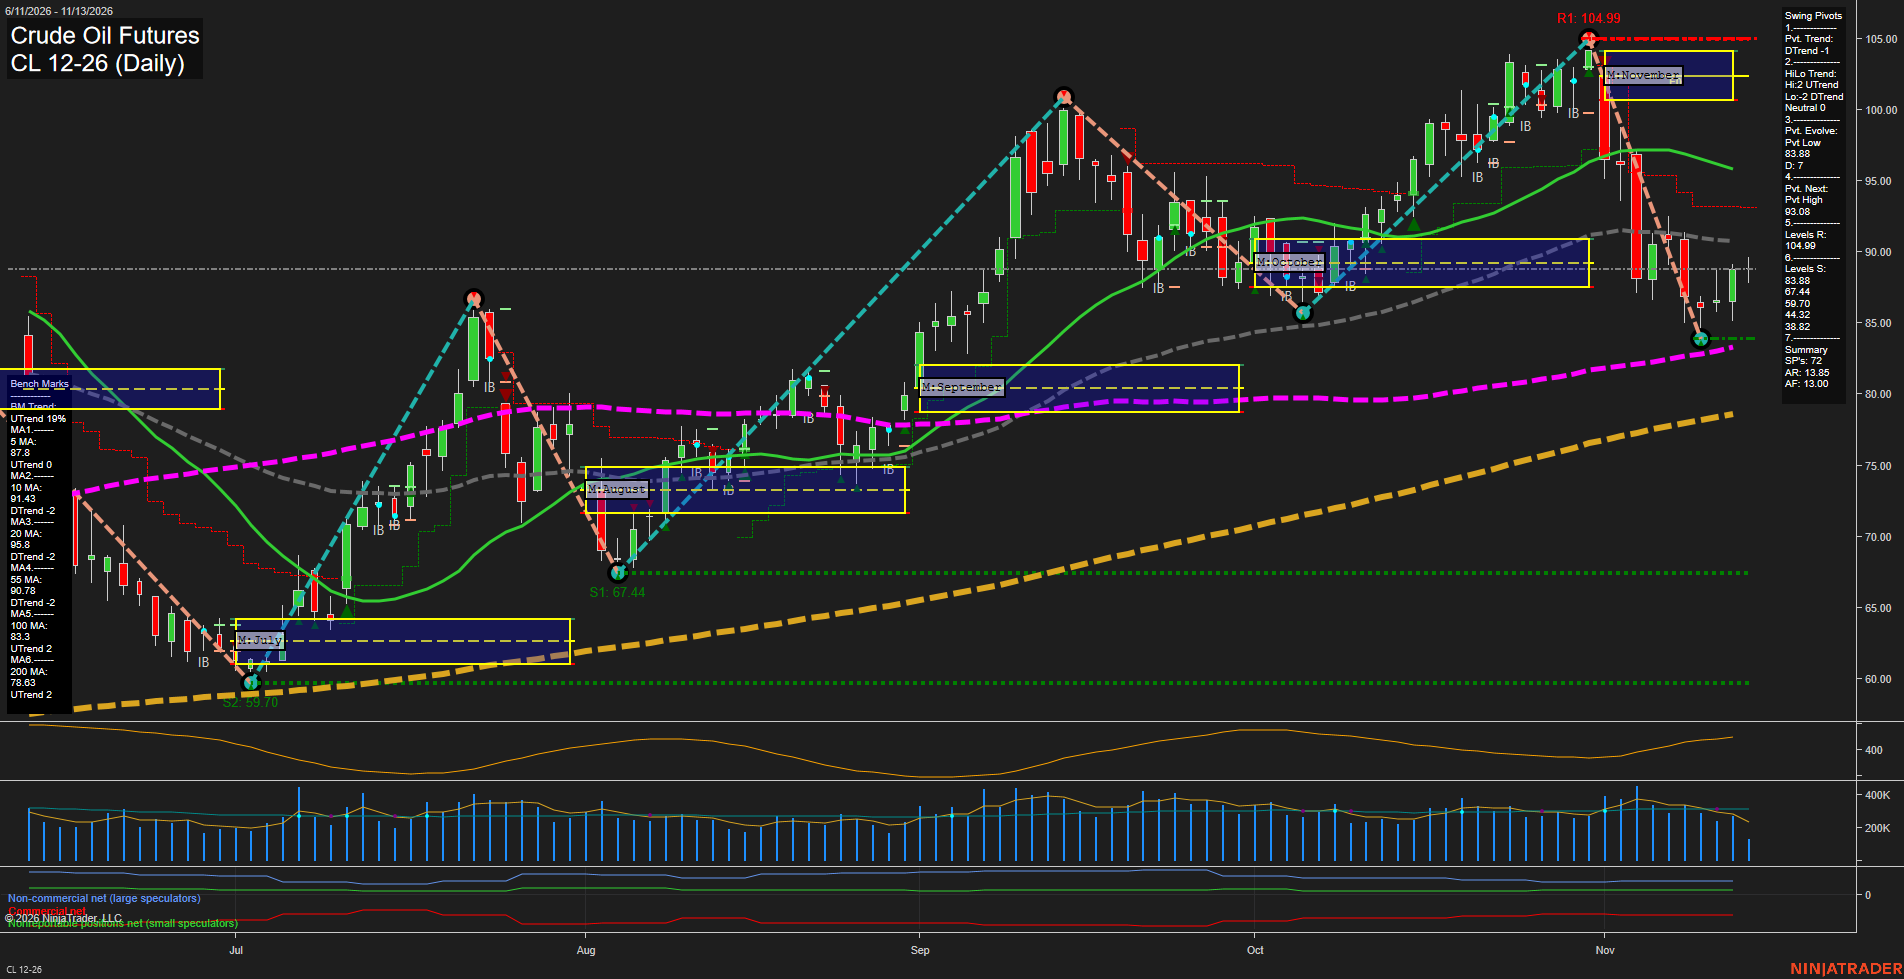
Overall Rating
- Near-Term: Bearish
- Medium-Term: Bearish
- Far-Term: Bullish.
Key Insights Summary
The swing-trading picture is a near-term recovery within a sharp correction of the broader uptrend. November’s decline from 104.99 to 83.88 disrupted the preceding rally, while the rebound toward 88.90 has recovered the rising five-day benchmark but remains below the declining 10-, 20- and 55-day benchmarks. Weekly and monthly grid readings reinforce bearish near- and medium-term conditions. The pivot summary remains in DTrend, with mixed high/low structure rather than a confirmed medium-term uptrend; 93.08 is the stated opposite-pivot reversal threshold. Support at 83.88 sits close to the rising 100-day benchmark at 83.30, while the rising 200-day benchmark and positive yearly grid preserve the bullish far-term backdrop. The latest long signal contrasts with the earlier weekly short signal, consistent with a countertrend bounce rather than an established trend reversal. ATR of 415, approximately $4.15 per barrel, reflects substantial daily volatility. The chart alone does not establish a news or seasonal catalyst.
View charts on: AlphaWebTrader HTF Charts
GLD Daily View
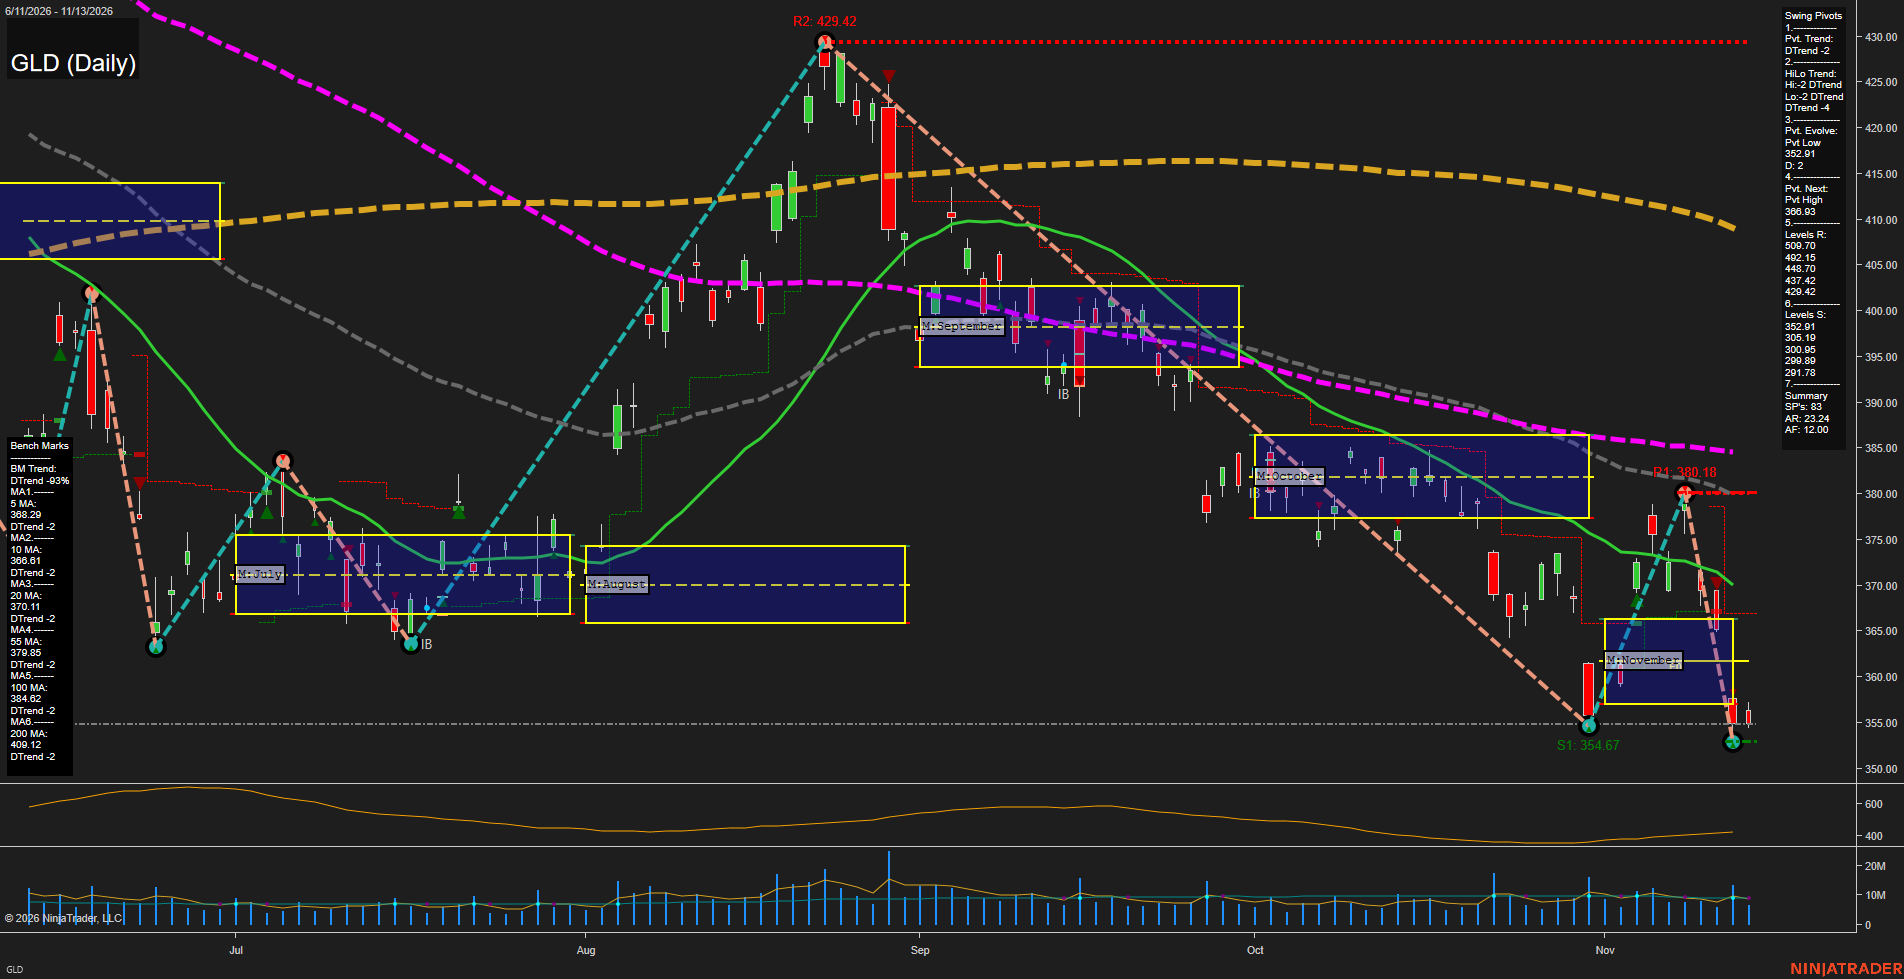
Overall Rating
- Near-Term: Bearish
- Medium-Term: Bearish
- Far-Term: Bearish.
Key Insights Summary
From a futures swing trader’s perspective, GLD reflects a bearish gold-price structure rather than a confirmed reversal. The rebound from 354.67 to 380.18 failed, followed by a fresh evolving pivot low at 352.91. Lower highs, lower lows, and price beneath all six declining benchmarks align the near-, medium-, and far-term trends downward. The latest small candle represents a pause after a sharp selloff, not established upside momentum. Price is also below November’s visible monthly neutral zone, approximately 357–366, despite the neutral grid placeholders above. The swing summary identifies 366.93 as the next opposite-pivot reversal threshold; the labeled 380.18 rebound high remains important overhead context. Weekly and yearly grids and the requested named signal-series readings are not visible, so their directional confirmation is unavailable. GLD levels are ETF prices, not gold futures contract levels; the chart alone does not establish news or seasonal drivers.
View charts on: AlphaWebTrader HTF Charts
GC Daily View
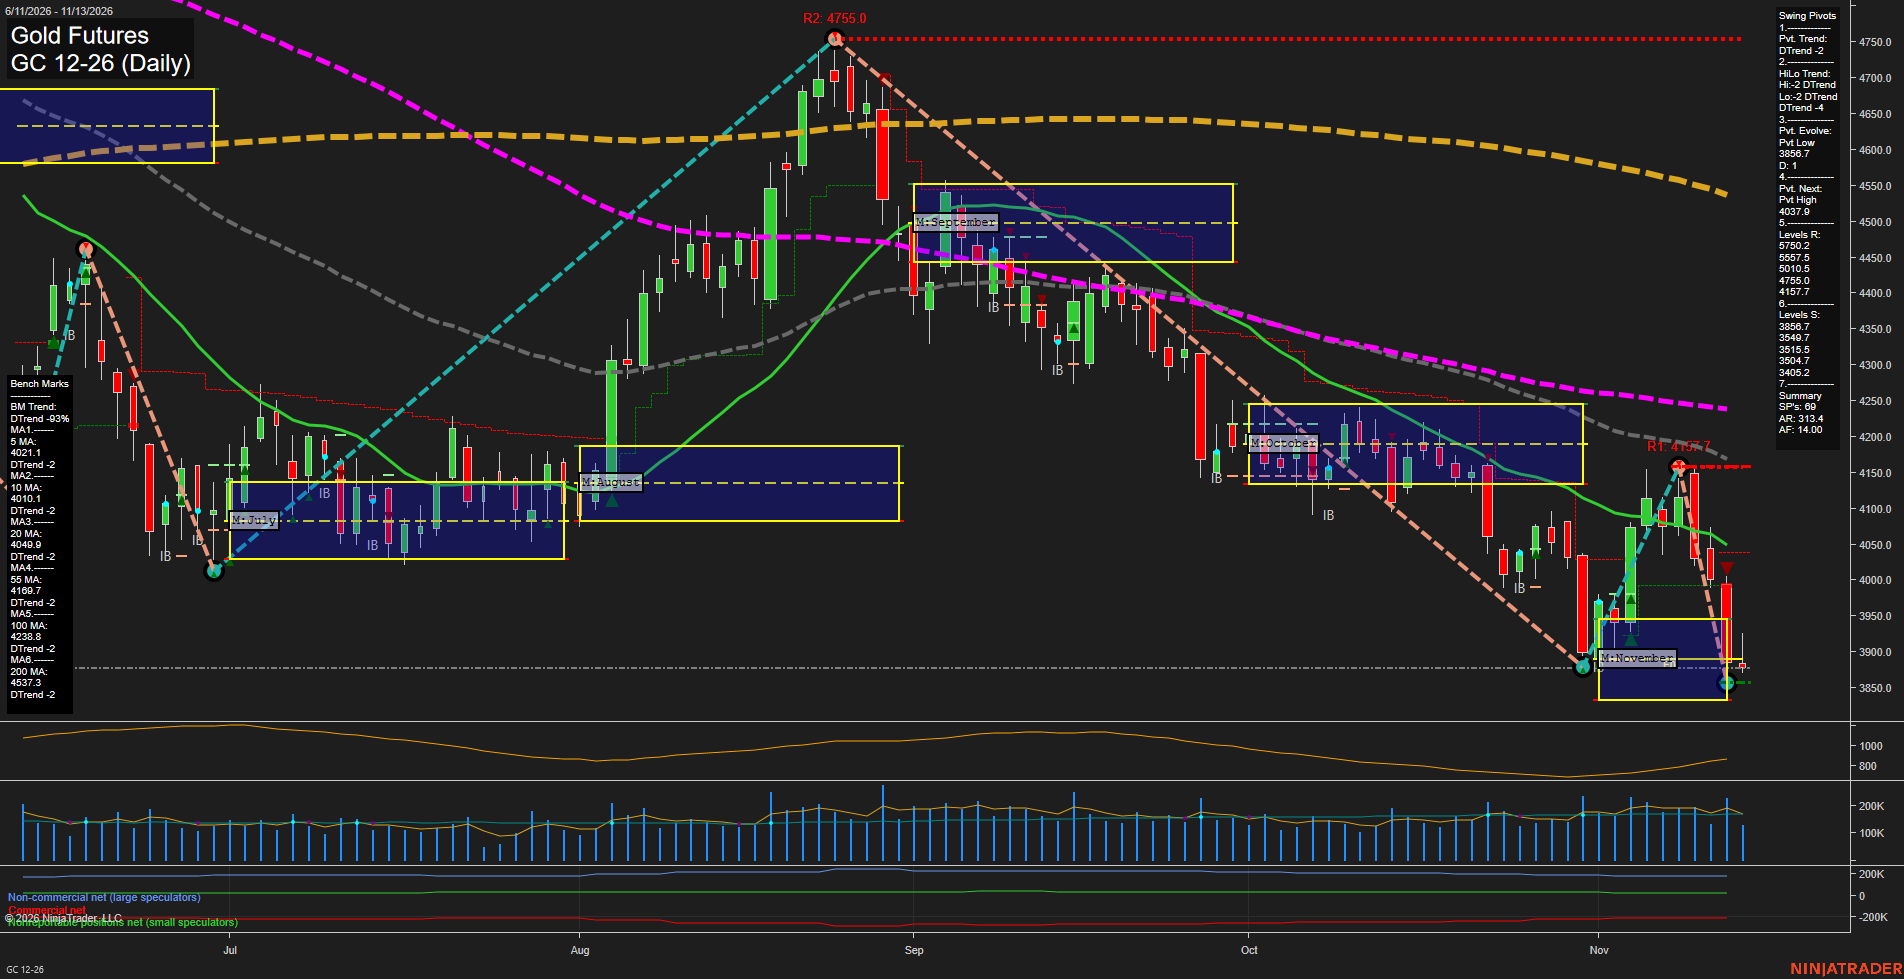
Overall Rating
- Near-Term: Bearish
- Medium-Term: Bearish
- Far-Term: Bearish.
Key Insights Summary
From a futures swing-trading perspective, the dominant structure remains a downtrend with lower highs and lower lows. November's rebound stalled at 4157.7 before a sharp selloff produced an evolving low at 3856.7. The latest small candle indicates a pause near that low, rather than a confirmed reversal; broader downside momentum remains fast. Price is below all six declining benchmarks, and weekly, monthly and yearly grid readings reinforce the bearish alignment. The next opposite-pivot reversal threshold is 4037.9, distinct from confirmed swing resistance at 4157.7. Recent near-term and far-term short signals agree with the prevailing trend, while rising ATR indicates expanding volatility. No news catalyst or seasonal conclusion can be established from this chart alone.
View charts on: AlphaWebTrader HTF Charts
ZB Daily View
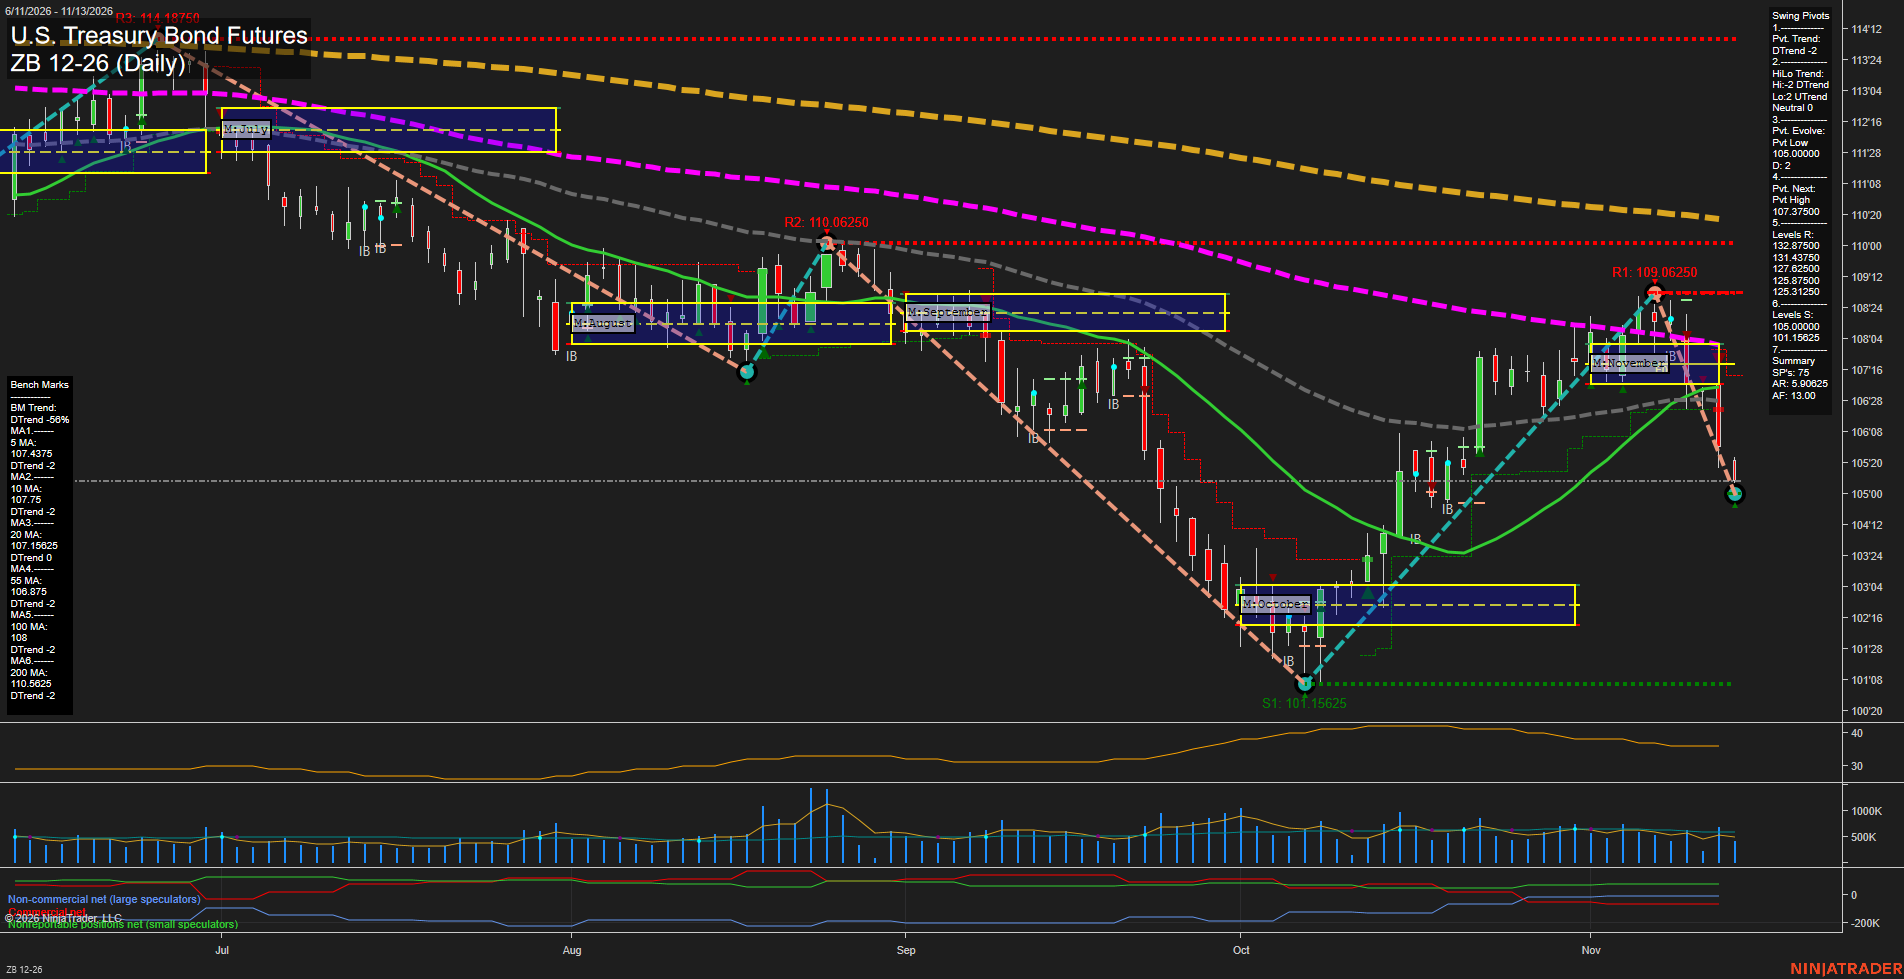
Overall Rating
- Near-Term: Bearish
- Medium-Term: Bearish
- Far-Term: Bearish.
Key Insights Summary
From a futures swing-trading perspective, the October–November recovery has reversed sharply after rejection at the plotted 109.06250 swing high. Large declining bars, price below every benchmark, and a breakdown beneath November’s NTZ indicate renewed downside momentum rather than consolidation. Both pivot trends are bearish, although the summary identifies an upward low-pivot component within an otherwise neutral HiLo composite. The evolving 105.00000 low is the immediate support reference; October’s 101.15625 low remains the deeper structural support. The 106.875–108.000 benchmark cluster now sits overhead, while 107.37500 is the next pivot-reversal threshold. The resistance values reproduced above are those displayed in the summary; nearby plotted swing resistance is 109.06250 and 110.06250. Weekly, monthly and yearly grid readings reinforce the bearish alignment. ATR has eased from October’s peak despite the renewed selloff. Individual recent-signal labels and news catalysts are not sufficiently identifiable in this image to attribute the move to them.
View charts on: AlphaWebTrader HTF Charts
Sentiment Summary: Negative coverage led at 48% versus 15% positive, centered on fallout from Jensen Huang’s November 12 Nvidia resignation, chip-export scrutiny and AI-financing concerns; Microsoft’s outage extended into November 13 before services improved. Friday’s October PPI release provided a counterweight at 0.3% monthly versus 0.4% expected, but 6.5% annual inflation and Fed officials’ calls for further tightening tempered relief. The early equity rally faded into reported Nasdaq and S&P 500 losses, while Apple gained as a relatively defensive technology holding.
Conclusion: Nvidia’s earnings on November 17 remain the next scheduled test for the heavily concentrated AI trade.