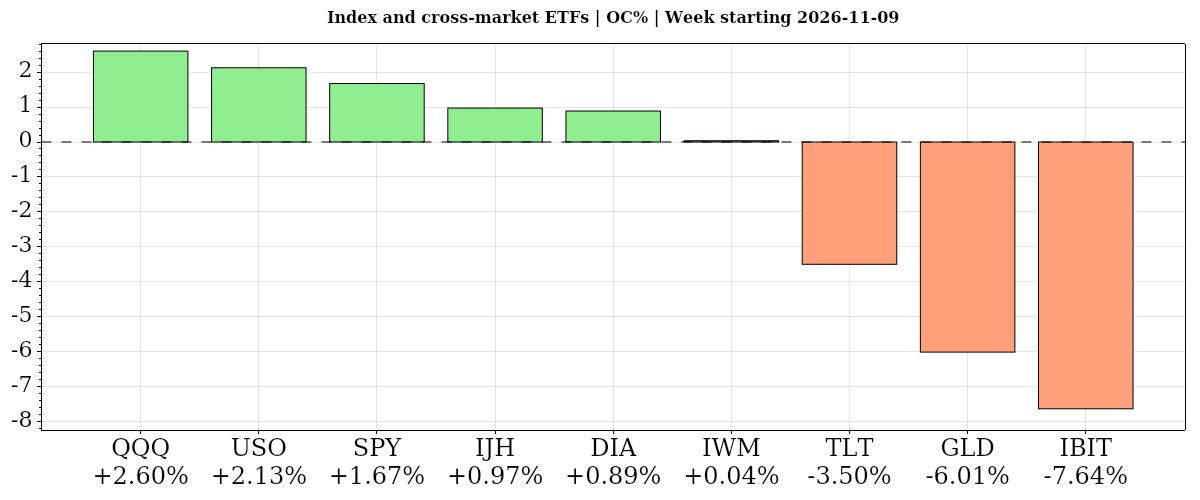
U.S. equities posted broad weekly gains despite persistent inflation concerns and AI-sector turbulence. QQQ rose 3.63%, SPY gained 2.59% and DIA added 2.13%, while small-cap IWM advanced 1.41%. Performance diverged sharply beneath the surface: Tesla gained 8.93%, but Nvidia sank 12.75%. Long-dated Treasuries, gold, oil and bitcoin exposure all finished lower.
Fundamentals: Stocks and technology shares endured a volatile week as Nvidia leadership uncertainty and China export scrutiny weighed on sentiment. October CPI exceeded forecasts, while Friday’s headline PPI was softer than expected. Apple and Ferguson beat earnings estimates; Nvidia’s Tuesday, November 17 report remained ahead. Oil fluctuated, gold fell below $4,000, and Treasury auctions yielded 5.02% for 10-year notes and 5.441% for 30-year bonds.
Technicals: Stocks and tech ended the week higher with bullish ratings as the S&P 500 ETF rose 2.59% and the Nasdaq 100 ETF gained 3.63%. Tesla led the listed stocks with an 8.93% gain, while Nvidia fell 12.75% and Microsoft lost 1.27%, both rated bearish. Oil, gold and far-term Treasury ETFs also carried bearish ratings, declining 1.91%, 4.58% and 3.10%, respectively.
Weekly Market Recap: weekly ETF and stock performance, daily session commentary, economic releases, earnings and market news, with a whole-week summary.
As of: November 14, 2026 11:30 CT
Earnings Radar Week Recap
Monitoring for earnings releases by the Magnificent 7, AI-tech-related firms, and major financial institutions.
| Date/Day | Impact | Company / Symbol | Time | EPS | Revenue | ||||||||
|---|---|---|---|---|---|---|---|---|---|---|---|---|---|
| 2026-11-09 – Monday | Medium | MARA Holdings (MARA) | After close |
|
|
For full details visit: Yahoo Earnings Calendar
EcoNews Radar U.S. Events Week Recap
| Date | Impact | Event, Prev, Forecast, Actual | Info |
|---|---|---|---|
| 2026-11-10 Tuesday 04:00 | Medium | FOMC Member Waller Speaks Prev: — Forecast: — Actual: — | Remarks may clarify the policy outlook and assessment of economic conditions; traders monitor potential implications for interest-rate expectations, Treasury yields and equity valuations. |
| 2026-11-10 Tuesday 08:30 | High | Core CPI m/m Prev: 0.3% Forecast: 0.2% Actual: 0.30% | Measures monthly consumer price changes excluding food and energy; traders monitor underlying inflation pressures that influence monetary-policy expectations and equity discount rates. |
| 2026-11-10 Tuesday 08:30 | High | CPI m/m Prev: 0.6% Forecast: 0.3% Actual: 0.40% | Measures monthly changes in broad consumer prices; traders watch for inflation pressures that may affect interest-rate expectations, household purchasing power and equity valuations. |
| 2026-11-12 Thursday 08:30 | Medium | Initial Jobless Claims Prev: 189K Forecast: 195K Actual: 200K | Counts new applications for unemployment benefits, providing a timely labor-market indicator; traders monitor signs of changing employment conditions and their implications for growth and monetary policy. |
| 2026-11-12 Thursday 09:00 | Medium | Fed's Hammack speech Prev: — Forecast: — Actual: — | Remarks may offer insight into the economic outlook and policy priorities; traders watch for signals relevant to rate expectations and equity valuations. |
| 2026-11-12 Thursday 10:00 | Medium | Fed's Barr speech Prev: — Forecast: — Actual: — | Remarks may address monetary policy, banking conditions or financial stability; traders monitor potential implications for interest rates, credit conditions and financial-sector equities. |
| 2026-11-12 Thursday 10:00 | Medium | Existing Home Sales Change (MoM) Prev: 1.5 Forecast: — Actual: -5.5 | Measures the monthly percentage change in completed sales of previously owned homes; traders monitor housing demand as a gauge of interest-rate sensitivity and broader economic momentum. |
| 2026-11-12 Thursday 11:15 | Medium | Fed's Goolsbee speech Prev: — Forecast: — Actual: — | Remarks may illuminate views on inflation, employment and monetary policy; traders monitor whether the commentary informs expectations for the interest-rate path. |
| 2026-11-12 Thursday 11:30 | Medium | 4-Week Bill Auction · $115B Prev: 3.89% Forecast: — Actual: 3.955% | Reports the yield and demand for very short-term government debt; traders monitor money-market conditions and front-end rates that help frame broader financial conditions. |
| 2026-11-12 Thursday 11:30 | Medium | 8-Week Bill Auction · $110B Prev: — Forecast: — Actual: — | Reports pricing and investor demand for short-term government funding; traders watch for signals about cash-market liquidity and near-term interest-rate expectations. |
| 2026-11-12 Thursday 12:00 | Low | EIA Crude Oil Stocks Change Prev: -0.86M Forecast: -1.10M Actual: 4.66M | Measures the weekly change in commercial crude inventories; traders monitor petroleum supply-demand conditions for implications for energy shares and inflation expectations. |
| 2026-11-12 Thursday 13:00 | High | 30-Year Bond Auction · $25B Prev: 5.62% Forecast: — Actual: 5.441% | Reports borrowing costs and investor demand for long-dated government debt; traders monitor duration demand and long-term yields that influence equity discount rates. |
| 2026-11-12 Thursday 13:00 | Medium | 17-Week Bill Auction · $75B Prev: — Forecast: — Actual: — | Reports pricing and demand for government bills with an intermediate cash-market maturity; traders monitor funding conditions and the shape of short-term interest rates. |
| 2026-11-12 Thursday 13:10 | Medium | Fed's Daly speech Prev: — Forecast: — Actual: — | Remarks may provide perspective on economic conditions and monetary policy; traders watch for implications for rate expectations, bond yields and equity valuations. |
| 2026-11-12 Thursday 13:30 | Medium | Fed's Schmid speech Prev: — Forecast: — Actual: — | Remarks may clarify views on inflation risks and the policy stance; traders monitor signals that could inform the expected interest-rate path. |
| 2026-11-12 Thursday 14:00 | Medium | Monthly Budget Statement Prev: -27.0B Forecast: -298.6B Actual: -404.1B | Tracks federal receipts, spending and the resulting fiscal balance; traders monitor government financing needs and potential implications for Treasury supply and yields. |
| 2026-11-12 Thursday 18:30 | Medium | Fed's Williams speech Prev: — Forecast: — Actual: — | Remarks may offer insight into the policy outlook and financial conditions; traders monitor implications for interest-rate expectations and equity discount rates. |
| 2026-11-13 Friday 08:30 | High | Producer Price Index ex Food & Energy (MoM) Prev: 0.70% Forecast: 0.30% Actual: 0.30% | Measures monthly changes in producer selling prices excluding food and energy; traders monitor underlying upstream inflation and potential implications for margins and monetary policy. |
| 2026-11-13 Friday 08:30 | High | Producer Price Index (MoM) Prev: 1.30% Forecast: 0.40% Actual: 0.30% | Measures monthly changes in prices received by domestic producers; traders watch for upstream inflation pressures that may affect business margins, consumer prices and rate expectations. |
| 2026-11-13 Friday 08:30 | Medium | Producer Price Index (YoY) Prev: 6.3% Forecast: 6.6% Actual: 6.5% | Measures annual changes in prices received by domestic producers; traders monitor the broader inflation trend and its implications for corporate margins and monetary policy. |
| 2026-11-13 Friday 08:30 | High | Producer Price Index ex Food & Energy (YoY) Prev: 5.0% Forecast: 5.0% Actual: 5.0% | Measures annual producer-price changes excluding food and energy; traders monitor persistent upstream inflation pressures that may inform the policy outlook and equity valuations. |
| 2026-11-13 Friday 08:45 | Medium | Fed's Goolsbee speech Prev: — Forecast: — Actual: — | Remarks may provide context on inflation and employment trends; traders watch for signals about monetary-policy priorities and the expected path of rates. |
| 2026-11-13 Friday 09:00 | Medium | Fed's Daly speech Prev: — Forecast: — Actual: — | Remarks may clarify the assessment of economic risks and policy settings; traders monitor potential implications for yields and equity valuations. |
| 2026-11-13 Friday 09:45 | Medium | Fed's Logan speech Prev: — Forecast: — Actual: — | Remarks may address monetary policy and financial-market conditions; traders monitor signals relevant to liquidity, interest-rate expectations and equity discount rates. |
| 2026-11-13 Friday 10:30 | Medium | Fed's Collins speech Prev: — Forecast: — Actual: — | Remarks may outline views on growth, inflation and employment; traders watch for clues about the policy outlook and its implications for financial conditions. |
| 2026-11-13 Friday 10:50 | Medium | Fed's Bowman speech Prev: — Forecast: — Actual: — | Remarks may cover monetary policy or banking conditions; traders monitor potential implications for interest-rate expectations, lending conditions and financial-sector equities. |
| 2026-11-13 Friday 19:00 | Medium | Fed's Jefferson speech Prev: — Forecast: — Actual: — | Remarks may clarify the economic outlook and policy considerations; traders watch for signals relevant to the expected rate path and equity valuations. |
Summary: The calendar centers on U.S. inflation and monetary-policy signals, alongside indicators of economic activity and government financing.
Conclusion: The event schedule is most heavily concentrated on Thursday and Friday.
Market Technical Analysis
Analysis of completed-week VIX volatility, major ETFs and mega-cap tech stocks, futures snapshots, higher-time-frame analysis and weekly charts.
VIX — Market Fear Gauge Weekly
| Level | Open | High | MaxVix | Low | MinVix | WNC% | WOC% | VR | MaxVR | MinVR |
|---|---|---|---|---|---|---|---|---|---|---|
| 19.29 | 25.08 | 25.08 | 28.36 | 17.33 | 13.80 | -16.85% | -23.09% | 6.49 | 17.64 | -19.11 |
VIX fell 16.85% versus the previous weekly close. Open-to-close change: -23.09%. VIX is 37.7% up the recent 12-week range (13.80–28.36), in the 30–40% band.
VR: Weekly VR: Stocks rose while expected volatility eased. VR is in the upper part of its preceding 12-week VR range (-19.11 to 17.64), in the 60–70% band. VR fell 1.78 points from the previous week, a small shift relative to that range.
Range lookback: preceding 12 completed weeks.
Major ETFs and Mega Cap Tech Stocks Weekly
ETF, Mag7, and Cross-Market ETF Weekly Insights
Overall Tone
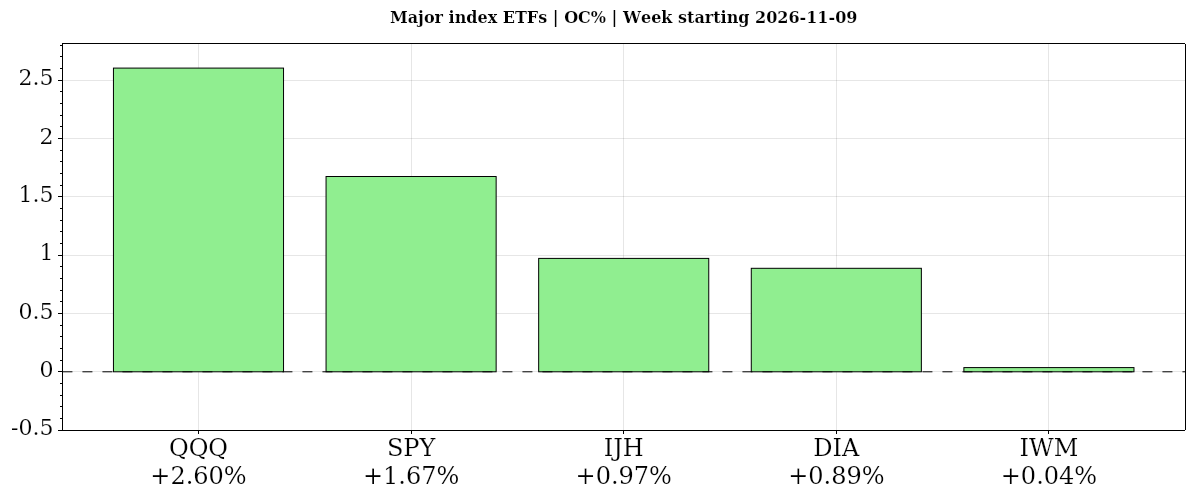
The completed week beginning 2026-11-09 showed a constructive but uneven risk tone, with equities generally gaining from the week open.
| Instrument | Bias | Date | WNC% | WOC% | O | H | L | C | VWAP | Vol | Mon | Tue | Wed | Thu | Fri |
|---|---|---|---|---|---|---|---|---|---|---|---|---|---|---|---|
| ▲ QQQ | ▲ ▲ ▼ | 2026-11-09 | ▲ +3.63% | ▲ +2.60% | 662.64 | 695.57 | 662.02 | 679.89 | ▼ 681.11 | 216,306,043 | +3.54% | -0.68% | +2.31% | -0.32% | -1.20% |
| ▲ SPY | ▲ ▲ ▲ | 2026-11-09 | ▲ +2.59% | ▲ +1.67% | 741.95 | 763.04 | 741.02 | 754.37 | ▲ 753.84 | 204,016,666 | +2.37% | -0.37% | +1.32% | -0.35% | -0.36% |
| ▲ IJH | ▲ ▲ ▼ | 2026-11-09 | ▲ +2.29% | ▲ +0.97% | 73.05 | 74.79 | 72.96 | 73.76 | ▼ 74.17 | 42,573,154 | +3.16% | -0.35% | +0.81% | -1.18% | -0.12% |
| ▲ DIA | ▲ ▲ ▲ | 2026-11-09 | ▲ +2.13% | ▲ +0.89% | 518.55 | 527.05 | 517.24 | 523.15 | ▲ 522.34 | 13,230,508 | +2.17% | -0.31% | +0.52% | -0.38% | +0.13% |
| ▲ IWM | ▲ ▲ ▼ | 2026-11-09 | ▲ +1.41% | ▲ +0.04% | 277.44 | 283.79 | 274.67 | 277.54 | ▼ 280.23 | 108,051,895 | +3.23% | -0.68% | +0.89% | -1.64% | -0.32% |
| AVG/Sum | — | — | +2.41% | +1.23% | — | — | — | — | — | 584,178,266 | +2.89% | -0.48% | +1.17% | -0.77% | -0.38% |
QQQ · W:2026-11-09 NC% ▲ +3.63% OC% ▲ +2.60%
QQQ – Nasdaq 100 Technicals Summary
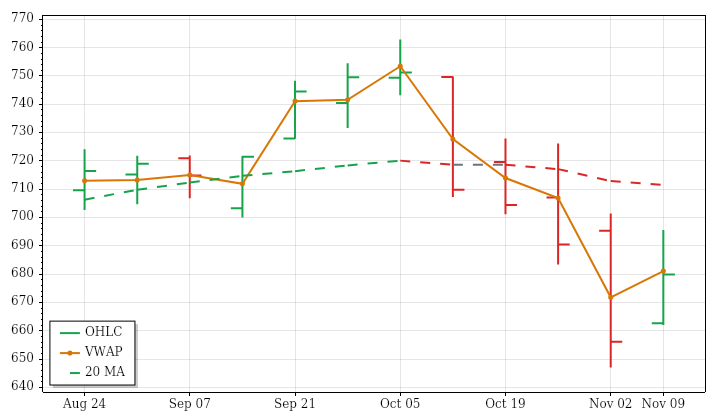
QQQ's completed week beginning 9 November 2026 rebounded to 679.89, gaining 3.63% from the prior weekly close and 2.60% from the open. The opening gap higher remained unfilled, and price advanced through a larger-than-average weekly range. Nevertheless, the week was an inside bar, its close remained within the previous week's range, and the finish was slightly below weekly VWAP.
The recovery therefore coexisted with unresolved shorter-term weakness. Price remained below a falling near-term benchmark and a rising intermediate-term benchmark, while the far-term structure stayed upward. The 12-week price trend was also declining. Above-average range and volume matched the lookback's expanding ranges and increasing participation, giving the rebound greater activity without establishing trend alignment. Both supplied trend indicators remained bearish, including a recent ATR-median downturn. A next-week high above 718.5129 would conditionally trigger a PSAR bullish reversal.
Nasdaq 100 News and Fundamentals
The Nasdaq-100 surged in the session reported November 10, with chip stocks leading gains even as Nvidia, its second-largest holding, fell amid a CEO investigation. The rebound followed a substantial pullback: by November 13, QQQ was reported down more than 11% since October 6, placing it in correction territory.
SPY · W:2026-11-09 NC% ▲ +2.59% OC% ▲ +1.67%
SPY – S&P 500 Technicals Summary
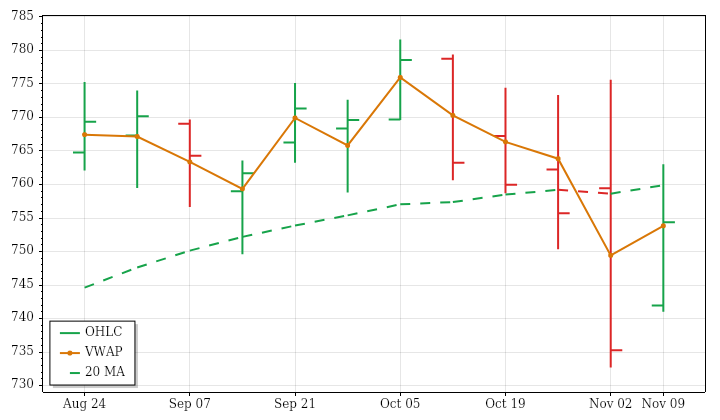
SPY's completed week beginning 9 November 2026 rose 2.59% from the prior weekly close and 1.67% from the open, finishing at 754.37. The opening gap higher remained unfilled, and the close edged above weekly VWAP. However, trading stayed within the previous week's range, so the advance did not establish a break above that weekly boundary despite its relatively broad movement.
The latest gain contrasted with a declining 12-week price trend and a near-term benchmark that remained slightly downward above price. Intermediate- and far-term structures were still rising, leaving shorter-term weakness within a positive longer-term framework. The week's range was about 27% above average, consistent with broader range expansion, but volume was slightly below average despite increasing lookback volume. PSAR and ATR-median remained bearish. A next-week high above 775.64 would conditionally trigger a PSAR bullish reversal.
S&P 500 News and Fundamentals
The S&P 500 gained 2.51% in the week ended November 13, snapping a four-week losing streak and recording its strongest week since August. Goldman Sachs forecast the index would reach 8,700 over the next 12 months, arguing that more attractive valuations following the recent selloff could support positive returns despite slower earnings growth.
IJH · W:2026-11-09 NC% ▲ +2.29% OC% ▲ +0.97%
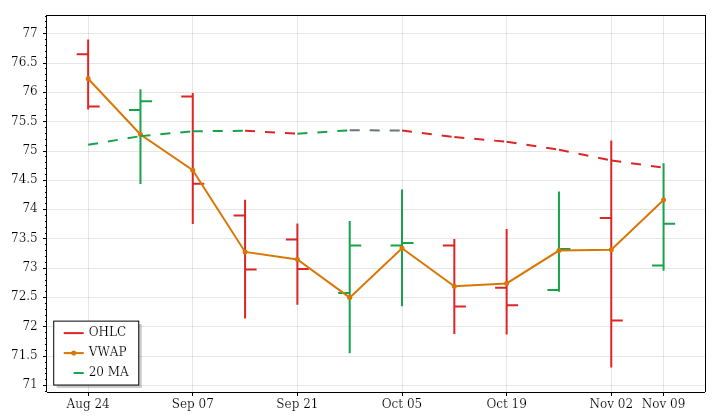
IJH – Mid Cap Technicals Summary
IJH's completed week beginning 9 November 2026 advanced 2.29% from the prior weekly close and 0.97% from the open, finishing at 73.76. Its opening gap higher remained unfilled, but the week formed an inside bar and closed within the previous week's range. Despite the gain, the finish below weekly VWAP showed that the closing price did not maintain the week's volume-weighted trading level.
The trend structure remained divided. Price stood above a falling near-term benchmark and just above a rising intermediate-term benchmark, while the far-term structure remained downward. The latest rebound thus did not resolve the declining 12-week price trend. Volume was about 20% above average, consistent with increasing lookback volume, while the range was slightly below average despite broader range expansion. Both supplied trend indicators were bearish; a next-week high above 75.18 would conditionally trigger a PSAR bullish reversal.
DIA · W:2026-11-09 NC% ▲ +2.13% OC% ▲ +0.89%
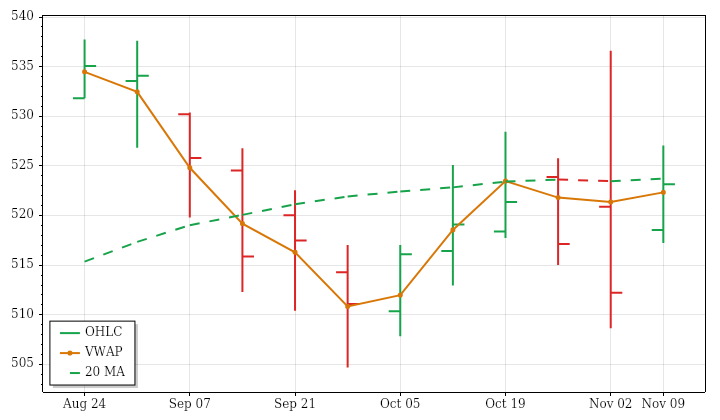
DIA – Dow Jones Technicals Summary
DIA's completed week beginning 9 November 2026 closed at 523.15, gaining 2.13% against the prior weekly close and 0.89% from the open. The opening gap higher remained unfilled, but the entire week's trading stayed within the previous week's range. Movement on both sides of the open therefore ended positively without establishing a break beyond that broader weekly boundary. The close was modestly above weekly VWAP.
The rebound contrasted with a declining 12-week price trend. Near-term structure remained mixed because price stood above a falling average, while intermediate- and far-term structures remained upward. The latest range and volume were both below their preceding 12-week averages, unlike the expanding ranges and increasing volume across that window. Indicator agreement was incomplete: PSAR was positive while ATR-median remained negative. A next-week low below 508.66 would conditionally trigger a PSAR bearish reversal.
IWM · W:2026-11-09 NC% ▲ +1.41% OC% ▲ +0.04%
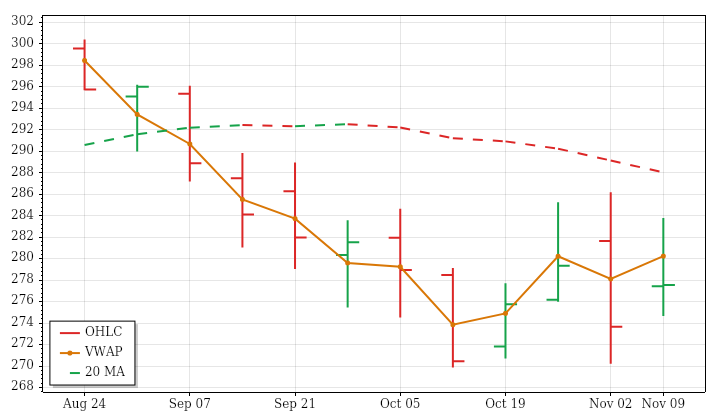
IWM – Small Cap Technicals Summary
IWM's completed week beginning 9 November 2026 gained 1.41% from the prior weekly close, but its 0.04% open-to-close rise was essentially flat. The opening gap higher therefore accounted for almost all the gain and remained unfilled. Trading moved both above and below the open, yet stayed within the prior week's range. The close below weekly VWAP added a softer note to the positive weekly return.
Near- and intermediate-term structures remained mixed: price barely exceeded a falling near-term benchmark but stayed below a rising intermediate-term average. The far-term uptrend remained intact beneath price, contrasting with the declining 12-week price trend. The latest range was slightly above average, consistent with broader expansion, while volume was modestly below average despite an increasing lookback trend. PSAR was positive but ATR-median remained bearish; a next-week low below 270.23 would conditionally trigger a PSAR bearish reversal.
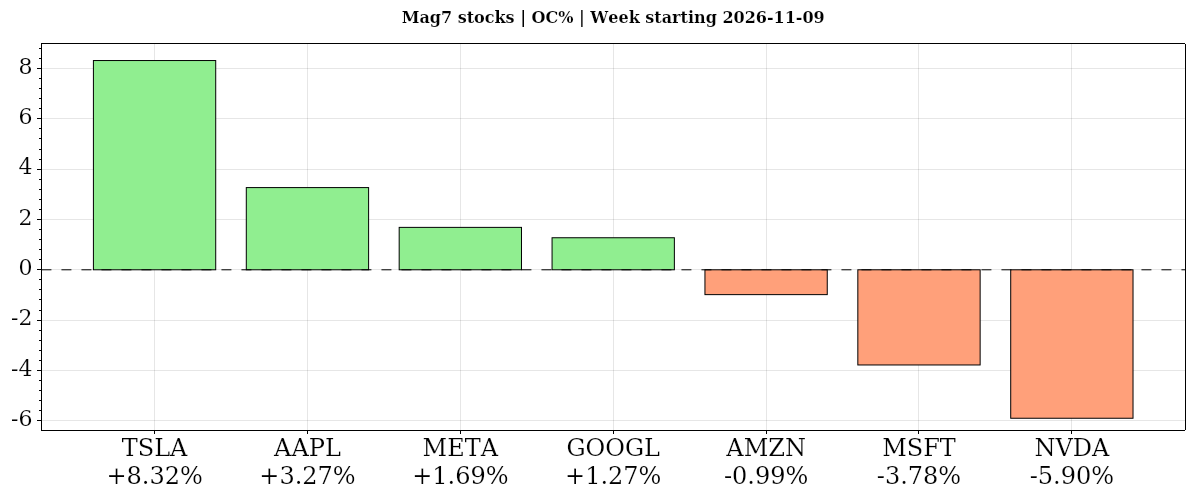
| Instrument | Bias | Date | WNC% | WOC% | O | H | L | C | VWAP | Vol | Mon | Tue | Wed | Thu | Fri |
|---|---|---|---|---|---|---|---|---|---|---|---|---|---|---|---|
| ▲ TSLA | ▲ ▲ ▲ | 2026-11-09 | ▲ +8.93% | ▲ +8.32% | 360.25 | 404.40 | 360.02 | 390.22 | ▲ 386.23 | 150,661,370 | +5.54% | +0.46% | +2.91% | +1.69% | -1.82% |
| ▲ META | ▲ ▲ ▲ | 2026-11-09 | ▲ +5.17% | ▲ +1.69% | 631.05 | 648.45 | 618.92 | 641.69 | ▲ 636.97 | 73,408,070 | +5.12% | 0.00% | -1.97% | -0.82% | +2.90% |
| ▲ AAPL | ▲ ▲ ▲ | 2026-11-09 | ▲ +4.06% | ▲ +3.27% | 345.00 | 360.83 | 344.78 | 356.27 | ▲ 353.44 | 184,666,978 | +2.43% | -0.62% | +2.04% | -0.21% | +0.39% |
| ▲ GOOGL | ▲ ▲ ▲ | 2026-11-09 | ▲ +3.86% | ▲ +1.27% | 292.05 | 304.97 | 285.68 | 295.77 | ▲ 293.75 | 157,945,927 | +1.18% | -0.27% | +2.11% | +1.79% | -0.98% |
| ▲ AMZN | ▲ ▼ ▼ | 2026-11-09 | ▲ +2.84% | ▼ -0.99% | 269.32 | 275.34 | 263.91 | 266.66 | ▼ 268.78 | 193,061,483 | +2.94% | +1.48% | -1.74% | +0.48% | -0.29% |
| ▼ MSFT | ▼ ▼ ▼ | 2026-11-09 | ▼ -1.27% | ▼ -3.78% | 544.49 | 548.28 | 513.82 | 523.88 | ▼ 530.02 | 125,861,854 | +2.75% | -2.20% | -2.26% | +0.36% | +0.17% |
| ▼ NVDA | ▼ ▼ ▼ | 2026-11-09 | ▼ -12.75% | ▼ -5.90% | 173.06 | 179.92 | 148.80 | 162.85 | ▼ 168.13 | 2,345,657,732 | -4.27% | -5.47% | +2.87% | -4.34% | -2.01% |
| AVG/Sum | — | — | +1.55% | +0.55% | — | — | — | — | — | 3,231,263,414 | +2.24% | -0.95% | +0.57% | -0.15% | -0.23% |
Mag7 Stocks
Positive confluence: average WOC% +0.55% from the week open, WNC% +1.55% versus the prior weekly close. Four of seven gained from the open versus five from the prior close; Tesla led both, Nvidia lagged both, and Amazon’s weekly gain masked open-to-close weakness. Apple’s moving-average uptrends remained aligned; Nvidia fell on exceptionally heavy volume.
TSLA · W:2026-11-09 NC% ▲ +8.93% OC% ▲ +8.32%
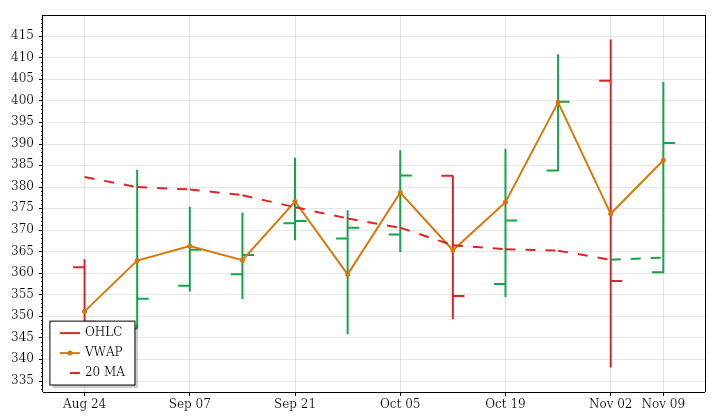
TSLA – Tesla Technicals Summary
TSLA's completed week beginning 9 November 2026 closed at 390.22, gaining 8.93% from the prior weekly close and 8.32% from the open. Unlike a largely gap-driven return, most of this advance developed after the open. The small opening gap remained unfilled, and the close exceeded weekly VWAP. Even so, the week was an inside bar and finished within the previous week's range.
Near- and far-term structures remained upward, while the intermediate-term picture was mixed because price exceeded an average that was still falling. The positive 12-week price trend had low directional efficiency, reflecting substantial intervening swings. This week's range was about 42% above average, matching broader expansion, but volume was below average despite its increasing lookback trend. ATR-median remained positive while PSAR was bearish. A next-week high above 414.23 would conditionally trigger a PSAR bullish reversal.
Tesla News and Fundamentals
Elon Musk said Cybertruck production would continue through summer 2027 because of an order backlog, extending an earlier mid-2027 endpoint. Production is expected to wind down in fall 2027, with Texas factory space eventually reassigned to Cybercab. Finland became the 11th EU country to grant provisional approval for Tesla's driving-assistance system, ahead of an EU-wide vote expected in December. Tesla also reportedly surpassed Waymo in registered autonomous vehicles in Texas.
META · W:2026-11-09 NC% ▲ +5.17% OC% ▲ +1.69%
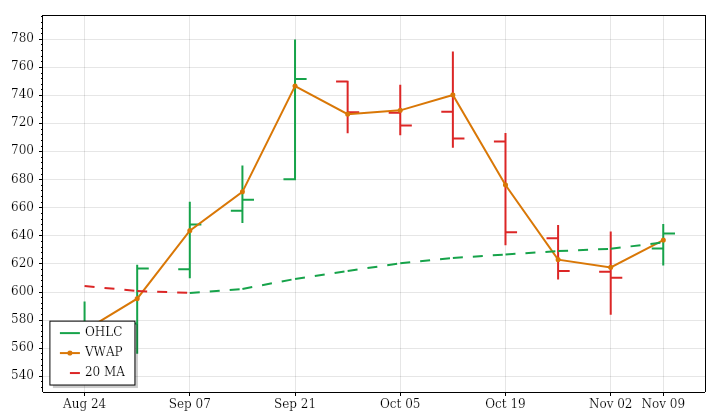
META – Meta Platforms Technicals Summary
META's completed week beginning 9 November 2026 closed at 641.69, up 5.17% from the prior weekly close and 1.69% from the open. Much of the gain came through an opening gap higher that remained unfilled. The week formed a higher high and higher low and finished near its high, above weekly VWAP, but the close remained inside the prior week's range.
Intermediate- and far-term averages retained upward structures, while near-term conditions were mixed because price remained below a rising benchmark. The positive 12-week price trend also featured little net directional efficiency, indicating substantial back-and-forth movement. This week's range was only about half its average and volume was well below average, contrasting with expanding ranges and increasing volume across the lookback. PSAR remained bearish and ATR-median crossed bearish this week. A next-week high above 727.2209 would conditionally trigger a PSAR bullish reversal.
Meta News and Fundamentals
Meta announced November 9 that its Muse AI agent was expanding to Apple Watch and Android Wear OS, supporting voice calls, text messages and dictation. Infrastructure head and engineering co-head Santosh Janardhan will leave in early 2027; former AWS executive David Brown will succeed him and become CTO of Meta Compute. Meta is also testing a prediction-market app with employees, using noncash “cred” to wager on outcomes. Whether the app will receive a public release remains unclear.
AAPL · W:2026-11-09 NC% ▲ +4.06% OC% ▲ +3.27%
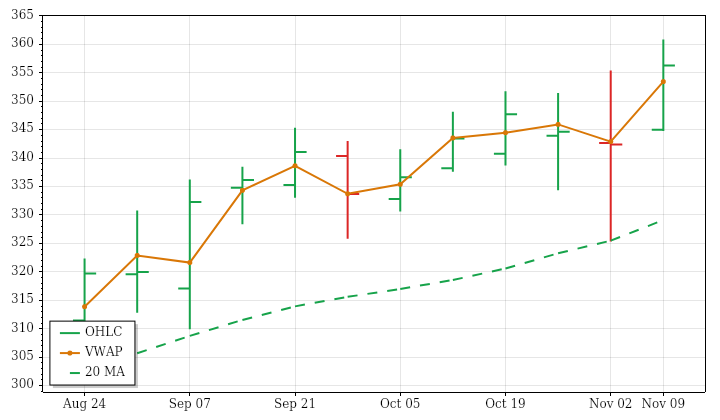
AAPL – Apple Technicals Summary
AAPL's completed week beginning 9 November 2026 reinforced its aligned near-, intermediate- and far-term uptrends. The close at 356.27 represented a 4.06% gain from the prior weekly close and a 3.27% advance from the open. An opening gap higher remained unfilled, and the week produced a higher high and higher low. Although trading crossed both sides of the open, the finish above the prior week's high distinguished this advance from a move contained within the previous range.
The close also exceeded weekly VWAP, supporting the positive price picture. Participation was less forceful: the range was approximately average and volume was below average, despite expanding ranges and increasing volume across the preceding 12 weeks. Price finished close to its annual high. Trend indicators remained positive, although a next-week low below 325.33 would conditionally trigger a PSAR bearish reversal.
Apple News and Fundamentals
Apple reported record fiscal fourth-quarter revenue and earnings per share, while fiscal 2026 revenue reached $478.8 billion, up 15%. Its R&D budget rose to $45.8 billion under new CEO John Ternus. Rising memory-chip prices were reported as a threat to profitability despite strong iPhone demand and high-margin services. On November 10, Apple announced it would permanently close the Apple Support Community forum, a longstanding service where customers exchanged product questions and answers.
GOOGL · W:2026-11-09 NC% ▲ +3.86% OC% ▲ +1.27%
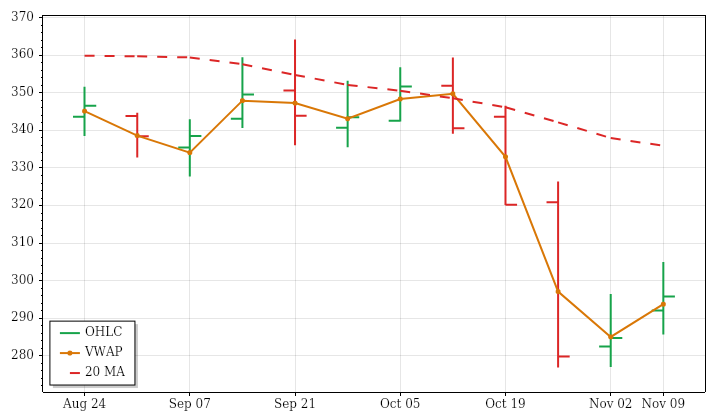
GOOGL – Alphabet Technicals Summary
GOOGL's completed week beginning 9 November 2026 delivered a rebound rather than an established change in its broader weak structure. The close at 295.77 gained 3.86% from the prior weekly close and 1.27% from the open. The opening gap higher remained unfilled, and trading produced a higher high and higher low. Nevertheless, the finish remained inside the previous week's range, limiting the structural significance of the advance.
The close above weekly VWAP and moderately above-average volume supported the latest improvement. Its approximately average range was slightly narrower than usual, despite expanding ranges and increasing volume over the preceding 12 weeks. Near- and intermediate-term averages were still falling above price, whereas the far-term average remained rising below it. Both supplied trend indicators retained bearish states. A next-week high above 336.8413 would conditionally trigger a PSAR bullish reversal, rather than confirming one from this week's gain.
AMZN · W:2026-11-09 NC% ▲ +2.84% OC% ▼ -0.99%
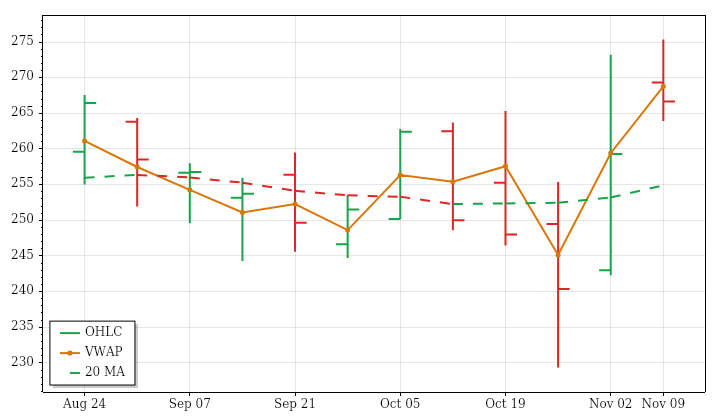
AMZN – Amazon Technicals Summary
AMZN's completed week beginning 9 November 2026 gained 2.84% from the prior weekly close but fell 0.99% from the open. That distinction matters because the opening gap higher supplied the weekly gain, while subsequent trading surrendered some of it. The gap remained unfilled, and a higher high and higher low showed improvement, but the close stayed within the prior week's range and near the latest week's low.
The finish below weekly VWAP reinforced the softer open-to-close performance. Near-term conditions remained mixed, with price above a falling benchmark, while intermediate- and far-term averages retained rising structures. The 12-week price trend was still downward and highly choppy. This week's narrower-than-average range and approximately average volume contrasted with expanding ranges and increasing volume over that lookback. Bearish trend indicators persisted; a next-week high above 275.34 would conditionally trigger a PSAR bullish reversal.
Amazon News and Fundamentals
Amazon plans a World Product Graph providing information on virtually every product available online, including items it does not stock, Reuters reported November 13. Its AI infrastructure buildout pushed free cash flow negative, with approximately $220 billion in 2026 cash capital expenditures still expected. On November 10, a judge certified a class action alleging Amazon Photos collected biometric data without required notice or consent. A proposed Walla Walla County data-center campus also drew protests over water supplies, agriculture and transparency.
MSFT · W:2026-11-09 NC% ▼ -1.27% OC% ▼ -3.78%
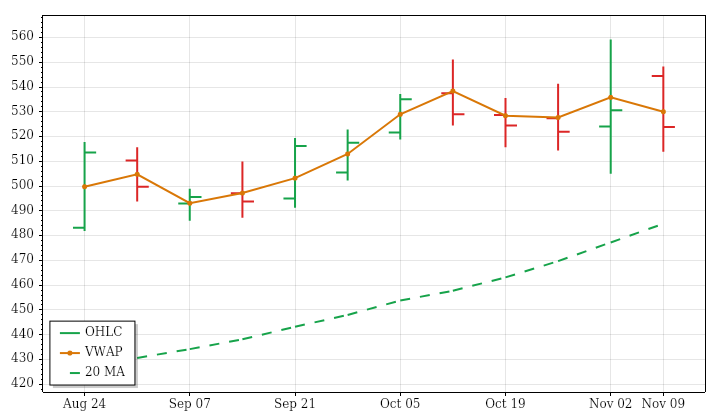
MSFT – Microsoft Technicals Summary
MSFT's completed week beginning 9 November 2026 declined despite aligned near-, intermediate- and far-term uptrends. The close at 523.88 was down 1.27% from the prior weekly close and 3.78% from the open. An opening gap higher was filled as price reversed, ending below weekly VWAP. Although the week remained inside the prior week's range, the open-to-close retreat brought price only slightly above its rising near-term benchmark.
The decline carried a range about 36% above average and moderately above-average volume. Both features matched the preceding 12 weeks' expanding ranges and increasing volume, making the latest weakness more substantial than a narrow, quiet pullback. Still, the broader moving-average structure and both supplied trend indicators remained positive rather than confirming a trend reversal. A next-week low below 504.96 would conditionally trigger a PSAR bearish reversal.
Microsoft News and Fundamentals
A Microsoft 365 outage beginning November 12 disrupted Outlook, Teams, Copilot and other workplace applications across more than 70 countries, affecting government offices and businesses. Disruptions continued into November 13, when Microsoft reported progress and said service was returning to normal. Separately, as authorities investigated a major FAA outage, Microsoft said its products were not involved. Reported quarterly Azure growth was 48%, with fiscal second-quarter growth guided to 49%–50%; quarterly capital expenditures reached $45.2 billion.
NVDA · W:2026-11-09 NC% ▼ -12.75% OC% ▼ -5.90%
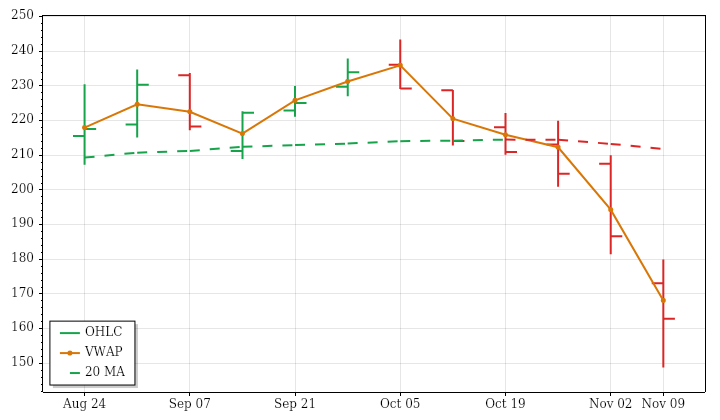
NVDA – Nvidia Technicals Summary
NVDA's completed week beginning 9 November 2026 showed pronounced deterioration, closing at 162.85 after losing 12.75% from the prior weekly close and 5.90% from the open. A large opening gap below the previous week's range remained unfilled. Subsequent trading established a lower high and lower low, with the close below both the prior week's low and weekly VWAP. Price also finished in the second lower volatility-band zone.
The near-term downtrend aligned with this weakness. Intermediate- and far-term structures were mixed rather than outright falling, because price was below averages that still sloped upward. The week's range approached twice its preceding 12-week average, while volume reached nearly four times average, sharply opposing the lookback's slightly declining volume trend. Both supplied trend indicators remained bearish. A next-week high above 222.2986 would conditionally trigger a PSAR bullish reversal.
Nvidia News and Fundamentals
Jensen Huang resigned as Nvidia CEO on November 12 following reports of multiple affairs, leaving the company approaching earnings without a permanent chief executive. Bloomberg reported that a Chinese company founded by Alice Huang procured smuggled AI chips installed at a Shanghai data center; some servers were originally sold to an official Nvidia Cloud Partner in Singapore. U.S. officials said November 13 that President Trump did not expect the Nvidia controversy to feature in his upcoming China trip.
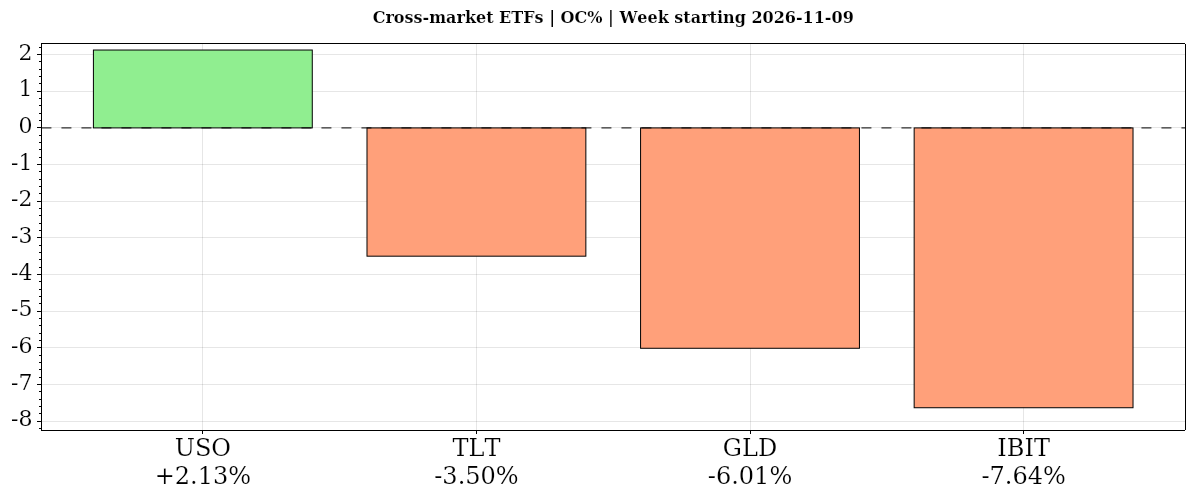
| Instrument | Bias | Date | WNC% | WOC% | O | H | L | C | VWAP | Vol | Mon | Tue | Wed | Thu | Fri |
|---|---|---|---|---|---|---|---|---|---|---|---|---|---|---|---|
| ▼ USO | ▼ ▲ ▲ | 2026-11-09 | ▼ -1.91% | ▲ +2.13% | 142.55 | 147.02 | 138.47 | 145.58 | ▲ 142.96 | 21,284,226 | -3.87% | -0.85% | +0.01% | +3.25% | -0.34% |
| ▼ TLT | ▼ ▼ ▼ | 2026-11-09 | ▼ -3.10% | ▼ -3.50% | 82.26 | 82.28 | 79.11 | 79.38 | ▼ 80.54 | 173,891,885 | +0.05% | -1.32% | +0.05% | -1.48% | -0.43% |
| ▼ GLD | ▼ ▼ ▼ | 2026-11-09 | ▼ -4.58% | ▼ -6.01% | 378.20 | 380.18 | 352.91 | 355.45 | ▼ 362.83 | 47,356,886 | +1.88% | -2.68% | -1.13% | -2.82% | +0.16% |
| ▼ IBIT | ▼ ▼ ▼ | 2026-11-09 | ▼ -9.19% | ▼ -7.64% | 42.16 | 42.70 | 38.49 | 38.94 | ▼ 40.86 | 222,430,758 | -1.31% | -1.51% | +1.34% | -4.45% | -3.52% |
| AVG/Sum | — | — | -4.69% | -3.76% | — | — | — | — | — | 464,963,755 | -0.81% | -1.59% | +0.07% | -1.37% | -1.03% |
Cross-Market ETFs
Negative confluence: average WOC% -3.76% from the week open, WNC% -4.70% versus the prior weekly close. Oil alone rose from the open, but bonds, gold, oil and bitcoin all declined versus the prior close, diverging from equities; bitcoin lagged both comparisons. Bonds retained aligned moving-average downtrends.
USO · W:2026-11-09 NC% ▼ -1.91% OC% ▲ +2.13%
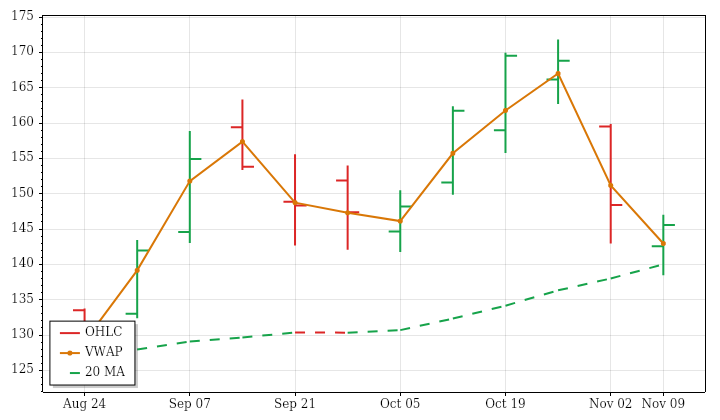
USO – Oil Technicals Summary
USO's completed week beginning 9 November 2026 lost 1.91% from the prior weekly close but gained 2.13% from the open. That contrast reflects an opening gap below the previous week's range that remained unfilled despite the subsequent recovery. The week produced a lower high and lower low, yet finished near its high, above weekly VWAP and back inside the prior week's range.
Intermediate- and far-term structures remained upward, while near-term conditions were mixed because price stayed below a rising benchmark. The latest weekly loss therefore contrasted with the positive 12-week price trend without overturning the longer-term moving-average structure. Both range and volume were below average, unlike the lookback's expanding ranges and increasing volume. Trend indicators were divided, with positive ATR-median but bearish PSAR. A next-week high above 170.1525 would conditionally trigger a PSAR bullish reversal.
Oil News and Fundamentals
The IEA said November 13 that recovering Gulf exports should return the global oil market to surplus in the fourth quarter, the first surplus since the Iran war began. U.S. commercial crude inventories rose unexpectedly by 4.7 million barrels to 414.4 million, versus an anticipated 700,000-barrel decline. Oil nevertheless rebounded Friday as continued Middle Eastern shipment disruptions supported prices. Attacks on Saudi energy infrastructure and Hormuz shipping disruptions had renewed supply concerns, while traders also weighed prospects for U.S.-Iran diplomacy.
TLT · W:2026-11-09 NC% ▼ -3.10% OC% ▼ -3.50%
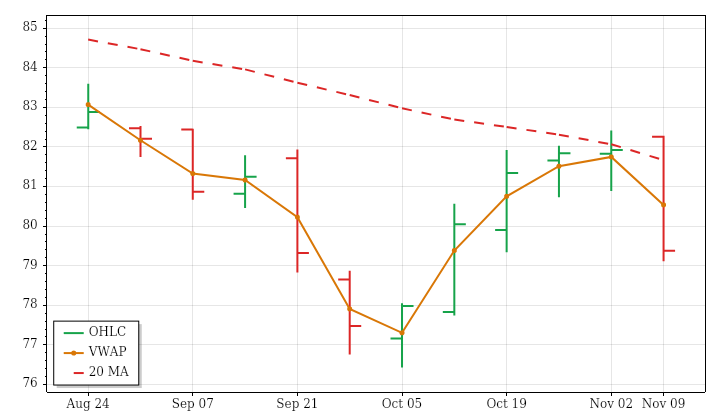
TLT – Long-Term Treasury Bonds Technicals Summary
TLT's completed week beginning 9 November 2026 reinforced aligned near-, intermediate- and far-term downtrends. The close at 79.38 fell 3.10% from the prior weekly close and 3.50% from the open. An opening gap higher was filled before price formed a lower high and lower low. The finish below the prior week's low, near the latest week's low and clearly beneath weekly VWAP emphasized the week's negative price structure.
The extreme range was roughly 73% above the preceding 12-week average, consistent with expanding lookback ranges. Volume was below average, however, despite an increasing broader volume trend. The lookback's very low directional efficiency indicated considerable back-and-forth movement rather than a smooth decline. Indicators conflicted with price and moving averages: PSAR remained positive and ATR-median crossed bullish. A next-week low below 78.0507 would conditionally trigger a PSAR bearish reversal.
Treasury Bonds News and Fundamentals
Japan's yen-defense intervention was reported to have been financed mainly through running off Treasury bills and other assets rather than selling long-dated Treasuries. The analysis found no material impact on the long end of the Treasury market and identified Federal Reserve policy and Treasury supply as the continuing drivers of TLT's price action.
GLD · W:2026-11-09 NC% ▼ -4.58% OC% ▼ -6.01%
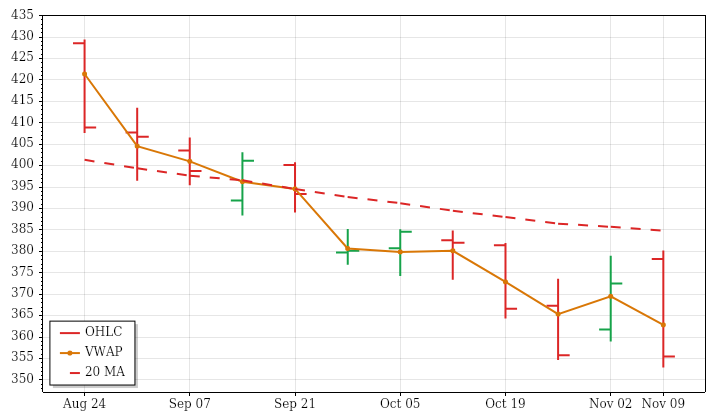
GLD – Gold Technicals Summary
GLD's completed week beginning 9 November 2026 extended near- and intermediate-term weakness within a still-rising far-term structure. The close at 355.45 was down 4.58% from the prior weekly close and 6.01% from the open. An initial gap higher was filled as trading reversed into an outside week, finishing below the prior week's low and near the latest week's low. The close also stood clearly below weekly VWAP.
The decline occurred over an extreme range, roughly 71% wider than the preceding 12-week average, sharply contrasting with the lookback's contracting ranges. Volume, however, was approximately average rather than showing a comparable expansion, while its broader trend remained downward. The finish was close to the annual low, emphasizing the distance between current weakness and the rising long-term average. Bearish indicators persisted; a next-week high above 380.18 would conditionally trigger a PSAR bullish reversal.
Gold News and Fundamentals
Gold fell below $3,900 an ounce during a steep weekly decline, surrendering the previous week's gains. Reports attributed pressure to elevated Treasury yields, persistent inflation concerns and expectations of further Federal Reserve tightening, despite cooler headline inflation and a tame monthly producer-price report. Goldman Sachs cut its year-end gold forecast from $4,650 to $4,150 and its year-end 2027 forecast from $5,400 to $4,800, citing the Fed's hawkish shift and changes in investor positioning.
IBIT · W:2026-11-09 NC% ▼ -9.19% OC% ▼ -7.64%
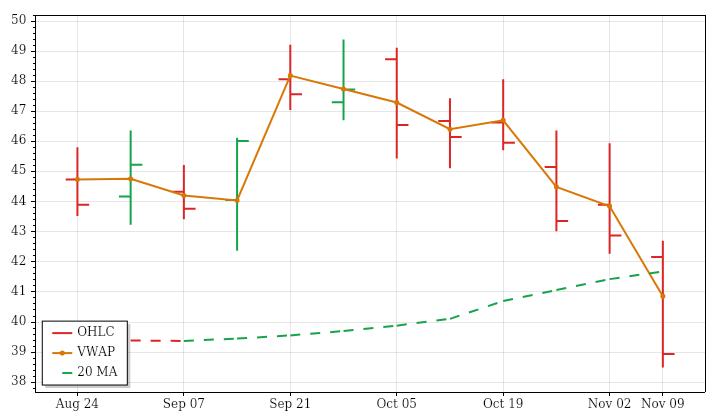
IBIT – Bitcoin Technicals Summary
IBIT's completed week beginning 9 November 2026 closed at 38.94, losing 9.19% from the prior weekly close and 7.64% from the open. An opening gap below the previous week's range remained unfilled, followed by a lower high and lower low. The finish below the prior week's low, near the latest week's low and beneath weekly VWAP made this a clear deterioration in current price action.
That weakness conflicted with still-rising near- and intermediate-term averages: price was below both, leaving their structures mixed rather than aligned upward. No far-term trend evidence was supplied. The latest range expanded beyond average despite contracting ranges over the preceding 12 weeks, while below-average volume accompanied a declining volume trend. ATR-median registered a bearish crossover and PSAR remained negative. A next-week high above 47.9796 would conditionally trigger a PSAR bullish reversal.
Glossary: Instrument — ticker symbol; hover for the instrument or company name; Date — week-start date. WNC% — prior-week close to this week’s close; WOC% — weekly session open-to-close percentage change. O — open; H — high; L — low; C — close, all for the table’s daily or weekly session; VWAP — volume-weighted average price; its arrow shows whether the close is above or below VWAP. Vol — period trading volume. Mon–Fri — each day’s prior-close-to-close percentage change.
Bias — three directional readings, in order: WNC%, WOC%, then VWAP. ▲ positive/above; ▼ negative/below; — neutral or unavailable. Matching arrows show alignment; opposing arrows show mixed conditions. AVG/Sum — simple average of percentage changes and sum of reported volumes.
Futures Session Fib Grid Analysis – Snapshot
Session Fib Grids normalise market positioning as percentages, making direction and alignment comparable across different asset types.
Latest available snapshot for each instrument; Time(CT) shows the individual update date and time.
| Instrument | Bias | Time(CT) | YSFG | MSFG | WSFG | RSFG | SFG | TSI |
|---|---|---|---|---|---|---|---|---|
| ▼ ES | ▲ ▼ ▲ ▼ ▼ ▼ | 2026-11-13 15:59:59 | ▲ +39 | ▼ -21 | ▲ +72 | ▼ -59 | ▼ -59 | ▼ -33 |
| ▼ NQ | ▲ ▼ ▲ ▼ ▼ ▼ | 2026-11-13 15:59:59 | ▲ +29 | ▼ -26 | ▲ +57 | ▼ -57 | ▼ -57 | ▼ -36 |
| ▼ YM | ▲ ▲ ▲ ▼ ▼ ▲ | 2026-11-13 15:59:55 | ▲ +32 | ▲ +15 | ▲ +56 | ▼ -25 | ▼ -25 | ▲ +45 |
| ▼ EMD | ▲ ▲ ▲ ▼ ▼ ▲ | 2026-11-13 15:59:49 | ▲ +35 | ▲ +7 | ▲ +59 | ▼ -26 | ▼ -26 | ▲ +21 |
| ▼ RTY | ▲ ▼ ▲ ▼ ▼ ▼ | 2026-11-13 15:59:58 | ▲ +32 | ▼ -25 | ▲ +35 | ▼ -32 | ▼ -32 | ▼ -11 |
| ▲ FDAX | ▲ ▲ ▲ ▲ ▲ ▲ | 2026-11-13 15:04:01 | ▲ +52 | ▲ +78 | ▲ +129 | ▲ +20 | ▲ +7 | ▲ +54 |
| ▼ NKD | ▲ ▼ ▲ ▼ ▼ ▲ | 2026-11-13 15:59:34 | ▲ +124 | ▼ -20 | ▲ +59 | ▼ -17 | ▼ -19 | ▲ +21 |
| Instrument | Bias | Time(CT) | YSFG | MSFG | WSFG | RSFG | SFG | TSI |
|---|---|---|---|---|---|---|---|---|
| ▼ BTC | ▼ ▼ ▼ ▼ ▼ ▼ | 2026-11-14 11:30:52 | ▼ -90 | ▼ -85 | ▼ -203 | ▼ -142 | ▼ -133 | ▼ -153 |
| ▲ GC | ▼ ▼ ▼ ▲ ▼ ▲ | 2026-11-13 15:59:57 | ▼ -169 | ▼ -1 | ▼ -89 | ▲ +1 | ▼ -4 | ▲ +39 |
| ▼ CL | ▲ ▼ ▼ ▼ ▼ ▲ | 2026-11-13 15:59:59 | ▲ +153 | ▼ -77 | ▼ -19 | ▼ -4 | ▼ -11 | ▲ +20 |
| ▼ 6E | ▼ ▼ ▼ ▼ ▼ ▼ | 2026-11-13 15:59:45 | ▼ -71 | ▼ -56 | ▼ -102 | ▼ -42 | ▼ -38 | ▼ -104 |
| ▲ ZB | ▼ ▼ ▼ ▲ ▲ ▲ | 2026-11-13 15:59:55 | ▼ -42 | ▼ -44 | ▼ -115 | ▲ +8 | ▲ +14 | ▲ +29 |
Glossary: YSFG — yearly; MSFG — monthly; WSFG — weekly; RSFG — regular trading hours (RTH); SFG — the current session, including pre-market or other sessions. TSI indicates trend strength and power.
Bias shows trend alignment across these six readings. The arrows follow the column order: YSFG, MSFG, WSFG, RSFG, SFG and TSI. Matching arrows show alignment; opposing arrows show mixed conditions.
Data, Market and System
Market Weekly Recap Summary
Inflation shaped positioning throughout the week. Monday’s equity rebound came ahead of Tuesday’s CPI release, which showed headline prices rising 0.4% month over month and core prices increasing 0.3%, both above forecasts. The report and hawkish Federal Reserve commentary intensified expectations of further rate increases, weighing on Tuesday’s stocks and reinforcing dollar strength. Those concerns persisted through Wednesday’s rebound and Thursday’s retreat. Friday’s softer-than-expected headline PPI reading did not displace the earlier inflation shock. TLT lost 3.10% for the week, while gold’s retreat below $4,000 an ounce accompanied a 4.58% decline in GLD.
Nvidia was the recurring source of equity-market stress, from Monday’s governance allegations through escalating investigation, litigation and China-export concerns on Tuesday and Wednesday, followed by leadership uncertainty and broader AI selling later in the week. Its approaching November 17 earnings kept concentration risk in focus, while questions about returns on AI investment weighed on sentiment. Counterweights emerged repeatedly: Apple’s earnings beat supported Monday’s backdrop, Amazon–Anthropic developments offered encouragement Tuesday, and strong cloud demand helped Wednesday’s recovery. These supports did not prevent renewed benchmark losses Thursday and Friday.
The completed-week outcome was nevertheless stronger than the late-week tone suggested. Apple, Meta, Alphabet and Amazon gained between 2.84% and 5.17%, helping distinguish broader technology performance from Nvidia’s slump; Microsoft fell 1.27%. Cross-market weakness was more consistent: IBIT dropped 9.19%, while USO lost 1.91% despite intermittent energy rallies. The week therefore combined rising equity benchmarks with pronounced dispersion across megacaps and declines in bonds, precious metals and bitcoin exposure.
Daily Session Recap
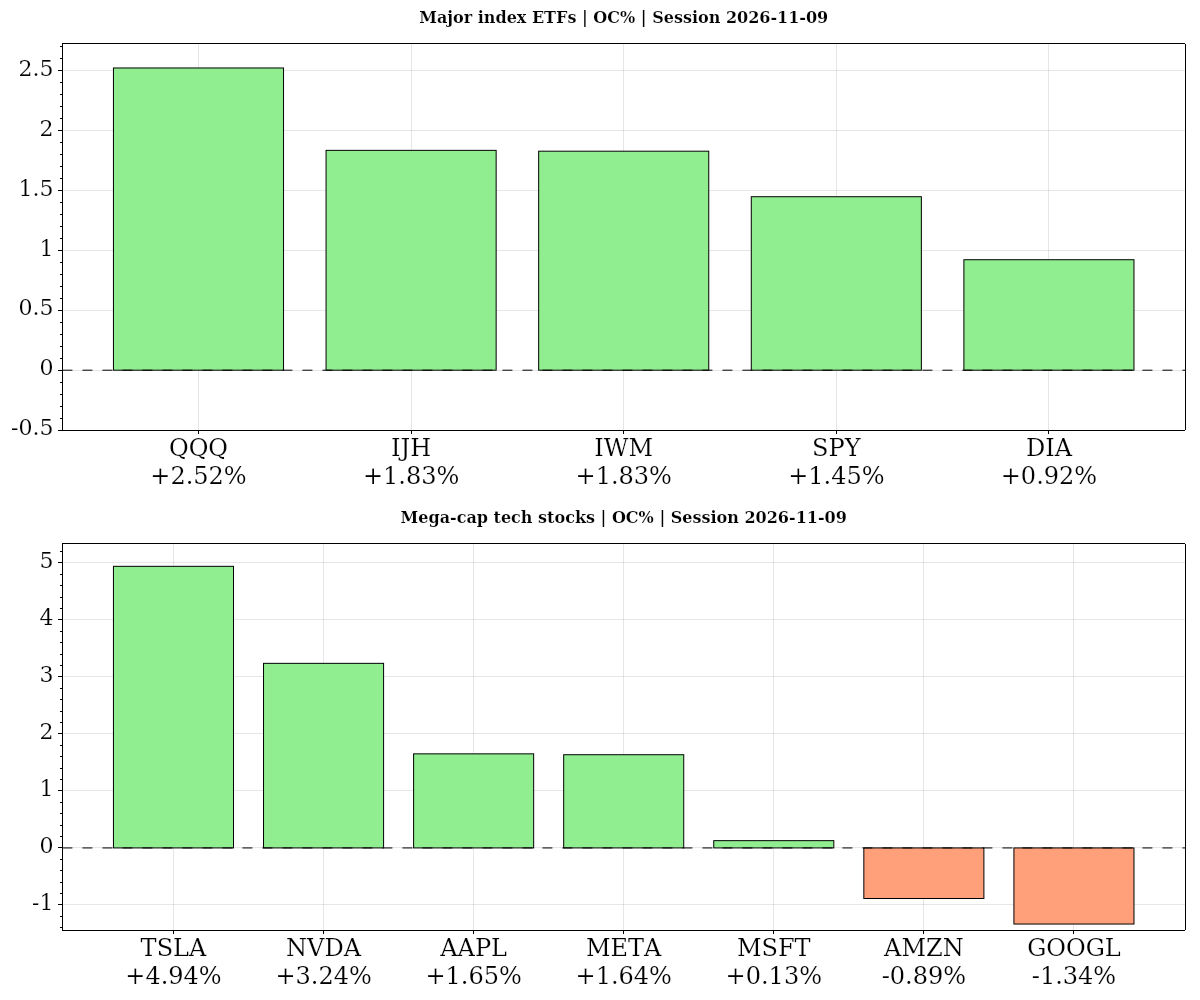
Monday 2026-11-09 — Session Summary
- MARA — Earnings · AMC
Stocks finished higher Monday, with technology participating in the rebound even as Nvidia’s decline and persistent scrutiny of AI investment kept the mood cautious ahead of Tuesday’s inflation report. The Nasdaq-100 ETF rose 2.52% from its open, while the S&P 500 ETF gained 1.45% on the same basis. Broader equity participation and Alphabet’s advance provided a counterweight to pressure on AI-related shares, but the rebound left the Nasdaq’s near- and medium-term technical trends bearish.
Nvidia remained the main company-specific concern. Its board, assisted by outside counsel, is investigating allegations involving Huang’s relationship and possible targeting by foreign intelligence. President Trump continued to defend Huang as reports of alleged Chinese intelligence involvement intensified scrutiny. Nvidia recovered 3.24% from its opening level but still finished 4.27% below its previous close, underscoring the distinction between Monday’s rebound and the stock’s continuing weakness. Questions about returns on AI spending added to pressure on technology and semiconductor shares. Elsewhere, Apple’s earnings beat helped support the broader earnings backdrop, while Ferguson exceeded earnings estimates, put full-year sales growth at the top of its previous guidance and raised its capital spending forecast to $375 million–$425 million.
Inflation and monetary policy remained central to positioning. The October CPI report, due Tuesday, November 10, was the next major macro catalyst, with a heavy lineup of Federal Reserve appearances also in focus. Last week’s stronger-than-expected U.S. economic data continued to frame the backdrop following Democrats’ congressional sweep. Monday’s calendar included Fed speeches, bill auctions and a $58 billion three-year Treasury note auction, keeping government debt supply alongside the policy outlook on investors’ radar.
Cross-market moves were mixed when measured against the open and the previous close. Gold gained 0.35% from the open. Oil edged up 0.08% during the session but remained 3.87% below its prior close. Long-dated Treasury bonds fell 0.36% from the open, though they ended marginally above their previous close. Those divergent comparisons accompanied an equity recovery that had yet to reverse the Nasdaq’s bearish technical conditions.
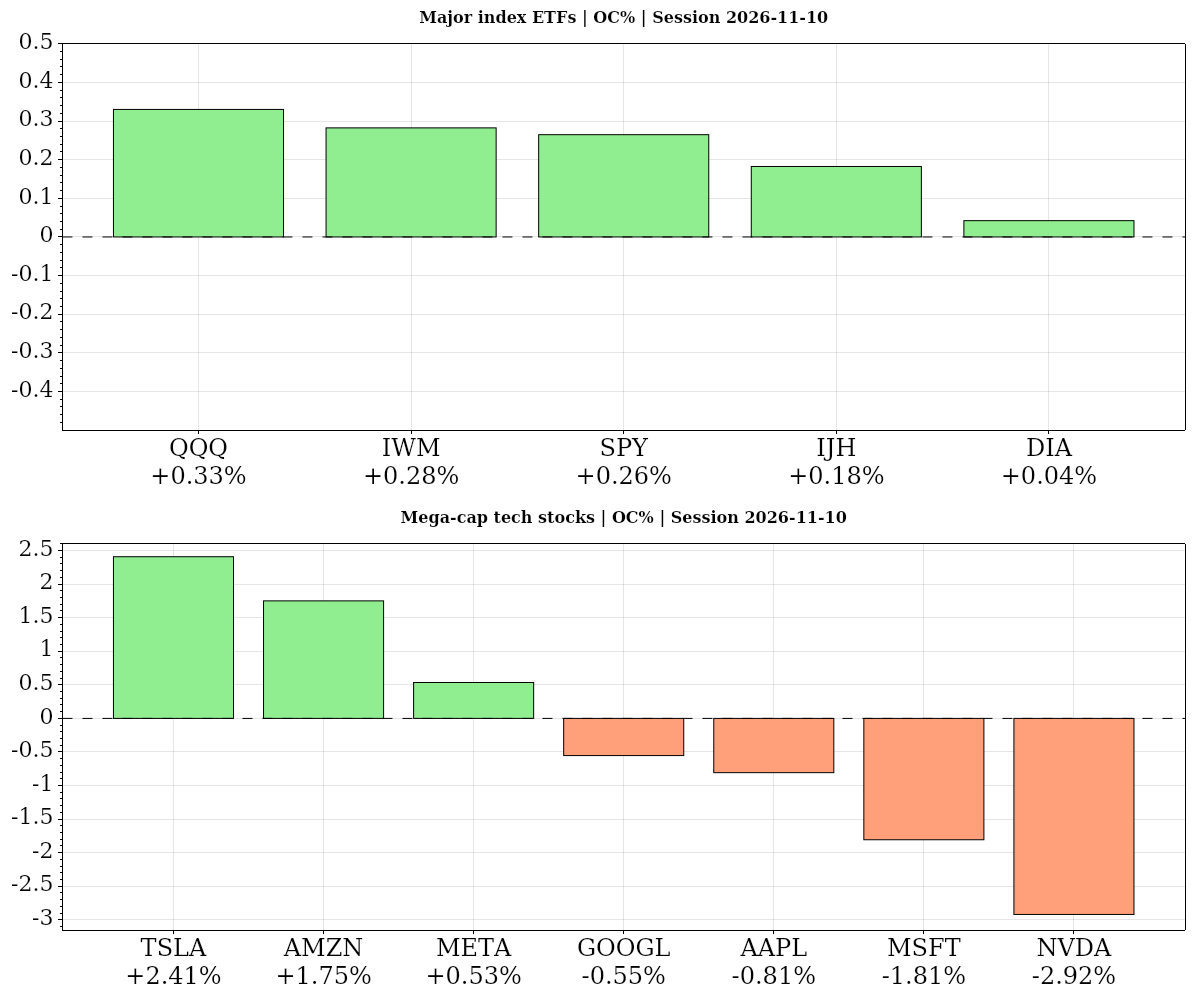
Tuesday 2026-11-10 — Session Summary
- FOMC Member Waller Speaks — 04:00 ET · Medium
- Core CPI m/m — 08:30 ET · High
- CPI m/m — 08:30 ET · High
U.S. stocks finished lower Tuesday despite recovering from their opening levels, as Nvidia’s deepening selloff and renewed concern about interest-rate increases weighed on technology shares. The S&P 500 ETF gained 0.26% from its open but closed 0.37% below its previous finish, while the Nasdaq-100 ETF rose 0.33% from the open and ended down 0.68% on the day. The recovery left both benchmarks short of erasing their losses, with technology-sector stress outweighing positive developments involving Amazon and Anthropic.
Nvidia remained at the center of the pressure, falling 2.92% from its open on heavy volume amid governance scrutiny, litigation and concerns about chip exports. Reports alleged that Nvidia-linked connections helped facilitate $7.5 billion in restricted chip shipments to China. Those allegations, including scrutiny involving Huang, were accompanied by growing legislative momentum for tighter export restrictions. The combination reinforced broader AI-sector anxiety, even as the Amazon and Anthropic news offered a counterpoint.
Inflation and monetary policy supplied the other major source of strain. Headline consumer prices rose 0.4% month over month in October, while core CPI increased 0.3%, both above forecasts. The hotter readings boosted rate-hike bets, and hawkish Federal Reserve commentary reinforced that repricing. Governor Christopher Waller warned that a hot report required consideration of an increase larger than a quarter point, while Governor Michelle Bowman said there was still work to do on inflation. Tariffs remained part of the inflation debate: the White House defended maintaining them despite backlash over rising prices, while former economic adviser Gary Cohn said American consumers were bearing the cost.
Treasury and currency developments reflected the renewed focus on rates. A $42 billion 10-year Treasury auction yielded 5.02%, and far-term Treasury ETFs declined from their opens. Separate three-year auction results showed foreign-linked buyers taking their smallest share in 15 months, although dealers retained almost none of the offering. U.S. CPI also strengthened the dollar, pushing the Canadian dollar to a near four-week low. In commodities, the oil ETF rose 2.00% from its open but remained below its prior close, while gold declined from its opening level.
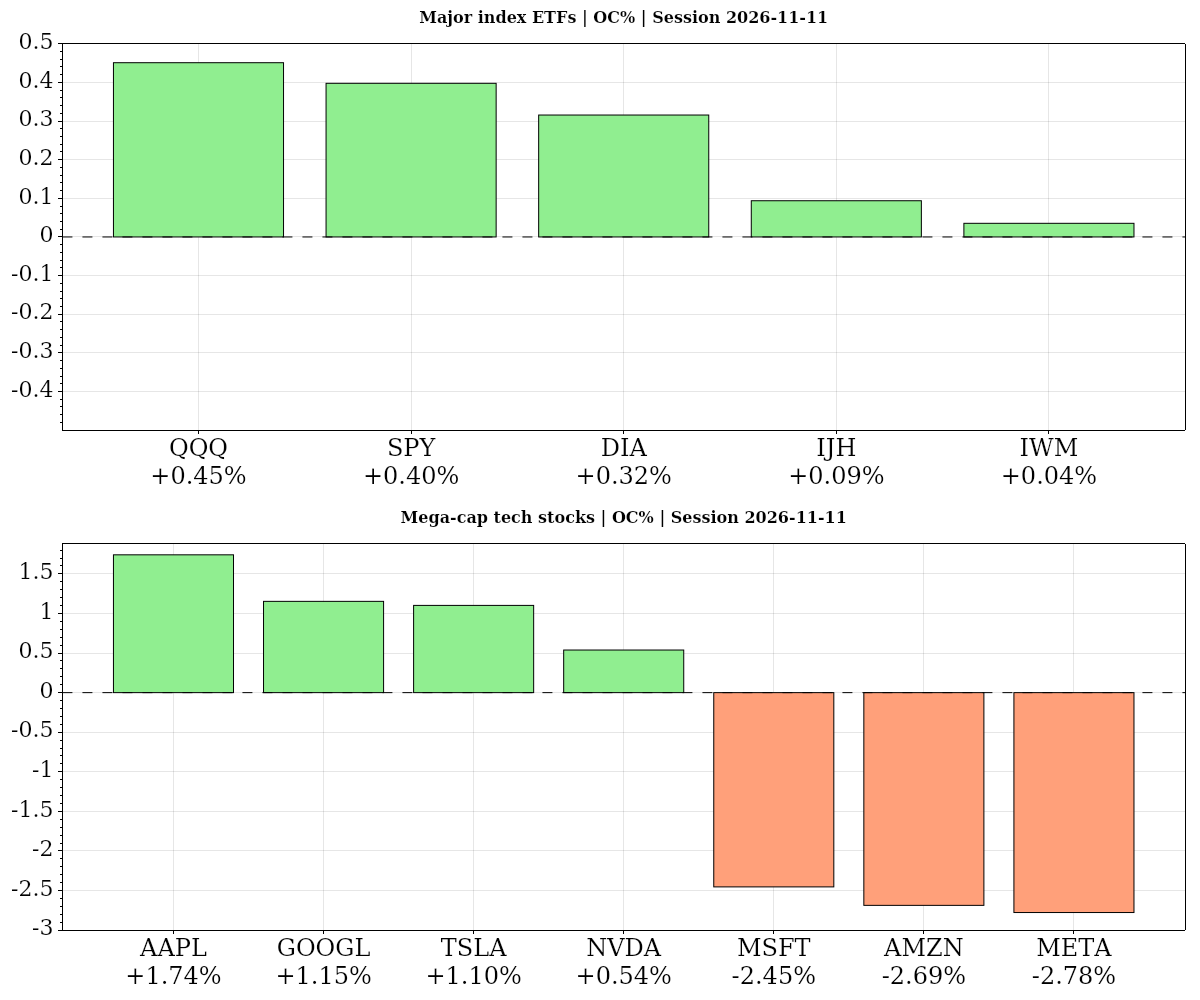
Wednesday 2026-11-11 — Session Summary
Stocks finished higher Wednesday, with technology shares advancing despite Nvidia-related scrutiny and persistent inflation concerns. The S&P 500 ETF gained 0.40% from its open, while the Nasdaq-100 ETF added 0.45%. The advance did not reverse bearish medium-term trends, and heavyweight technology performance was mixed: Apple rose, while Amazon, Meta and Microsoft declined. Strong cloud demand and supportive options commentary helped counter negative technology headlines, leaving the broader tone cautious rather than decisively bullish.
Nvidia remained central to earnings positioning and index risk. Its November 17 earnings represent a significant concentration event given its nearly 8% weight in the S&P 500. Investigation and downgrade headlines added to scrutiny, while House Republicans reportedly were preparing to subpoena Jensen Huang over allegations involving a suspected Chinese spy. Separately, reports of congressional pressure for a complete ban on advanced semiconductor sales to China raised policy risks for the sector. Those concerns stood alongside continued cloud growth, which provided a counterweight to the negative coverage.
Inflation and dollar strength dominated the macro backdrop. Gold fell 1.13% and slipped below $4,000 an ounce as the dollar strengthened following earlier hot CPI data. Persistent price pressures reinforced commentary around a continued Federal Reserve tightening bias, while analysts identified $3,900 as a further downside level for gold amid selling pressure. Bonds nevertheless gained, with the far-term Treasury ETF rising 0.21% from its open.
Energy trading offered another reminder that softer prices do not necessarily resolve broader inflation concerns. The oil ETF slipped 0.83% from its open but ended 0.01% above its previous close. Meanwhile, the EIA raised its 2027 gasoline price forecast by 5% from the previous month, citing global petroleum supply constraints and wider crack spreads. Inflation commentary continued to emphasize that falling gasoline prices alone would not eliminate underlying price pressures.
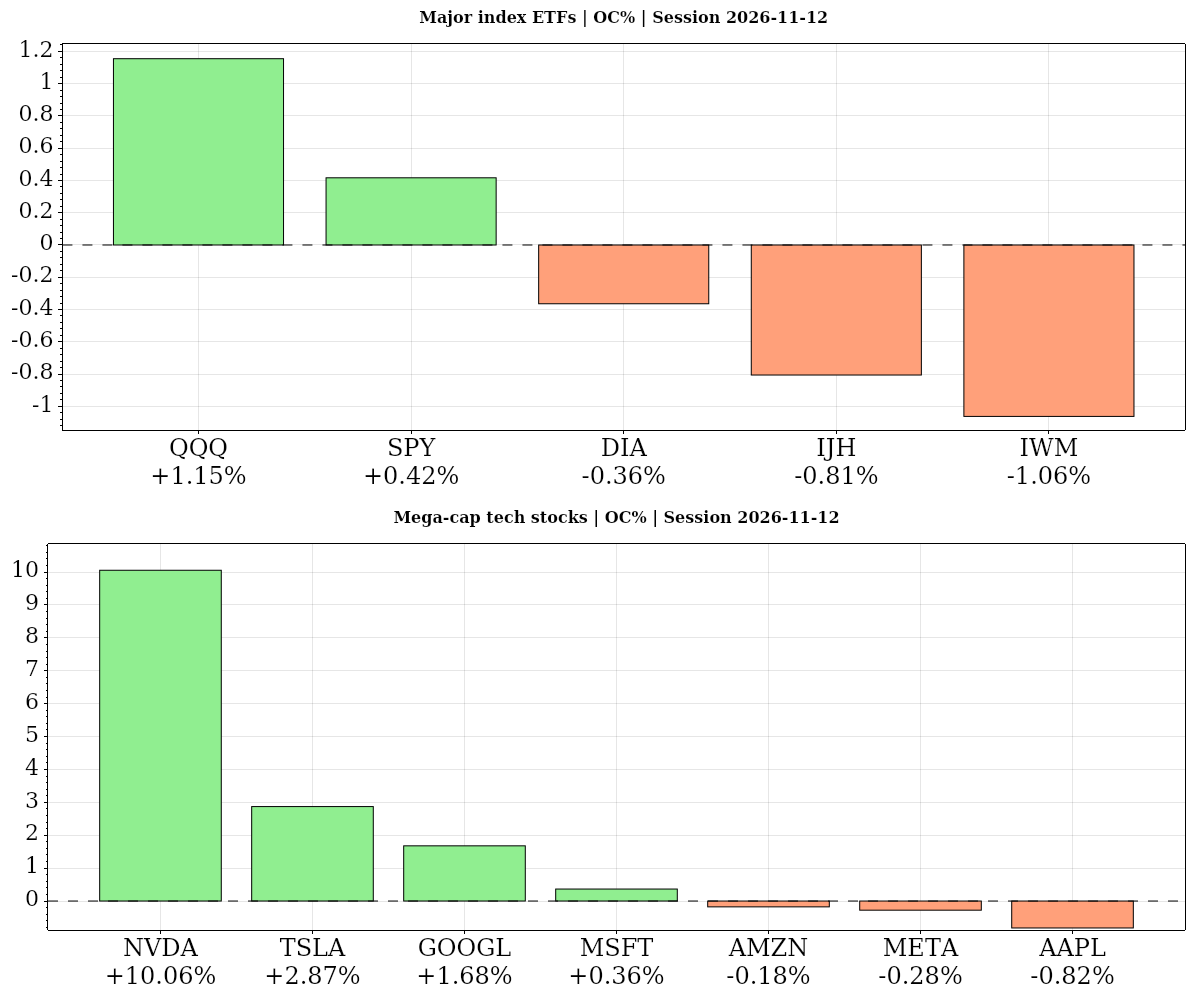
Thursday 2026-11-12 — Session Summary
- Initial Jobless Claims — 08:30 ET · Medium
- Fed's Hammack speech — 09:00 ET · Medium
- Fed's Barr speech — 10:00 ET · Medium
- Existing Home Sales Change (MoM) — 10:00 ET · Medium
- Fed's Goolsbee speech — 11:15 ET · Medium
- 4-Week Bill Auction · $115B — 11:30 ET · Medium
- 8-Week Bill Auction · $110B — 11:30 ET · Medium
- EIA Crude Oil Stocks Change — 12:00 ET · Low
- 30-Year Bond Auction · $25B — 13:00 ET · High
- 17-Week Bill Auction · $75B — 13:00 ET · Medium
- Fed's Daly speech — 13:10 ET · Medium
- Fed's Schmid speech — 13:30 ET · Medium
- Monthly Budget Statement — 14:00 ET · Medium
- Fed's Williams speech — 18:30 ET · Medium
U.S. equity benchmarks finished lower Thursday despite recovering from the open, as Nvidia’s sharp decline and broader AI-stock selling weighed on sentiment. The S&P 500 and Nasdaq-100 ETFs gained 0.42% and 1.15%, respectively, from their opening levels, but still closed 0.35% and 0.32% below their previous closes. Small caps also weakened. Retail buying and pockets of semiconductor resilience offered some support, although the technical backdrop remained unsettled, with near-term recoveries in stock-index futures occurring within unresolved corrections.
Nvidia’s leadership departure and China-related scrutiny were the principal equity-market drivers. Its shares rebounded 10.06% from the open but nevertheless ended down 4.34% against the prior close, while losses in Nebius extended the pressure across AI infrastructure stocks. Nvidia retained outside investigators to examine allegations that Jensen Huang had been targeted by a foreign intelligence effort. Separately, federal prosecutors were reportedly investigating whether Alice Huang participated in moving Super Micro Computer products into China. Alibaba and other Chinese stocks faced pressure as scrutiny of access to U.S. technology intensified. A Democratic senator’s request for an assessment of whether Nvidia is too big to fail also put technology-sector concentration in focus.
Economic data and policy commentary added to the backdrop. Initial jobless claims came in at 200,000, above the 195,000 expected. Treasury bonds fell, with the far-term Treasury ETF losing 1.28% from the open, while a $25 billion auction of 30-year Treasuries yielded 5.441%. Fed official Mary Daly said the central bank had time to calibrate rate hikes, and Williams was scheduled to speak at 6:30 p.m. ET.
Energy outperformed precious metals. The oil ETF advanced 2.84% from the open, while the gold ETF fell 0.76%. Gold traded back below $4,000 an ounce following a reported 13% decline. Longer-term demand commentary remained supportive, with BlackRock highlighting continuing demand for gold and silver and Société Générale estimating $3.3 billion in potential gold index-rebalancing purchases in early 2027.
Friday 2026-11-13 — Session Summary
- Producer Price Index ex Food & Energy (MoM) — 08:30 ET · High
- Producer Price Index (MoM) — 08:30 ET · High
- Producer Price Index (YoY) — 08:30 ET · Medium
- Producer Price Index ex Food & Energy (YoY) — 08:30 ET · High
- Fed's Goolsbee speech — 08:45 ET · Medium
- Fed's Daly speech — 09:00 ET · Medium
- Fed's Logan speech — 09:45 ET · Medium
- Fed's Collins speech — 10:30 ET · Medium
- Fed's Bowman speech — 10:50 ET · Medium
- Fed's Jefferson speech — 19:00 ET · Medium
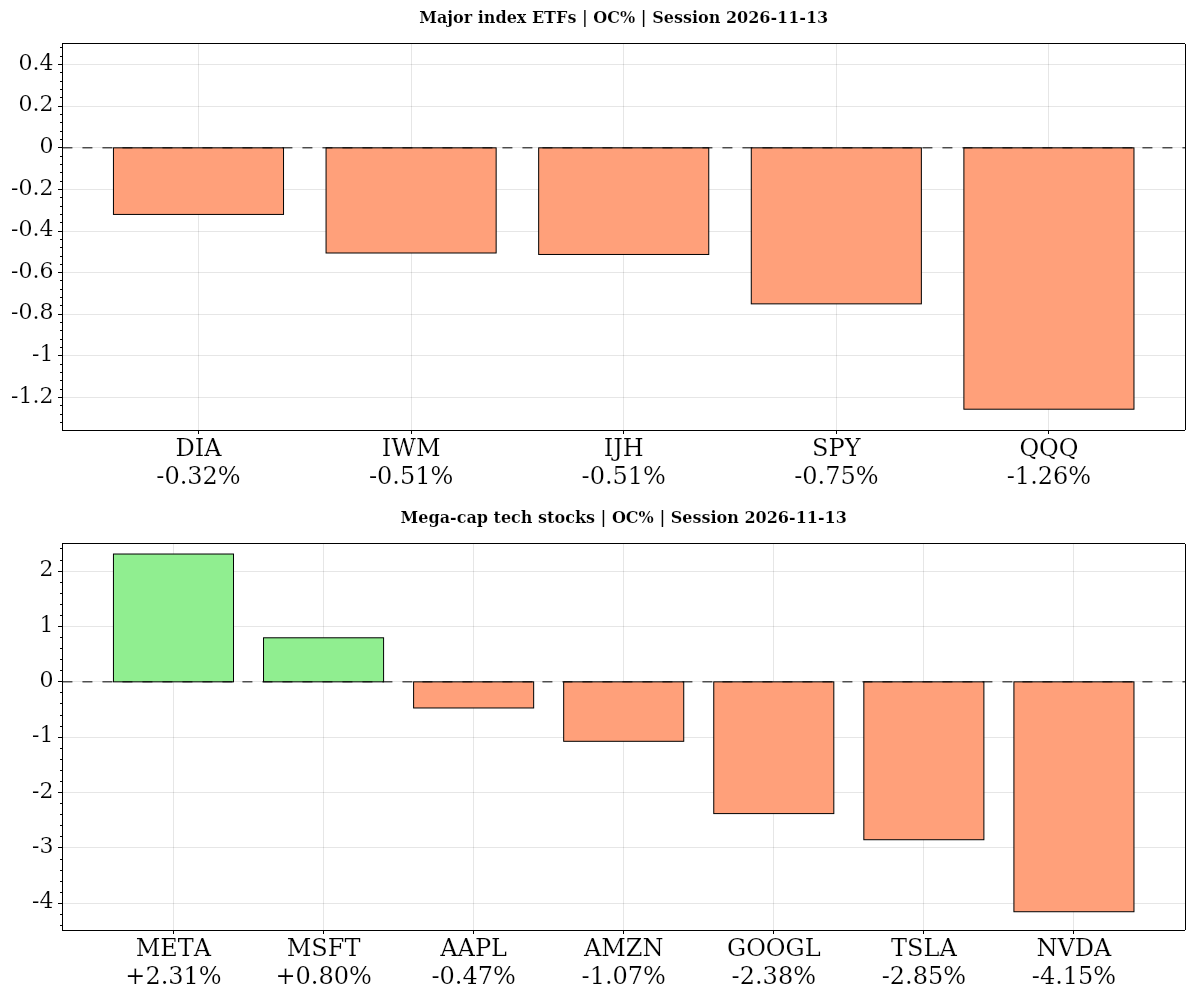
Stocks finished lower Friday as Nvidia’s leadership uncertainty and broader semiconductor selling weighed on technology shares and the wider market. The S&P 500 ETF fell 0.75% from its open, while the Nasdaq-100 ETF lost 1.26%. Nvidia dropped 4.15% on the same basis, with its substantial S&P 500 weight extending the impact beyond the chip sector. There were selective offsets: Apple gained 0.99%, Microsoft recovered after a service outage, and Meta rose 2.31% from its open. The overall tone remained cautious, with pressure across AI-related shares and selective defensive rotation.
Nvidia’s leadership transition also sharpened concerns about the outlook for chip sales to China. Chinese technology stocks faced pressure as investors prepared for tighter restrictions following the departure of Huang, an influential advocate for sales to Chinese companies. The weakness in AI shares contrasted with continued large-scale infrastructure commitments, including SpaceX’s announced plans to spend more than $74 billion on two AI supercomputing campuses in Texas and Arizona. Opposition to an Arizona permit, reflected in a petition with 2,400 signatures, highlighted a separate risk surrounding that investment.
Inflation and monetary policy remained another important constraint. Monthly producer prices rose 0.3%, below the 0.4% forecast, while core PPI matched expectations. That softer headline reading did not displace concerns following hotter-than-anticipated inflation data earlier in the week, which had pushed stock futures lower Tuesday and intensified expectations of a December rate increase. Federal Reserve Governor Christopher Waller had signaled that such an increase was probable. Vice Chair Jefferson’s speech was still scheduled for 7 p.m. ET, after Friday’s cash-equity close.
Oil and gold eased from their opening levels, with their ETFs down 0.76% and 0.23%, respectively. Gold nevertheless ended 0.16% above its prior close, against a broader backdrop in which bullion had broken below $4,000 an ounce and erased the previous week’s gains amid persistent inflation and higher-rate concerns. Long-dated Treasuries rose 0.10% from the open but finished 0.43% below their previous close. Equity futures charts continued to show volatile rebounds within unresolved U.S. market corrections, leaving Friday’s technical backdrop unsettled.
Futures Higher Time Frame Analysis
Summary of the current state of US Indices Futures based on higher time-frame (HTF) technical analysis as of: 2026-11-14 11:30 -06:00 CT.
US Indices Futures
- ES bullish YSFG/WSFG, bearish MSFG, falling intermediate benchmarks, daily pivots recovering, support 7322.25, resistance 7651.75–7699.75, weekly reversal threshold 7683.25.
- NQ bullish YSFG/WSFG, bearish MSFG, falling intermediate/daily long-term benchmarks, corrective pivots, support 26366.50, resistance 28574–28796, daily reversal threshold 27034.50.
- YM bullish YSFG/MSFG/WSFG, rising 200-day benchmark, declining intermediate benchmarks, lower medium-term pivot highs, support 50859–50891, resistance 52850–52888, weekly reversal threshold 53377.
- EMD bullish YSFG/MSFG/WSFG, mixed benchmarks, lower daily pivot highs, support 3560.7, resistance 3706.7–3709.5 then 3750.3–3770.1, weekly reversal threshold 3773.1.
- RTY bullish YSFG/WSFG, bearish MSFG, below all daily benchmarks, lower medium-term pivots, support 2714.2, resistance 2806.8–2819.8, daily reversal threshold 2754.6.
- FDAX bullish YSFG/MSFG/WSFG, above six rising benchmarks, rising daily pivots, resistance 27084, daily support 25695, weekly support 24925, reversal thresholds 26140 daily/25512 weekly.
Overall State
- Short-Term: Neutral
- Intermediate-Term: Bearish
- Long-Term: Bullish
Conclusion
US indices show correlated rebounds within unresolved corrections. Bullish WSFG readings contrast with bearish MSFG readings in ES, NQ and RTY; declining intermediate benchmarks and corrective pivots retain overhead resistance. Recent long signals accompany recoveries, while newer EMD and RTY short signals reflect renewed declines. YM retains stronger weekly structure; RTY remains the weakest daily structure. Bullish YSFG readings and rising long-term weekly benchmarks preserve the broader upward context, although NQ, EMD and RTY have bearish daily far-term ratings. FDAX shows the strongest cross-timeframe alignment, with rising benchmarks and pivots despite earlier short signals.
Note: Intra-day counter-trend pullbacks or retracements may occur, HTF is context for informational usage and market structure. Glossary: Session Fib Grids periods of YSFG:’Yearly’, MSFG:’Monthly’, WSFG:’Weekly’
For full details visit: AlphaWebTrader Technicals
SPY Weekly View
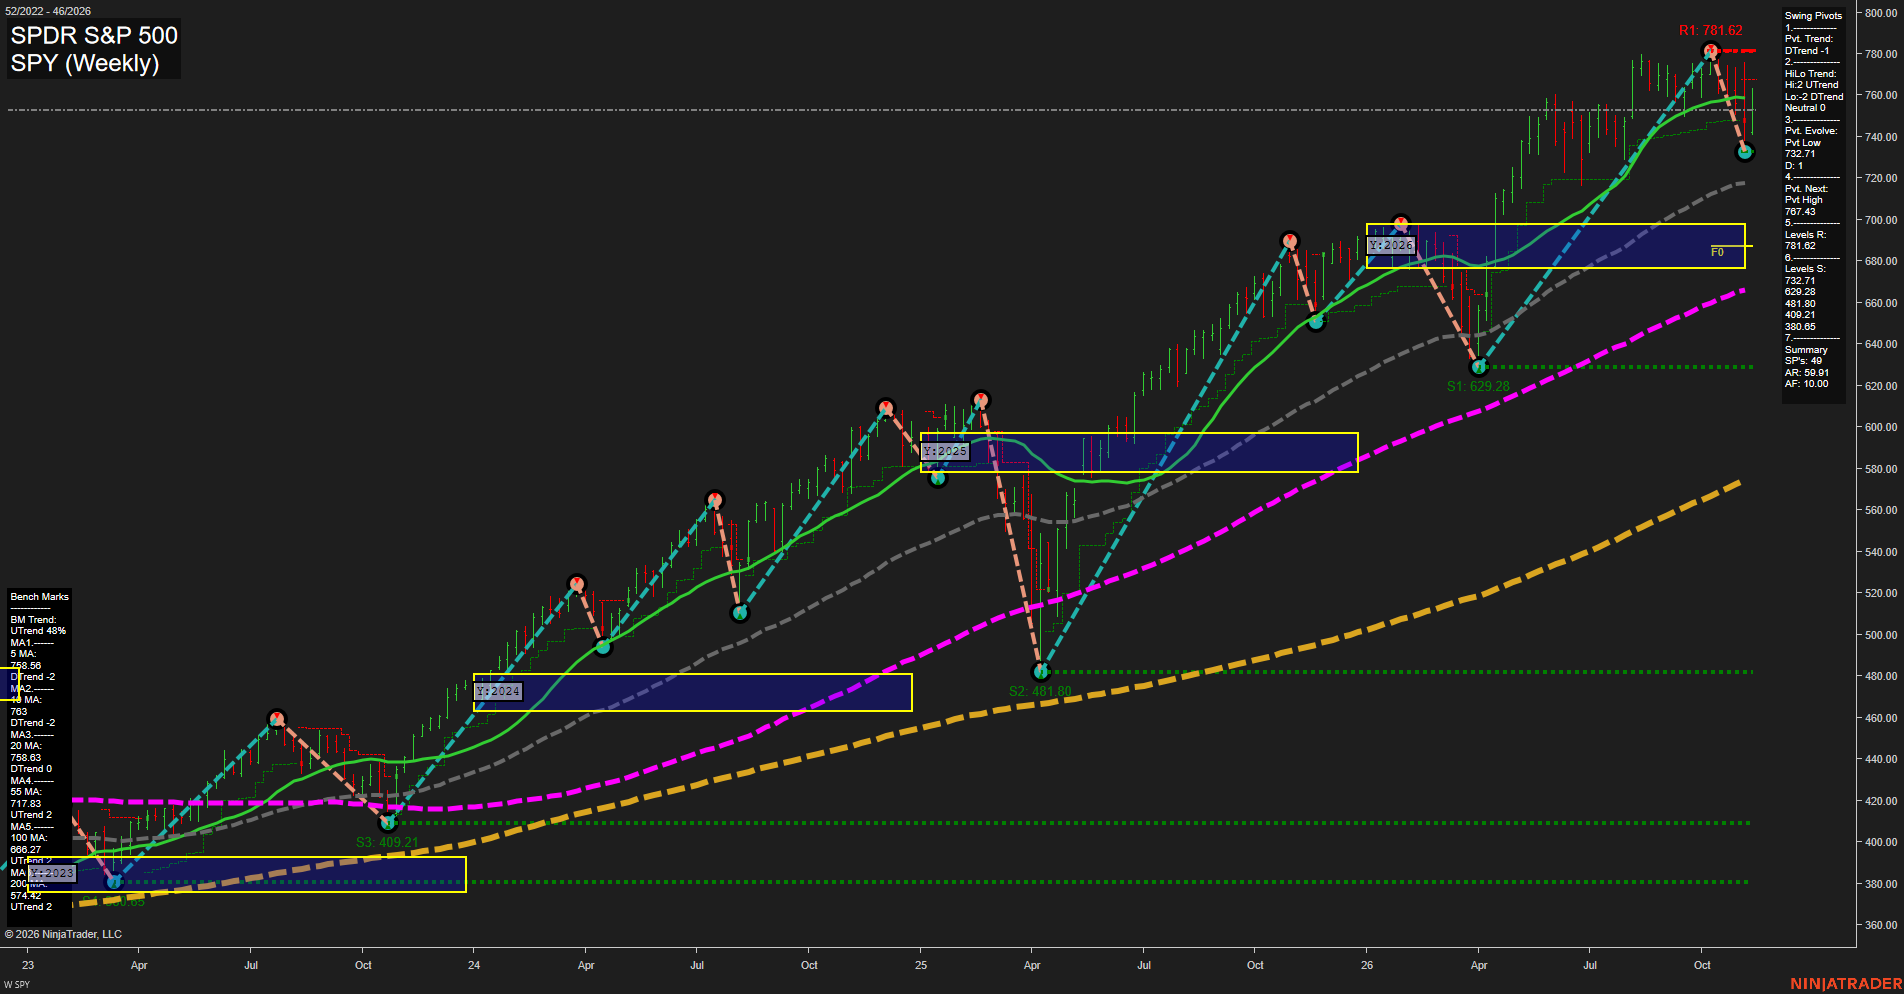
Overall Rating
- Near-Term: Bearish
- Medium-Term: Neutral
- Far-Term: Bullish.
Key Insights Summary
From a futures swing-trader perspective, the chart shows a fast corrective downswing within a broader rising market. The decline from 781.62 to the evolving 732.71 pivot represents approximately 6.3%, interrupting the preceding rally. Price is below the 5-, 10- and 20-week benchmarks but remains above the rising 55-, 100- and 200-week benchmarks. This separates near-term bearish momentum from the still-bullish longer-term structure. The 758.56–767.43 area groups benchmark resistance with the next-pivot reversal threshold; 781.62 remains the overhead swing high. The evolving 732.71 low and 717.83 benchmark frame the immediate downside structure, while the yearly neutral zone around 677–698 sits farther below. Mixed high/low pivot trends support a medium-term consolidation interpretation rather than a confirmed broad downtrend. The specified USAR signals and weekly/monthly grids are not visible, so they cannot confirm these ratings. These are SPY reference prices, not futures contract levels; no news or seasonal catalyst is established by the image.
View charts on: AlphaWebTrader HTF Charts
ES Weekly View
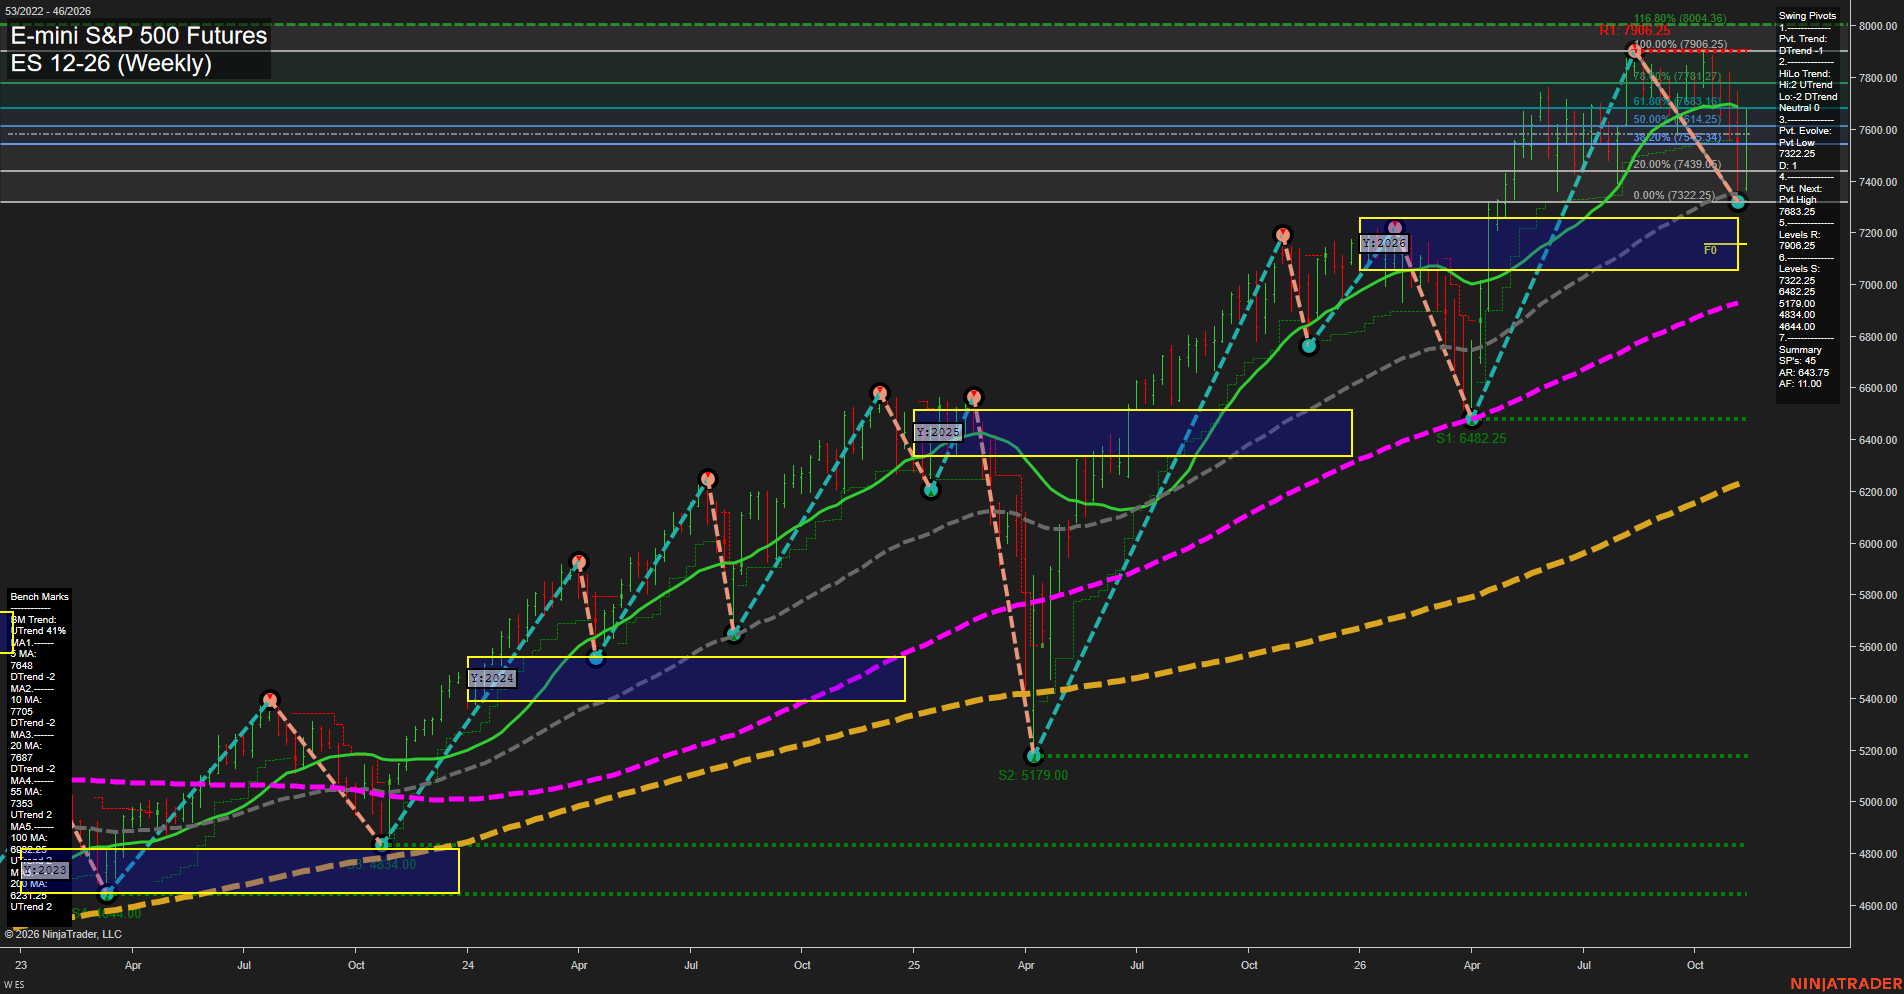
Overall Rating
- Near-Term: Bearish
- Medium-Term: Neutral
- Far-Term: Bullish.
Key Insights Summary
The weekly chart depicts a volatile correction within a broader advancing trend. The rebound from 7322.25 has recovered part of the decline from 7906.25, but price remains beneath the falling 5-, 10- and 20-week benchmarks. Near-term evidence therefore remains bearish overall despite an upward weekly grid and the newer TR120 long signal. Medium-term conditions are mixed: the monthly grid points down, the latest MSFG signal points long, and the pivot summary reports opposing high/low trends. The 7648–7705 benchmark cluster and 7683.25 pivot-reversal threshold define overhead technical resistance ahead of 7906.25. Support is concentrated around the rising 55-week benchmark at 7353 and the evolving low at 7322.25. Price above the yearly neutral zone and rising 100- and 200-week benchmarks preserves the bullish far-term structure. No TR720 signal or verified news catalyst is supplied; the chart supports a corrective rebound interpretation rather than a confirmed return to an uninterrupted advance.
View charts on: AlphaWebTrader HTF Charts
QQQ Weekly View
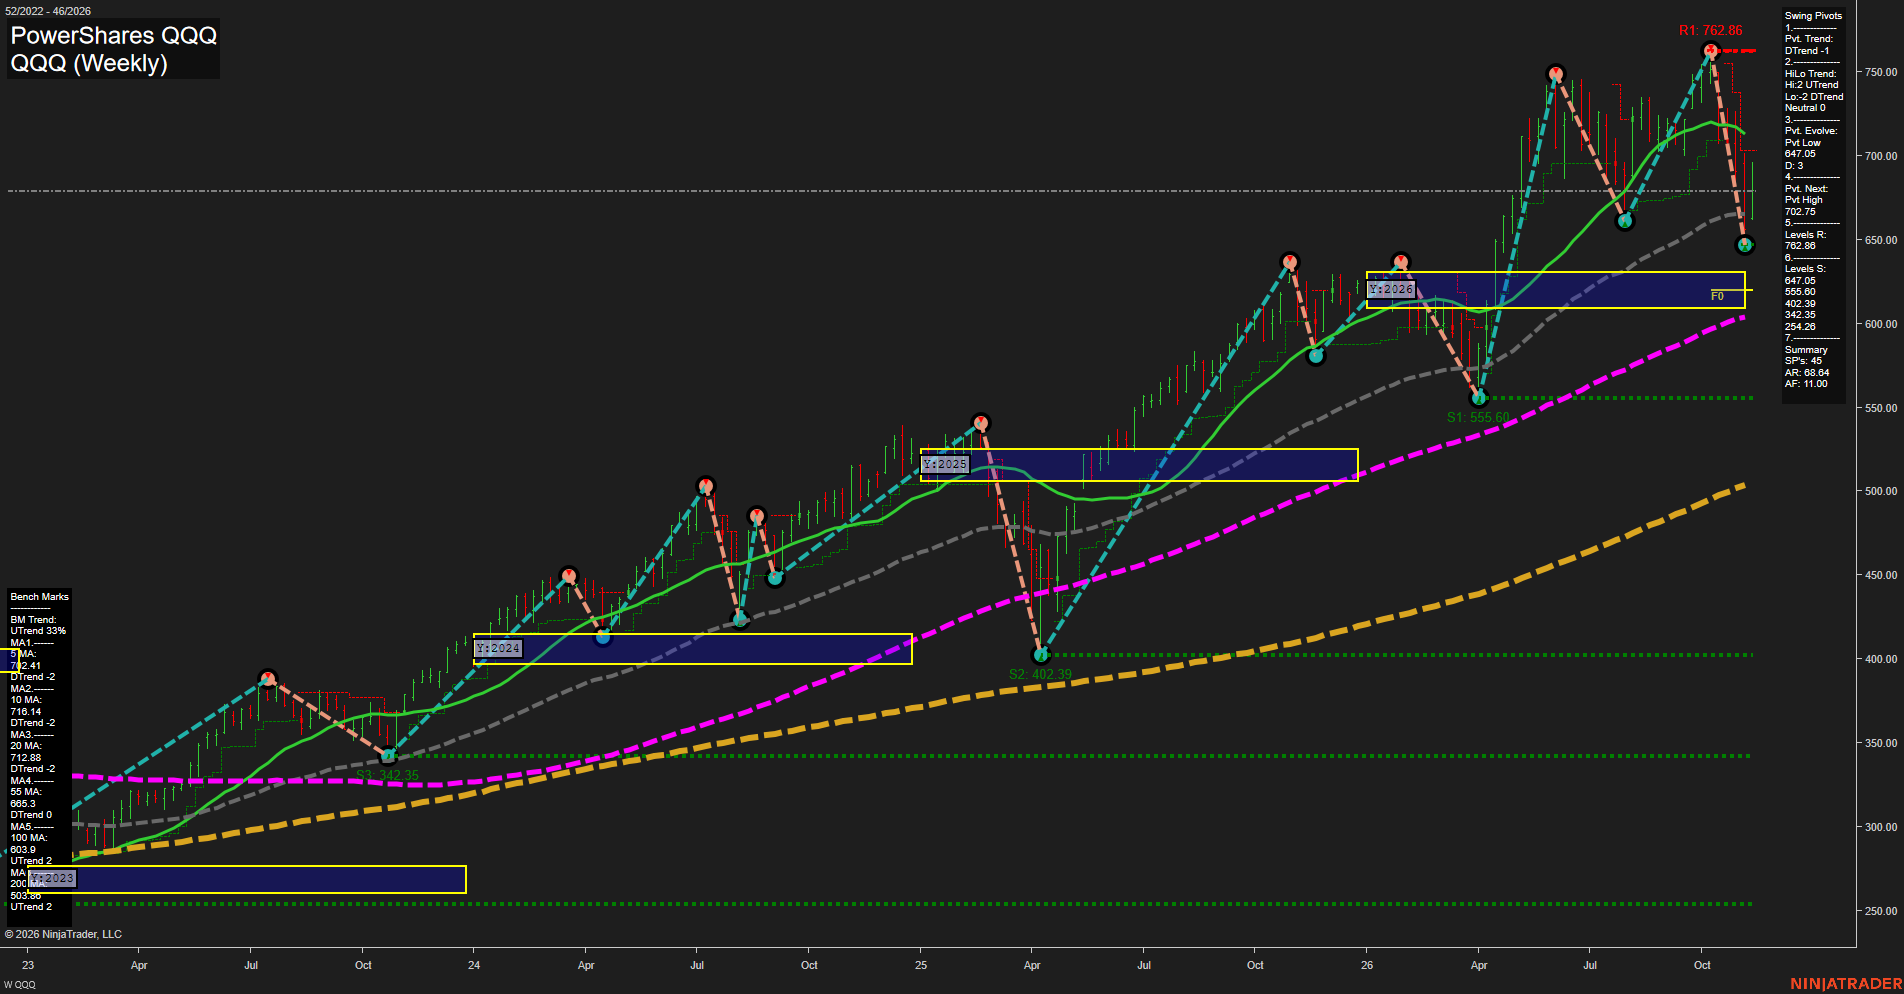
Overall Rating
- Near-Term: Bearish
- Medium-Term: Bearish
- Far-Term: Bullish.
Key Insights Summary
From a futures swing-trader perspective, QQQ depicts a sharp corrective downswing within a still-rising long-term structure, rather than a confirmed bullish reversal. The decline from 762.86 to the evolving 647.05 low undercut the preceding swing low, producing mixed medium-term pivot structure and wider two-way price swings. The rebound toward 680 has recovered the 55-week benchmark but remains below the declining 5-, 10- and 20-week benchmarks; 702.75 is the summary’s next pivot-reversal threshold. The 100- and 200-week averages continue rising beneath price, supporting the bullish far-term rating. Although the required grid fields remain neutral placeholders, price is visibly above the 2026 yearly NTZ, approximately 610–631. Weekly and monthly grids and the specified recent signal studies are not visible, so their directional readings cannot be verified. These are QQQ reference levels, not Nasdaq futures contract prices; the chart alone does not establish news or seasonal drivers.
View charts on: AlphaWebTrader HTF Charts
NQ Weekly View
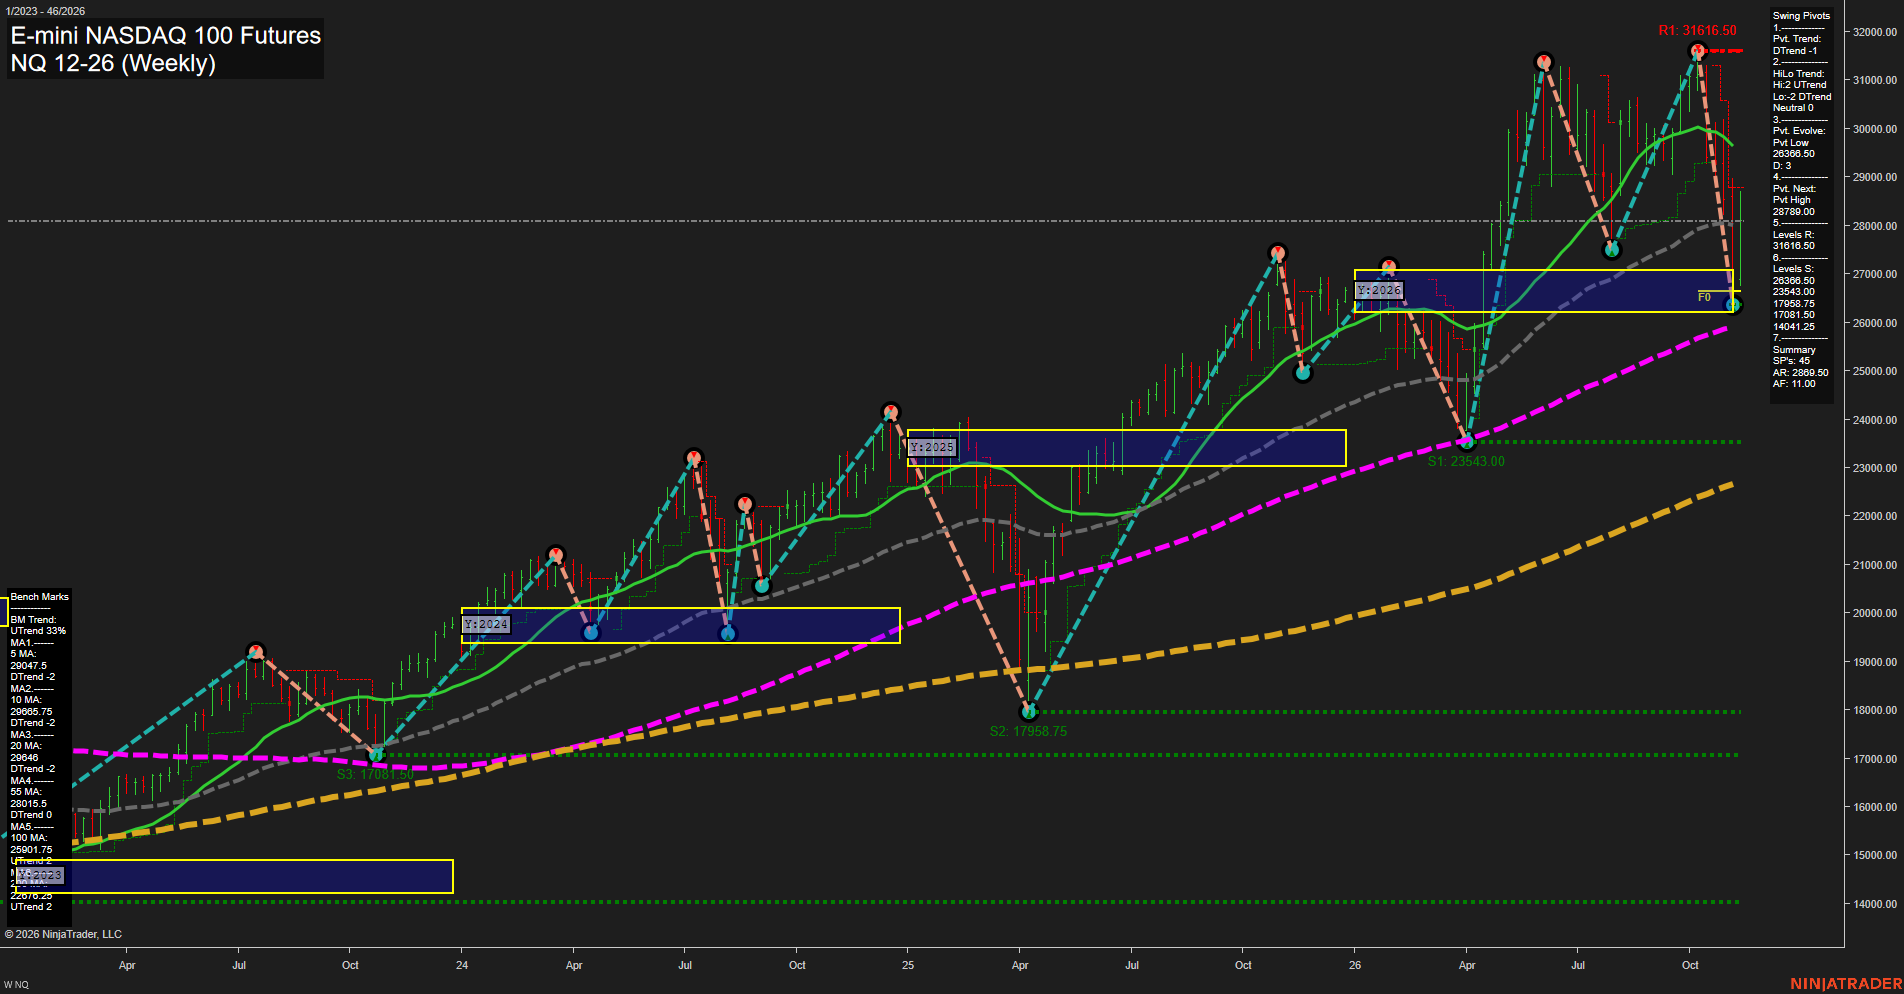
Overall Rating
- Near-Term: Neutral
- Medium-Term: Bearish
- Far-Term: Bullish.
Key Insights Summary
The weekly chart shows a fast rebound from the evolving pivot low near 26366.50 following a sharp decline from 31616.50. Price has recovered above the yearly neutral zone and is approximately testing the 55-week benchmark, but remains below the declining 5-, 10-, and 20-week averages. Bullish weekly-grid readings and the two supplied long signals contrast with the continuing downward pivot trend, leaving the near-term picture mixed. The 28789.00 opposite-pivot threshold remains above the latest price. Medium-term conditions remain corrective, with a negative November grid and divergent high/low pivot trends indicating an expanding, volatile structure rather than an orderly uptrend. Far-term conditions remain bullish above rising 100- and 200-week benchmarks. The current pattern is therefore a rebound within a broader correction, not yet a confirmed continuation toward the record pivot high. No medium- or far-term trade signals or news catalysts are supplied, and the chart alone does not establish a seasonal driver.
View charts on: AlphaWebTrader HTF Charts
USO Weekly View
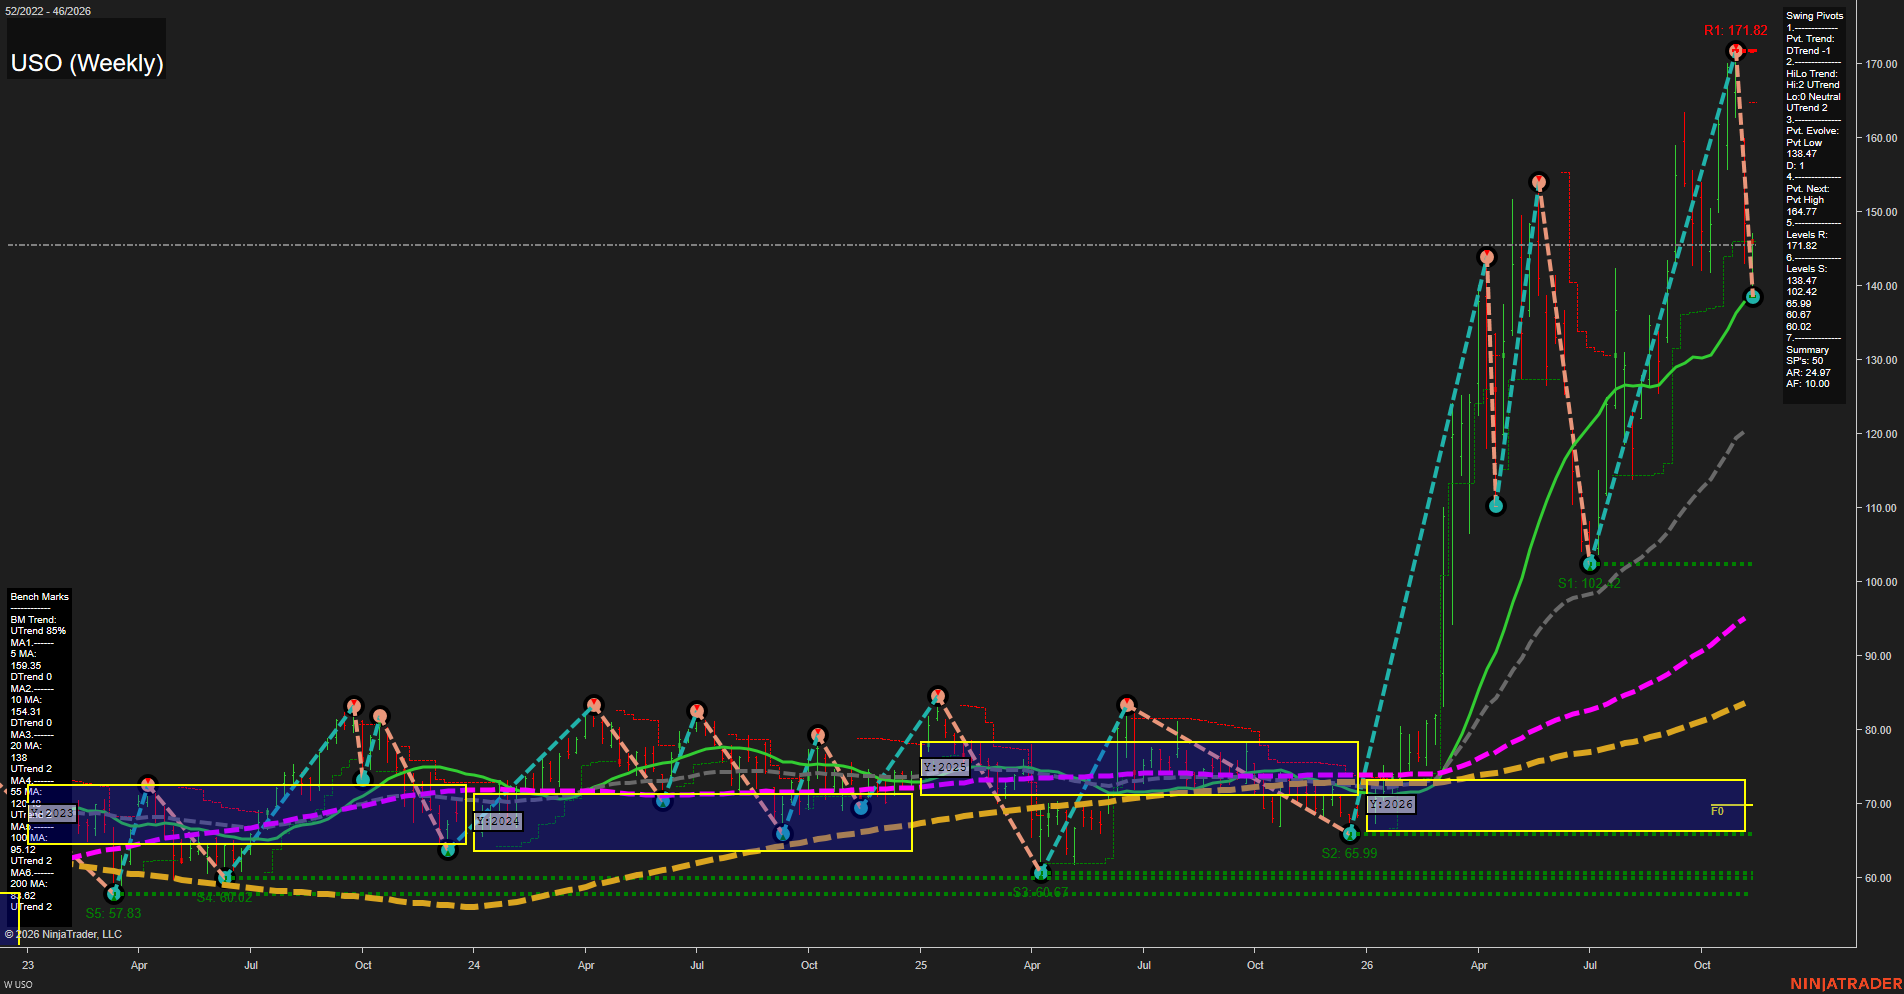
Overall Rating
- Near-Term: Bearish
- Medium-Term: Bullish
- Far-Term: Bullish.
Key Insights Summary
From a futures swing trader’s perspective, USO shows a fast countertrend correction within a broader advancing structure. The retreat from 171.82 reached an evolving pivot low at 138.47, approximately a 19% peak-to-low decline, before price recovered toward 145.50. Price remains below falling 5- and 10-week benchmarks but above the rising 20-week benchmark, making the 138.00–138.47 area the central technical reference for the current pullback. The medium-term higher-pivot structure remains positive, while rising 55-, 100-, and 200-week averages support the broader bullish classification. Price is also substantially above the yearly neutral zone. Large weekly ranges and repeated sharp reversals characterize an elevated-volatility market rather than a smooth trend. Weekly and monthly grids and the named recent-signal studies are not visible; their neutral entries represent unavailable confirmation. The chart alone does not establish news or seasonal drivers. USO is an oil-futures-linked fund, so these price levels refer to fund shares, not directly to crude-oil futures.
View charts on: AlphaWebTrader HTF Charts
CL Weekly View
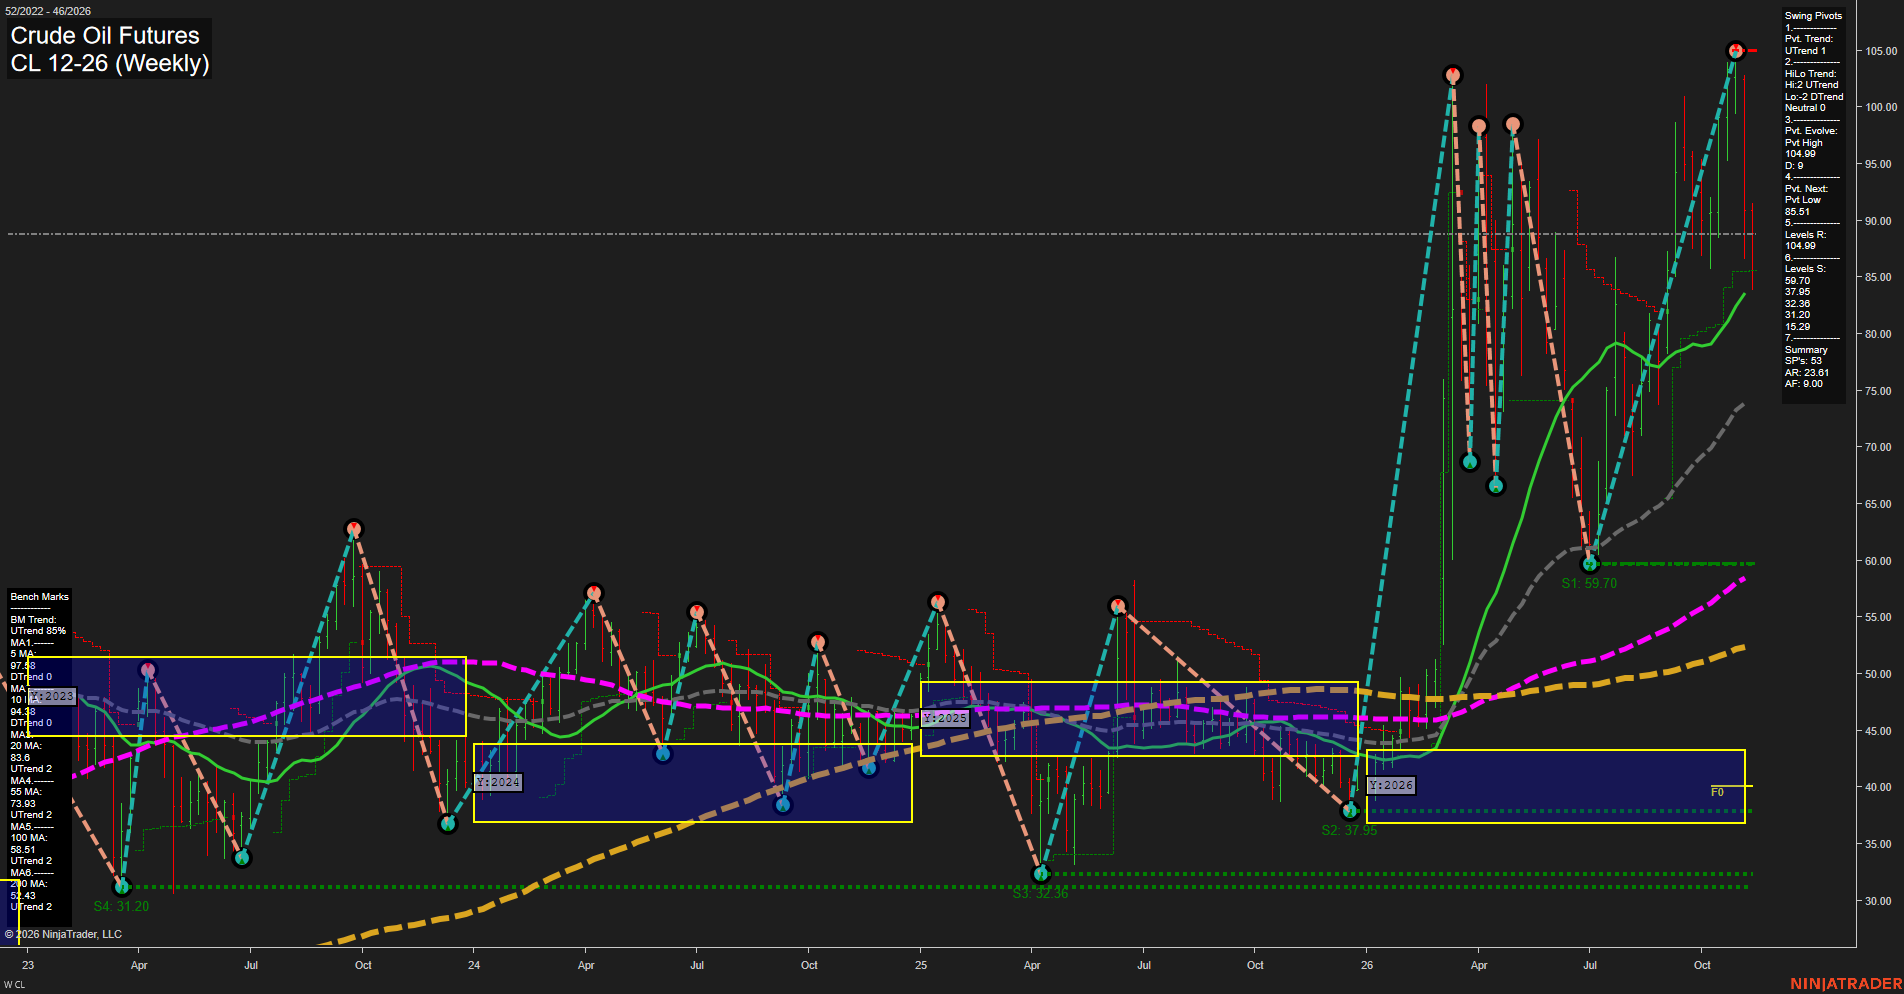
Overall Rating
- Near-Term: Bearish
- Medium-Term: Neutral
- Far-Term: Bullish.
Key Insights Summary
The weekly chart shows a sharp retracement from 104.99 within a broader rising trend. Large bars and repeated wide swings characterize an unusually volatile, two-way market rather than a smooth trend continuation. Price is below the declining 5- and 10-week benchmarks, consistent with bearish weekly and monthly grids, although the latest TR120 long signal introduces a countertrend recovery element. The pivot trend remains formally upward, with 85.51 identified as the next downside pivot reversal threshold. Medium-term evidence is mixed: higher pivot highs coexist with lower pivot lows, while price remains above rising 20- and 55-week benchmarks. Far-term structure remains bullish, supported by the positive yearly grid and rising 100- and 200-week averages. The principal technical theme is a near-term selloff inside a longer-term advance; the chart alone does not establish a news or seasonal explanation.
View charts on: AlphaWebTrader HTF Charts
GLD Weekly View
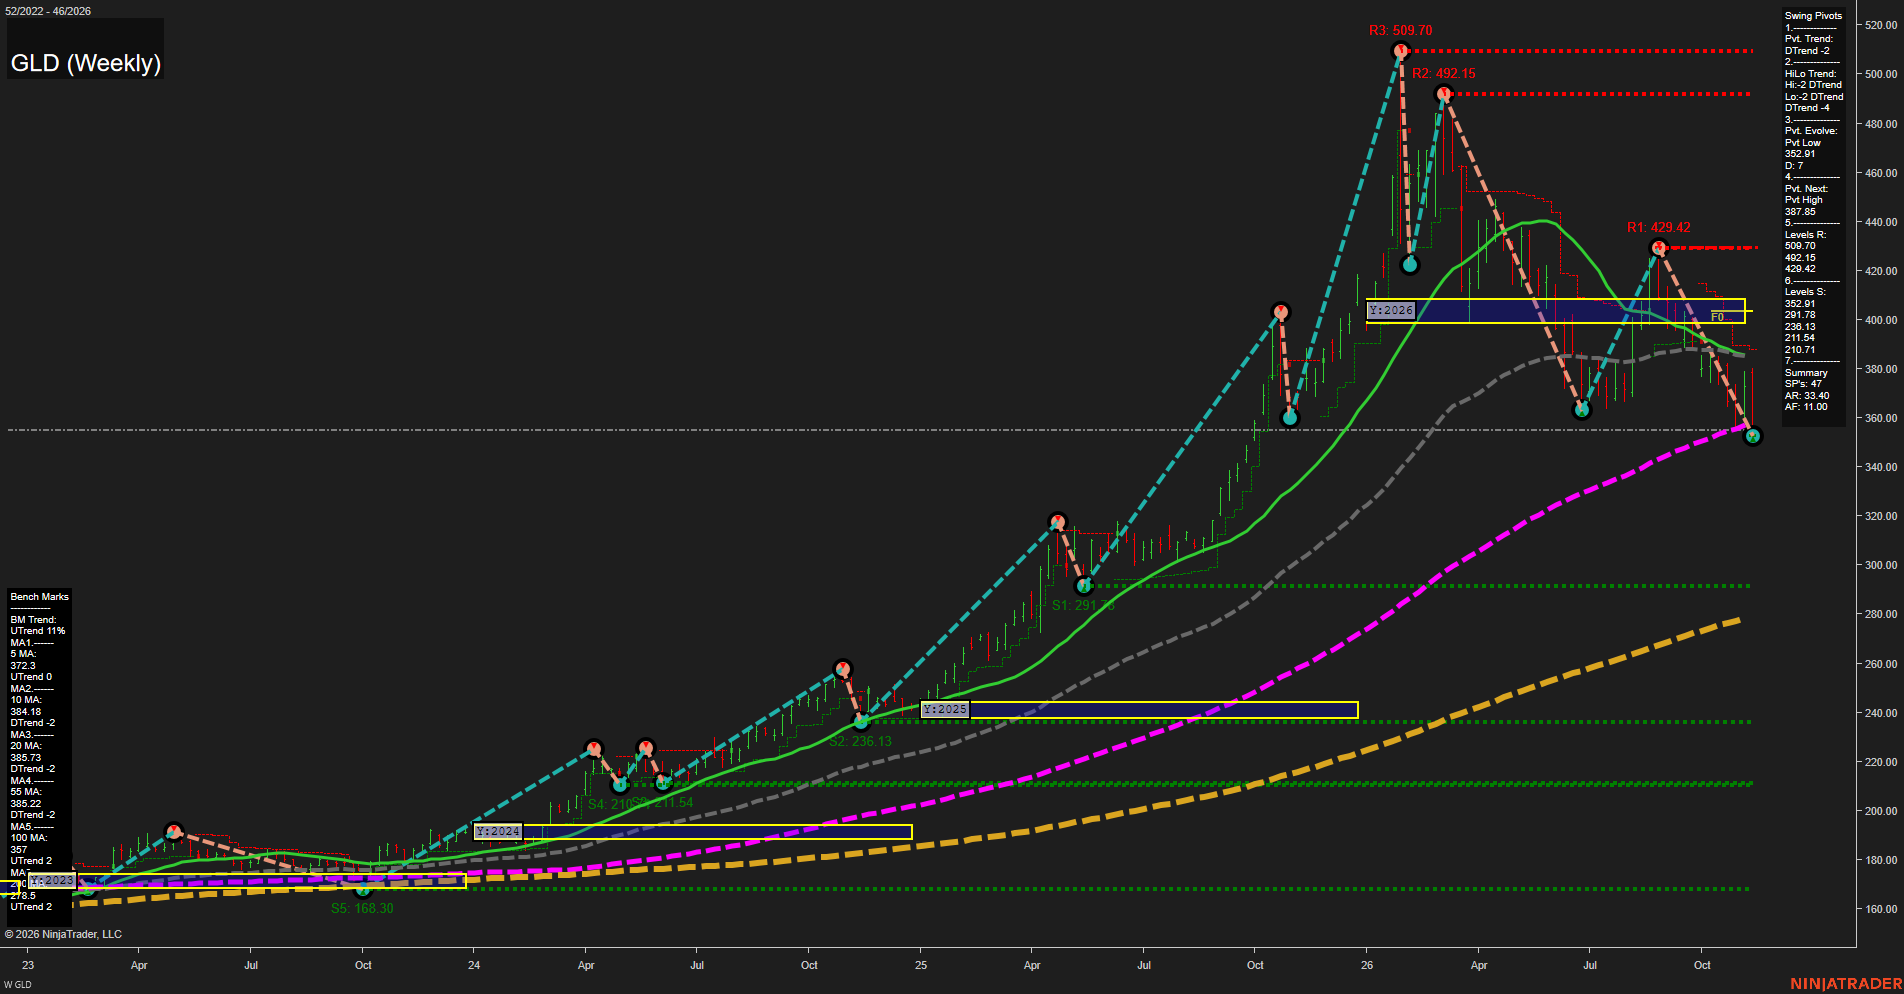
Overall Rating
- Near-Term: Bearish
- Medium-Term: Bearish
- Far-Term: Neutral.
Key Insights Summary
From a futures swing trader's perspective, GLD shows an accelerating corrective downswing within a still-rising longer-term benchmark structure. Lower highs at 509.70, 492.15 and 429.42, followed by the evolving 352.91 low, confirm deteriorating swing structure rather than an established recovery. Price is below all benchmarks except the 200-week average and is testing just beneath the rising 100-week average near 357. The 372.30–385.73 benchmark cluster represents overhead resistance, while 387.85 is the summary's next opposite-pivot reversal threshold. The yearly neutral zone around 399–409 is also overhead, reinforcing the bearish annual-grid position. Listed support beneath 352.91 is substantially lower at 291.78, illustrating the spacing of historical pivots rather than a projected target. Weekly and monthly grids and the requested recent signal series are not visible; their neutral placeholders do not establish observed neutrality. News and seasonal effects cannot be determined from this chart, and GLD prices are ETF levels rather than gold futures contract prices.
View charts on: AlphaWebTrader HTF Charts
GC Weekly View
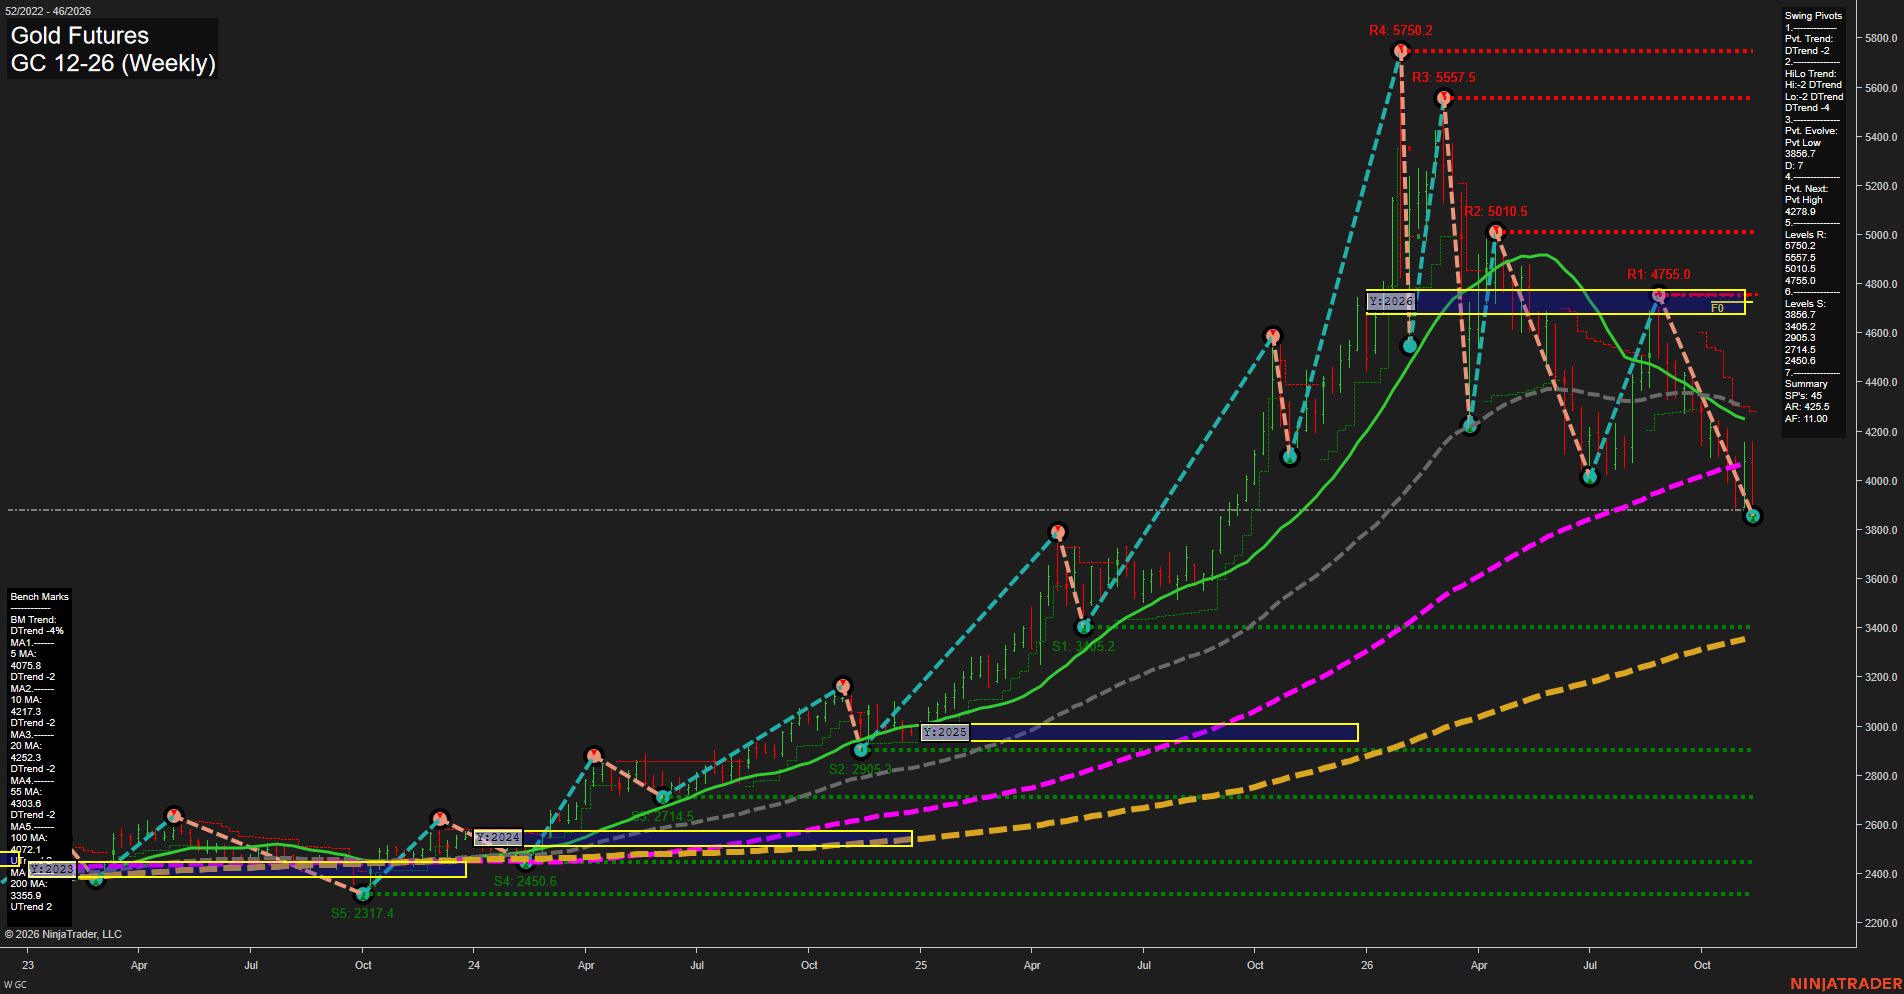
Overall Rating
- Near-Term: Bearish
- Medium-Term: Bearish
- Far-Term: Bearish.
Key Insights Summary
From a futures swing trader’s perspective, gold remains in a pronounced downswing, with lower pivot highs and lower lows confirming deterioration after the major rally peaked at 5750.2. The rebound to 4755.0 failed near the yearly NTZ, followed by renewed selling toward the evolving 3856.7 pivot low. Price is below the declining 5-, 10-, 20- and 55-week benchmarks and has also undercut the rising 100-week average. Recent short signals reinforce downside alignment across time horizons. Far-term conditions are bearish on balance, although rising 100- and 200-week averages retain evidence of the preceding structural uptrend. Immediate chart support is 3856.7, followed by 3405.2; the 4072–4304 benchmark cluster defines substantial overhead resistance. Wide weekly ranges and repeated failed rebounds characterize a volatile corrective phase rather than a confirmed recovery. News catalysts and seasonal influences cannot be established from this chart alone.
View charts on: AlphaWebTrader HTF Charts
TLT Weekly View
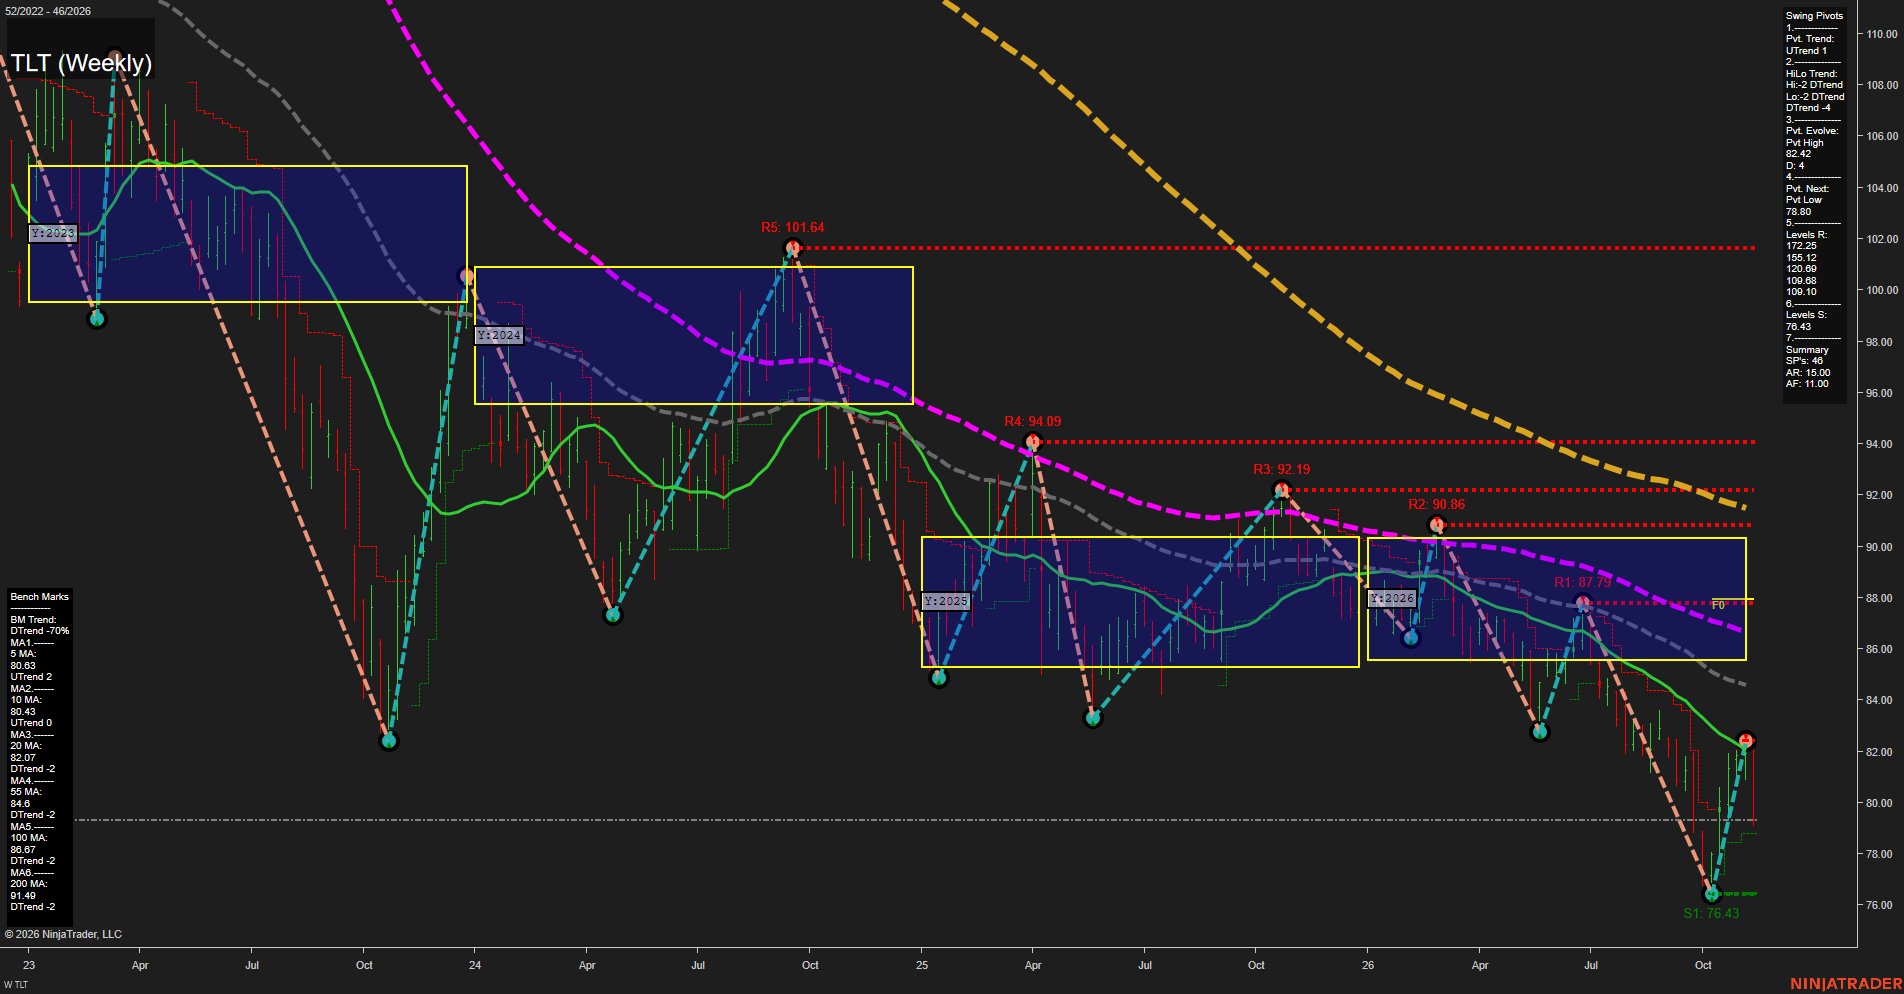
Overall Rating
- Near-Term: Bullish
- Medium-Term: Bearish
- Far-Term: Bearish.
Key Insights Summary
From a futures swing trader’s perspective, TLT shows a countertrend Treasury-price rebound within a persistent broader downtrend, rather than a confirmed trend reversal. The near-term bullish rating reflects the upward pivot trend and rising 5- and 10-week benchmarks, but the latest sharp reversal places price below both averages and materially weakens that recovery. The evolving 82.42 pivot high contrasts with the 78.80 opposite-pivot threshold, while 76.43 remains the displayed swing-low support. Medium- and far-term structure remains bearish, with declining longer benchmarks, lower swing highs and lows, and price below the yearly neutral zone at approximately 85.60–90.30. Nearby resistance drawn on the chart is 87.79, 90.86, 92.19, 94.09 and 101.64; these differ from the higher resistance values printed in the Swing Pivots summary. Weekly and monthly grids and the named recent-trade-signal indicators are not displayed, so their direction cannot be verified. The chart alone does not establish news or seasonal drivers.
View charts on: AlphaWebTrader HTF Charts
ZB Weekly View
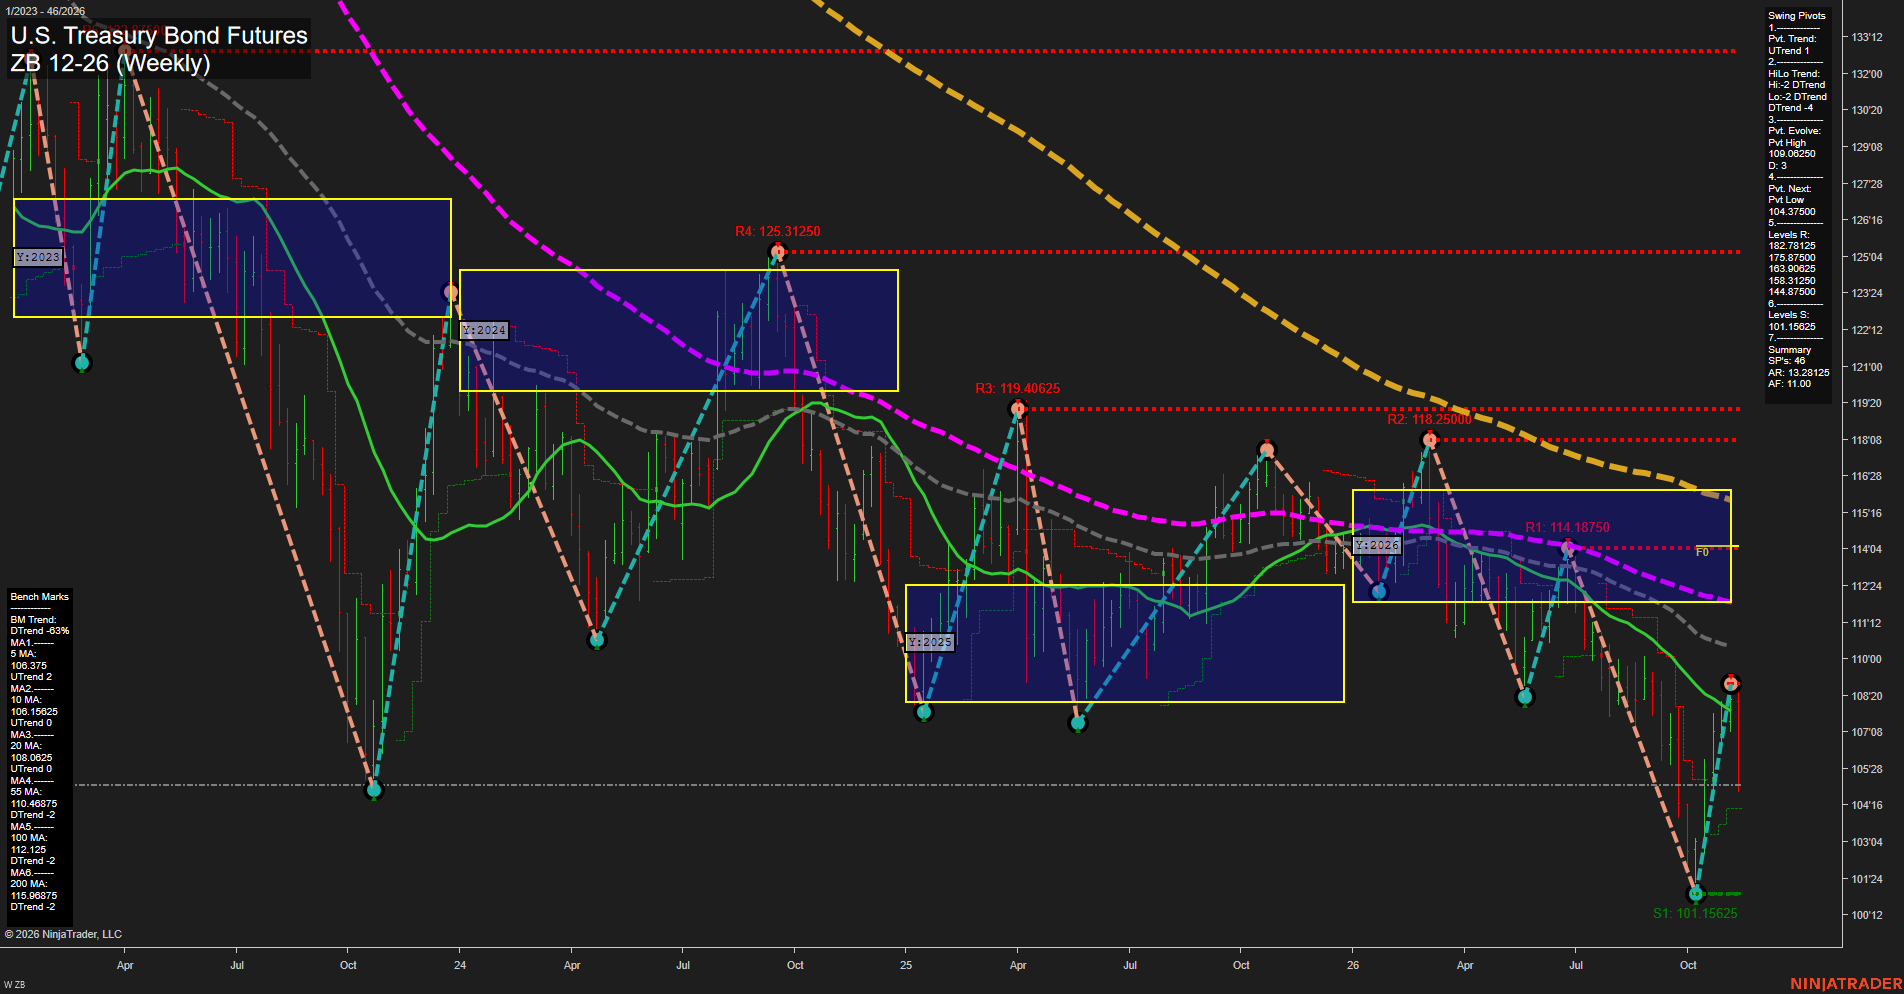
Overall Rating
- Near-Term: Bearish
- Medium-Term: Bearish
- Far-Term: Bearish.
Key Insights Summary
The rebound from 101.15625 to the evolving 109.06250 pivot high resembles a countertrend recovery within the broader declining structure. The latest large downside bar has erased much of that rebound, leaving price below all six weekly benchmarks and below the yearly neutral zone. Near-term evidence is mixed: the pivot summary remains UTrend and the shorter benchmarks retain upward readings, but current price action and the supplied weekly grid indicate renewed selling pressure. The medium-term HiLo DTrend and falling 55-, 100-, and 200-week averages reinforce the broader bearish assessment. The next-pivot reversal level is 104.37500, with 101.15625 the listed support. Resistance values above are transcribed from the summary; the nearer plotted resistance is 114.18750. Recent signal readings are not visible, and the image alone does not establish news or seasonal drivers.
View charts on: AlphaWebTrader HTF Charts
Index ETFs
Positive confluence: average WOC% +1.23% from the week open, WNC% +2.41% versus the prior weekly close. All five advanced on both comparisons: QQQ led each, while IWM lagged and was nearly flat from the open. QQQ remained below VWAP and its falling near-term benchmark.