Monday: Empire State 8:30 a.m. ET, bill auctions 11:30 a.m. ET; Nvidia Tuesday after close. S&P 500 and Nasdaq rebounds face medium-term weakness.
Fundamentals: Monday’s stock-market agenda includes Empire State manufacturing at 8:30 a.m. ET, Treasury bill auctions at 11:30 a.m. ET and Fed Chair Warsh’s speech at noon ET. Nvidia reports Tuesday after the close, with broad index relevance through its AI and semiconductor exposure. Tuesday also brings retail sales, while Wednesday features a 20-year Treasury auction and FOMC minutes. The coming week’s largest event clusters fall on Tuesday and Wednesday.
Technicals: S&P 500 and Nasdaq futures enter the coming week with near-term recoveries but bearish medium-term daily structures, leaving the rebounds short of confirmed reversals. Small-cap futures remain weak, with bearish near- and medium-term daily ratings. DAX futures stand out with bullish alignment across timeframes, though the latest daily candle marks a pause after a strong advance.
Market Week Ahead – Trading 360° view Market Radar for: holidays, earnings, eco-news, and ETF SPY S&P500, QQQ Tech, USO Oil, GLD Gold Weekly Chart analysis
As of: November 15, 2026 06:15 CT
Weekly Earnings Radar
Monitoring for earnings releases by the Magnificent 7, AI-tech-related firms, and major financial institutions.
| Date/Day | Impact | Company / Symbol | Time | EPS | Revenue | ||||
|---|---|---|---|---|---|---|---|---|---|
| 2026-11-17 – Tuesday | High | Nvidia (NVDA) | After close |
|
|
Conclusion: NVDA’s November 17, 2026 after-market earnings release remains ahead, with broad index relevance through its AI and semiconductor exposure. Market momentum and volume can slow ahead of major earnings releases, including NVDA’s.
For full details visit: Yahoo Earnings Calendar
Weekly EcoNews Radar U.S. Events
| Date | Impact | Event, Prev, Forecast, Actual | Info |
|---|---|---|---|
| 2026-11-16 Monday 05:00 | Medium | Fed's Barr speech Prev: — Forecast: — Actual: — | Remarks may provide insight into monetary policy or financial oversight; traders monitor any implications for interest-rate expectations and equity valuations. |
| 2026-11-16 Monday 08:30 | Medium | NY Empire State Manufacturing Index Prev: 25.5 Forecast: 17.6 Actual: — | Surveys New York manufacturers on business conditions, orders and employment; traders use it as an early regional gauge of economic momentum and cost pressures. |
| 2026-11-16 Monday 09:05 | Medium | Fed's Williams speech Prev: — Forecast: — Actual: — | Remarks may clarify the economic outlook and policy considerations; traders watch for signals relevant to expected interest rates and equity discount rates. |
| 2026-11-16 Monday 11:30 | Medium | 13-Week Bill Auction · $95B Prev: 4.06% Forecast: 4.099% Actual: — | Reveals short-term government funding costs and investor demand for bills; traders monitor the results for money-market conditions and front-end rate pricing. |
| 2026-11-16 Monday 11:30 | Medium | 26-Week Bill Auction · $82B Prev: 4.145% Forecast: — Actual: — | Shows investor demand and borrowing costs for short-term government debt; traders assess the results alongside expectations for the policy-rate path. |
| 2026-11-16 Monday 12:00 | High | Fed's Chair Warsh speech Prev: — Forecast: — Actual: — | Remarks can communicate the central bank leadership’s policy perspective; traders monitor guidance on inflation, employment and interest rates for implications for equity valuations. |
| 2026-11-17 Tuesday 07:30 | Medium | Fed's Musalem speech Prev: — Forecast: — Actual: — | Remarks may outline views on economic conditions and monetary policy; traders monitor potential implications for the expected rate path. |
| 2026-11-17 Tuesday 08:15 | Medium | ADP Employment Change 4-week average Prev: 20K Forecast: — Actual: — | Tracks average private-sector employment changes over a rolling period; traders use it to assess hiring momentum and its implications for growth and monetary policy. |
| 2026-11-17 Tuesday 08:30 | High | Retail Sales ex Autos (MoM) Prev: 0.9 Forecast: 0.4 Actual: — | Measures monthly retailer receipts excluding motor vehicles; traders use it to assess consumer demand with less influence from volatile vehicle purchases. |
| 2026-11-17 Tuesday 08:30 | High | Retail Sales (MoM) Prev: 0.8 Forecast: 0 Actual: — | Measures monthly changes in retailer receipts; traders monitor this nominal spending gauge for signals about consumer demand, economic growth and corporate revenues. |
| 2026-11-17 Tuesday 08:30 | High | Retail Sales Control Group Prev: 0.10% Forecast: — Actual: — | Tracks retailer receipts excluding autos, gasoline, building materials and food services; traders monitor this input to estimates of goods consumption in GDP. |
| 2026-11-17 Tuesday 09:10 | Medium | Fed's Waller speech Prev: — Forecast: — Actual: — | Remarks may reveal views on inflation, employment and policy settings; traders watch for implications for rate expectations and interest-sensitive equities. |
| 2026-11-17 Tuesday 09:15 | Medium | Industrial Production (MoM) Prev: 0.7 Forecast: 0.1 Actual: — | Measures output across manufacturing, mining and utilities; traders monitor production momentum for clues about economic growth and cyclical-sector earnings. |
| 2026-11-17 Tuesday 09:30 | Medium | Fed's Hammack speech Prev: — Forecast: — Actual: — | Remarks may discuss economic conditions and the policy outlook; traders monitor any signals affecting interest-rate expectations and equity valuations. |
| 2026-11-17 Tuesday 11:30 | Medium | 6-Week Bill Auction · $100B Prev: — Forecast: — Actual: — | Shows demand and borrowing costs at the very short end of government debt markets; traders monitor funding conditions and near-term rate pricing. |
| 2026-11-17 Tuesday 14:25 | Medium | Fed's Williams speech Prev: — Forecast: — Actual: — | Remarks may offer further perspective on the economy and policy; traders assess any implications for the expected interest-rate path. |
| 2026-11-17 Tuesday 16:30 | Low | API Weekly Crude Oil Stock Prev: 9.00M Forecast: — Actual: — | Provides an industry estimate of weekly US crude inventory changes; traders monitor oil supply-demand conditions and possible implications for energy shares and inflation expectations. |
| 2026-11-18 Wednesday 08:30 | Medium | Building Permits (MoM) Prev: 1.40M Forecast: 1.38M Actual: — | Measures authorizations for new residential construction; traders use it as a forward-looking gauge of housing activity, construction demand and interest-rate sensitivity. |
| 2026-11-18 Wednesday 08:30 | Medium | Housing Starts (MoM) Prev: 1.22M Forecast: 1.23M Actual: — | Tracks the start of new residential construction; traders monitor housing investment and demand for building materials as indicators of cyclical economic activity. |
| 2026-11-18 Wednesday 10:00 | Medium | Pending Home Sales (MoM) Prev: -7.3 Forecast: -2.3 Actual: — | Tracks signed contracts for existing-home purchases before closing; traders use it as a leading indicator of completed sales and housing demand. |
| 2026-11-18 Wednesday 10:30 | Low | EIA Crude Oil Stocks Change Prev: 4.66M Forecast: — Actual: — | Reports weekly changes in US commercial crude inventories; traders use it to assess petroleum market balances and implications for energy-sector earnings and inflation. |
| 2026-11-18 Wednesday 11:30 | Medium | 17-Week Bill Auction Prev: — Forecast: — Actual: — | Reveals demand and borrowing costs for short-term government securities; traders monitor the results for front-end yield pricing and cash-market conditions. |
| 2026-11-18 Wednesday 13:00 | High | 20-Year Bond Auction · $16B Prev: 5.46% Forecast: — Actual: — | Tests investor demand for long-maturity government debt; traders monitor auction pricing and participation for implications for longer-term yields and equity discount rates. |
| 2026-11-18 Wednesday 13:35 | Medium | Fed's Barr speech Prev: — Forecast: — Actual: — | Remarks may address monetary policy or financial-system issues; traders monitor any implications for rate expectations, bank conditions and broader equity sentiment. |
| 2026-11-18 Wednesday 14:00 | High | FOMC Minutes Prev: — Forecast: — Actual: — | Details policymakers’ discussions at their previous meeting; traders examine agreement, disagreements and economic assessments for clues about the future policy path. |
| 2026-11-18 Wednesday 14:30 | Medium | Fed's Williams speech Prev: — Forecast: — Actual: — | Remarks may clarify policy priorities and economic risks; traders watch for information relevant to interest-rate expectations and equity valuations. |
| 2026-11-19 Thursday 08:30 | Medium | Philadelphia Fed Manufacturing Survey Prev: 20.9 Forecast: 19.2 Actual: — | Surveys manufacturers in the Philadelphia region on activity, orders, employment and prices; traders monitor regional growth momentum and inflation pressures. |
| 2026-11-19 Thursday 08:30 | Medium | Initial Jobless Claims Prev: 200K Forecast: 200K Actual: — | Counts new applications for unemployment benefits; traders monitor this timely indicator of layoffs for changes in labor-market conditions and policy expectations. |
| 2026-11-19 Thursday 11:30 | Medium | 4-Week Bill Auction Prev: 3.955% Forecast: — Actual: — | Shows investor demand and government borrowing costs for very short-term debt; traders monitor cash-market conditions and near-term interest-rate pricing. |
| 2026-11-19 Thursday 11:30 | Medium | 8-Week Bill Auction Prev: — Forecast: — Actual: — | Reveals demand and yields for short-term government funding; traders assess the results for money-market conditions and front-end rate expectations. |
| 2026-11-19 Thursday 12:30 | Medium | Fed's Goolsbee speech Prev: — Forecast: — Actual: — | Remarks may discuss the economic outlook and policy trade-offs; traders monitor signals about interest rates that could affect equity valuations. |
| 2026-11-19 Thursday 13:00 | High | 10-Year TIPS Auction · $19B Prev: 2.653% Forecast: — Actual: — | Tests demand for inflation-protected government debt and establishes an auction real yield; traders monitor real borrowing costs and valuation implications for equities. |
| 2026-11-19 Thursday 14:15 | Medium | Fed's Barr speech Prev: — Forecast: — Actual: — | Remarks may provide views on monetary policy or financial oversight; traders assess any implications for interest-rate expectations and financial-sector conditions. |
Summary: The calendar centers on US monetary-policy communication and economic activity, alongside Treasury financing and energy inventories.
Conclusion: Higher-impact events are concentrated from Monday through Thursday, with Tuesday and Wednesday carrying the largest clusters.
Weekly Market News Sentiment
Sentiment Bias shows the balance of positive and negative news coverage sampled from 2026-11-14 00:40 to 2026-11-15 17:31 ET, covering stocks, energy and gold.
Week-ahead news sentiment based on collected articles available as of publication, highlighting relevant upcoming events and risks.
▼ Market news
- Bias
- ▼ -12.93%
- Articles
- 116
- Positive
- ▲ 25.86%
- Neutral
- — 35.34%
- Negative
- ▼ 38.79%
▼ GLD / Gold
- Bias
- ▼ -50.00%
- Articles
- 2
- Positive
- — 0.00%
- Neutral
- — 50.00%
- Negative
- ▼ 50.00%
Sentiment Summary: Gold coverage is evenly split between negative and neutral articles ahead of the coming trading week, with no positive coverage. The November 15 article highlights falling gold and silver prices despite their inflation-protection role and flags chart-based downside risk, rather than an established economic cause. The November 14 portfolio commentary provides a neutral counterweight by including gold in a diversified strategy aimed at inflation protection and resilience during market declines.
Conclusion: The central cross-market risk is weakness in precious metals despite their traditional defensive role.
Glossary: Sentiment Bias = (positive articles − negative articles) ÷ total articles × 100. It ranges from −100% negative to +100% positive. A reading near zero indicates little directional bias. Neutral articles reduce the score’s strength. ▲ positive; ▼ negative; — balanced. These readings describe news coverage, not market-price direction.
SPY Weekly View
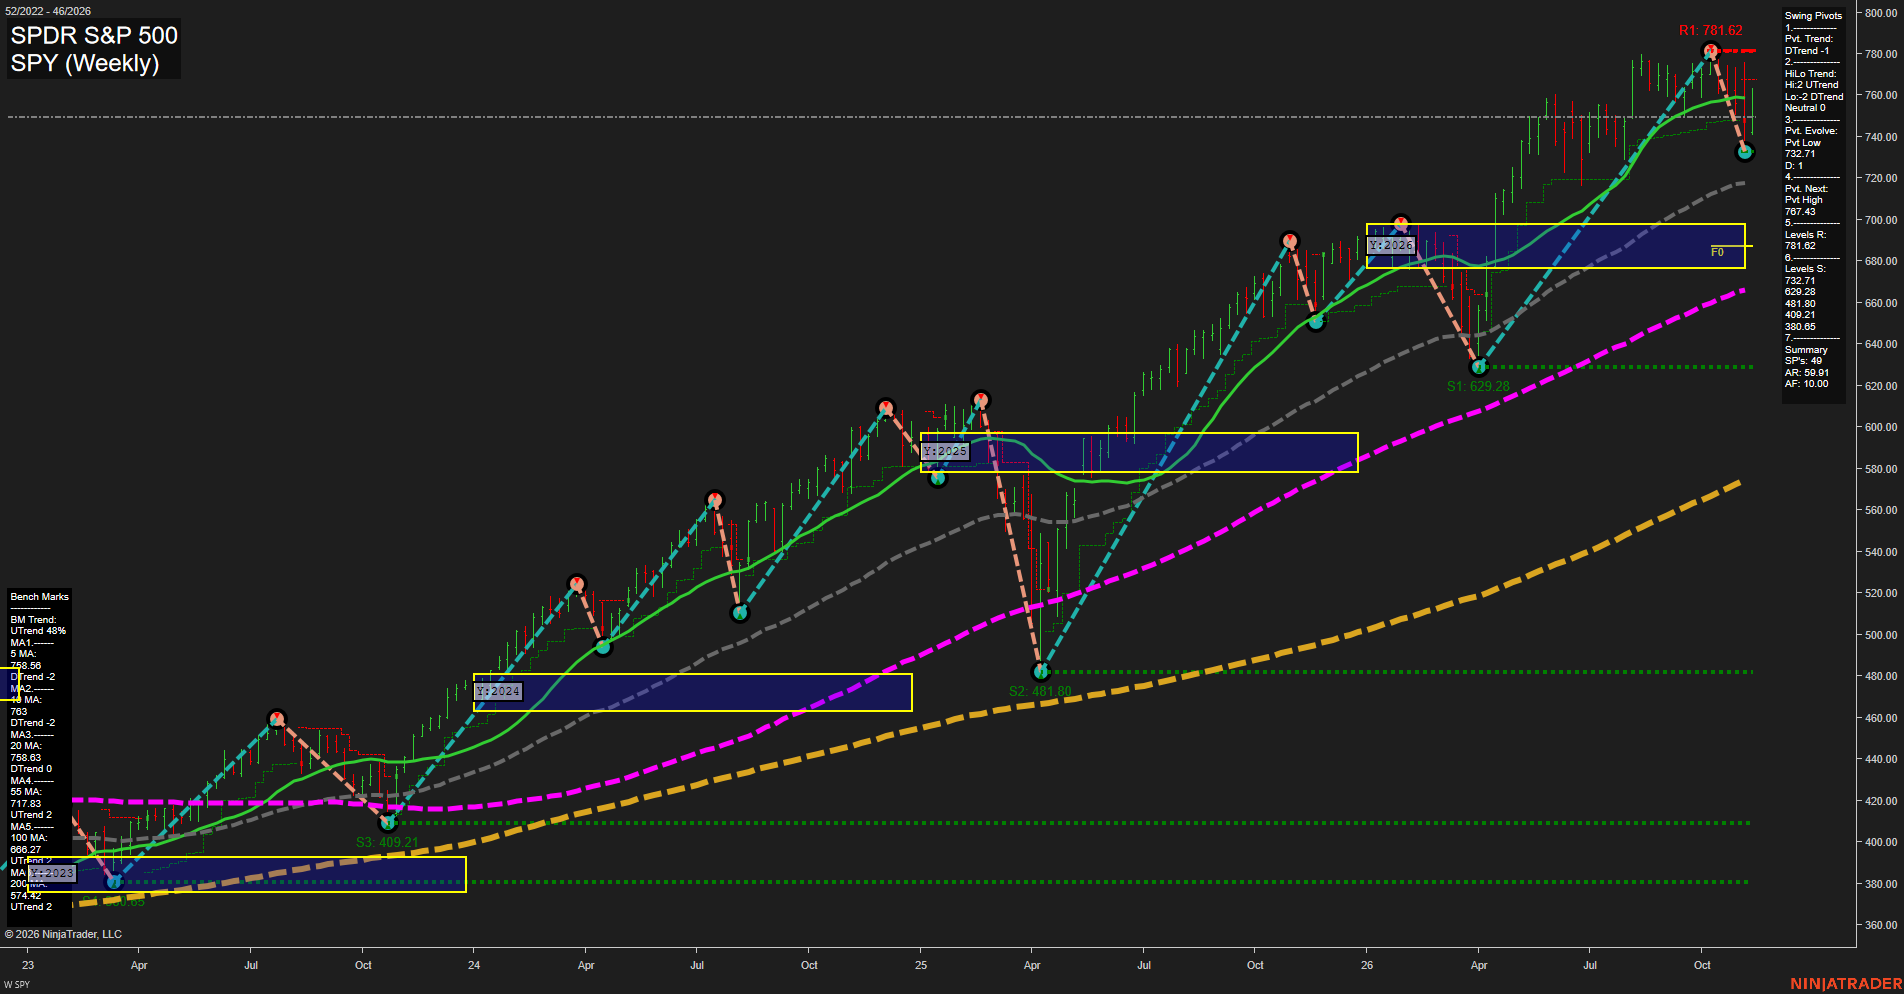
Overall Rating
- Near-Term: Bearish
- Medium-Term: Neutral
- Far-Term: Bullish.
Key Insights Summary
From a futures swing trader’s perspective, SPY shows a near-term corrective downswing within a rising longer-term structure. The decline from 781.62 to the evolving 732.71 pivot low spans approximately 6.3%, with wider weekly ranges reflecting increased volatility. The rebound remains below the declining 5-, 10-, and 20-week benchmarks clustered around 758.56–763.00. The summary identifies 767.43 as the reversal threshold for a new pivot high; 781.62 remains established swing resistance. Medium-term structure is mixed, with higher pivot highs but lower pivot lows and a rising 55-week benchmark beneath price. Price remains above the 2026 yearly neutral zone, approximately 677–698, and the rising 100- and 200-week benchmarks preserve the bullish far-term backdrop. Weekly and monthly grids and the named recent-signal indicators are not displayed, so their direction cannot be verified. These are SPY reference levels, not directly interchangeable futures prices; the image does not establish news or seasonal drivers.
View charts on: AlphaWebTrader HTF Charts
QQQ Weekly View
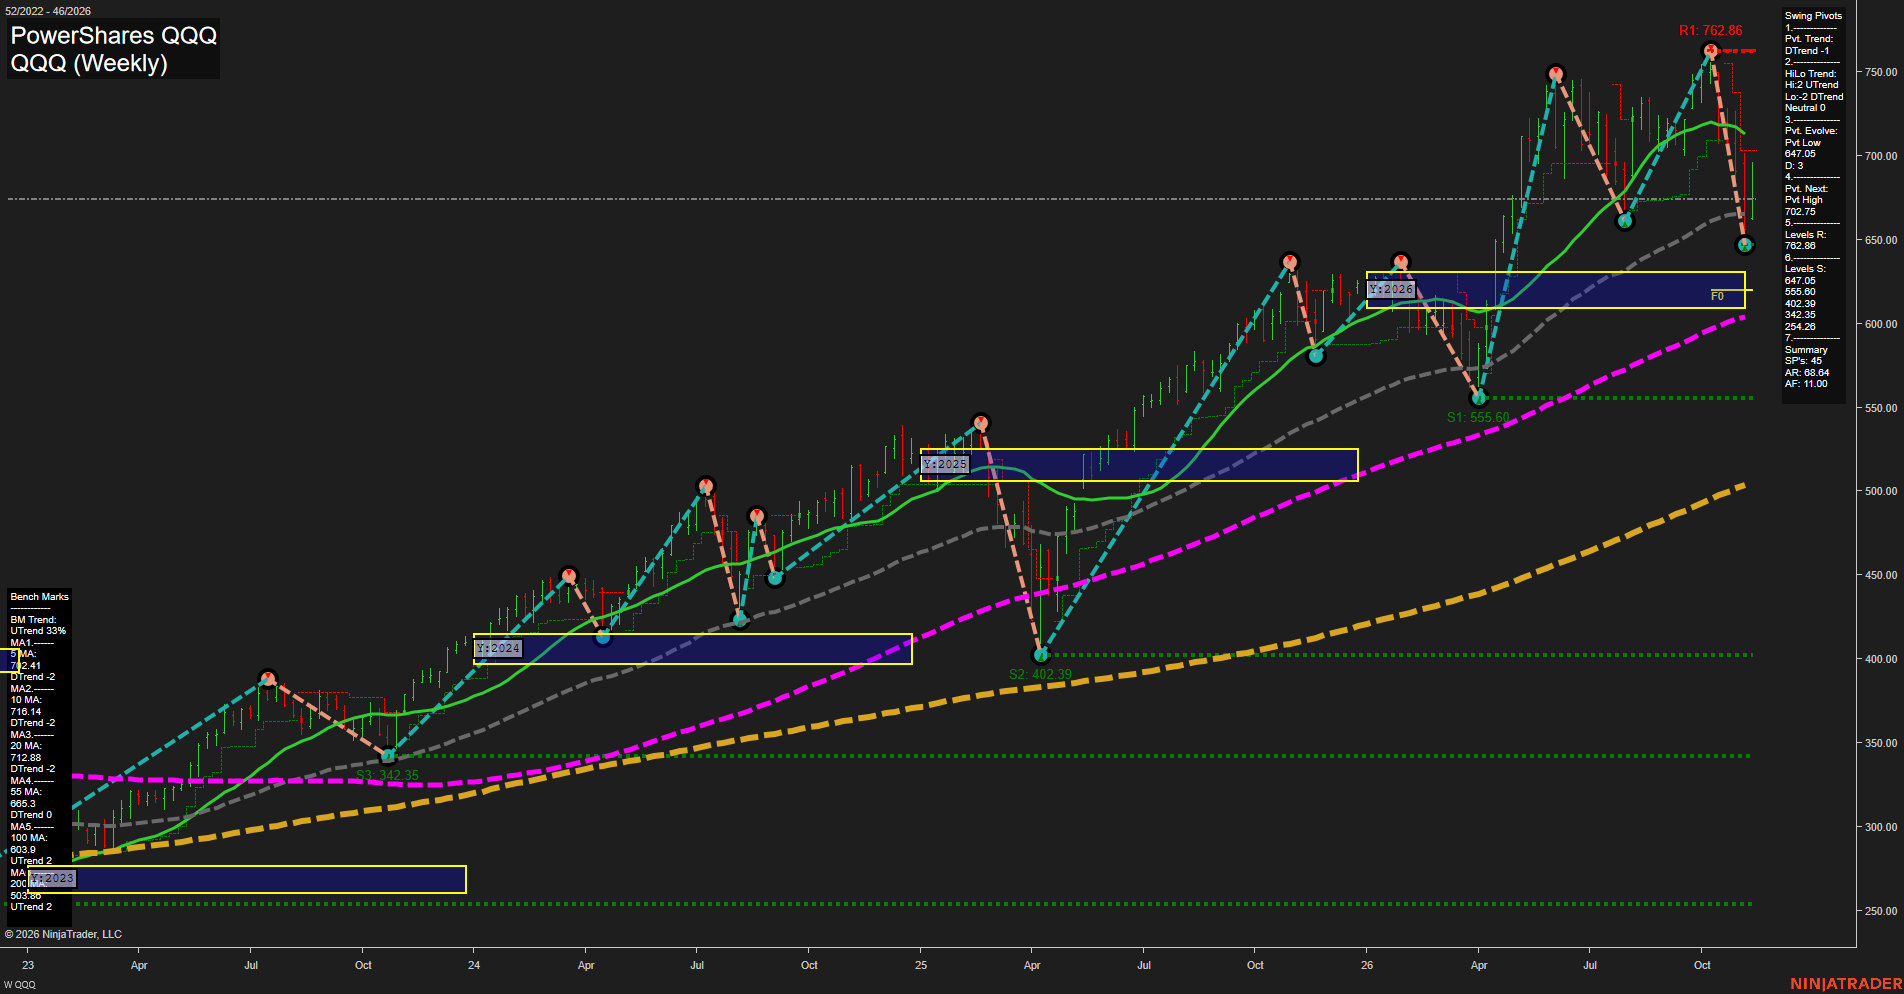
Overall Rating
- Near-Term: Bearish
- Medium-Term: Bearish
- Far-Term: Bullish.
Key Insights Summary
From a futures swing-trading perspective, QQQ shows a fast countertrend selloff within a still-rising long-term structure; these are QQQ reference prices, not Nasdaq futures contract levels. The reversal from 762.86 has undercut the preceding swing low near 660 and placed price below the 5-, 10-, 20- and 55-week benchmarks. The pivot summary confirms a near-term downtrend, while higher highs and lower lows leave the medium-term HiLo structure neutral rather than an established sequence of lower highs. The evolving low is 647.05, with 702.75 identified as the next opposing-pivot reversal threshold. Despite the near-term damage, price remains above the rising 100- and 200-week averages and the approximately 610–631 yearly neutral zone. Thus, the actual yearly price location is above the NTZ, notwithstanding the neutral placeholder fields above. Weekly and monthly grids and the four requested USAR signal readings are not displayed, so their direction cannot be confirmed. No news catalyst or seasonal conclusion is established by this chart.
View charts on: AlphaWebTrader HTF Charts
USO Weekly View
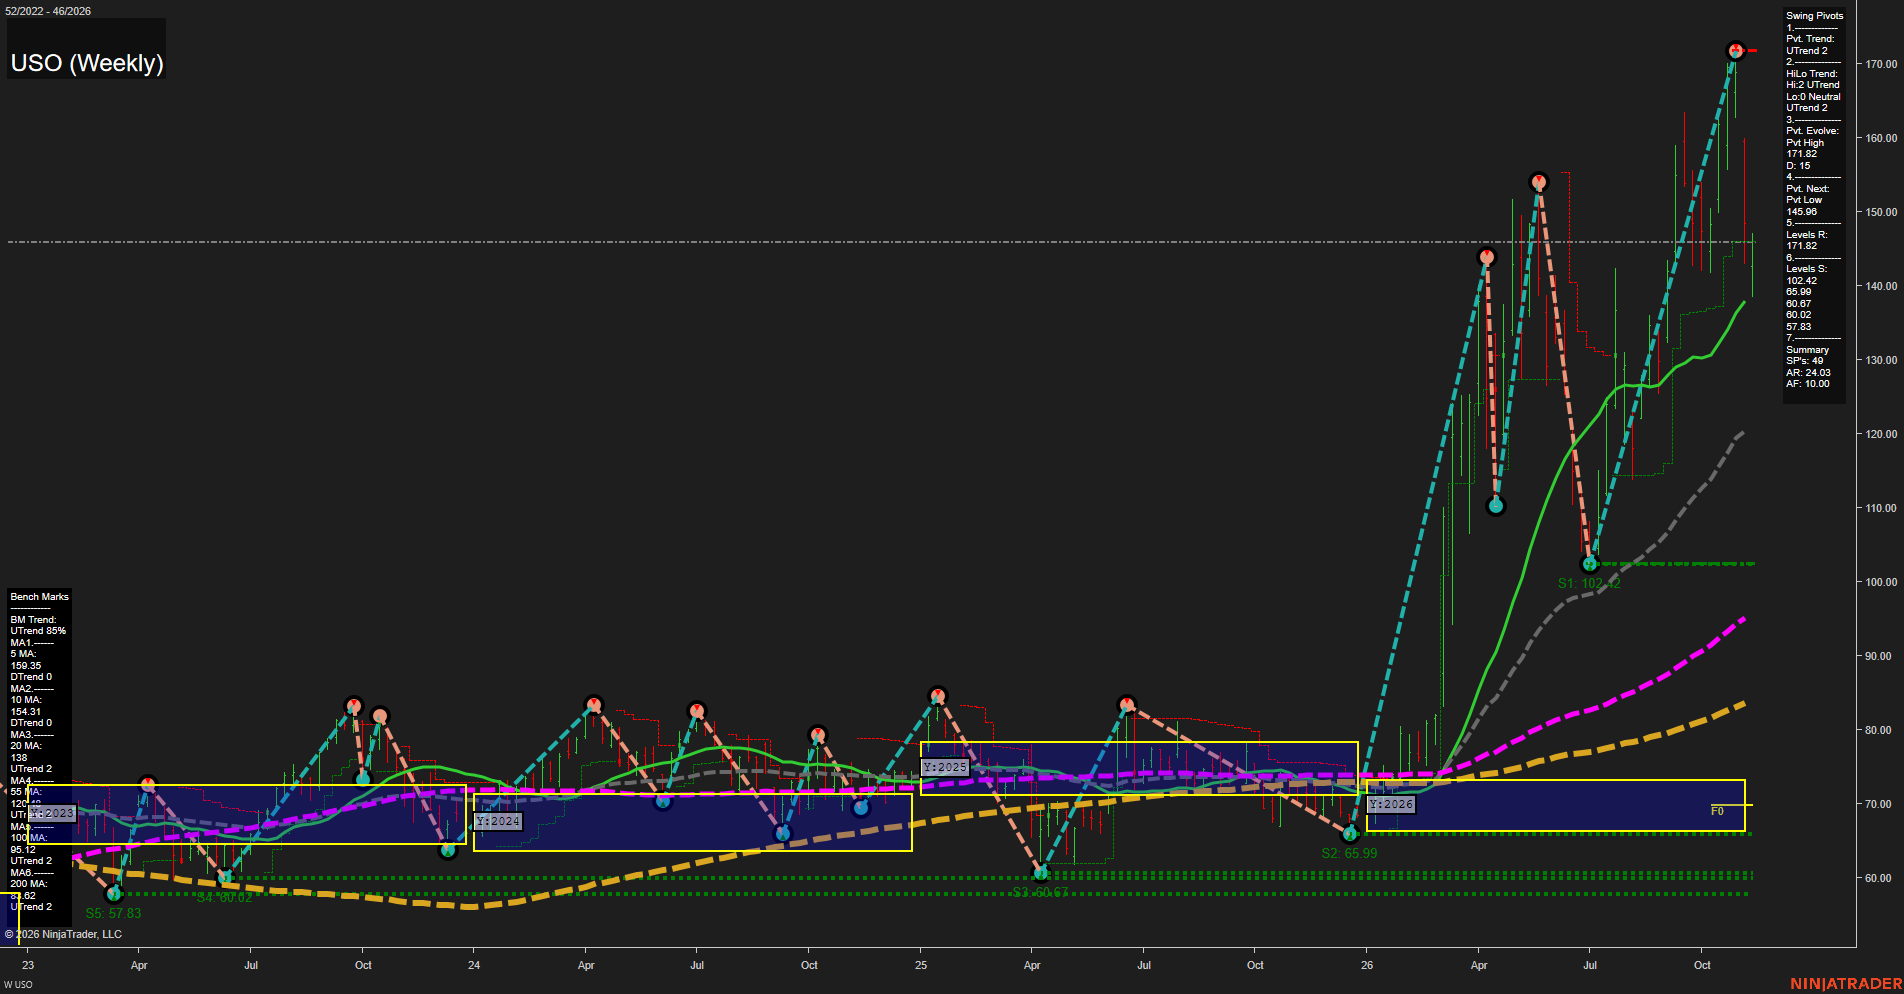
Overall Rating
- Near-Term: Neutral
- Medium-Term: Bullish
- Far-Term: Bullish.
Key Insights Summary
From a futures swing-trading perspective, USO shows a sharp countertrend retracement within an established broader advance. Price has fallen approximately 15% from the 171.82 evolving pivot high and sits below declining 5- and 10-week benchmarks, indicating near-term momentum deterioration despite the summary retaining an upward pivot trend. The latest small-range bar contrasts with preceding wide weekly ranges, suggesting a pause rather than a confirmed reversal. Price remains above the rising 20-week benchmark near 138 and the longer-term averages, preserving the medium- and far-term bullish structure. The 145.96 next-pivot threshold is close to current price; 171.82 remains the listed overhead resistance, while 102.42 is the nearest confirmed swing-low support. The yearly grid is visibly far below price, although numerical grid readings and weekly/monthly grids are unavailable; their neutral entries reflect unavailable classifications rather than confirmed balance. Recent signal-system readings, news catalysts, and seasonal evidence are not displayed. USO is an oil-futures fund proxy, so these price levels describe the fund rather than a specific crude-oil futures contract.
View charts on: AlphaWebTrader HTF Charts
GLD Weekly View
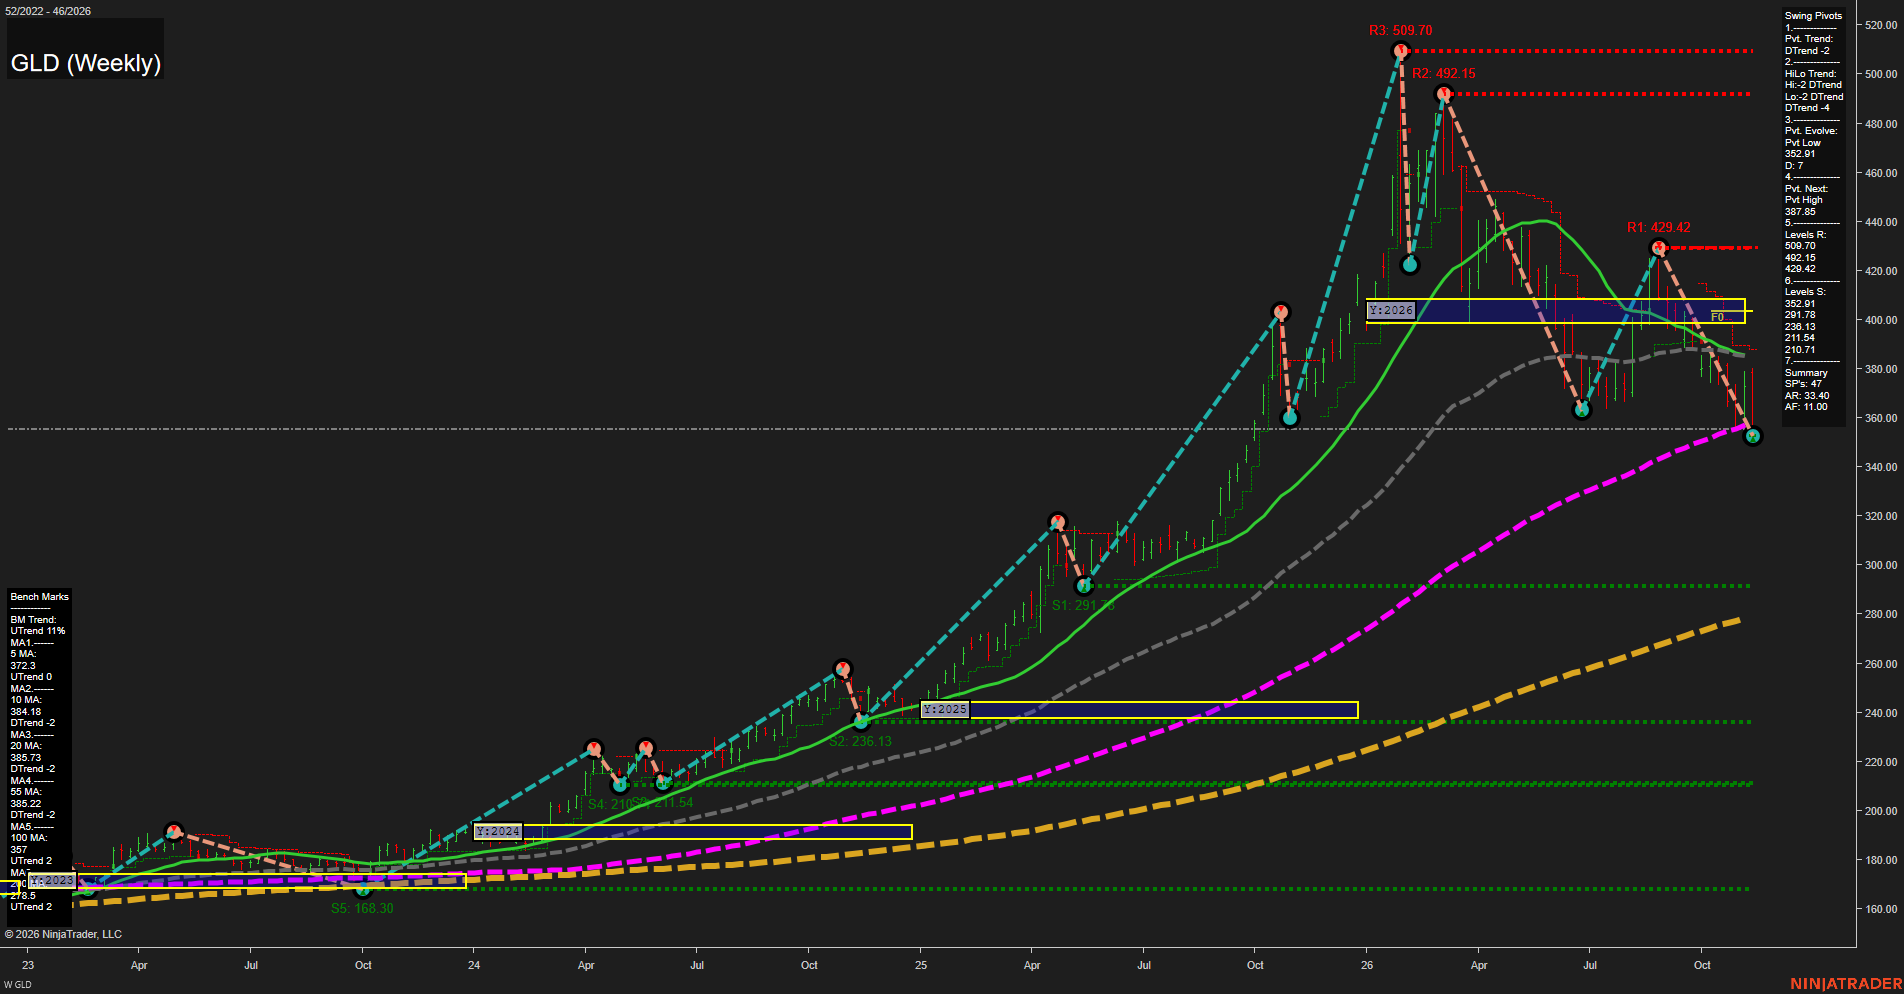
Overall Rating
- Near-Term: Bearish
- Medium-Term: Bearish
- Far-Term: Neutral.
Key Insights Summary
From a futures swing trader’s perspective, GLD shows a sustained corrective downswing within a still-rising major trend. Successively lower highs at 509.70, 492.15 and 429.42, followed by the developing 352.91 low, establish bearish swing structure. Price is below the 5-, 10-, 20- and 55-week benchmarks and has slipped marginally below the rising 100-week average. The declining 20- and 55-week averages cluster around 385–386, close to the 387.85 next-pivot reversal threshold. The 2026 yearly neutral zone near 399–409 is overhead, while 352.91 is the immediate recorded support and 291.78 is the next listed support below it. Rising 100- and 200-week averages preserve a longer-horizon bullish backdrop, but the yearly-grid breakdown leaves the far-term assessment mixed. Weekly and monthly grids and the specified recent trade-signal series are not displayed; their neutral entries are placeholders rather than verified readings. News and seasonal influences cannot be established from this chart. These are GLD share-price levels, not gold futures contract prices.
View charts on: AlphaWebTrader HTF Charts
ZB Weekly View
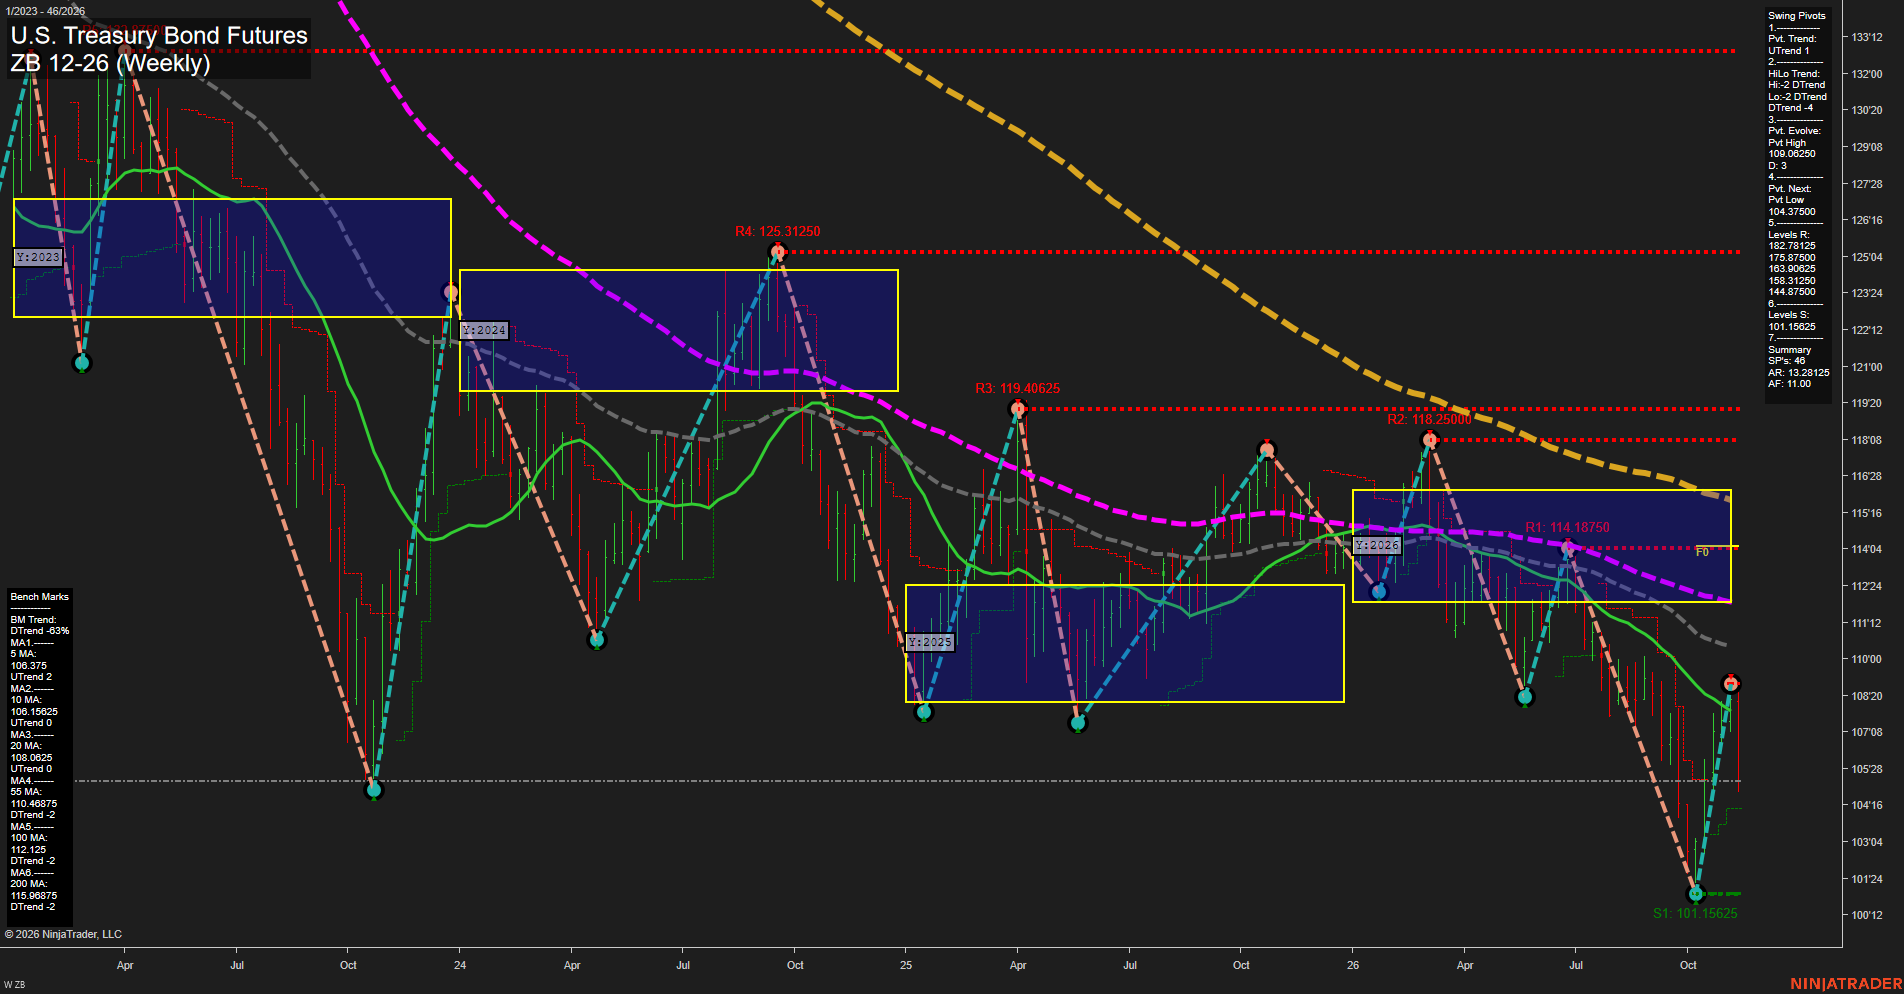
Overall Rating
- Near-Term: Neutral
- Medium-Term: Bearish
- Far-Term: Bearish.
Key Insights Summary
The rebound from 101.15625 to the evolving 109.06250 pivot high represents a sharp countertrend rally within a broader lower-high, lower-low structure. The latest large downside bar has erased much of that rebound and returned price below all six weekly benchmarks. Near-term conditions remain mixed because the pivot trend and short moving-average slopes are still positive, while the weekly grid and latest price action are bearish. The 104.37500 next-pivot threshold separates the existing upward pivot leg from a new downward pivot phase. Beyond the evolving high, visible chart resistance stands at 114.18750, 118.25000 and 119.40625; the resistance values reported in the summary are much more distant historical levels. Falling longer-term benchmarks and price below the yearly neutral zone reinforce the broader bearish regime. Recent signal labels, news catalysts and seasonal evidence are not identifiable in this image and are not incorporated into the ratings.
View charts on: AlphaWebTrader HTF Charts
Sentiment Summary: Negative coverage leads 39% to 26% positive, with 35% neutral, reflecting Nvidia’s leadership uncertainty after Jensen Huang’s Nov. 12 resignation and China chip-access scrutiny, alongside firm inflation and rising Treasury yields. The main counterweight is the prior week’s rebound—S&P 500 up 2.6% and Nasdaq 100 up 3.7% despite Nvidia’s roughly 13% decline—with reported AI demand growth providing additional support. For the coming week, Nvidia’s Nov. 17 earnings and Anthropic’s expected Nov. 19 listing are upcoming catalysts, distinct from speculation about Huang’s return.
Conclusion: Index futures enter the week with concentrated AI event risk against a firmer interest-rate backdrop.