Stock futures fall before Monday’s Empire State data at 8:30 ET, bill auctions at 11:30 ET and noon ET Fed remarks; S&P 500 and Nasdaq signals remain bearish.
Fundamentals: Stock futures are lower amid Nvidia uncertainty as Monday brings Empire State manufacturing data at 8:30 ET, Fed Williams at 9:05 ET, $95B 13-week and $82B 26-week Treasury bill auctions at 11:30 ET, and Fed Chair Warsh and Daly at noon ET. Technology shares face pressure from Nvidia's leadership disruption ahead of its earnings tomorrow, Tuesday, after the close. Tomorrow also brings retail sales at 8:30 ET; Wednesday's FOMC minutes remain a later catalyst.
Technicals: Ahead of Monday’s open, S&P 500 and Nasdaq futures show bearish near- and medium-term conditions as volatile rebounds remain within corrective structures. Dow futures have a neutral near-term rating, while small-cap futures remain bearish across daily horizons. Longer-term weekly trends remain bullish across these U.S. indexes, and Germany’s DAX retains a broadly bullish structure despite weekly pullback signals.
Pre-Market Trading 360° view Market Radar of: holidays, earnings, eco-news, market-news summary, news sentiment, prior session major ETFs, MAG7, Higher Time Frame Analysis Indices Futures Summary, and E-mini S&P500, Nasdaq 100, NYMEX Crude, Gold Futures Daily Chart analysis.
As of: November 16, 2026 07:15 CT
Earnings Radar
Monitoring for earnings releases by the Magnificent 7, AI-tech-related firms, and major financial institutions.
| Date/Day | Impact | Company / Symbol | Time | EPS | Revenue | ||||
|---|---|---|---|---|---|---|---|---|---|
| 2026-11-17 – Tuesday | High | Nvidia (NVDA) | After close |
|
|
Conclusion: NVDA’s earnings release is scheduled for November 17, 2026, after market close; it remains ahead as of the November 16 publication. As a MAG7, AI, and semiconductor name, it has broad index relevance; market momentum and volume can slow ahead of major earnings releases.
For full details visit: Yahoo Earnings Calendar
EcoNews Radar U.S. Events
| Date | Impact | Event, Prev, Forecast, Actual | Info |
|---|---|---|---|
| 2026-11-16 Monday 05:00 | Medium | Fed's Barr speech Prev: — Forecast: — Actual: — | Remarks may clarify views on the economy, financial conditions or policy; traders monitor potential implications for interest rates and equity valuations. |
| 2026-11-16 Monday 08:30 | Medium | NY Empire State Manufacturing Index Prev: 25.5 Forecast: 18 Actual: — | A regional survey gauges factory business conditions in New York State, offering an early signal of manufacturing momentum, orders and pricing pressures relevant to growth expectations. |
| 2026-11-16 Monday 09:05 | Medium | Fed's Williams speech Prev: — Forecast: — Actual: — | Remarks offer insight into economic assessments and policy thinking; traders watch for implications for rate expectations and equity discount rates. |
| 2026-11-16 Monday 11:30 | Medium | 13-Week Bill Auction · $95B Prev: 4.06% Forecast: 4.099% Actual: — | Results show short-term government funding costs and investor demand for Treasury bills, helping traders assess money-market conditions and front-end yields. |
| 2026-11-16 Monday 11:30 | Medium | 26-Week Bill Auction · $82B Prev: 4.145% Forecast: — Actual: — | Results reveal demand for short-dated government debt and its clearing yield, providing context for funding conditions and expected interest rates. |
| 2026-11-16 Monday 12:00 | High | Fed's Chair Warsh speech Prev: — Forecast: — Actual: — | The central bank leader's remarks can clarify the policy outlook and economic risks, informing rate expectations and the discount rates applied to equities. |
| 2026-11-16 Monday 12:00 | Medium | Fed's Daly speech Prev: — Forecast: — Actual: — | Remarks may reveal assessments of inflation, employment and policy; traders monitor whether they alter expectations for interest rates and financial conditions. |
| 2026-11-17 Tuesday 07:30 | Medium | Fed's Musalem speech Prev: — Forecast: — Actual: — | Remarks provide a policymaker's perspective on economic conditions and monetary policy, which traders use to assess the interest-rate outlook. |
| 2026-11-17 Tuesday 08:15 | Medium | ADP Employment Change 4-week average Prev: 20K Forecast: — Actual: — | Tracks average private-sector employment gains over a rolling period, offering a labor-demand signal relevant to household income, economic growth and monetary policy expectations. |
| 2026-11-17 Tuesday 08:30 | High | Retail Sales ex Autos (MoM) Prev: 0.9 Forecast: 0.4 Actual: — | Measures monthly merchant receipts excluding vehicles, helping traders assess underlying goods demand with less exposure to volatile auto purchases. |
| 2026-11-17 Tuesday 08:30 | High | Retail Sales (MoM) Prev: 0.8 Forecast: 0.2 Actual: — | Measures monthly changes in merchant receipts, providing a timely nominal spending signal relevant to consumer demand, corporate revenues and economic growth. |
| 2026-11-17 Tuesday 08:30 | High | Retail Sales Control Group Prev: 0.10% Forecast: — Actual: — | Tracks a narrower spending aggregate used to estimate goods consumption in GDP, helping traders assess underlying demand and growth momentum. |
| 2026-11-17 Tuesday 09:10 | Medium | Fed's Waller speech Prev: — Forecast: — Actual: — | Remarks may clarify the balance of inflation and employment risks; traders watch for implications for the policy path and equity valuations. |
| 2026-11-17 Tuesday 09:15 | Medium | Industrial Production (MoM) Prev: 0.7 Forecast: 0.1 Actual: — | Measures output from factories, mines and utilities, providing a gauge of physical economic activity relevant to cyclical earnings and growth expectations. |
| 2026-11-17 Tuesday 09:30 | Medium | Fed's Hammack speech Prev: — Forecast: — Actual: — | Remarks offer insight into economic assessments and policy preferences, helping traders interpret the outlook for rates and financial conditions. |
| 2026-11-17 Tuesday 11:30 | Medium | 6-Week Bill Auction · $100B Prev: — Forecast: — Actual: — | Results indicate demand for very short-term government debt and its funding cost, offering context for liquidity conditions and money-market pricing. |
| 2026-11-17 Tuesday 14:25 | Medium | Fed's Williams speech Prev: — Forecast: — Actual: — | Remarks may refine views on growth, inflation and monetary policy; traders monitor implications for interest-rate expectations and equity discount rates. |
| 2026-11-17 Tuesday 16:30 | Low | API Weekly Crude Oil Stock Prev: 9.00M Forecast: — Actual: — | An industry estimate tracks changes in commercial crude inventories, informing oil supply-demand assessments relevant to energy shares and inflation-sensitive market expectations. |
| 2026-11-18 Wednesday 08:30 | Medium | Building Permits (MoM) Prev: 1.40M Forecast: 1.38M Actual: — | Tracks authorizations for residential construction, offering a forward-looking housing supply signal relevant to building activity, rate sensitivity and cyclical demand. |
| 2026-11-18 Wednesday 08:30 | Medium | Housing Starts (MoM) Prev: 1.22M Forecast: 1.27M Actual: — | Tracks the start of residential construction, helping traders gauge housing investment, building-material demand and the economy's sensitivity to financing costs. |
| 2026-11-18 Wednesday 10:00 | Medium | Pending Home Sales (MoM) Prev: -7.3 Forecast: -2.3 Actual: — | Tracks signed contracts for existing homes, offering a leading indicator of completed transactions and a gauge of housing demand under prevailing financing conditions. |
| 2026-11-18 Wednesday 10:30 | Low | EIA Crude Oil Stocks Change Prev: 4.66M Forecast: — Actual: — | Measures weekly changes in commercial crude inventories, helping traders assess petroleum balances and potential implications for energy earnings and inflation pressures. |
| 2026-11-18 Wednesday 11:30 | Medium | 17-Week Bill Auction Prev: — Forecast: — Actual: — | Results reveal demand and clearing yields for short-term government funding, offering a read on money-market conditions and Treasury financing costs. |
| 2026-11-18 Wednesday 12:15 | Medium | Fed's Daly speech Prev: — Forecast: — Actual: — | Remarks may clarify economic risks and policy thinking; traders assess whether they change expectations for borrowing costs and equity valuations. |
| 2026-11-18 Wednesday 13:00 | High | 20-Year Bond Auction · $16B Prev: 5.46% Forecast: — Actual: — | Results reveal demand for long-dated government debt and its clearing yield, informing assessments of duration appetite and borrowing costs relevant to equity valuations. |
| 2026-11-18 Wednesday 13:35 | Medium | Fed's Barr speech Prev: — Forecast: — Actual: — | Remarks may address economic conditions, policy or financial stability; traders monitor potential implications for rates, credit conditions and risk sentiment. |
| 2026-11-18 Wednesday 14:00 | High | FOMC Minutes Prev: — Forecast: — Actual: — | The meeting record details policymakers' debate, risk assessments and policy reasoning, helping traders evaluate the likely interest-rate path and uncertainty around it. |
| 2026-11-18 Wednesday 14:30 | Medium | Fed's Williams speech Prev: — Forecast: — Actual: — | Remarks provide additional context on economic conditions and policy thinking, which traders monitor for implications for rates and equity discounting. |
| 2026-11-18 Wednesday 16:15 | Medium | Fed's Kashkari speech Prev: — Forecast: — Actual: — | Remarks may illuminate views on inflation, labor conditions and policy restraint; traders watch for changes in the perceived interest-rate outlook. |
| 2026-11-19 Thursday 08:30 | Medium | Philadelphia Fed Manufacturing Survey Prev: 20.9 Forecast: 19.2 Actual: — | A regional factory survey gauges business conditions, orders, employment and prices, offering timely evidence on manufacturing momentum and inflation pressures. |
| 2026-11-19 Thursday 08:30 | Medium | Initial Jobless Claims Prev: 200K Forecast: 196K Actual: — | Counts new applications for unemployment benefits, providing a timely signal of layoffs and labor-market conditions relevant to growth and policy expectations. |
| 2026-11-19 Thursday 11:30 | Medium | 4-Week Bill Auction Prev: 3.955% Forecast: — Actual: — | Results show investor demand and funding costs at the shortest Treasury maturities, helping traders monitor cash-market conditions and front-end yields. |
| 2026-11-19 Thursday 11:30 | Medium | 8-Week Bill Auction Prev: — Forecast: — Actual: — | Results indicate demand for short-term Treasury debt and its clearing yield, providing context for liquidity conditions and near-term funding costs. |
| 2026-11-19 Thursday 12:30 | Medium | Fed's Goolsbee speech Prev: — Forecast: — Actual: — | Remarks offer views on the economic outlook and policy trade-offs, helping traders assess potential implications for rates and equity valuations. |
| 2026-11-19 Thursday 13:00 | High | 10-Year TIPS Auction · $19B Prev: 2.653% Forecast: — Actual: — | Results show demand for inflation-protected government debt and its real yield, a key input for assessing inflation compensation and equity discount rates. |
| 2026-11-19 Thursday 14:15 | Medium | Fed's Barr speech Prev: — Forecast: — Actual: — | Remarks may clarify views on policy, economic risks or financial stability; traders watch for implications for funding conditions and risk pricing. |
| 2026-11-19 Thursday 18:30 | Medium | Fed's Paulson speech Prev: — Forecast: — Actual: — | Remarks may provide insight into economic assessments and policy preferences; traders monitor potential implications for interest-rate expectations and financial conditions. |
| 2026-11-20 Friday 08:25 | Medium | Fed's Waller speech Prev: — Forecast: — Actual: — | Remarks may update assessments of inflation and employment risks, helping traders interpret the policy outlook and its relevance to equity valuations. |
| 2026-11-20 Friday 10:00 | Medium | Michigan Consumer Sentiment Index Prev: 51 Forecast: 52 Actual: — | A household survey gauges confidence in personal finances and economic conditions, providing context for consumer demand and the spending outlook. |
| 2026-11-20 Friday 10:00 | Medium | UoM 1-year Consumer Inflation Expectations Prev: 4.3 Forecast: — Actual: — | Measures households' near-term expected price increases, helping traders assess inflation psychology and its relevance to monetary policy expectations. |
| 2026-11-20 Friday 10:00 | Medium | Michigan Consumer Expectations Index Prev: 50.9 Forecast: — Actual: — | Gauges households' outlook for finances and business conditions, offering a forward-looking confidence signal relevant to consumption and economic growth. |
| 2026-11-20 Friday 10:00 | Medium | UoM 5-year Consumer Inflation Expectation Prev: 3.4 Forecast: 3.4 Actual: — | Measures households' longer-term inflation outlook, helping traders assess whether expectations remain anchored and what that implies for monetary policy credibility. |
| 2026-11-20 Friday 12:15 | Medium | Fed's Cook speech Prev: — Forecast: — Actual: — | Remarks offer insight into economic conditions and policy risks; traders monitor potential implications for interest rates, financial conditions and equity valuations. |
Summary: The calendar centers on U.S. monetary policy signals, consumer demand and economic activity, alongside Treasury funding and energy inventory updates.
Conclusion: The listed high-impact events are concentrated from Monday through Thursday.
NYSE Session Open Gap Radar
Session gaps compare the predicted opening price with the prior session’s close to predict the upcoming session’s opening gap pattern.
| Instrument | Gap | Prior Close | Predicted Open | Gap % |
|---|---|---|---|---|
| TLT | ▼ IGU | 79.38 | 79.61 | ▲ +0.29% |
| GLD | ▲ IGD | 355.45 | 354.86 | ▼ -0.16% |
| DIA | ▲ IGD | 523.15 | 521.97 | ▼ -0.23% |
| IJH | ▲ IGD | 73.76 | 73.40 | ▼ -0.49% |
| IWM | ▲ IGD | 277.54 | 275.75 | ▼ -0.64% |
| SPY | ▲ IGD | 754.37 | 747.92 | ▼ -0.86% |
| USO | ▼ OGD | 145.58 | 143.70 | ▼ -1.29% |
| QQQ | ▼ OGD | 679.89 | 668.32 | ▼ -1.70% |
Before the session opens, the table shows the predicted opening price and gap. Once the session opens, it uses the recorded opening price.
Glossary: IGU — Inside Gap Up: above the prior close, within the prior session’s range. IGD — Inside Gap Down: below the prior close, within that range. OGU — Outside Gap Up: above the prior session’s high. OGD — Outside Gap Down: below the prior session’s low.
As of: 2026-11-16 07:15 CT. Predicted gaps are best estimates as of publication and may change before the regular-session open, particularly when the session is still some time away.
Market News Summary:
U.S. index futures are under pressure as Nvidia’s leadership disruption and upcoming earnings dominate AI-sector headlines.
Primary Drivers & Risks:
- Primary Driver: Nvidia uncertainty weighs on technology futures
- Primary Risk: AI earnings and export-control scrutiny
Tone:
Cautious on technology, with supportive broader equity commentary.
Data, Market and System
Geopolitical:
- Treasury Secretary Scott Bessent urged Nvidia to clarify its compliance with AI-chip export controls, while its earnings briefing faces questions about China and Southeast Asian sales.
- The administration is reportedly planning to include Nvidia among more than two dozen AI-linked companies designated as national champions under a new support initiative.
Oil / Energy:
- WTI and Brent traders are weighing Persian Gulf tensions against rising production and an IEA forecast for a fourth-quarter supply surplus.
Macro / Other:
- Market commentary described robust economic growth and extraordinary corporate earnings growth in 2026.
- The S&P 500’s five largest stocks trade at almost the same forward price-to-earnings multiple as the remaining 495, with the narrowest gap since 2017.
Conclusion:
Nvidia’s leadership transition and earnings briefing are the central catalysts for technology-heavy index futures. Anthropic’s upcoming IPO adds another focus for the cautious AI trade.
Microsoft’s cash-flow decline highlights the cost of AI investment, while Morgan Stanley’s equity upgrade provides a contrasting supportive view. Export-control scrutiny and oil’s tension between supply growth and Gulf risks add separate cross-currents.
Market News Sentiment
Sentiment Bias shows the balance of positive and negative news coverage sampled from 2026-11-15 08:17 to 2026-11-16 07:17 ET, covering stocks, energy and gold.
▼ Market news
- Bias
- ▼ -20.35%
- Articles
- 113
- Positive
- ▲ 21.24%
- Neutral
- — 37.17%
- Negative
- ▼ 41.59%
▼ GLD / Gold
- Bias
- ▼ -50.00%
- Articles
- 4
- Positive
- — 0.00%
- Neutral
- — 50.00%
- Negative
- ▼ 50.00%
Sentiment Summary: Gold coverage was evenly split between negative and neutral, with no positive articles, as November 16 reporting linked prices near one-year lows to rising Fed hike expectations and a strong dollar. November 15 coverage noted a modest rebound after gold lost 4.5% last week, providing a limited counterweight, while flagging Treasury-yield risk tied to Fed Chair Kevin Warsh’s remarks. Gold remained below the reported $3,903 pivot, with $3,852 highlighted as support.
Conclusion: The main cross-market risk is tighter rate expectations and dollar strength accompanying persistent gold weakness.
▼ USO / Oil
- Bias
- ▼ -33.33%
- Articles
- 9
- Positive
- ▲ 22.22%
- Neutral
- — 22.22%
- Negative
- ▼ 55.56%
Sentiment Summary: Oil coverage leaned negative (56% negative versus 22% positive), as rising production and an IEA forecast for a fourth-quarter supply surplus outweighed Middle East tensions. On November 16, crude reversed initial gains linked to renewed attacks and threats to Strait of Hormuz shipments; potential supply disruptions remained the main counterweight to surplus concerns. Separately, November 15 coverage reported Asian equities falling as the November 13 U.S. chip-maker selloff spilled into the region, alongside weaker crude.
Conclusion: The supported context is concurrent technology-sector weakness and oil-supply pressure, with Middle East disruption risk limiting the bearish oil narrative.
Glossary: Sentiment Bias = (positive articles − negative articles) ÷ total articles × 100. It ranges from −100% negative to +100% positive. A reading near zero indicates little directional bias. Neutral articles reduce the score’s strength. ▲ positive; ▼ negative; — balanced. These readings describe news coverage, not market-price direction.
Market Technical Analysis
Analysis of VIX volatility, prior-session major ETFs and mega-cap tech stocks, and real-time futures snapshots and higher-time-frame analysis.
VIX — Market Fear Gauge Daily
| Level | Open | High | MaxVix | Low | MinVix | DNC% | DOC% | VR | MaxVR | MinVR |
|---|---|---|---|---|---|---|---|---|---|---|
| 19.29 | 18.32 | 20.92 | 28.36 | 18.13 | 16.21 | +3.16% | +5.29% | 8.69 | 56.57 | -6.27 |
VIX rose 5.29% from the session's opening level. VIX rose 3.16% versus the previous session close. Expected volatility rose from the period open. VIX is 25.3% up the recent 15-session range (16.21–28.36), in the 20–30% band.
VR: ATN Volatility Ratio (VR): 8.69 – Stocks fell while expected volatility rose. VR is in the lower part of its preceding 15-session VR range (-6.27 to 56.57), in the 20–30% band. VR fell 10.85 points from the previous session, a moderate shift relative to that range.
Range lookback: preceding 15 completed sessions.
Major ETFs and Mega Cap Tech Stocks
- S&P 500 and Nasdaq futures declined ahead of Nvidia’s earnings and Anthropic’s IPO, with technology and AI stocks under pressure.
- Nvidia interim CEO and CFO Colette Kress faces the company’s first earnings call since Jensen Huang’s abrupt departure.
- Huang is reportedly discussing a return, while a reinstatement petition has attracted more than 158,000 signatures.
- Asian chip stocks pulled regional equities lower amid the Nvidia leadership fallout.
- Microsoft reported 48% Azure growth, but free cash flow fell 27% as capital expenditure more than doubled, highlighting AI infrastructure costs.
- Morgan Stanley raised global equities to “maximum overweight,” citing valuations, earnings strength and an intact AI capital-spending cycle.
- Equal-weight funds outperformed during Nvidia’s stumble, while the FTSE 100 approached a two-week high as defence gains offset mining weakness.
ETF, Mag7, and Cross-Market ETF prior day Insights
Overall Tone
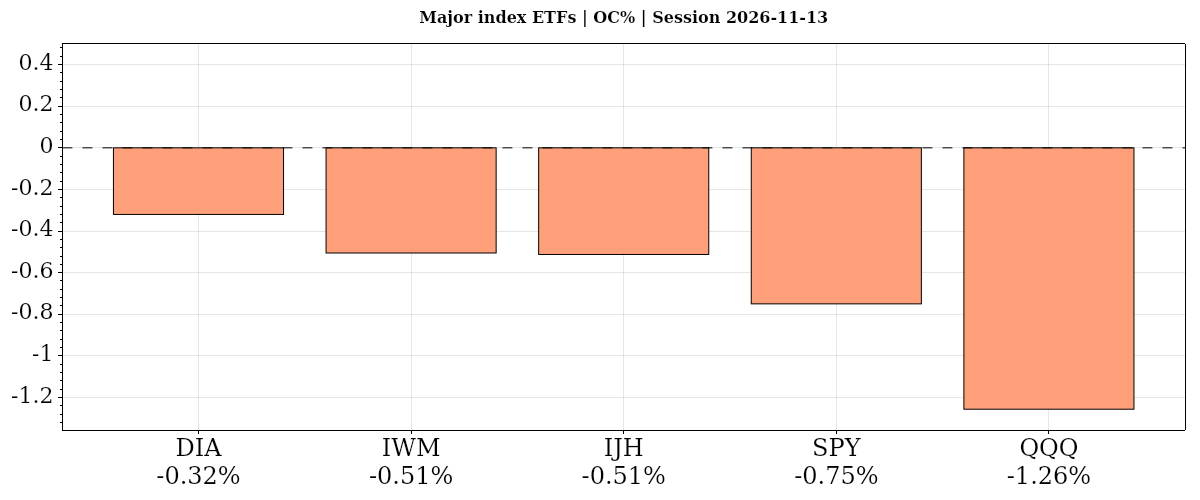
On November 13, 2026, daily risk tone was cautious, with declines from the open widespread and prior-close comparisons also predominantly negative.
| Instrument | Bias | Date | DNC% | DOC% | O | H | L | C | VWAP | Vol |
|---|---|---|---|---|---|---|---|---|---|---|
| ▼ DIA | ▲ ▼ ▲ | 2026-11-13 | ▲ +0.13% | ▼ -0.32% | 524.83 | 524.99 | 519.70 | 523.15 | ▲ 522.34 | 2,226,667 |
| ▼ IWM | ▼ ▼ ▲ | 2026-11-13 | ▼ -0.32% | ▼ -0.51% | 278.95 | 279.17 | 274.67 | 277.54 | ▲ 276.87 | 17,313,803 |
| ▼ IJH | ▼ ▼ ▲ | 2026-11-13 | ▼ -0.12% | ▼ -0.51% | 74.14 | 74.19 | 73.03 | 73.76 | ▲ 73.60 | 4,903,541 |
| ▼ SPY | ▼ ▼ ▲ | 2026-11-13 | ▼ -0.36% | ▼ -0.75% | 760.07 | 760.12 | 745.20 | 754.37 | ▲ 752.69 | 36,139,201 |
| ▼ QQQ | ▼ ▼ ▲ | 2026-11-13 | ▼ -1.20% | ▼ -1.26% | 688.54 | 688.75 | 671.68 | 679.89 | ▲ 678.09 | 39,641,356 |
| AVG/Sum | — | — | -0.38% | -0.67% | — | — | — | — | — | 100,224,568 |
Index ETFs
Negative confluence: average DNC% -0.37% versus the prior close, DOC% -0.67% from the open. All five index ETFs fell from the open: DIA held up best and QQQ lagged; versus the prior close, only DIA gained, while mid- and small-caps declined. QQQ retained aligned moving-average downtrends across horizons.
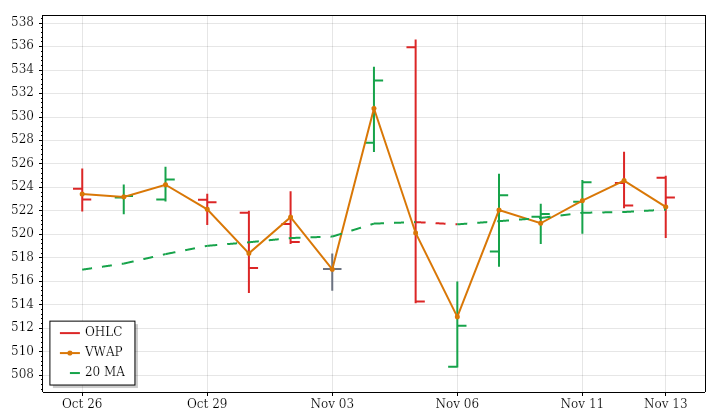
DIA · D:2026-11-13 NC% ▲ +0.13% OC% ▼ -0.32%
DIA – Dow Jones Technicals Summary
DIA’s completed November 13 daily session ended at 523.15, gaining 0.13% against the prior close despite losing 0.32% from the open. The opening gap was filled, and the session produced a lower high and lower low before closing within the previous day’s range. Finishing above VWAP provided a counterpoint to the retreat from the open, rather than evidence of a uniformly strong day.
The trend structure remained divided. Price stood above a falling near-term average, while intermediate- and far-term averages continued rising beneath it. The prior 15-session price trend was slightly negative and highly choppy, consistent with limited directional progress. Session range was somewhat below average and volume substantially lighter, opposing the lookback expansion in both. A fresh bullish ATR-median crossover conflicted with bearish PSAR; only a next-session high above 527.05 would trigger the latter’s bullish reversal.
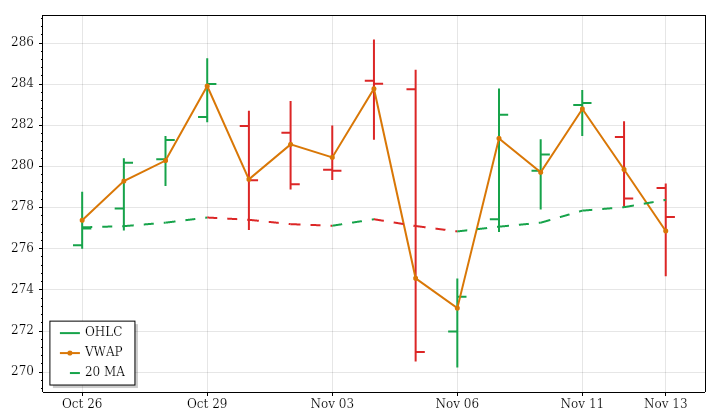
IWM · D:2026-11-13 NC% ▼ -0.32% OC% ▼ -0.51%
IWM – Small Cap Technicals Summary
IWM’s completed November 13 daily session closed at 277.54, down 0.32% against the prior close and 0.51% from the open. Its opening gap was filled, and lower highs and lows ended with a close below the previous day’s low. The finish above VWAP offered a limited counterpoint, but did not erase the deterioration in daily price structure.
The near-term picture was mixed because price sat below a rising average. Intermediate- and far-term averages were falling above price, leaving the broader structure weaker than the marginally positive 15-session price trend might suggest. Extremely low directional efficiency over that lookback underscored the lack of sustained progress. The latest range was essentially average, while volume was below average despite expanding ranges and increasing volume across the lookback. ATR-median was bullish but PSAR bearish; a next-session high above 282.371 would conditionally reverse PSAR.
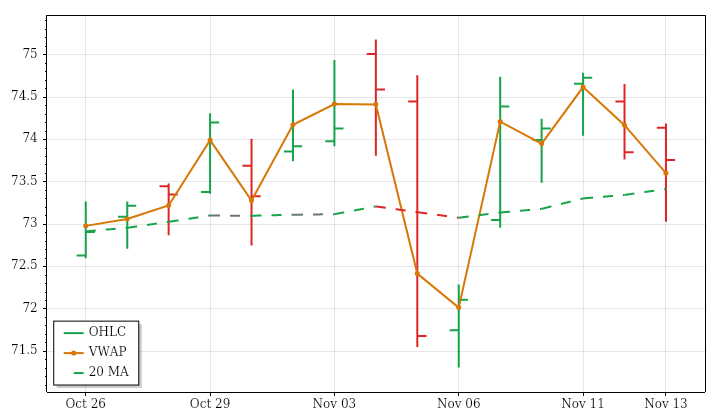
IJH · D:2026-11-13 NC% ▼ -0.12% OC% ▼ -0.51%
IJH – Mid Cap Technicals Summary
IJH’s completed November 13 daily session gave back its opening gap and finished at 73.76, down 0.12% from the prior close and 0.51% from the open. Lower highs and lows accompanied a close beneath the previous day’s low. However, the finish remained above VWAP, so the weak daily structure coexisted with a stronger position relative to the session’s volume-weighted trading price.
All three trend horizons were mixed. Price was below rising near- and far-term averages but above a falling intermediate-term average, providing no consistent directional alignment. The slightly positive 15-session price trend also showed little net progress relative to its fluctuations. Session range was modestly above average, matching lookback expansion, while volume was well below average despite a rising lookback trend. Bullish PSAR and ATR-median states contrasted with the latest decline; a next-session low below 71.6493 would conditionally reverse PSAR.
SPY · D:2026-11-13 NC% ▼ -0.36% OC% ▼ -0.75%
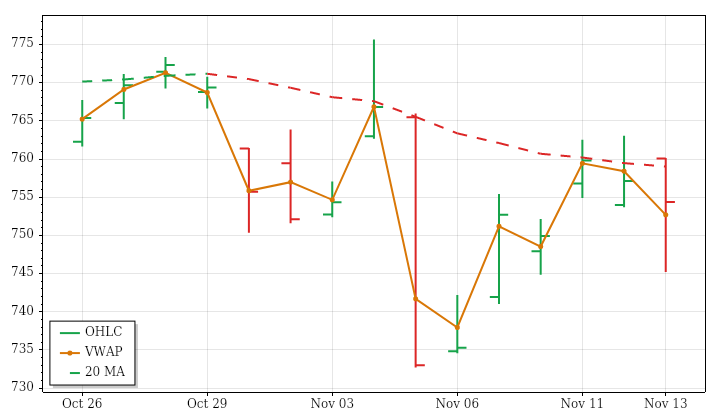
SPY – S&P 500 Technicals Summary
SPY’s completed November 13 daily session filled its opening gap and closed at 754.37, down 0.36% from the prior close and 0.75% from the open. A lower high and lower low included a breach of the previous session’s low, although the close returned inside that day’s range. Finishing above VWAP tempered, but did not negate, the weaker daily price action.
The trend structure remained conflicted: price was above a falling near-term average, below a falling intermediate-term average, and above a rising far-term average. The negative 15-session trend had low directional efficiency, indicating a choppy decline rather than continuous downside progress. Session range was about one and a half times average, matching lookback expansion, but volume was below average despite a rising lookback trend. PSAR and ATR-median remained bearish; a next-session high above 764.2675 would conditionally reverse PSAR.
S&P 500 News and Fundamentals
The S&P 500 gained 2.51% in the week ended November 13, snapping a four-week losing streak and recording its strongest week since August. The index remained roughly 3.3% below its record close. Goldman Sachs forecast that the benchmark would reach 8,700 over the next 12 months, arguing that more attractive valuations after the recent selloff could support gains despite slower earnings growth.
QQQ · D:2026-11-13 NC% ▼ -1.20% OC% ▼ -1.26%
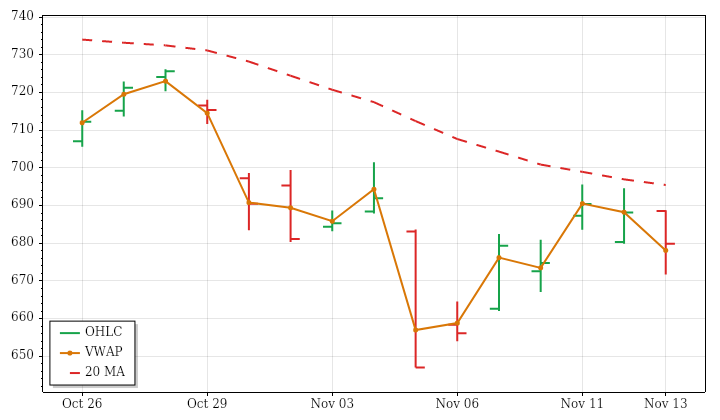
QQQ – Nasdaq 100 Technicals Summary
QQQ’s completed November 13 daily session closed at 679.89, losing 1.20% versus the prior close and 1.26% from the open. The small opening gap was filled, and lower highs and lows accompanied a second consecutive large-range session. The close remained inside the previous day’s range and above VWAP, so the weak daily return did not coincide with a below-VWAP finish.
Near-, intermediate- and far-term averages were all falling, with price just beneath the near-term benchmark and more clearly below the other two. That alignment supported the broader downward technical story, although low 15-session directional efficiency showed substantial intervening fluctuation. The latest range exceeded average, consistent with lookback expansion, while below-average volume contrasted with increasing lookback participation. Bullish PSAR conflicted with bearish ATR-median and moving-average structures. A next-session low below 651.7807 would conditionally reverse PSAR to bearish.
Nasdaq 100 News and Fundamentals
The Invesco QQQ Trust had declined more than 11% since October 6, placing it in correction territory.
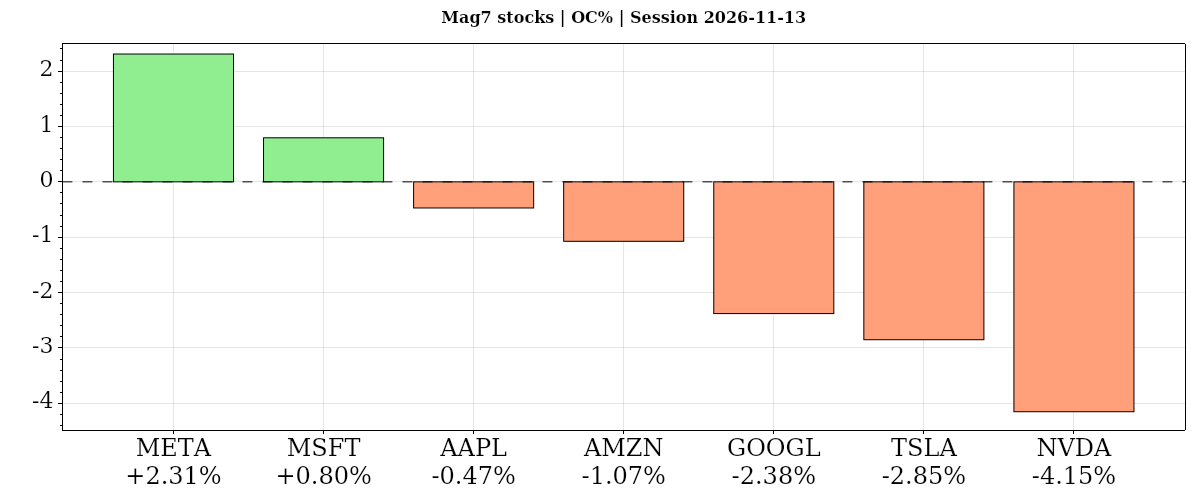
| Instrument | Bias | Date | DNC% | DOC% | O | H | L | C | VWAP | Vol |
|---|---|---|---|---|---|---|---|---|---|---|
| ▲ META | ▲ ▲ ▲ | 2026-11-13 | ▲ +2.90% | ▲ +2.31% | 627.21 | 643.91 | 624.79 | 641.69 | ▲ 636.04 | 15,099,051 |
| ▲ MSFT | ▲ ▲ ▲ | 2026-11-13 | ▲ +0.17% | ▲ +0.80% | 519.75 | 526.42 | 513.82 | 523.88 | ▲ 522.87 | 25,513,557 |
| ▼ AAPL | ▲ ▼ ▼ | 2026-11-13 | ▲ +0.39% | ▼ -0.47% | 357.96 | 360.83 | 355.75 | 356.27 | ▼ 357.72 | 39,188,111 |
| ▼ AMZN | ▼ ▼ ▲ | 2026-11-13 | ▼ -0.29% | ▼ -1.07% | 269.56 | 270.05 | 263.91 | 266.66 | ▲ 266.40 | 29,909,494 |
| ▼ GOOGL | ▼ ▼ ▼ | 2026-11-13 | ▼ -0.98% | ▼ -2.38% | 302.98 | 304.97 | 293.44 | 295.77 | ▼ 297.11 | 30,753,344 |
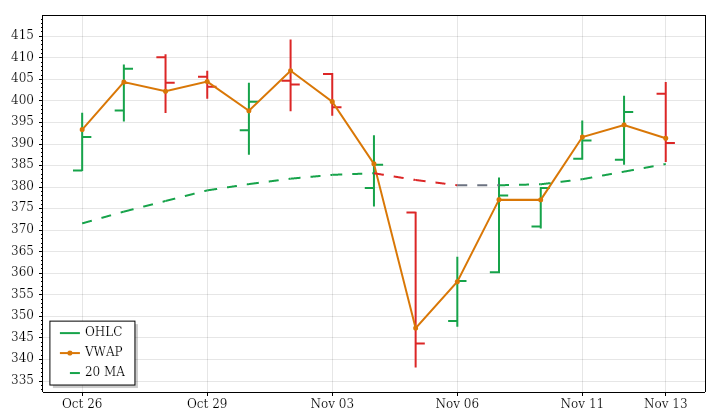
| ▼ TSLA | ▼ ▼ ▼ | 2026-11-13 | ▼ -1.82% | ▼ -2.85% | 401.68 | 404.40 | 385.83 | 390.22 | ▼ 391.33 | 32,236,590 |
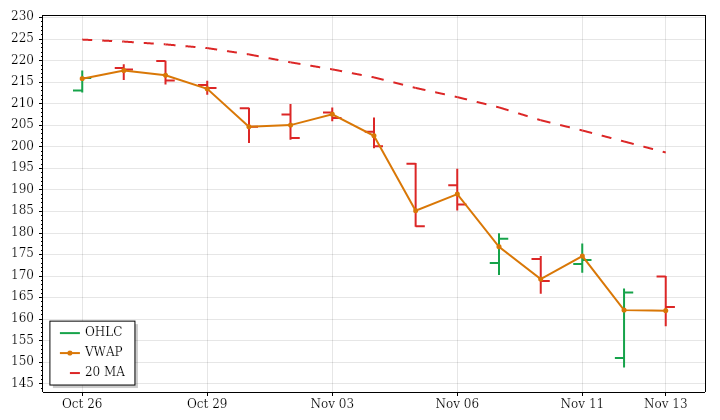
| ▼ NVDA | ▼ ▼ ▲ | 2026-11-13 | ▼ -2.01% | ▼ -4.15% | 169.91 | 170.00 | 158.39 | 162.85 | ▲ 161.97 | 362,985,199 |
| AVG/Sum | — | — | -0.23% | -1.12% | — | — | — | — | — | 535,685,346 |
Mag7 Stocks
Negative confluence: average DNC% -0.23% versus the prior close, DOC% -1.12% from the open. META led both comparisons, gaining 2.31% from the open; NVDA lagged both, losing 4.15% from the open on above-average volume within aligned downtrends. Only META and MSFT gained from the open, versus three prior-close gainers as AAPL joined them.
META · D:2026-11-13 NC% ▲ +2.90% OC% ▲ +2.31%
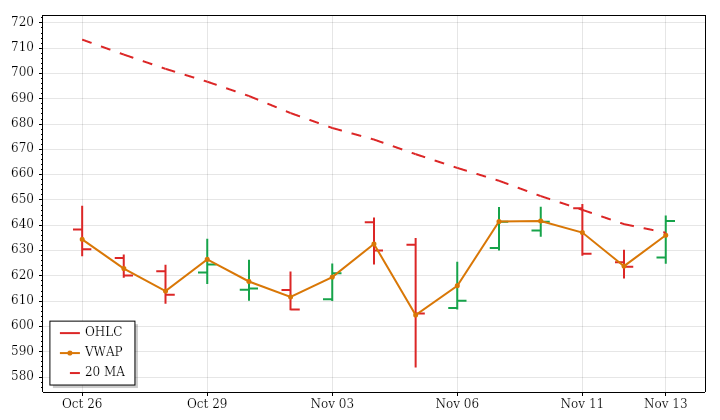
META – Meta Platforms Technicals Summary
META’s completed November 13 daily session showed sustained strength after an opening gap, closing at 641.69 with a 2.90% gain versus the prior close and a 2.31% rise from the open. The gap remained unfilled, and higher highs and lows culminated in a finish above the previous day’s high, near the session high and above VWAP.
That advance improved price positioning without resolving the mixed trend structure. Price was above a falling near-term average and above a rising far-term average, while the intermediate-term average remained falling overhead. The latest range was modestly above its prior 15-session average, consistent with expanding lookback ranges. Volume, however, was below average alongside a declining volume trend, limiting participation behind the strong price move. PSAR and ATR-median were bullish; a next-session low below 608.475 would conditionally trigger a bearish PSAR reversal.
Meta News and Fundamentals
Meta is testing a prediction-market app with employees. The app, which remains under development, lets users wager on questions or events using “cred” rather than real money. Whether Meta will release it publicly remains unclear.
MSFT · D:2026-11-13 NC% ▲ +0.17% OC% ▲ +0.80%
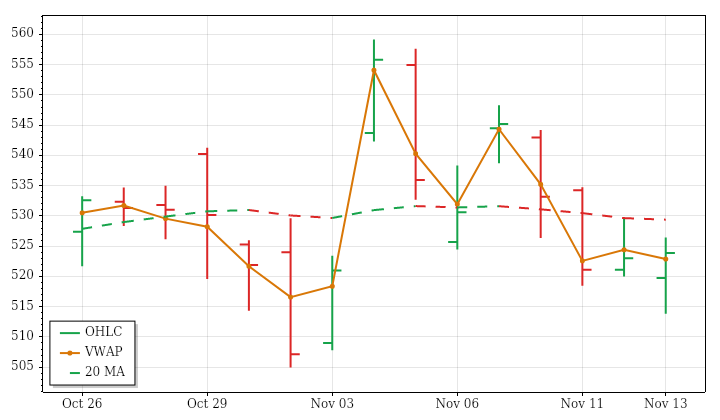
MSFT – Microsoft Technicals Summary
MSFT’s completed November 13 daily session recovered from a gap below the prior range to close at 523.88. It gained 0.80% from the open but only 0.17% versus the prior close, distinguishing the intraday rebound from the small daily advance. Although the session made a lower high and lower low, the finish returned inside the previous day’s range, near the session high and above VWAP.
Price remained below rising near- and intermediate-term averages, leaving those horizons mixed, while the far-term uptrend stayed intact beneath it. The prior 15-session price trend was slightly positive but exceptionally inefficient, indicating substantial churn. Both session range and volume were below average despite rising lookback trends in each. Fresh bearish ATR-median and PSAR states conflicted with the recovery. A next-session high above 559.15 would conditionally trigger a bullish PSAR reversal.
Microsoft News and Fundamentals
A Microsoft 365 outage that began Thursday disrupted Outlook, Teams, Copilot and other workplace applications across more than 70 countries, affecting government offices and businesses. On November 13, Microsoft said services were returning to normal after prolonged restoration efforts. Separately, authorities were investigating a major FAA outage; Microsoft said its products were not involved.
AAPL · D:2026-11-13 NC% ▲ +0.39% OC% ▼ -0.47%
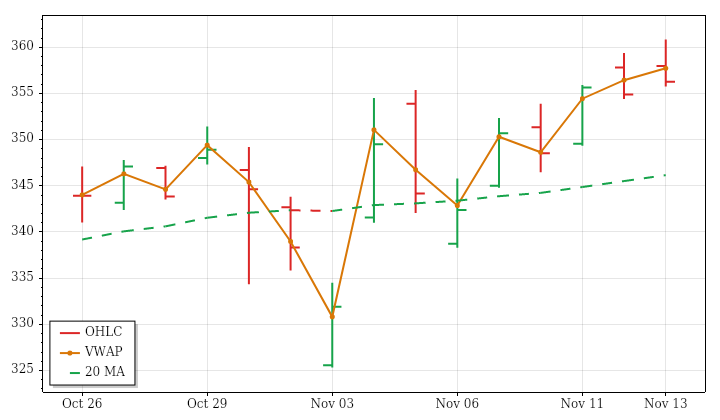
AAPL – Apple Technicals Summary
AAPL’s completed November 13 daily session preserved a small gain over the prior close, but the intraday action was softer: it finished at 356.27, up 0.39% day over day and down 0.47% from the open. The opening gap remained unfilled, while a higher high and higher low contrasted with a finish near the session low and below VWAP. That combination separates the positive daily return from weaker trading after the open.
Near-, intermediate- and far-term averages remained rising with price above them, so the session did not disrupt the aligned upward structure. However, the broader 15-session advance had low directional efficiency, indicating considerable back-and-forth movement. The latest range and volume were below their prior 15-session averages, contrasting with expanding lookback ranges but matching declining volume. A next-session low below 344.2482 would trigger a conditional PSAR bearish reversal.
Apple News and Fundamentals
Apple reported record revenue and earnings per share for its fiscal fourth quarter of 2026. Rising memory and research-and-development costs were identified as potential margin pressures, while adoption of the new premium iPhone Duo was highlighted as a potential first-quarter catalyst.
AMZN · D:2026-11-13 NC% ▼ -0.29% OC% ▼ -1.07%
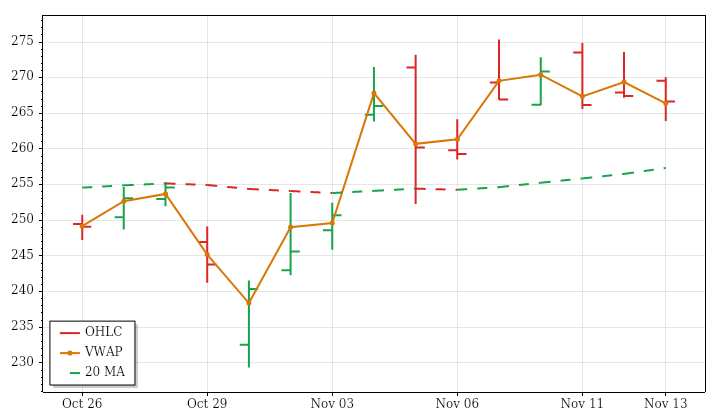
AMZN – Amazon Technicals Summary
AMZN’s completed November 13 daily session reversed an opening gain and finished at 266.66, down 0.29% from the prior close and 1.07% from the open. The gap was filled, and lower highs and lows culminated in a close below the previous day’s low. Nevertheless, the finish was slightly above session VWAP, showing that the weak daily result did not also mean a below-VWAP close.
The decline conflicted with rising near-, intermediate- and far-term averages, all still beneath price. The near-term cushion was relatively modest, making the latest weakness more relevant to that horizon than to the broader upward structure. Both range and volume were below their prior 15-session averages, despite expanding ranges and increasing volume across that lookback. Thus, the session’s deterioration occurred without above-average participation. A next-session low below 263.7921 would conditionally reverse PSAR to bearish.
Amazon News and Fundamentals
Amazon plans to build a World Product Graph containing information about virtually every product available online, including items it does not stock, Reuters reported November 13, citing an internal document and unnamed sources. Amazon also refreshed its Kindle lineup, including a $290 Colorsoft and $320 Signature Edition, and launched an indoor Ring security drone. Recently reported revenue grew 14% year over year, while cloud revenue rose 39%.
GOOGL · D:2026-11-13 NC% ▼ -0.98% OC% ▼ -2.38%
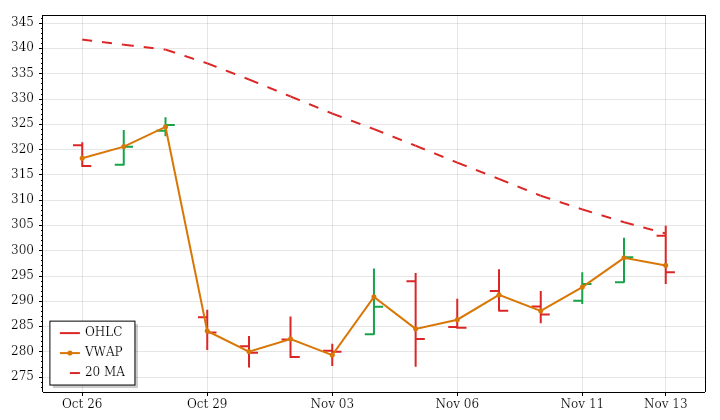
GOOGL – Alphabet Technicals Summary
GOOGL’s completed November 13 daily session rejected an opening gap above the prior range and closed at 295.77. The loss was 0.98% versus the prior close but a larger 2.38% from the open. An outside bar showed substantial movement in both directions, yet the finish below VWAP and back inside the previous day’s range reflected the failure to retain the opening strength.
Price remained above its falling near-term average, leaving that horizon mixed rather than clearly bullish. Intermediate- and far-term averages were falling above price, aligning with the downward 15-session trend. The latest range was roughly one and a half times average, extending the lookback expansion and marking a second consecutive large-range session. Volume was below average, consistent with declining lookback participation. PSAR remained bullish in conflict with broader weakness; a next-session low below 282.4969 would conditionally reverse it.
TSLA · D:2026-11-13 NC% ▼ -1.82% OC% ▼ -2.85%
TSLA – Tesla Technicals Summary
TSLA’s completed November 13 daily session rejected an opening gap above the prior range and finished at 390.22, down 1.82% versus the prior close and 2.85% from the open. The gap was filled, and the close ended below VWAP inside the previous day’s range. A higher high and higher low therefore contrasted with the clear loss of ground after the open.
Price remained above a falling near-term average, a rising intermediate-term average and a falling far-term average. This left the intermediate uptrend intact but the other horizons mixed, against a negative 15-session price trend. The latest range exceeded average and marked a second consecutive large-range session, consistent with expanding lookback ranges. Below-average volume matched the declining participation trend. Bullish PSAR and a fresh bullish ATR-median crossover conflicted with the session loss; a next-session low below 347.6132 would conditionally reverse PSAR.
NVDA · D:2026-11-13 NC% ▼ -2.01% OC% ▼ -4.15%
NVDA – Nvidia Technicals Summary
NVDA’s completed November 13 daily session reversed an opening gap higher and closed at 162.85, down 2.01% versus the prior close and 4.15% from the open. The gap was filled. Despite a higher high and higher low, the finish returned inside the prior day’s range, illustrating why those relative extremes did not translate into a positive session. Price nevertheless closed above VWAP.
Near-, intermediate- and far-term averages were all falling above price, aligning the latest decline with the broader downward structure. The 15-session trend also showed more sustained directional movement than a purely choppy decline. Range was roughly one and a half times average, and volume was substantially above average, reinforcing expanding ranges and increasing participation across the lookback. Both PSAR and ATR-median remained bearish. A next-session high above 174.9471 would conditionally trigger a bullish PSAR reversal.
Nvidia News and Fundamentals
Jensen Huang resigned as Nvidia CEO after leading the company for 33 years. Bloomberg reported that a Chinese company founded by Alice Huang procured smuggled Nvidia AI chips installed at a Shanghai data center; some servers were originally sold to Singapore-based Nvidia Cloud Partner Aperia Cloud Services. U.S. officials said November 13 that President Trump did not expect the Nvidia controversy to feature in discussions during his upcoming China trip.
| Instrument | Bias | Date | DNC% | DOC% | O | H | L | C | VWAP | Vol |
|---|---|---|---|---|---|---|---|---|---|---|
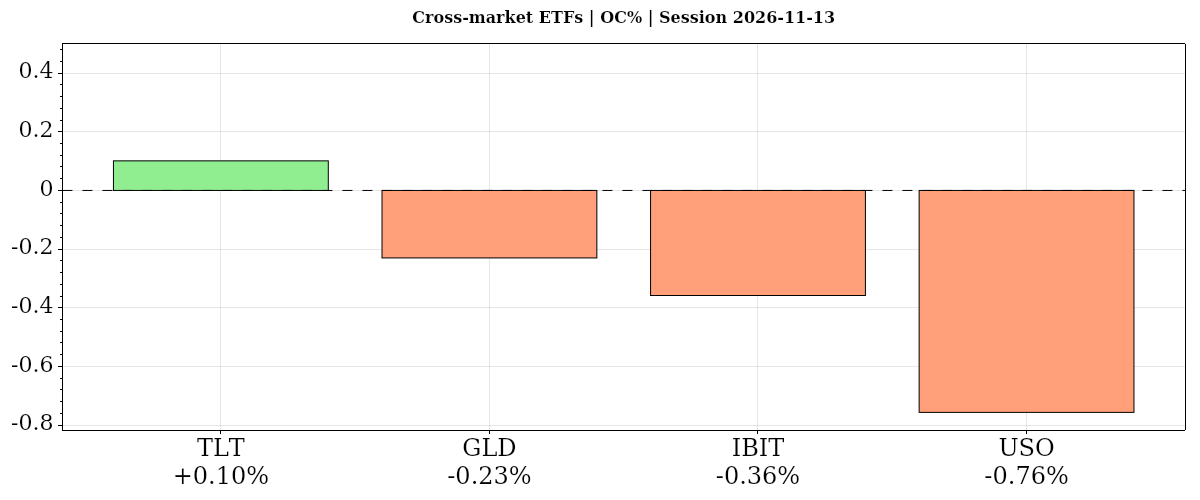
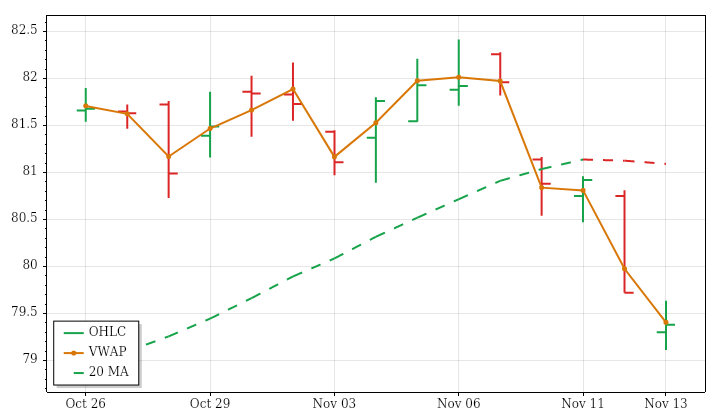
| ▲ TLT | ▼ ▲ ▼ | 2026-11-13 | ▼ -0.43% | ▲ +0.10% | 79.30 | 79.64 | 79.11 | 79.38 | ▼ 79.41 | 30,830,681 |
| ▼ GLD | ▲ ▼ ▼ | 2026-11-13 | ▲ +0.16% | ▼ -0.23% | 356.27 | 357.32 | 354.41 | 355.45 | ▼ 355.63 | 11,900,050 |
| ▼ IBIT | ▼ ▼ ▲ | 2026-11-13 | ▼ -3.52% | ▼ -0.36% | 39.08 | 39.27 | 38.49 | 38.94 | ▲ 38.91 | 52,237,550 |
| ▼ USO | ▼ ▼ ▼ | 2026-11-13 | ▼ -0.34% | ▼ -0.76% | 146.69 | 147.02 | 144.53 | 145.58 | ▼ 145.58 | 1,934,596 |
| AVG/Sum | — | — | -1.03% | -0.31% | — | — | — | — | — | 96,902,877 |
Cross-Market ETFs
Negative confluence: average DNC% -1.03% versus the prior close, DOC% -0.31% from the open. Bonds alone edged higher from the open while oil lagged; versus the prior close, gold alone rose, diverging from equities despite falling moving averages. Bitcoin lost 3.52% versus the prior close, largely reflecting its downward opening gap.
TLT · D:2026-11-13 NC% ▼ -0.43% OC% ▲ +0.10%
TLT – Long-Term Treasury Bonds Technicals Summary
TLT’s completed November 13 daily session closed at 79.38, down 0.43% from the prior close despite rising 0.10% from the open. The small intraday recovery did not fill the opening gap below the prior range. Lower highs and lows left the finish beneath the previous day’s low and slightly below VWAP, preserving a weak overall session structure.
Price remained below rising near- and intermediate-term averages, making both horizons mixed rather than established uptrends. It was also below a falling far-term average, consistent with the negative 15-session price trend. The latest range and volume were below their prior 15-session averages, contrasting with expansion in both measures across the lookback. A fresh bearish ATR-median crossover aligned with the existing bearish PSAR state. A next-session high above 81.6159 would conditionally trigger a bullish PSAR reversal, rather than confirm one now.
GLD · D:2026-11-13 NC% ▲ +0.16% OC% ▼ -0.23%
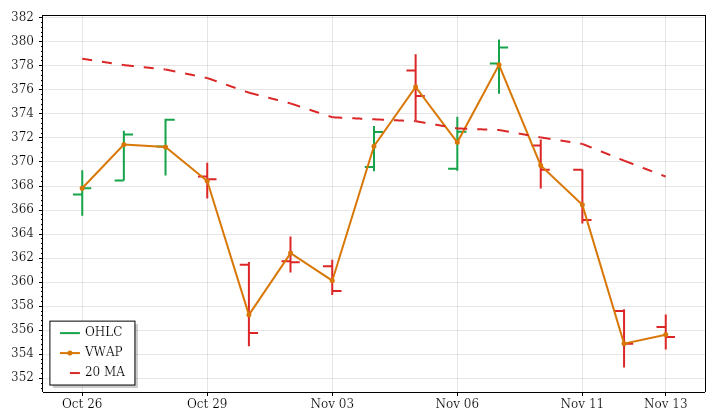
GLD – Gold Technicals Summary
GLD’s completed November 13 daily session edged up 0.16% from the prior close to 355.45, yet fell 0.23% from its opening level. The opening gap was filled, and an inside bar kept the entire session within the previous day’s range. A finish slightly below VWAP reinforced the distinction between the modest positive daily return and the weaker open-to-close performance.
Near-, intermediate- and far-term averages all remained falling above price, leaving the small advance contrary to an aligned downward structure. The close also remained close to the supplied 52-week low rather than materially changing that broader positioning. Trading range contracted below its prior 15-session average even as volume exceeded average, consistent with rising lookback participation but not expanding lookback ranges. PSAR and ATR-median were in fresh bearish states. A next-session high above 378.8165 would conditionally trigger a bullish PSAR reversal.
Gold News and Fundamentals
Gold fell below $3,900 an ounce during a weak week, although spot prices were modestly higher late Friday. Reports attributed pressure to persistent inflation concerns, elevated Treasury yields and expectations of further Federal Reserve tightening. Goldman Sachs lowered its year-end gold forecast from $4,650 to $4,150 an ounce and its year-end 2027 forecast from $5,400 to $4,800, citing the Fed’s hawkish shift and changes in investor positioning.
IBIT · D:2026-11-13 NC% ▼ -3.52% OC% ▼ -0.36%
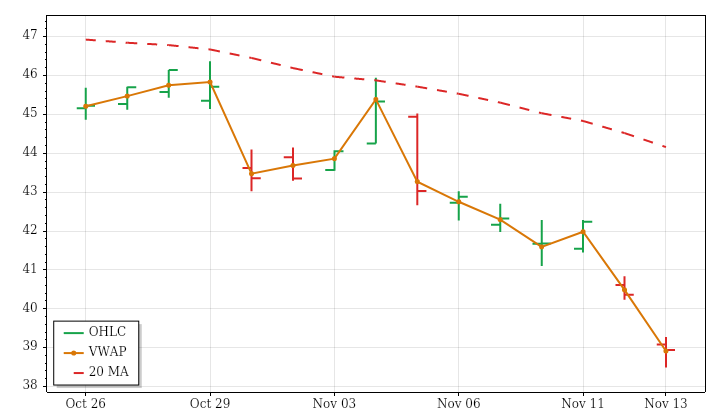
IBIT – Bitcoin Technicals Summary
IBIT’s completed November 13 daily session fell 3.52% from the prior close to 38.94, with most of that damage occurring in the opening gap. The additional open-to-close loss was only 0.36%. The gap remained unfilled, and a lower high and lower low left the close below the previous day’s low. A finish just above VWAP qualified the intraday weakness without offsetting the substantial day-over-day decline.
Near- and intermediate-term averages were falling above price. The far-term picture was mixed because price was also below that benchmark even though the average remained rising. The latest range was below its prior 15-session average, but volume was above average, matching increasing lookback participation while contrasting with expanding ranges. Both PSAR and ATR-median remained bearish. A next-session high above 41.9175 would be required to trigger a conditional bullish PSAR reversal.
USO · D:2026-11-13 NC% ▼ -0.34% OC% ▼ -0.76%
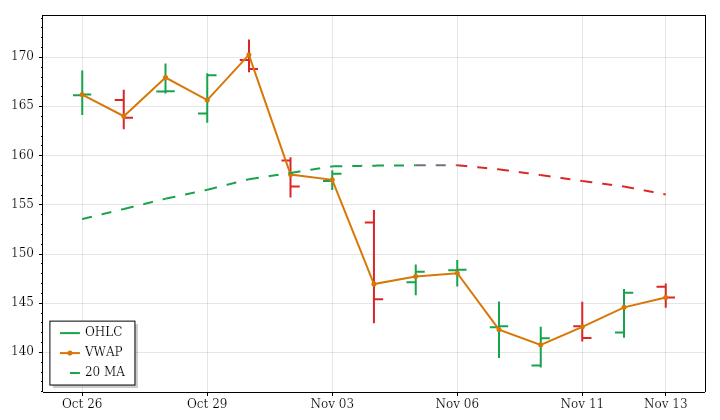
USO – Oil Technicals Summary
USO’s completed November 13 daily session filled its opening gap above the prior range and closed at 145.58. It lost 0.34% versus the prior close and 0.76% from the open. Although the session produced a higher high and higher low, the finish returned inside the previous day’s range and sat almost exactly at, but slightly below, VWAP.
The trend picture remained divided. Price was barely above a falling near-term average and below a rising intermediate-term average, while the far-term average continued rising beneath it. Thus, the negative 15-session price trend represented shorter-horizon weakness within a still-positive far-term structure. Session range was well below average despite expanding lookback ranges, and very light volume matched declining lookback participation. PSAR and ATR-median remained bearish. A next-session high above 148.727 would conditionally trigger a bullish PSAR reversal, not establish a broader trend change in advance.
Oil News and Fundamentals
The International Energy Agency said November 13 that the global oil market was expected to return to surplus in the fourth quarter for the first time since the Iran war began, as Gulf exports recovered. Oil prices rose Friday as traders weighed continued Middle Eastern shipment disruptions against prospects for U.S.-Iran diplomacy. Rising U.S. crude and fuel inventories remained a counterweight to supply risks.
Glossary: Instrument — ticker symbol; hover for the instrument or company name; Date — session date. DNC% — prior-session close to this session’s close; DOC% — daily session open-to-close percentage change. O — open; H — high; L — low; C — close, all for the table’s daily or weekly session; VWAP — volume-weighted average price; its arrow shows whether the close is above or below VWAP. Vol — period trading volume.
Bias — three directional readings, in order: DNC%, DOC%, then VWAP. ▲ positive/above; ▼ negative/below; — neutral or unavailable. Matching arrows show alignment; opposing arrows show mixed conditions. AVG/Sum — simple average of percentage changes and sum of reported volumes.
Futures Session Fib Grid Analysis – Snapshot
Session Fib Grids normalise market positioning as percentages, making direction and alignment comparable across different asset types.
Latest available snapshot for each instrument; Time(CT) shows the individual update date and time.
| Instrument | Bias | Time(CT) | YSFG | MSFG | WSFG | RSFG | SFG | TSI |
|---|---|---|---|---|---|---|---|---|
| ▼ ES | ▲ ▼ ▼ ▼ ▼ ▼ | 2026-11-16 06:30:30 | ▲ +36 | ▼ -37 | ▼ -22 | ▼ -53 | ▼ -24 | ▼ -272 |
| ▼ NQ | ▲ ▼ ▼ ▼ ▼ ▼ | 2026-11-16 06:30:29 | ▲ +21 | ▼ -43 | ▼ -29 | ▼ -78 | ▼ -28 | ▼ -281 |
| ▼ YM | ▲ ▲ ▼ ▼ ― ▼ | 2026-11-16 06:30:14 | ▲ +32 | ▲ +14 | ▼ -4 | ▼ -11 | — 0 | ▼ -147 |
| ▼ EMD | ▲ ― ▼ ▼ ▼ ▼ | 2026-11-16 06:24:58 | ▲ +34 | — 0 | ▼ -26 | ▼ -58 | ▼ -4 | ▼ -144 |
| ▼ RTY | ▲ ▼ ▼ ▼ ▼ ▼ | 2026-11-16 06:30:23 | ▲ +30 | ▼ -34 | ▼ -18 | ▼ -40 | ▼ -10 | ▼ -184 |
| ▼ FDAX | ▲ ▲ ▼ ▼ ▼ ▼ | 2026-11-16 06:30:30 | ▲ +50 | ▲ +71 | ▼ -15 | ▼ -17 | ▼ -17 | ▼ -129 |
| ▼ NKD | ▲ ▼ ▼ ▼ ▼ ▼ | 2026-11-16 06:30:05 | ▲ +105 | ▼ -42 | ▼ -38 | ▼ -118 | ▼ -24 | ▼ -309 |
| Instrument | Bias | Time(CT) | YSFG | MSFG | WSFG | RSFG | SFG | TSI |
|---|---|---|---|---|---|---|---|---|
| ▼ BTC | ▼ ▼ ▼ ▼ ▼ ▼ | 2026-11-16 06:29:36 | ▼ -96 | ▼ -96 | ▼ -13 | ▼ -65 | ▼ -40 | ▼ -222 |
| ▲ GC | ▼ ▼ ▲ ▲ ▲ ▲ | 2026-11-16 06:30:26 | ▼ -172 | ▼ -3 | ▲ +3 | ▲ +9 | ▲ +29 | ▲ +63 |
| ▼ CL | ▲ ▼ ▼ ▼ ▼ ▼ | 2026-11-16 06:30:28 | ▲ +149 | ▼ -84 | ▼ -10 | ▼ -27 | ▼ -49 | ▼ -117 |
| ▼ 6E | ▼ ▼ ▼ ▼ ▲ ▼ | 2026-11-16 06:30:22 | ▼ -73 | ▼ -61 | ▼ -11 | ▼ -23 | ▲ +3 | ▼ -28 |
| ▲ ZB | ▼ ▼ ▲ ▲ ▲ ▲ | 2026-11-16 06:29:36 | ▼ -41 | ▼ -41 | ▲ +13 | ▲ +29 | ▲ +17 | ▲ +106 |
Glossary: YSFG — yearly; MSFG — monthly; WSFG — weekly; RSFG — regular trading hours (RTH); SFG — the current session, including pre-market or other sessions. TSI indicates trend strength and power.
Bias shows trend alignment across these six readings. The arrows follow the column order: YSFG, MSFG, WSFG, RSFG, SFG and TSI. Matching arrows show alignment; opposing arrows show mixed conditions.
Futures Higher Time Frame Analysis
Summary of the current state of US Indices Futures based on higher time-frame (HTF) technical analysis as of: 2026-11-16 07:15 -06:00 CT.
US Indices Futures
- ES — YSFG bullish, MSFG/WSFG bearish, below declining weekly benchmarks, weekly pivots down, support 7322.25–7361.25, resistance 7645.75–7700.75.
- NQ — YSFG bullish, MSFG/WSFG bearish, below all daily benchmarks, weekly pivots down, support 26366.50, resistance 28580–28728.50.
- YM — YSFG bullish, above monthly NTZ, WSFG bearish, weekly benchmarks mixed, weekly pivots down, support 50859–50891, resistance 52850–52885.
- EMD — YSFG bullish, MSFG neutral, WSFG bearish, below five daily benchmarks, weekly pivots down, support 3560.7, resistance 3750.3–3770.1.
- RTY — YSFG bullish, MSFG/WSFG bearish, below all daily benchmarks, weekly pivots down, support 2714.2, resistance 2809.9–2827.2, weekly reversal threshold 2906.0.
- FDAX — YSFG/MSFG bullish, WSFG bearish, above six rising weekly benchmarks, pivots up, daily support 25695, resistance 27084, weekly reversal threshold 25512.
Overall State
- Short-Term: Bearish
- Intermediate-Term: Neutral
- Long-Term: Bullish
Conclusion
Bearish WSFG readings align across all six instruments, with recent short signals contrasting with YM’s supplied long signals. ES, NQ and RTY show correlated daily weakness beneath monthly grid references; EMD remains within its monthly NTZ. YM retains mixed intermediate structure, while FDAX leads through rising pivots and benchmarks. Weekly long-term structures remain bullish across the group, although NQ, EMD and RTY carry bearish daily far-term ratings. Recent swing lows define underlying support; rebound highs and benchmark clusters remain overhead resistance outside FDAX’s broader upward structure.
Note: Intra-day counter-trend pullbacks or retracements may occur, HTF is context for informational usage and market structure. Glossary: Session Fib Grids periods of YSFG:’Yearly’, MSFG:’Monthly’, WSFG:’Weekly’
For full details visit: AlphaWebTrader Technicals
SPY Daily View
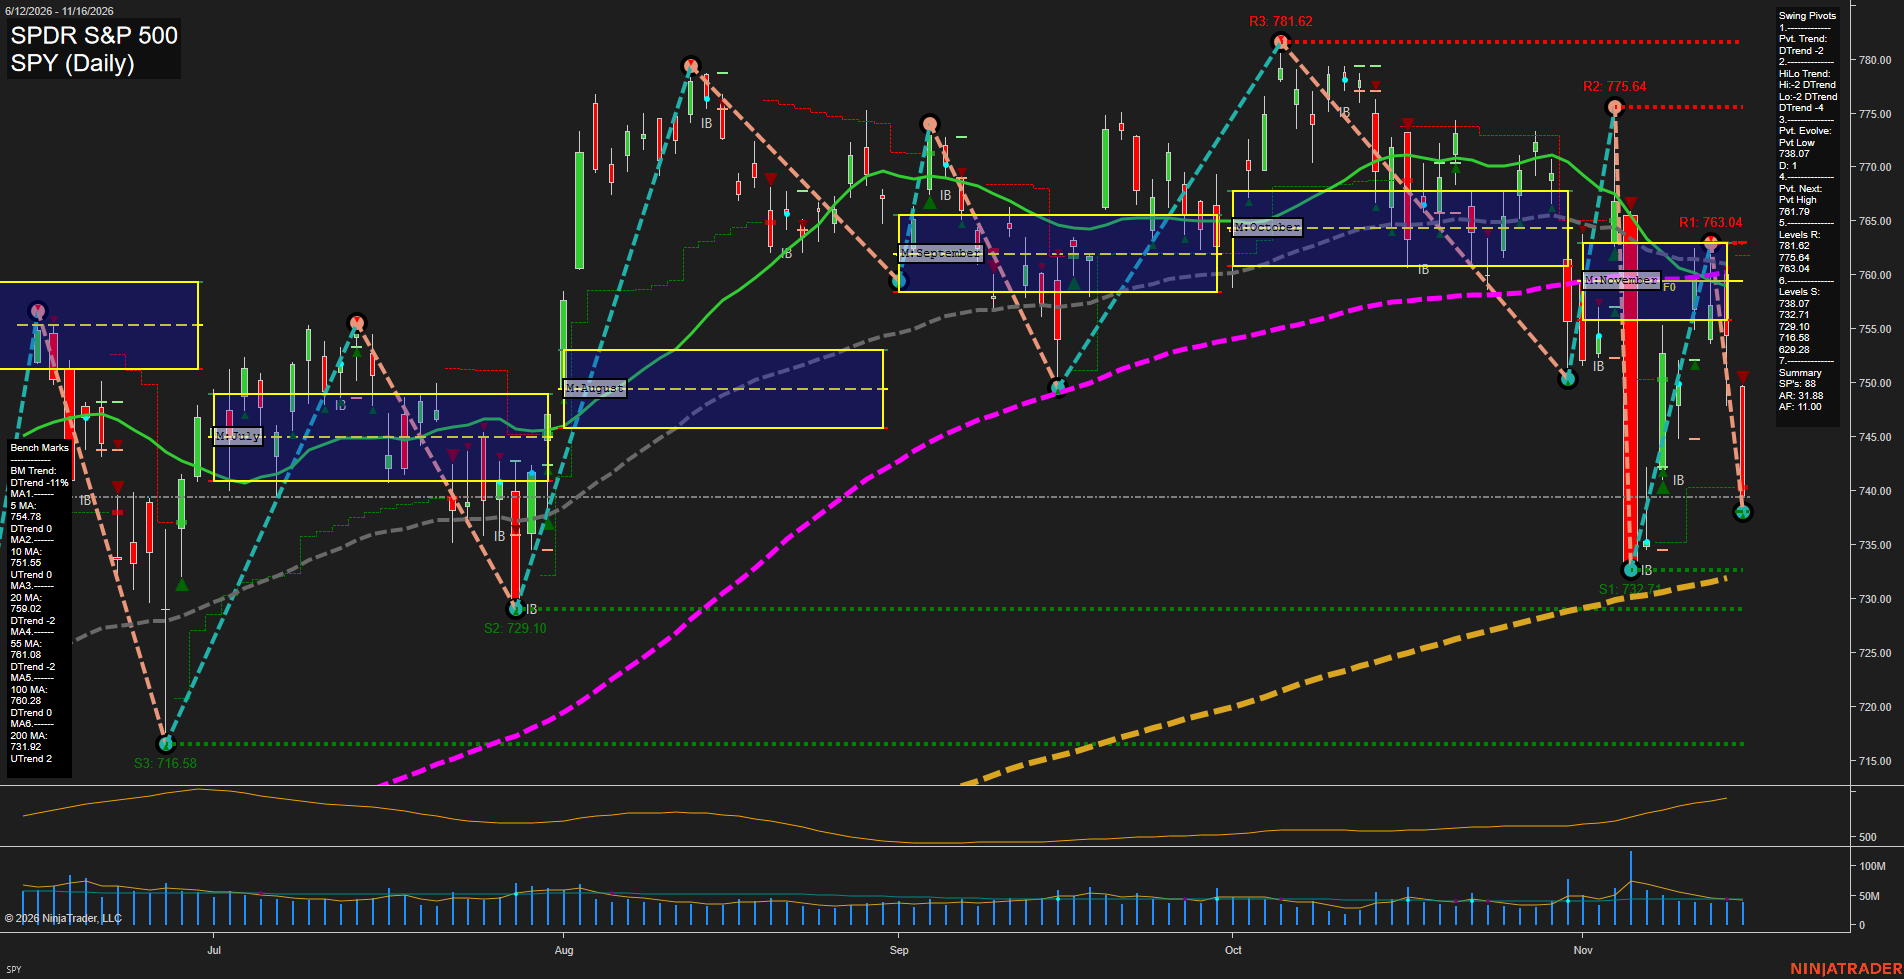
Overall Rating
- Near-Term: Bullish
- Medium-Term: Bearish
- Far-Term: Neutral.
Key Insights Summary
From a futures swing trader’s perspective, SPY shows a near-term rebound within a medium-term corrective structure, rather than a confirmed broad trend reversal. The recovery from 732.71 established an upward pivot trend, with price above rising 5- and 10-day benchmarks. However, the latest large red candle and rejection near 763.04 show renewed selling pressure. Price remains below the November NTZ and the declining 20-, 55-, and 100-day benchmarks clustered around 759–761. Lower swing highs and lower swing lows reinforce the medium-term bearish reading, while the rising 200-day benchmark preserves a mixed longer-term backdrop. Expanding ranges and elevated ATR indicate volatile, two-way price discovery. These are SPY reference levels, not executable futures prices; futures pricing includes a basis difference. Weekly and yearly grids and the specified recent trade-signal series are not visible, so their neutral entries represent unavailable confirmation. News and seasonal effects cannot be established from this chart alone.
View charts on: AlphaWebTrader HTF Charts
ES Daily View
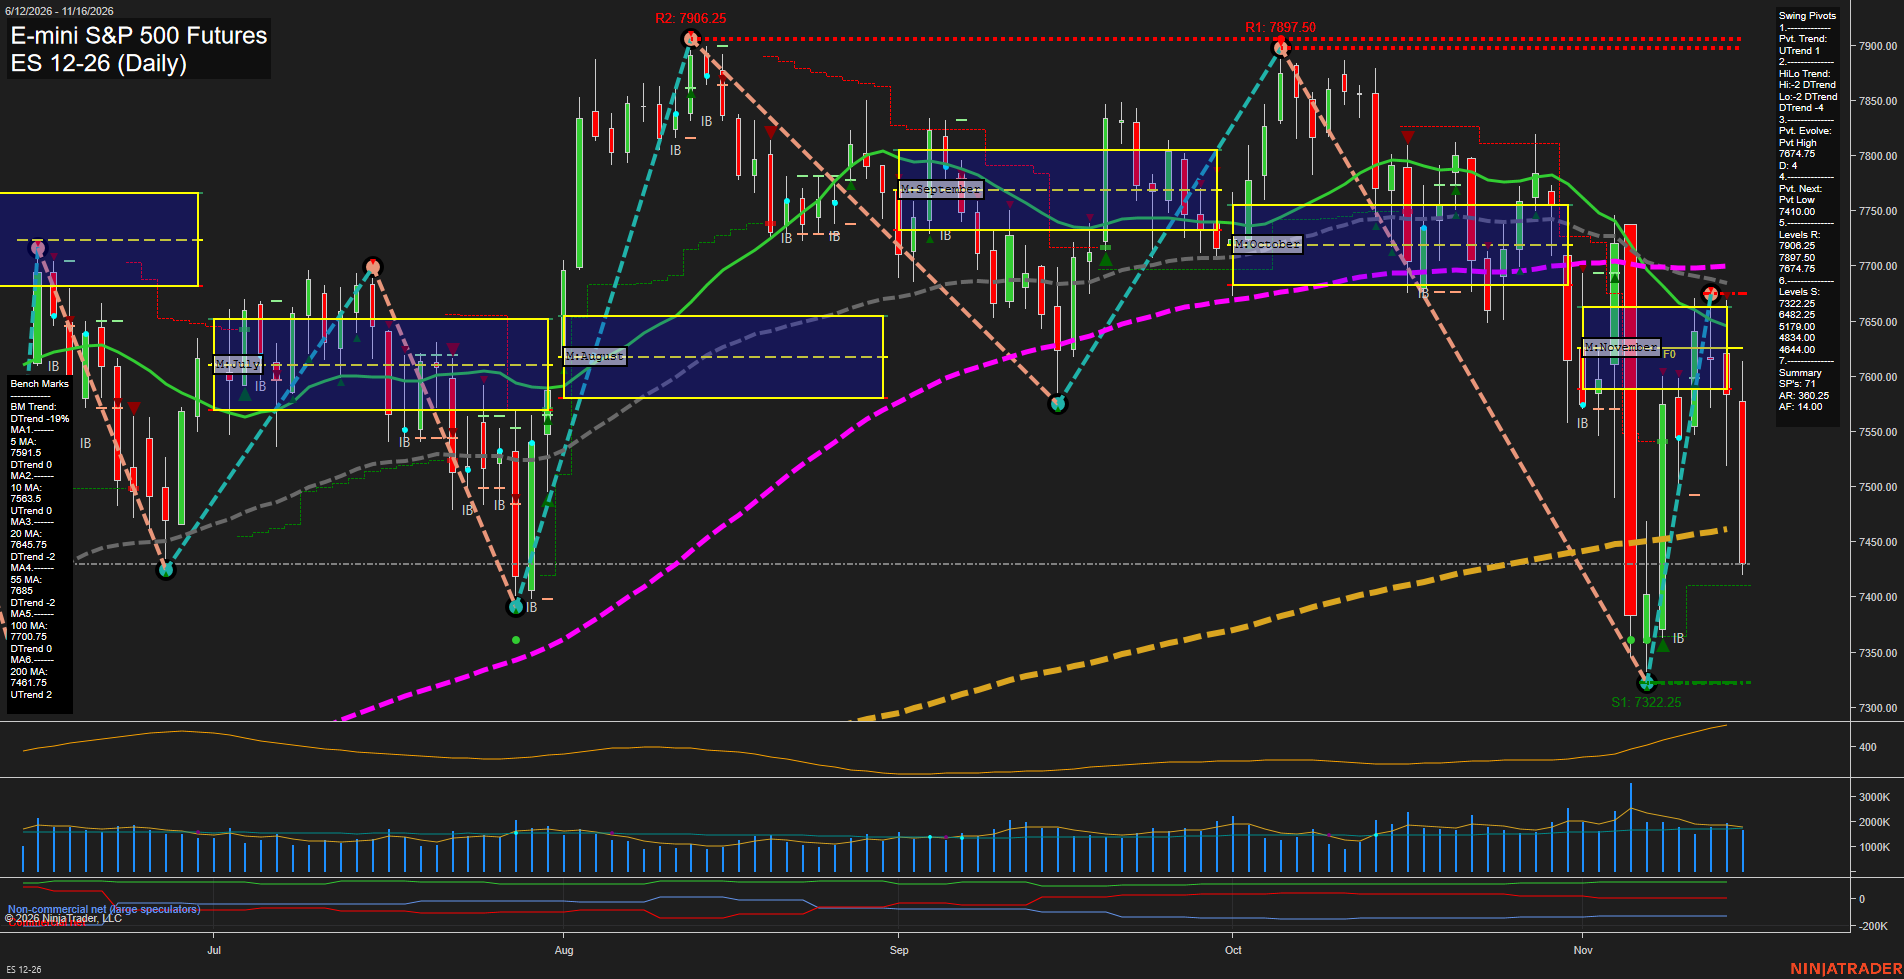
Overall Rating
- Near-Term: Bearish
- Medium-Term: Bearish
- Far-Term: Bullish.
Key Insights Summary
The sharp rebound from 7322.25 to an evolving pivot high at 7674.75 represents a near-term upswing within a medium-term downtrend of lower highs and lower lows. That recovery has lost momentum beneath the declining 20-, 55- and 100-day benchmarks, with price back below the weekly and monthly grid centers and November NTZ. The latest short signals reinforce the bearish near- and medium-term balance despite the upward pivot trend and rising 10-day average. Large daily ranges and elevated ATR characterize a volatile selloff-and-rebound sequence rather than a settled recovery. Resistance is concentrated around 7645.75–7700.75; the next downside pivot reversal threshold is 7410.00, distinct from confirmed support at 7322.25. The far-term bullish rating reflects the rising 200-day benchmark and positive yearly grid, although the declining 100-day average shows deterioration within that broader structure. The chart alone does not establish a news catalyst or seasonal explanation.
View charts on: AlphaWebTrader HTF Charts
QQQ Daily View
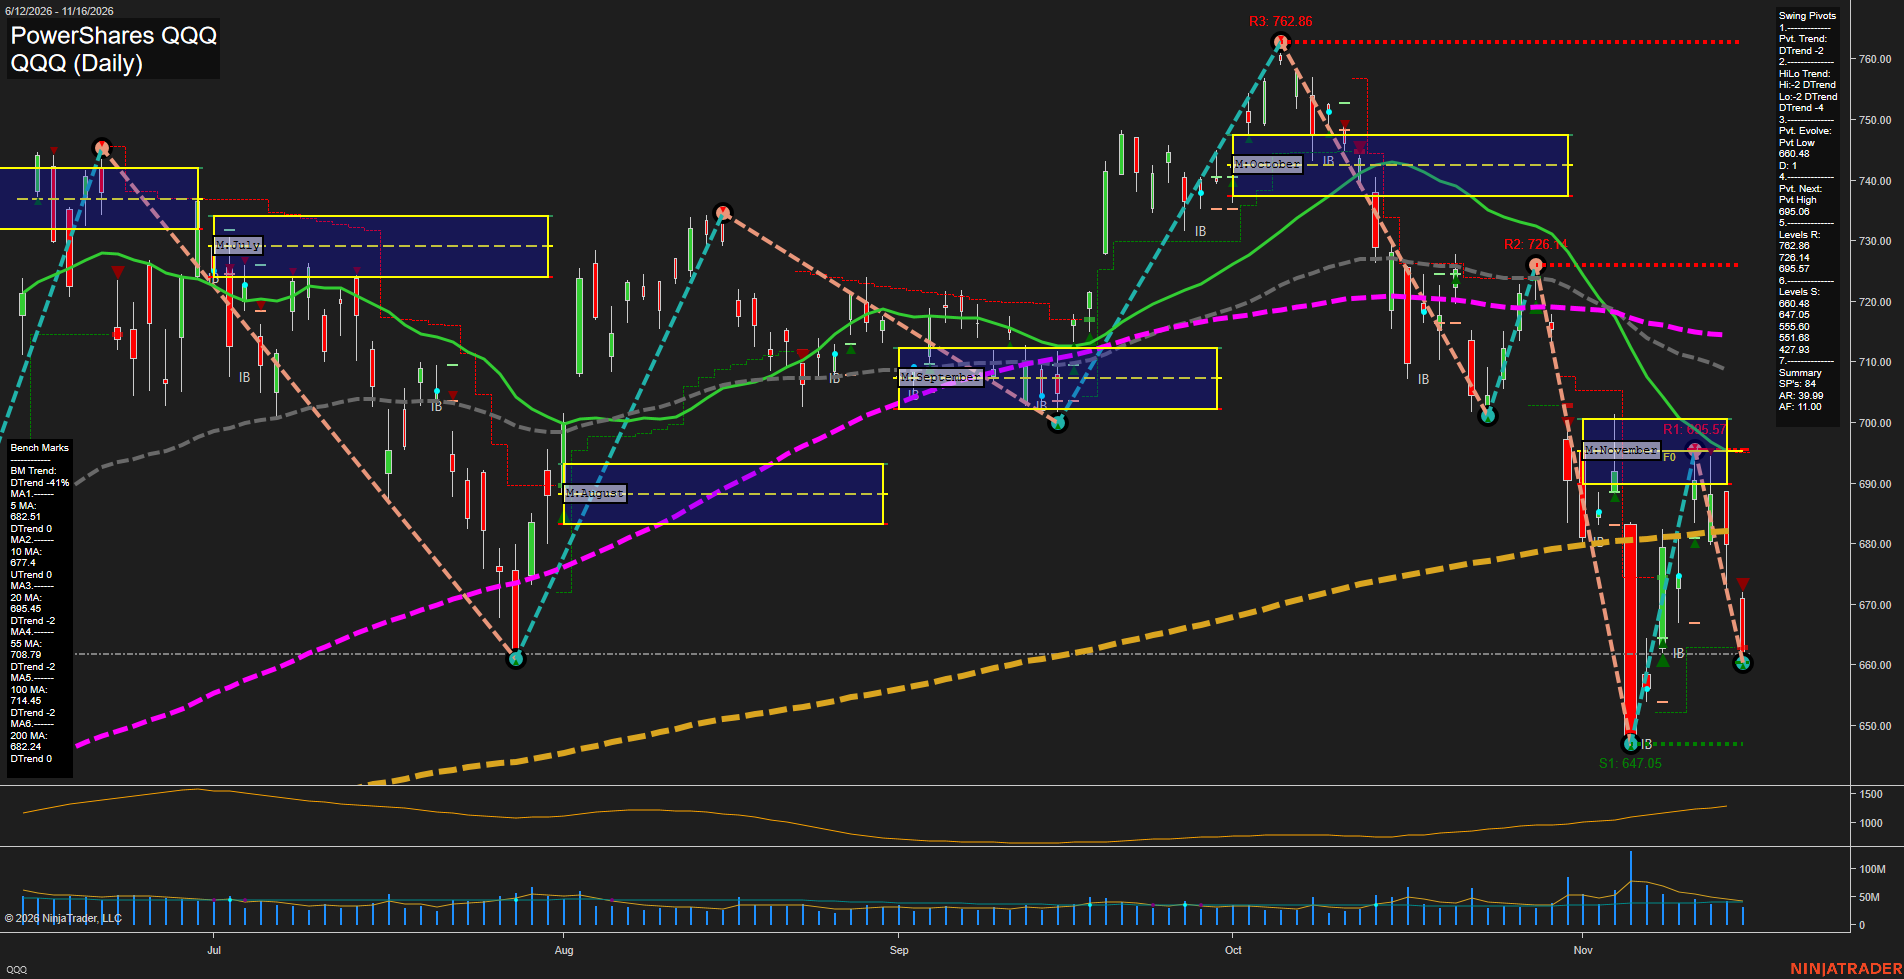
Overall Rating
- Near-Term: Bullish
- Medium-Term: Bearish
- Far-Term: Neutral.
Key Insights Summary
From a futures swing trader’s perspective, QQQ shows a near-term countertrend recovery within a broader declining structure, rather than a confirmed sustained reversal. The rebound from 647.05 established an evolving pivot high at 695.57, but the latest large declining bar returned price toward 680, slightly above the rising 5- and 10-day benchmarks and below the rising 200-day benchmark. Near-term bullish classification reflects the pivot trend and short moving averages, despite deteriorating immediate momentum. Medium-term lower highs and lower lows, declining 20- and 55-day benchmarks, and price below November’s approximately 690–700 neutral zone reinforce the bearish backdrop. The declining 100-day and rising 200-day benchmarks leave the far-term picture mixed. Resistance is defined by 695.57, 726.14 and 762.86; 662.81 is the next pivot-reversal threshold, distinct from established support at 647.05. Wide daily ranges and elevated recent volume characterize a volatile rebound-and-rejection sequence. Weekly and yearly grids and named signal-series readings are not visible; their neutral entries are placeholders, not confirmed signals. QQQ levels are ETF reference prices, not Nasdaq futures contract levels; no news or seasonal catalyst is established by this chart.
View charts on: AlphaWebTrader HTF Charts
NQ Daily View
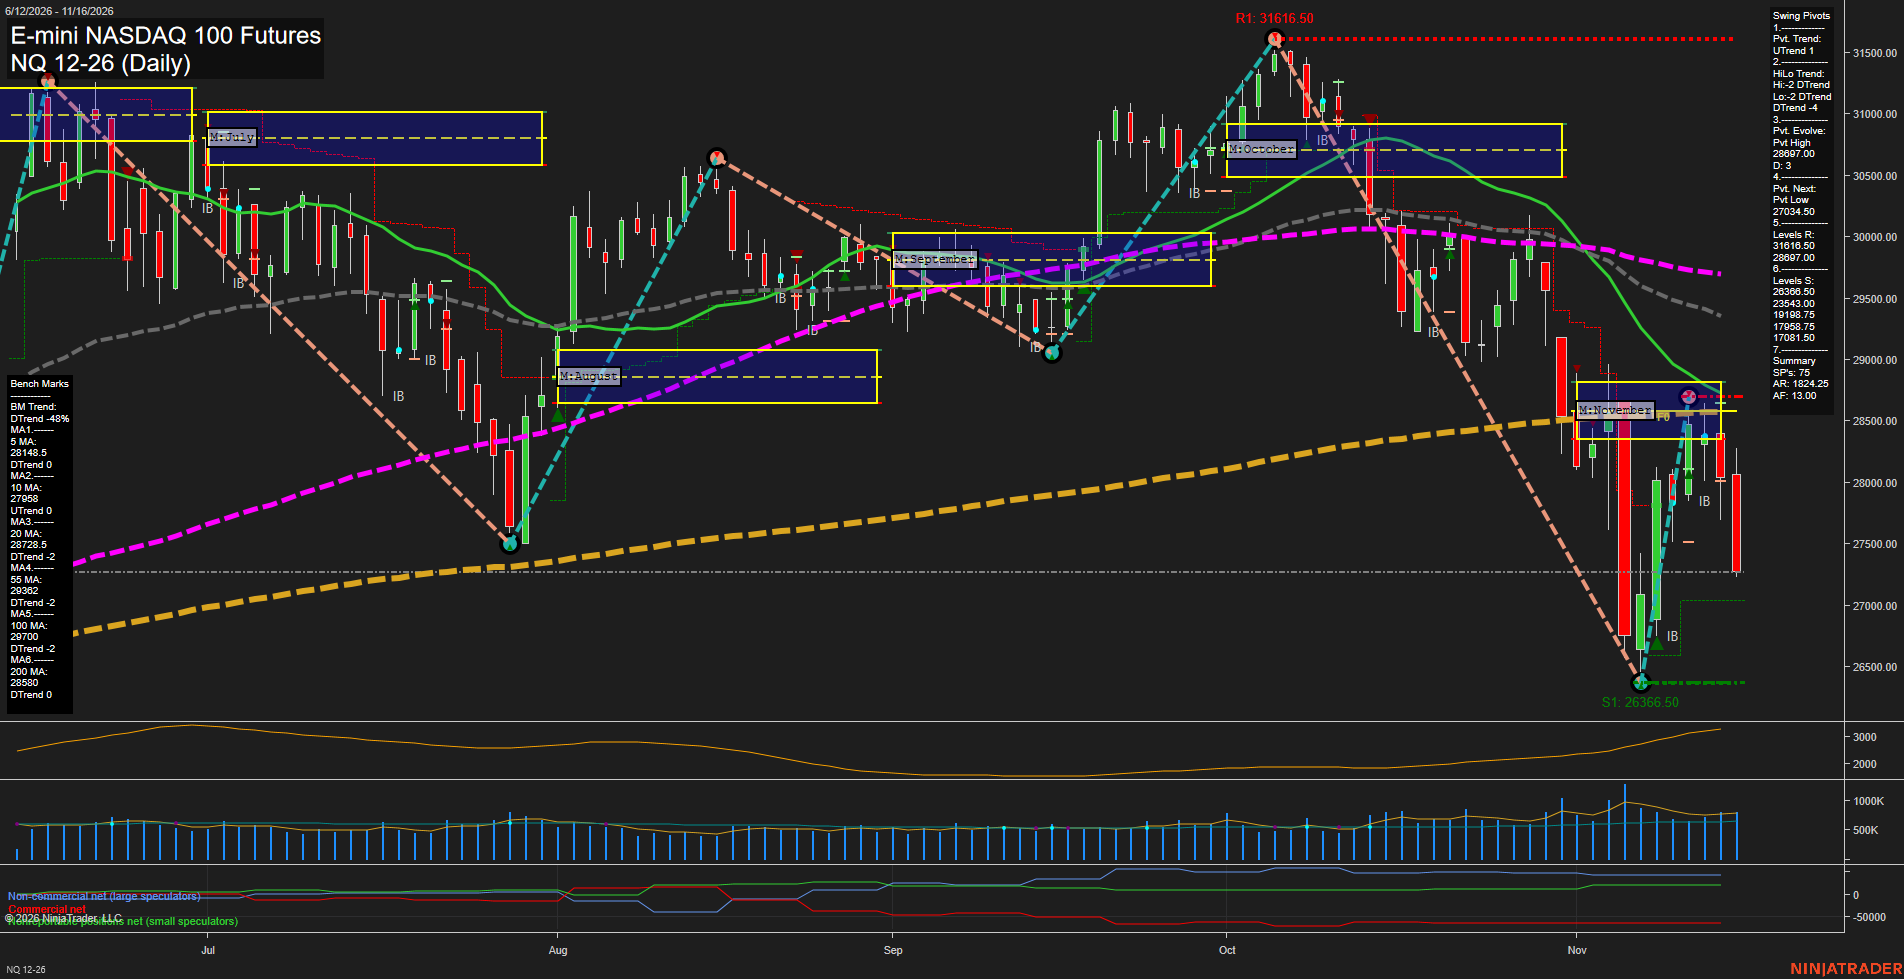
Overall Rating
- Near-Term: Bearish
- Medium-Term: Bearish
- Far-Term: Bearish.
Key Insights Summary
The rebound from 26366.50 to the evolving 28697.00 pivot high remains a countertrend recovery within a medium-term lower-high, lower-low structure. Price has retreated below the November neutral zone and all six daily benchmarks, with resistance clustered around the 200-day benchmark at 28580, the evolving pivot high at 28697, and the declining 20-day benchmark at 28728.5. The near-term pivot uptrend and rising 10-day benchmark reflect residual rebound strength, but negative weekly and monthly grid readings and both fresh short signals give the near-term evidence a bearish majority. The next opposite-pivot threshold is 27034.50; confirmed swing support remains 26366.50. Large daily ranges and elevated ATR characterize a volatile selloff-and-rebound sequence rather than a settled base. The positive yearly grid provides a longer-horizon bullish counterpoint, although both far-term benchmarks remain downward-trending. News catalysts and seasonal effects cannot be established from this chart alone.
View charts on: AlphaWebTrader HTF Charts
USO Daily View
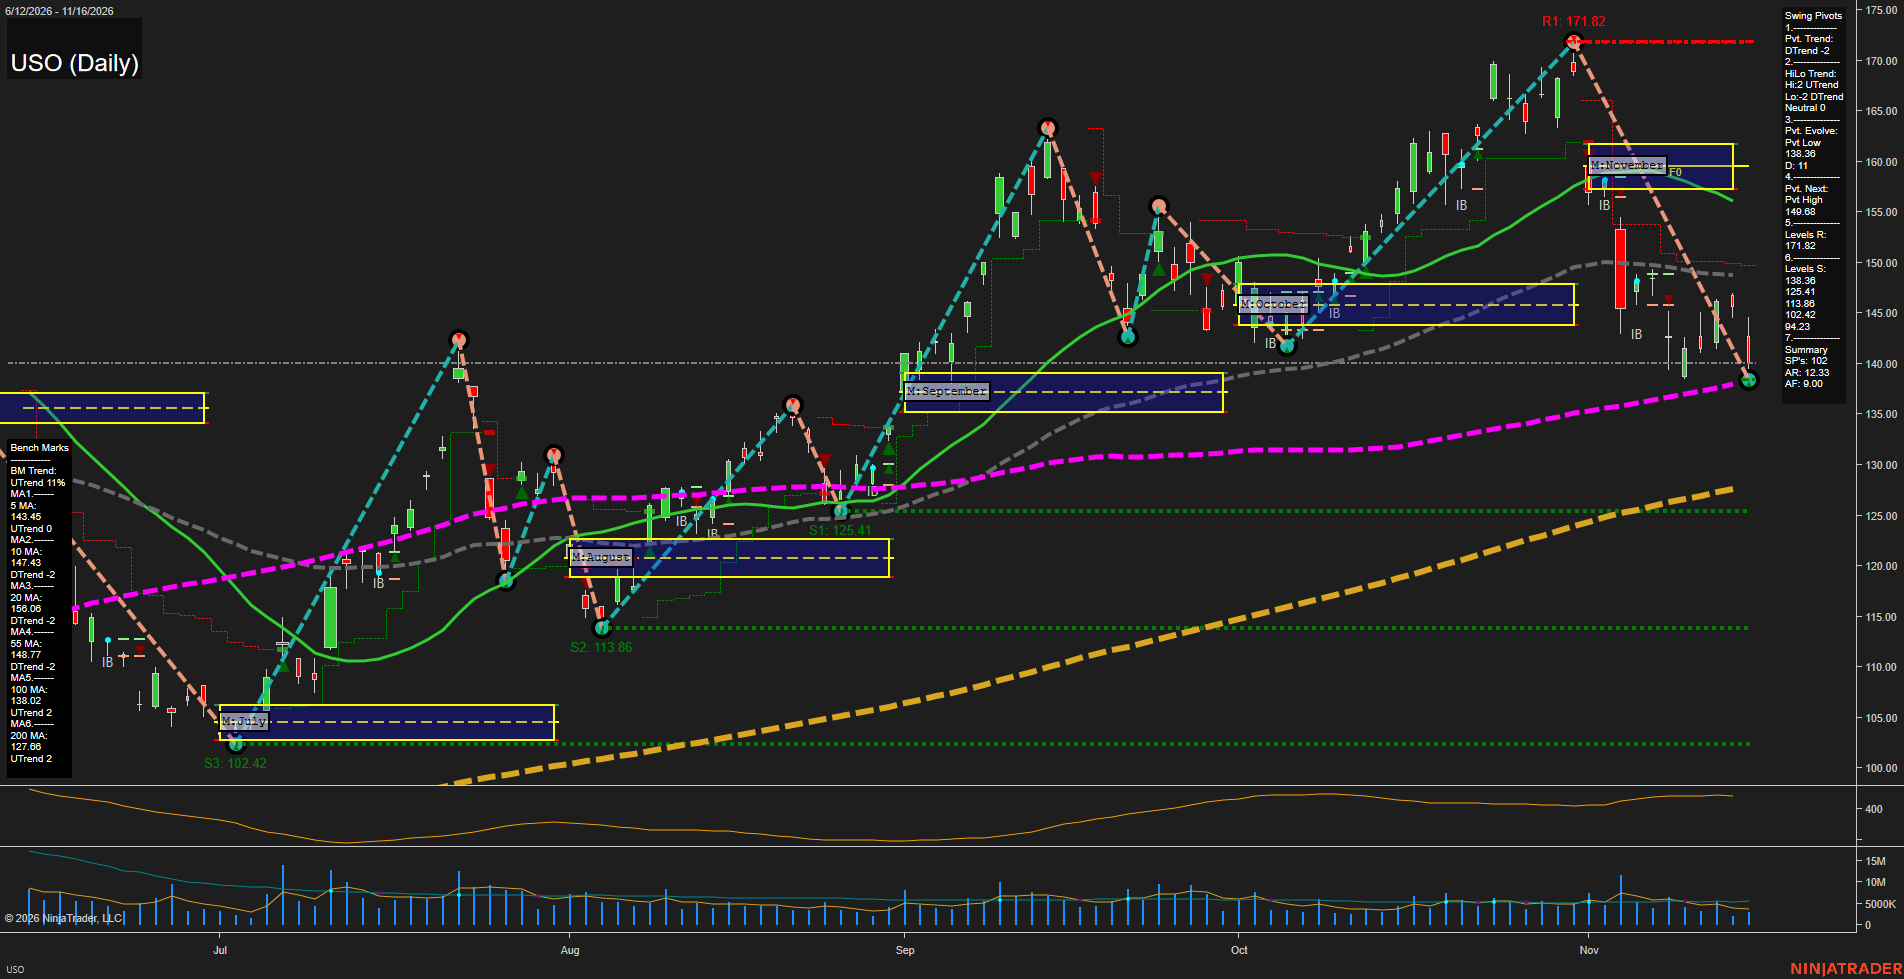
Overall Rating
- Near-Term: Bearish
- Medium-Term: Bearish
- Far-Term: Bullish.
Key Insights Summary
From a futures swing-trading perspective, USO is experiencing a countertrend rebound within a sharp correction from 171.82 to 138.47, approximately 19%. Price has recovered above its rising five-day average, but remains below the declining 10-, 20-, and 55-day benchmarks. The 148.89–149.91 area concentrates benchmark resistance and the next pivot-reversal threshold. November’s neutral zone, approximately 157–162, remains overhead, reinforcing the medium-term bearish structure. The HiLo summary is neutral because rising pivot highs conflict with falling pivot lows. Longer-term structure remains constructive above rising 100- and 200-day averages, with 138.47 close to the 100-day benchmark. Weekly and yearly grids and named trade-signal readings are not visible; news and seasonal catalysts cannot be established from this chart. USO is a futures-linked fund, so its price levels are not crude-oil futures contract prices.
View charts on: AlphaWebTrader HTF Charts
CL Daily View
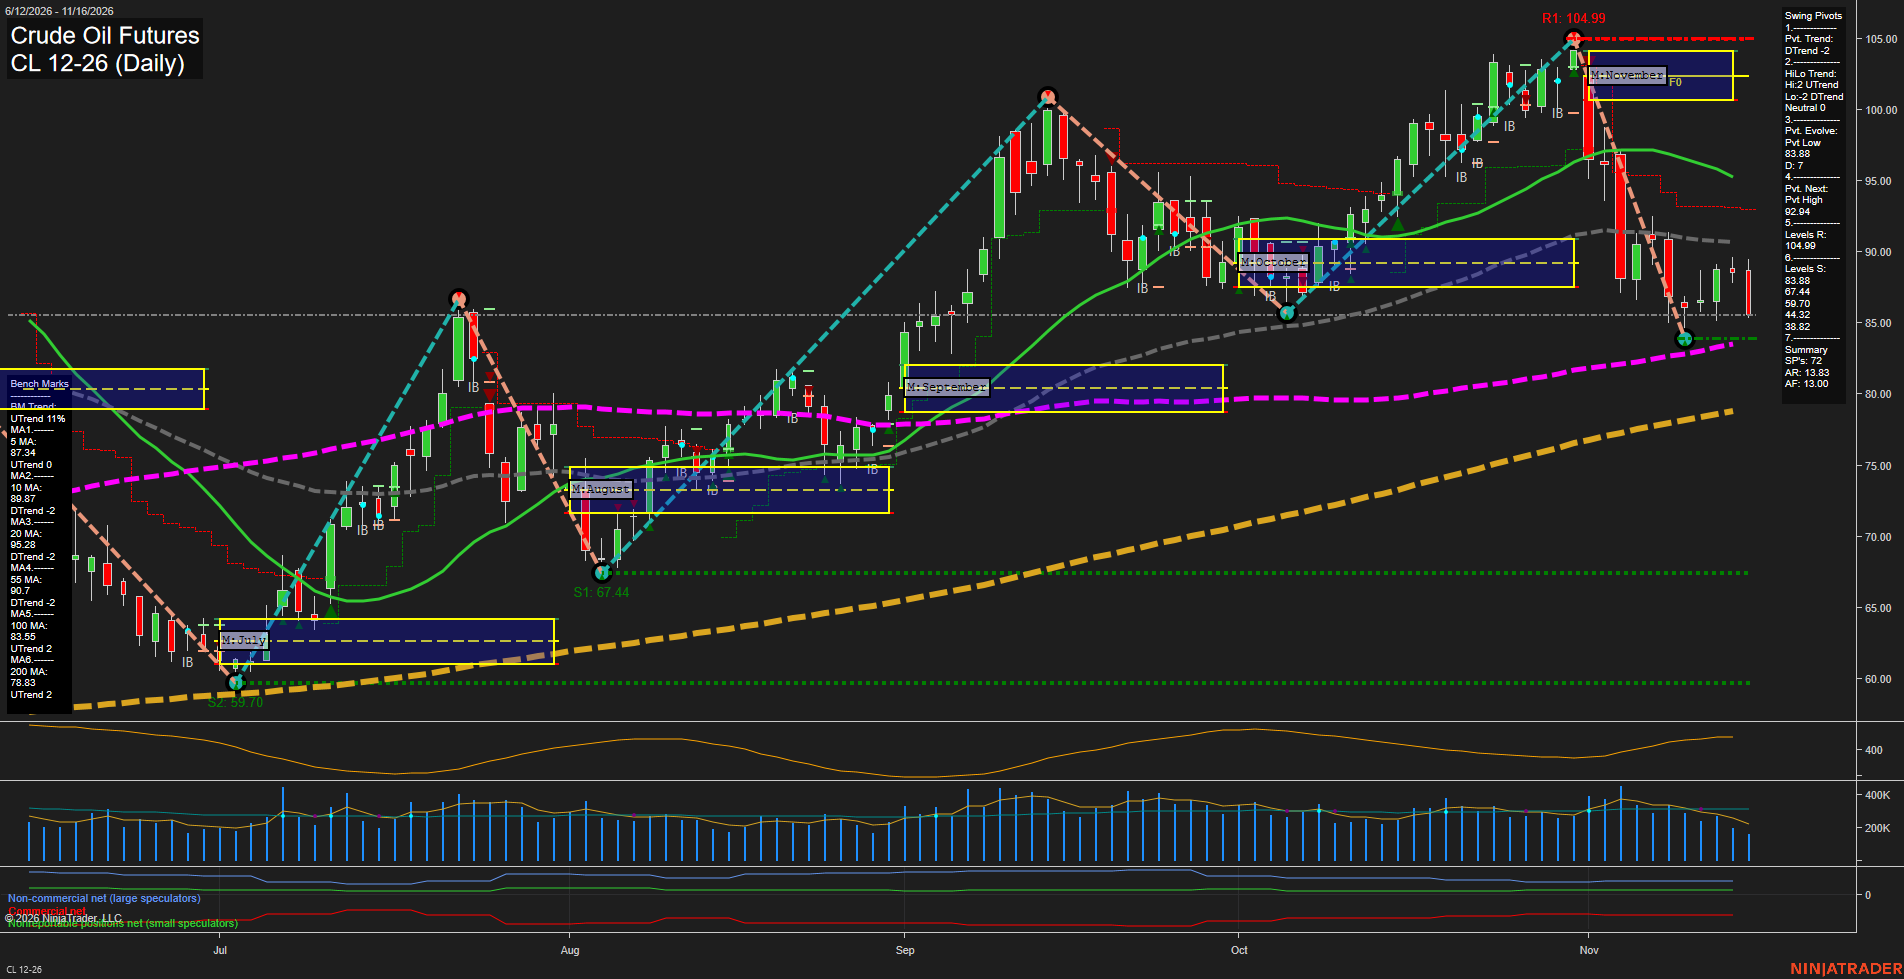
Overall Rating
- Near-Term: Bearish
- Medium-Term: Bearish
- Far-Term: Bullish.
Key Insights Summary
From a futures swing-trading perspective, November’s sharp decline from 104.99 to 83.88 represents a substantial correction within a still-rising longer-term structure. The subsequent bounce has narrowed into small candles, suggesting slowing recovery momentum rather than a confirmed bullish reversal. Price remains below the declining 10-, 20- and 55-day benchmarks and below the weekly and monthly neutral zones. The rising 5-day benchmark and latest long signal describe a countertrend rebound, while the pivot trend remains down. The medium-term HiLo summary is neutral, reflecting a higher high but lower low; broader medium-term evidence remains bearish. Support at 83.88 closely aligns with the rising 100-day benchmark at 83.55, while 89.87–90.70 forms nearby benchmark resistance. The next opposite-pivot threshold is 92.84, distinct from confirmed swing resistance at 104.99. Rising 100- and 200-day benchmarks and the positive yearly grid preserve the far-term bullish assessment. The chart alone does not establish a news-driven or seasonal explanation for the correction.
View charts on: AlphaWebTrader HTF Charts
GLD Daily View
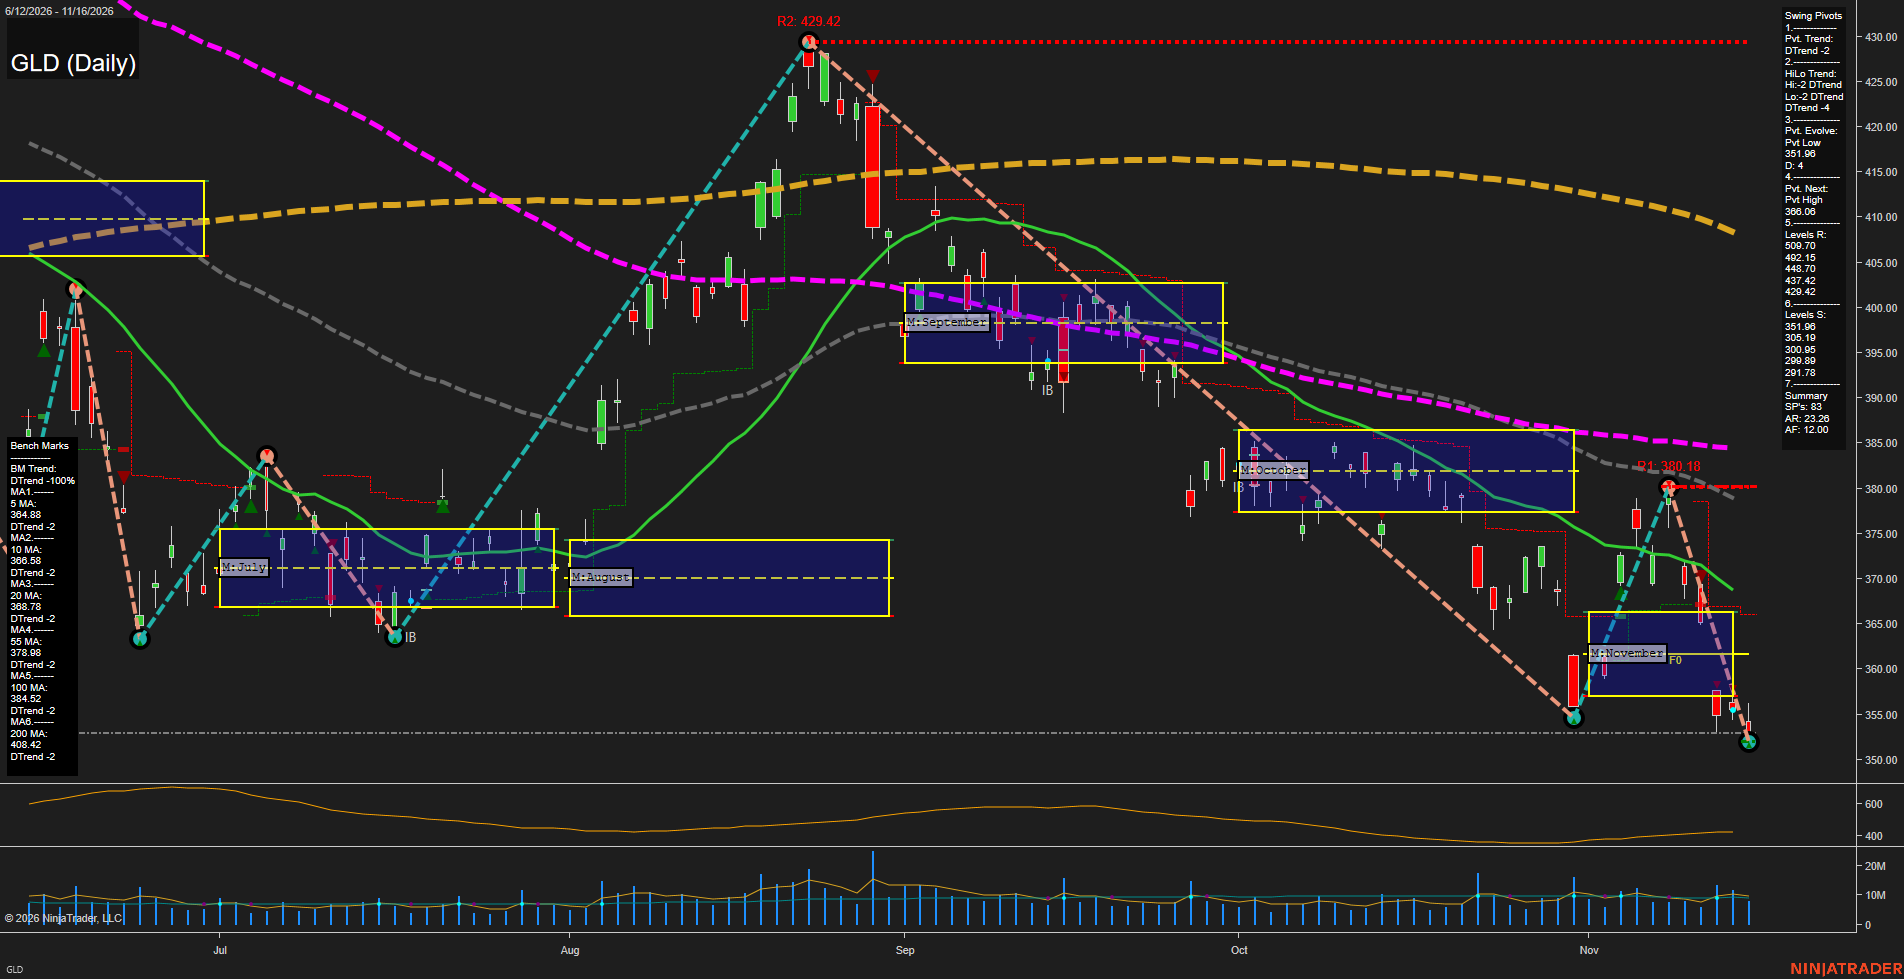
Overall Rating
- Near-Term: Bearish
- Medium-Term: Bearish
- Far-Term: Bearish.
Key Insights Summary
From a futures swing trader’s perspective, GLD shows bearish continuation across all three horizons, rather than a sustained reversal. The rebound to 380.18 failed, followed by a rapid decline to an evolving 352.91 pivot low, extending the lower-high/lower-low structure. Price is below every benchmark and beneath November’s approximately 357–366 neutral zone; its center near 362 is now overhead. The latest small candle indicates a pause after large downside bars, not a confirmed momentum reversal. The 380.18 recent swing high is nearer overhead resistance than the older resistance levels listed in the summary. Weekly and yearly grids and named trade-signal readings are not visible, so their neutral placeholders are not confirmed signals. News and seasonal drivers cannot be established from this image. GLD provides a gold-market directional proxy, but these ETF levels are not futures contract prices. Additional metrics reproduce the supplied values; the displayed ATR scale appears inconsistent with the supplied ATR figure.
View charts on: AlphaWebTrader HTF Charts
GC Daily View
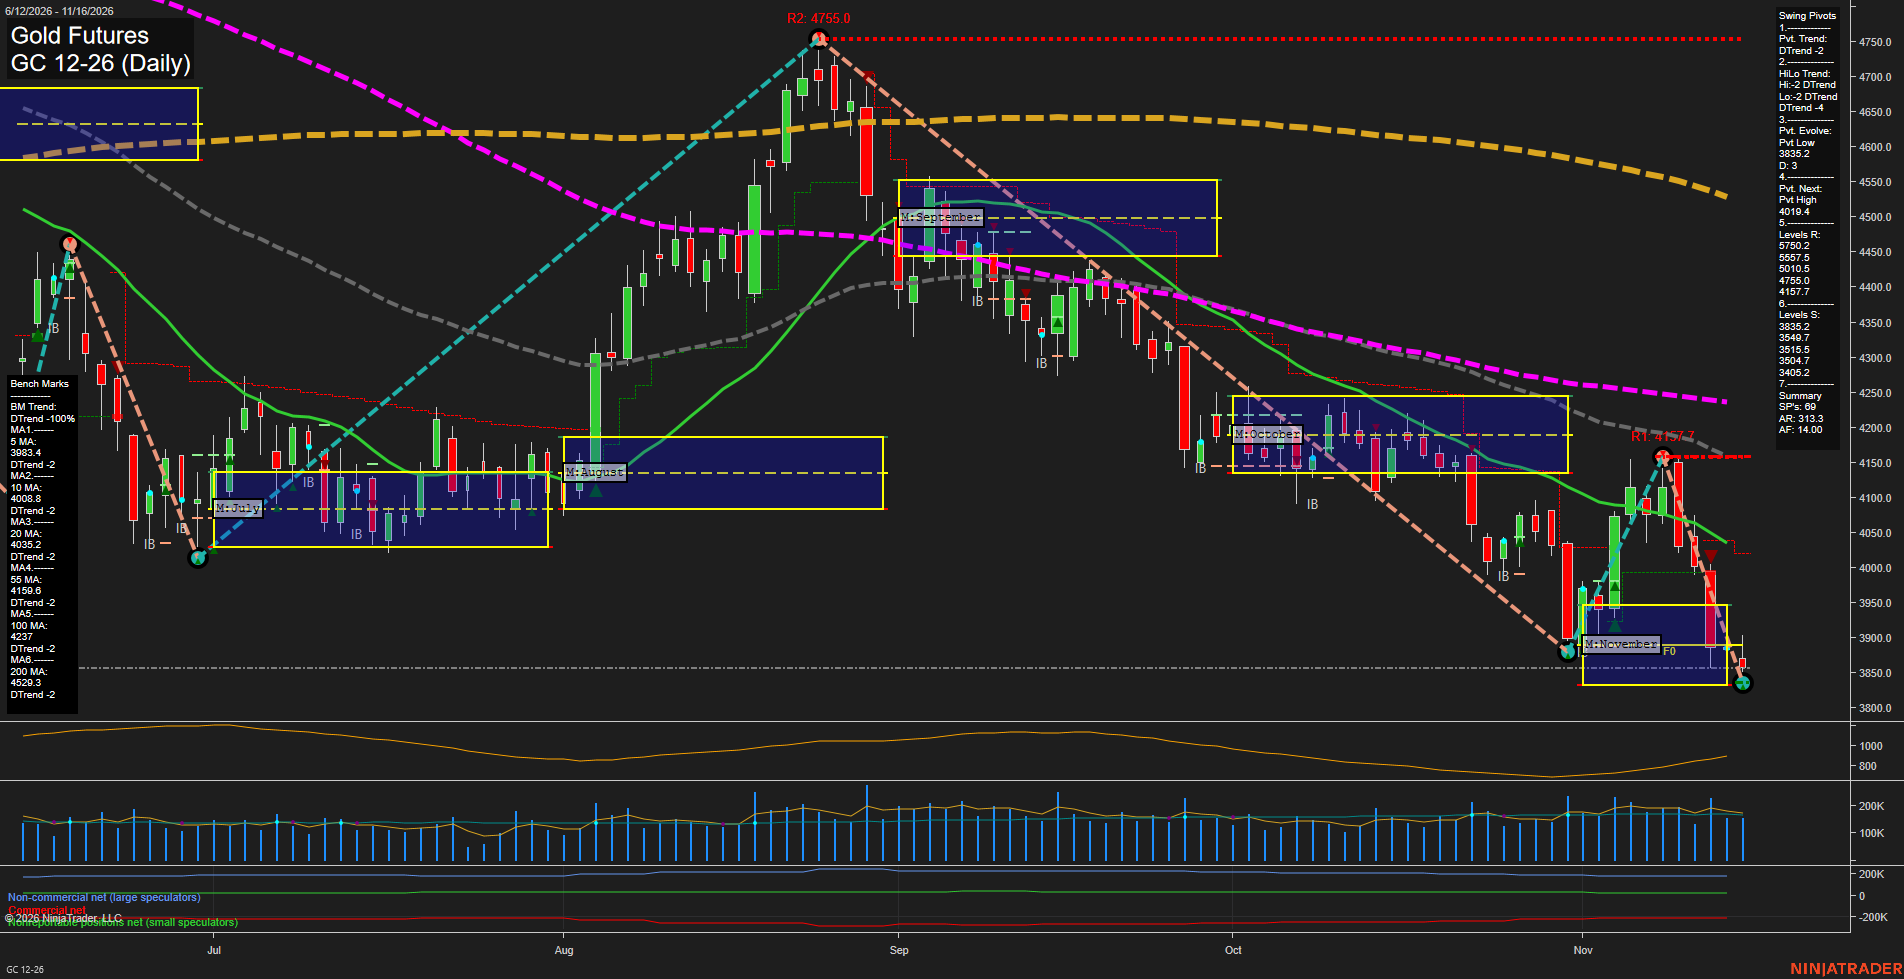
Overall Rating
- Near-Term: Bearish
- Medium-Term: Bearish
- Far-Term: Bearish.
Key Insights Summary
From a futures swing-trading perspective, gold remains in a broad downswing characterized by lower highs, lower lows, and price beneath all six declining benchmarks. The November rebound failed at 4157.7, followed by a sharp decline to the evolving 3856.7 pivot low. Small latest bars indicate a pause near support rather than a confirmed reversal. Weekly grid strength and the latest weekly long signal represent a countertrend improvement, while the near-term TR120 and far-term TR720 short signals remain aligned with the broader bearish structure. The 3983.4–4037.9 area combines nearby moving-average resistance with the next pivot-reversal threshold; 4157.7 remains the latest established swing-high resistance. Monthly and yearly grid weakness reinforce the medium- and far-term bearish readings. The chart alone does not establish a news or seasonal catalyst.
View charts on: AlphaWebTrader HTF Charts
ZB Daily View
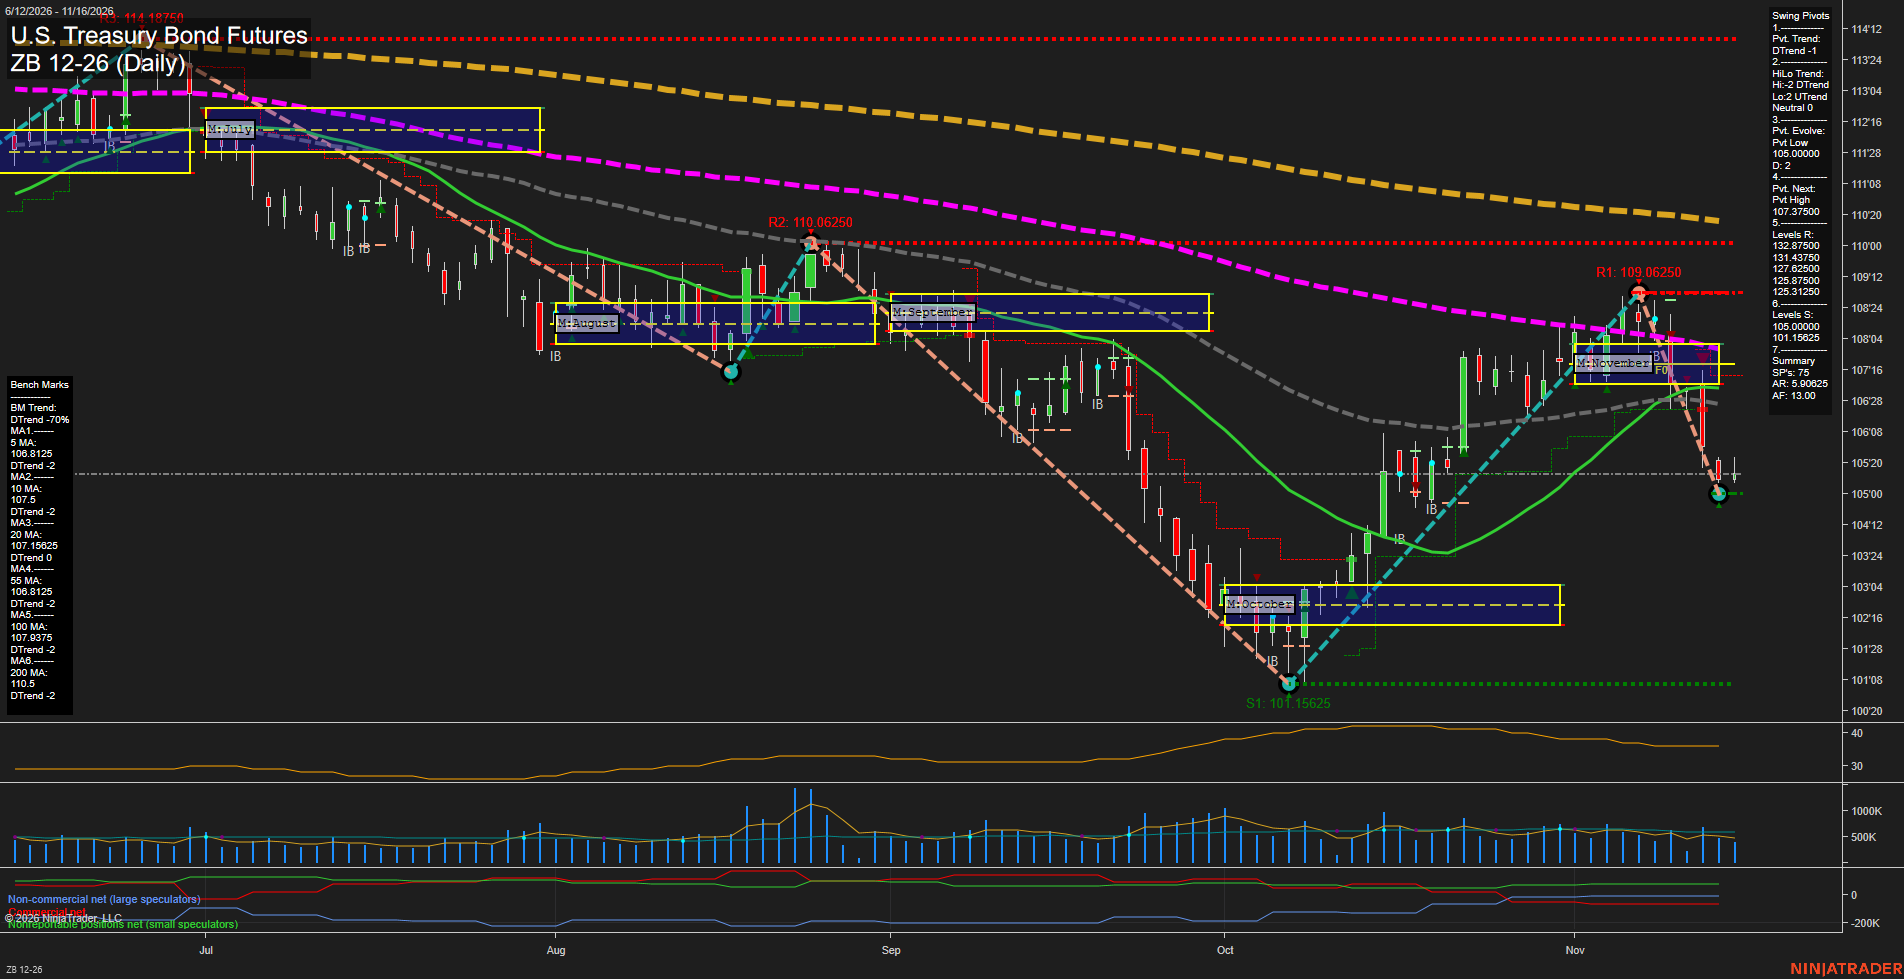
Overall Rating
- Near-Term: Bearish
- Medium-Term: Bearish
- Far-Term: Bearish.
Key Insights Summary
The October recovery from 101.15625 to the November high of 109.06250 has given way to a sharp retracement toward 105.00000. Small latest bars suggest slowing immediate momentum, but price remains below all six benchmarks. Weekly grid strength is a countertrend feature against bearish monthly and yearly grids. The neutral medium-term pivot structure reflects competing lower highs and higher lows, rather than an established bullish reversal. The 105.00000 evolving low and 101.15625 October low define the principal visible support references; plotted resistance stands at 109.06250 and 110.06250. The resistance values transcribed from the Swing Pivots summary do not match those plotted levels. The 107.37500 next-pivot threshold is a reversal reference, not a confirmed high. Overall, the chart depicts a stalled recovery within a broader downtrend. News catalysts, seasonal effects, and named signal readings are not verifiable from this image.
View charts on: AlphaWebTrader HTF Charts
Sentiment Summary: Negative coverage (42%) outweighed positive (21%), with 37% neutral, as Nvidia’s leadership upheaval and scrutiny of China chip sales accompanied Monday’s reported S&P 500 and Nasdaq futures declines. Attention centers on Nvidia’s November 17 after-close earnings and Anthropic’s November 19 IPO, following renewed weakness in Asian AI stocks. The main counterweight was Morgan Stanley’s maximum-overweight global-equities stance, citing cheaper valuations, resilient earnings and an intact AI spending cycle, alongside last week’s broad-index gains despite Nvidia’s decline.
Conclusion: The coverage highlights concentrated AI-sector event risk rather than uniform deterioration across equities.