AI investment faces a financing test: can businesses earn enough from customers to fund research, rising operating costs, equipment renewal and debt repayment? The technology may deliver substantial productivity gains while some of the companies building it run out of cash. A credit squeeze could turn that mismatch into a broader correction—and create opportunities for buyers with the resources to survive it.
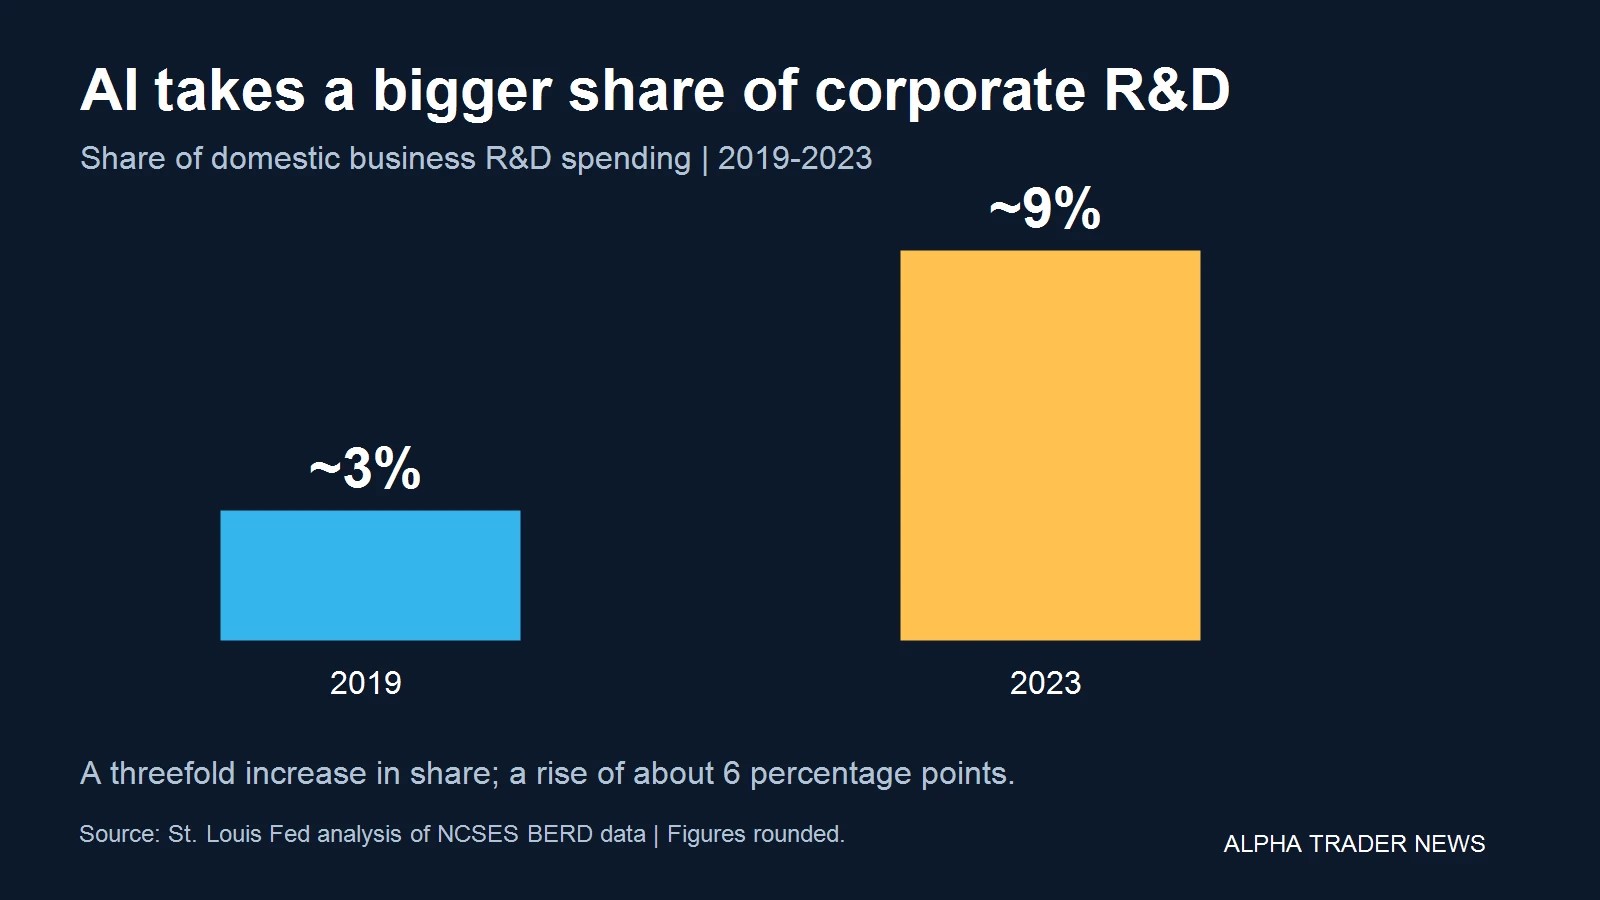
New St. Louis Fed research shows AI’s share of domestic business research and development rising from roughly 3% in 2019 to 9% in 2023. More recent payment data show paid AI adoption spreading among businesses. Those trends establish expansion. They do not establish that every supplier, cloud provider or infrastructure project can recover its investment.
Corporate research funding has changed
In The Changing Face of U.S. Corporate R&D Investment, published November 16, 2026, St. Louis Fed researchers Hannah Rubinton and Bontu Ankit Patro describe a larger role for research within business investment and greater reliance on companies’ own funding.
Companies’ own sources covered approximately 88% of domestic corporate R&D in 2023, up from just over 81% in 2011. The federally funded share declined from about 11% to approximately 4%. These figures concern research performed by businesses, rather than all U.S. research. A falling funding share also does not necessarily mean a decline in dollars.
The National Science Foundation’s 2023 business R&D report puts the scale at approximately $722 billion of research performed domestically, including about $635 billion funded from companies’ own sources.
Within the Fed analysis, software’s share rose from about 29% in 2011 to nearly 42% in 2023, while biotechnology increased from roughly 9% to almost 19%. AI’s share tripled between 2019 and 2023, a rise of approximately six percentage points. Categories overlap and cannot be added together. These historical figures measure research spending, not venture capital, total AI expenditure or data-center construction.
Adoption is spreading, but payments are not proof of profitability
The Ramp AI Index on FRED tracks businesses in Ramp’s sample with an observed monthly payment for an AI product or service. The chart below shows adoption rising through 2026, with large businesses ahead of medium-sized and small businesses.
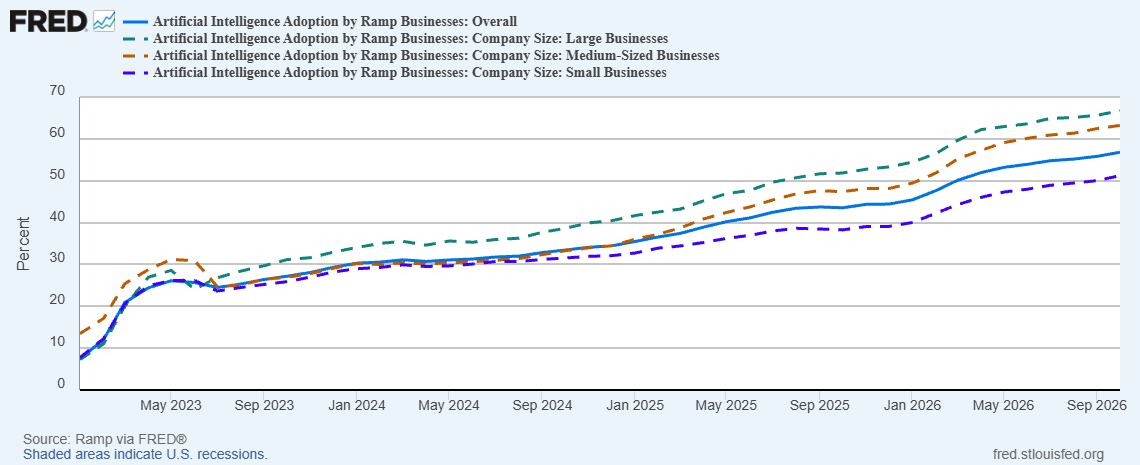
This provides a commercial-demand signal, distinct from research investment. It does not reveal how much value each customer receives or whether providers earn an adequate return. As the FRED Blog explains, the series also misses free AI use and some AI embedded in other software.
Rising costs and electricity constraints narrow the margin for error
The October 2026 Producer Price Index release showed final-demand prices up 0.3% for the month and 6.5% over the year. Headline PPI measures prices received by domestic producers; it is not a direct measure of an AI company’s input-cost inflation. Electricity, construction, computing equipment, wages and financing require separate examination. ATN’s October PPI analysis examines that cost backdrop.
Power availability adds a timing risk. The International Energy Agency’s updated energy and AI outlook projects global data-center electricity consumption roughly doubling from 485 terawatt-hours in 2025 to around 950 TWh in 2030. This covers all data centers, not AI alone, and is a projection rather than a guaranteed outcome.
For an individual project, delayed electricity connections can postpone revenue even after equipment has been ordered and financing commitments have been made. Interest, contractual payments and other costs may continue while capacity remains unavailable. That is one route by which a physical bottleneck can become a financial problem.
The equipment-recovery window can be short
Fast technological renewal complicates the calculation. Oracle’s fiscal 2026 disclosure, for example, assigns an estimated useful life of six years to servers and networking equipment. That does not establish a universal five-to-six-year life for plant and equipment: buildings and other infrastructure can last much longer.
Accounting depreciation, physical life and economic competitiveness are different. A GPU can still function while a newer system reduces the price customers will pay to rent the older one. Older equipment may remain useful for less demanding workloads, but its rental income and resale value can fall before the original investment has been recovered.
For illustration, $1 billion of equipment depreciated over five years produces $200 million of annual straight-line depreciation, assuming no residual value; over 15 years, the annual charge is approximately $67 million. Depreciation is a noncash allocation of an earlier investment. Replacement purchases require fresh cash, and investors should avoid counting depreciation and the same capital expenditure twice when assessing cash flow.
Musk’s “guppy-level death” warning concerns financing
Elon Musk’s prediction of “guppy-level death and consolidation” among smaller AI cloud providers captures the financing concern. CTech reported on October 26 that he argued lenders were pulling back from businesses without substantial revenue outside AI data centers.
His forecast concerned company failures and consolidation, and came from a participant competing in the computing market. TheStreet’s account notes that the broad credit shutdown he described had not been independently confirmed.
The useful analytical connection is conditional: a provider dependent on fresh borrowing becomes more vulnerable if power delays postpone revenue and technological renewal weakens equipment values. Strong demand alone may not bridge that funding gap.
From “Frankfurter bonds” to a possible credit squeeze
ATN’s earlier Frankfurter bonds explainer examines how deferred invoices can be discounted, pooled and financed. The phrase is ATN’s informal shorthand, not an official security classification. Recognized mechanisms include factoring, supply-chain finance and trade-receivables securitization.
Those arrangements must be distinguished from equity investments in customers, equipment-backed borrowing and guarantees of collateral values. They are different contracts, but each can make commercial activity dependent on continued access to funding.
The BIS’s October analysis of AI financing describes growing debt and off-balance-sheet arrangements, with large-company commitments supporting financing structures. Banks can have exposure both to financing vehicles and to investors holding their debt. Apparently separate positions can therefore share underlying counterparties.
The IFRS Foundation’s supplier-finance disclosure initiative highlights why visibility matters: investors need information about obligations, payment terms and liquidity risk.
Recourse is equally important. With-recourse arrangements can leave the supplier exposed if the customer fails to pay. Genuine non-recourse arrangements transfer the covered debtor-credit risk, although warranties, disputes and other contractual exceptions can leave additional obligations. Pooling claims redistributes risk; it does not remove the need for the underlying customers to pay.
The 2007–2008 parallel is a funding mechanism, not a forecast
A possible bubble-bust moment would occur if optimistic valuations and expansion plans encountered a sudden withdrawal of credit. The Federal Reserve’s account of the financial crisis explains how long-term assets financed through short-term borrowing and bank liquidity guarantees became vulnerable when funding markets seized up.
AI equipment and corporate invoices are different from the mortgage exposures central to that crisis. The comparison concerns leverage, refinancing dependence, opaque risk transfers and lenders retreating at the same time. It does not demonstrate that today’s exposures have the same scale or that a banking crisis is inevitable.
A plausible stress sequence would be:
- Credit tightens: lenders charge more, demand additional security or decline new financing.
- Expansion slows: providers delay projects and equipment purchases while existing commitments remain.
- Cash collection weakens: payment delays and reduced orders pressure suppliers and financed receivables.
- Collateral is reassessed: lower rental income or equipment values reduce borrowing capacity where financing terms permit.
- Losses spread: defaults, recourse claims or guarantees transmit pressure to counterparties and financiers.
This is a risk scenario. Demonstrating that it is unfolding requires evidence from financing terms, payment performance, asset values and actual defaults.
Could the squeeze reach banks?
In her November 10 remarks, Federal Reserve Vice Chair for Supervision Michelle Bowman identified risks from AI companies’ growing external financing, complex obligations and investments in customers. She also noted that major banks and other financial institutions have exposure, while many are well capitalized and have stable funding.
The distinction is important. An equity-funded failure primarily imposes losses on shareholders. Debt-funded projects can also affect lenders, bondholders and guarantors. Whether those losses become systemic depends on concentration, leverage, funding stability, recoveries and institutions’ capacity to absorb them.
Productivity gains can coexist with investor losses
The optimistic economic case should remain part of the analysis. In Guiding Monetary Policy during a Productivity Boom, the St. Louis Fed revisits how advances in information technology supported stronger growth without the inflation policymakers might otherwise have expected during the 1990s.
AI could similarly improve productive capacity. Those gains may take time to appear and may accrue to customers through lower prices rather than entirely to technology suppliers. The economic usefulness of the technology and the investment returns earned by its financiers are separate questions.
Surviving providers must offer prices customers can justify while earning enough to sustain operations and equipment renewal. Competition and efficiency improvements could make that possible. Persistent losses, customer subsidies and repeated fundraising would signal a more fragile model.
Market disruption can create opportunities—with demanding tests
A credit squeeze can produce discounted assets and opportunities for well-funded competitors to acquire equipment, intellectual property or customers. Cheaper computing could also benefit businesses applying AI to productive work. However, distressed assets may be obsolete, contractually restricted or uneconomic to operate.
QQQ: a V-shaped rebound within a wider correction
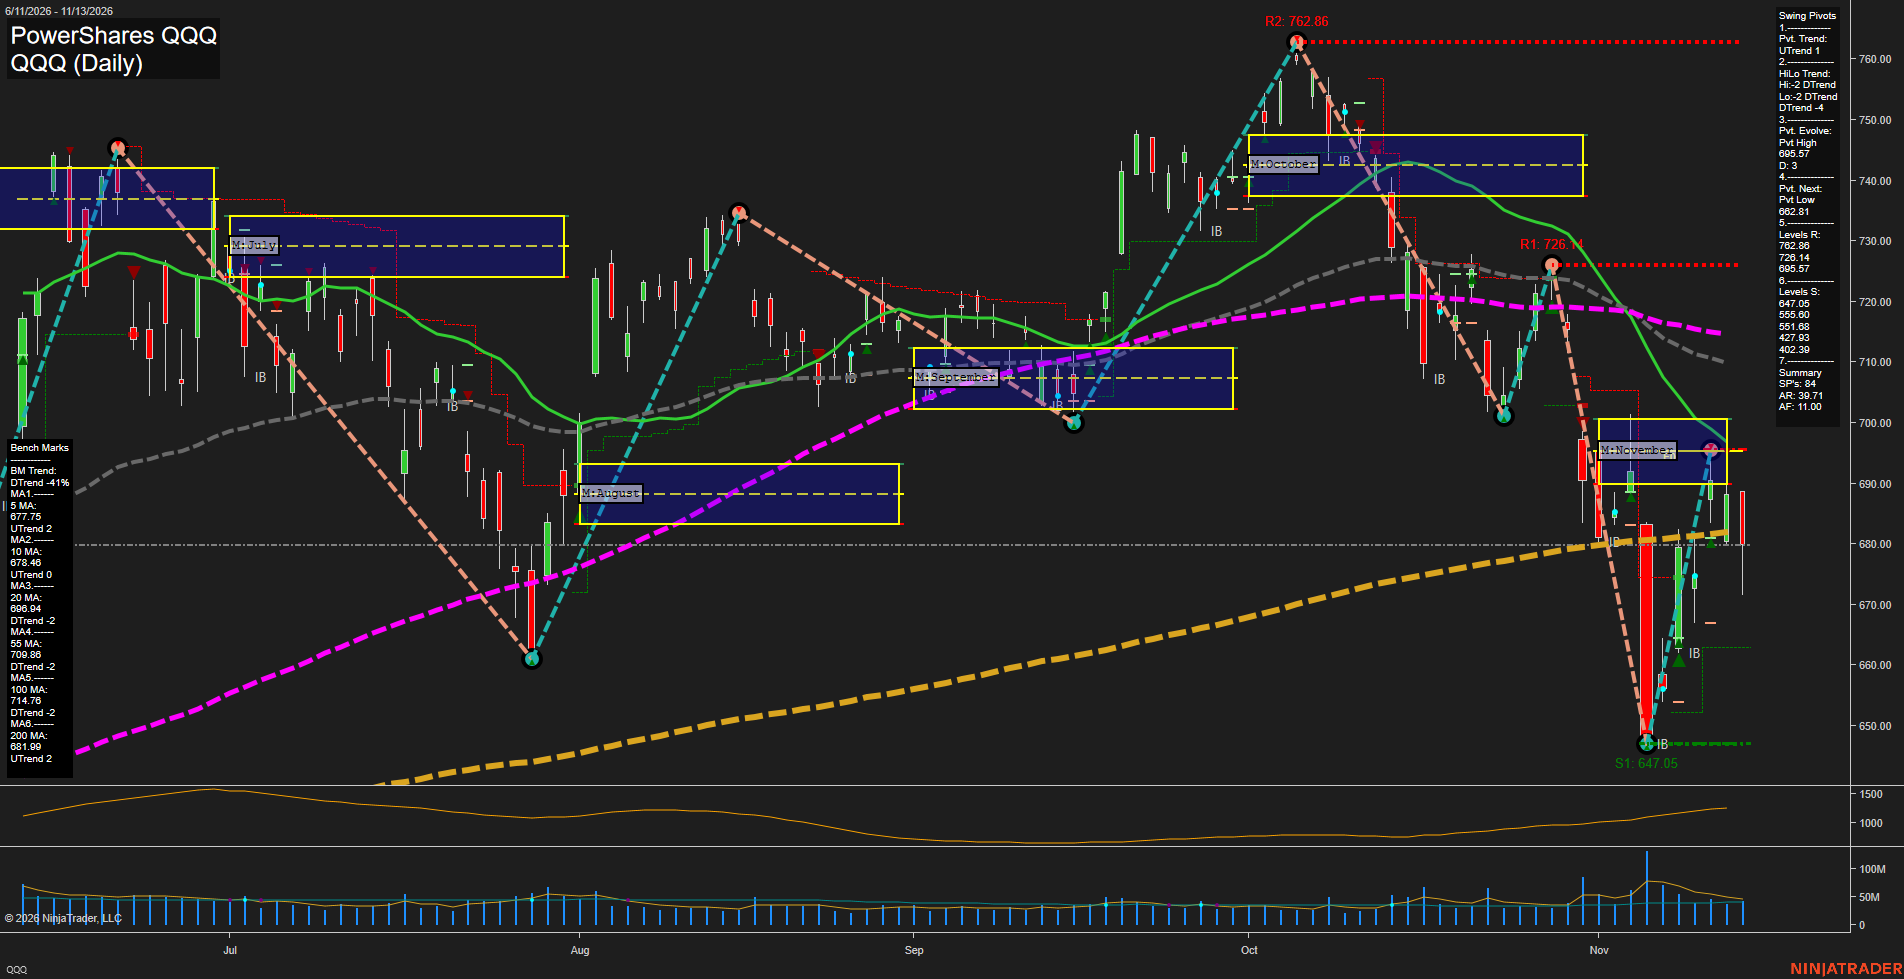
The November swing in this chart makes the opportunity concrete: a decline toward 647.05 followed by a rebound toward 695.57 represents an approximately 7.5% advance from the marked low. The October high near 762.86 remained unrecovered; the decline from that high to the November low was approximately 15.2%. A sharp tradable rebound can therefore occur while the wider correction remains unresolved, offering opportunities on both the selloff and recovery legs.
Buffett’s reminder: be ready when opportunity arrives
In his 2016 letter to Berkshire Hathaway shareholders, Warren Buffett described economic storm clouds briefly raining gold, then wrote:
“When downpours of that sort occur, it’s imperative that we rush outdoors carrying washtubs, not teaspoons.”
His point was preparedness to deploy capital when exceptional opportunities appear. Applied here, financial turmoil can create both immediate trading dislocations and opportunities to acquire assets at attractive prices. Buffett’s investment principle and the tactical opportunities illustrated by QQQ operate on different time horizons, but both depend on being ready to act.
For investors, the practical questions are:
- Liquidity: how long can the business operate without another capital raise?
- Cash conversion: are reported sales turning into customer payments?
- Funding dependence: do customers rely on investment or credit supplied by their own vendors?
- Commitments: what debt, leases, purchase obligations and guarantees fall due?
- Asset economics: can equipment earn its cost back at realistic utilization, power costs and rental prices?
- Loss allocation: who pays after a default, including under recourse and guarantee provisions?
As market turmoil intensifies, speculative profit opportunities can grow: wider price swings, forced selling and credit repricing can create more openings for active traders and investors. Opportunities may emerge on both sides of the market, through relative-value trades, distressed assets and the recovery of financially stronger survivors. Timing, liquidity and the price paid determine whether those openings translate into realized profits.
Financial turmoil and heightened volatility can create substantial profit opportunities in both directions: funds and traders can participate in selloffs through short selling, while corporate and fund speculation in predominantly long-only assets can reinforce dip buying and propel a V-shaped recovery. Credit repricing, forced selling and the subsequent return of liquidity can generate large price dislocations. For active market participants, both the decline and the rebound can become significant sources of trading profits.
Persistent volatility, sharp reversals and the bear-market threshold
Diverging analyst forecasts, uneven earnings delivery and gaps between asset valuations and cash generation can keep markets volatile as the AI financing cycle develops. In this framework, sharp, fast selloffs and forceful recoveries are an expected feature of repeated repricing. Assets and sectors need not move together: resilient earnings can attract capital while financing-dependent businesses remain under pressure.
This continuing divergence can sustain speculative opportunities through successive declines and rebounds, even without a broad bear market. A V-shaped recovery is one possible outcome when liquidity and long-side buying return quickly.
A bear market is conventionally described as a decline of at least 20% from a recent peak in the relevant benchmark, as explained in UBS’s bear-market guide. For this discussion, the benchmarks are the S&P 500, tracked by SPY, and the Nasdaq-100, tracked by QQQ. SPY and QQQ are ETFs, rather than indexes. A 20% decline in the Nasdaq-100 describes that benchmark’s bear market; it does not establish that the S&P 500 has also crossed the threshold.
The market consequence: a larger field for speculation
AI’s investment and financing cycle matters to traders because it can turn changes in credit availability into sharp moves across equities, credit and related assets. A financing squeeze can accelerate selloffs; renewed liquidity and long-side buying can drive a rapid recovery.
The central market consequence is the scope for speculation: financial stress, forced selling and credit repricing can create substantial profit opportunities on the short side, while dip buying and renewed long exposure can propel—and provide opportunities within—a V-shaped recovery. For managers, funds, corporate investment desks and active traders, the financing cycle is therefore also a trading cycle, with opportunities arising from both the unwinding of excess and the repositioning that follows.