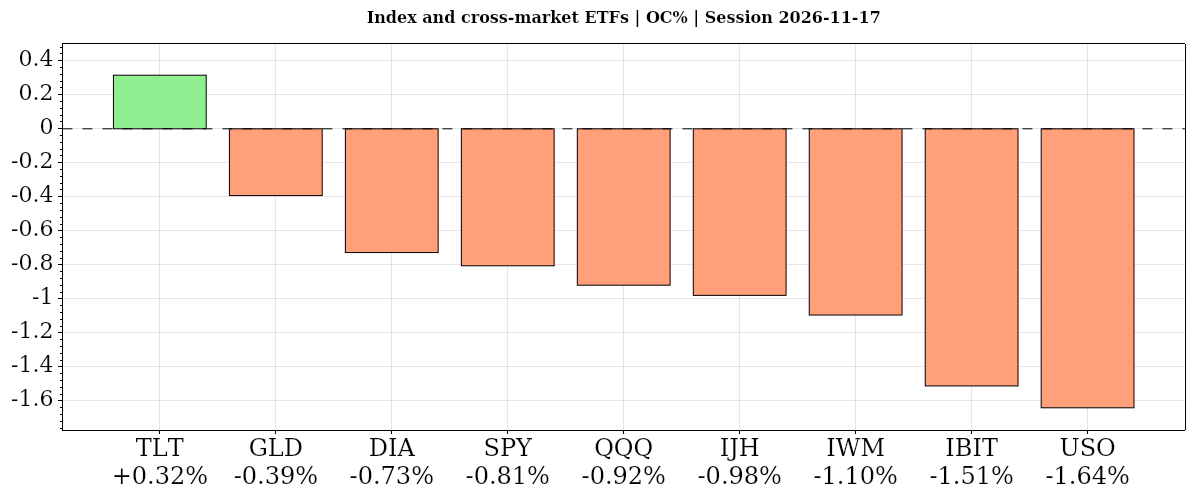
Stocks and tech fell Tuesday ahead of Nvidia’s after-close earnings, with the S&P 500 below its 200-day average. Oil and gold fell as Treasury bonds rose.
Fundamentals: Stocks and technology shares closed lower ahead of Nvidia’s earnings scheduled after Tuesday’s close. The S&P 500 joined other major U.S. indexes below its 200-day moving average, while the VIX rose for a fourth session. Oil and gold fell as bonds gained. Retail sales rose 0.2%, matching forecasts, while industrial production fell 0.4% against expectations for a 0.1% increase.
Technicals: Stocks ended Tuesday's session lower, with the S&P 500 ETF down 0.81% from its open and the Nasdaq-100 ETF off 0.92%. Bearish daily futures signals contrasted with still-bullish longer-term weekly structures. The oil ETF fell 1.64% from its open but finished 0.15% above its prior close. Gold fell 0.39% from its open, remaining near its 52-week low, while far-term Treasury bonds gained 0.32% from the open despite broader technical weakness.
After Market Close daily snapshot: market news summary and sentiment, major ETFs, Magnificent 7 analysis, Indices Futures Higher Time Frame Analysis, and E-mini S&P500, Nasdaq 100, NYMEX Crude, Gold Futures Daily Chart analysis.
As of: November 17, 2026 06:15 CT
Earnings Radar Day Recap
Monitoring for earnings releases by the Magnificent 7, AI-tech-related firms, and major financial institutions.
| Date/Day | Impact | Company / Symbol | Time | EPS | Revenue | ||||||||
|---|---|---|---|---|---|---|---|---|---|---|---|---|---|
| 2026-11-17 – Tuesday | High | Nvidia (NVDA) | After close |
|
|
For full details visit: Yahoo Earnings Calendar
EcoNews Radar U.S. Events Day Recap
| Date | Impact | Event, Prev, Forecast, Actual | Info |
|---|---|---|---|
| 2026-11-17 Tuesday 07:30 | Medium | Fed's Musalem speech Prev: — Forecast: — Actual: — | Policy remarks can clarify views on inflation, employment and interest rates; index futures traders monitor them for shifts in the expected policy path and equity discount rates. |
| 2026-11-17 Tuesday 08:15 | Medium | ADP Employment Change 4-week average Prev: 20K Forecast: — Actual: 24K | Tracks average private-sector job growth over four weeks, offering a smoothed labor-demand signal that traders use to assess economic momentum and interest-rate expectations. |
| 2026-11-17 Tuesday 08:30 | High | Retail Sales ex Autos (MoM) Prev: 0.9 Forecast: 0.4 Actual: 0.6 | Measures monthly retail spending excluding motor vehicles, helping traders assess consumer demand with less influence from volatile vehicle purchases and gauge implications for growth and inflation. |
| 2026-11-17 Tuesday 08:30 | High | Retail Sales (MoM) Prev: 0.8 Forecast: 0.2 Actual: 0.2 | Measures monthly changes in receipts at retailers and food services establishments; traders monitor this nominal spending gauge for signals about consumer demand, corporate revenues and economic growth. |
| 2026-11-17 Tuesday 08:30 | High | Retail Sales Control Group Prev: 0.10% Forecast: — Actual: 0.60% | Tracks retail spending excluding autos, gasoline, building materials and food services; it feeds into estimates of goods consumption in GDP, making it useful for assessing growth. |
| 2026-11-17 Tuesday 09:10 | Medium | Fed's Waller speech Prev: — Forecast: — Actual: — | Policy commentary offers insight into the outlook for inflation and employment; traders watch for signals that could reshape interest-rate expectations and equity valuations. |
| 2026-11-17 Tuesday 09:15 | Medium | Industrial Production (MoM) Prev: 0.7 Forecast: 0.1 Actual: -0.4 | Measures changes in real output from manufacturing, mining and utilities; traders use it to gauge industrial momentum and implications for growth-sensitive sectors and monetary policy. |
| 2026-11-17 Tuesday 09:30 | Medium | Fed's Hammack speech Prev: — Forecast: — Actual: — | Remarks can illuminate policymakers’ assessment of economic conditions and inflation risks; traders monitor any implications for the expected pace and direction of interest-rate changes. |
| 2026-11-17 Tuesday 11:30 | Medium | 6-Week Bill Auction · $100B Prev: — Forecast: — Actual: — | Reveals the yield and investor demand for short-term Treasury funding; traders watch auction pricing and participation for signals about money-market conditions and near-term rate expectations. |
| 2026-11-17 Tuesday 14:25 | Medium | Fed's Williams speech Prev: — Forecast: — Actual: — | Policy remarks may clarify the economic outlook and monetary-policy stance; traders monitor them for changes in rate expectations that influence bond yields and equity discount rates. |
| 2026-11-17 Tuesday 16:30 | Low | API Weekly Crude Oil Stock Prev: 9.00M Forecast: -0.50M Actual: — | Estimates weekly changes in U.S. crude inventories; traders monitor the supply-demand signal for potential implications for oil prices, energy shares and inflation expectations. |
Summary: The calendar centers on U.S. consumer demand and monetary-policy communication, alongside labor, industrial activity, funding and energy indicators.
Conclusion: The highest-impact releases are concentrated in the consumer-spending data.
Market News Summary:
Nvidia’s pending earnings, leadership uncertainty and regulatory scrutiny dominate a weaker equity backdrop marked by rising volatility.
Primary Drivers & Risks:
- Primary Driver: Nvidia earnings amid AI stock weakness
- Primary Risk: Leadership uncertainty and widening regulatory scrutiny
Tone:
Risk-averse, with elevated options pricing and weakening index technicals.
Data, Market and System
Geopolitical:
- Tighter U.S. chip controls and mixed export-policy signals added uncertainty around American technology companies’ China revenue.
- The Justice and Commerce departments are conducting a criminal investigation into Megaspeed over suspected chip diversion, which the Singapore-based company denies.
Gold / Metals:
- October gold prices declined amid Fed rate-hike expectations, dollar strength and investor liquidations.
- Lower prices supported Indian festive-season demand, while Indian gold ETFs recorded a fifth consecutive month of net inflows and imports rebounded from September.
Fed / Financials:
- Fed official Williams continued to favor tighter monetary policy while saying the present moment did not call for dramatic action.
- The Canadian dollar held near a 19-month low as the U.S. dollar consolidated recent gains.
Macro / Other:
- Outages disrupted Microsoft services, air travel systems, JPMorgan transactions and Apple services over four days.
- Apple worked to restore services after an outage caused by an internal update.
- Steve Eisman identified local-government restrictions on data-center construction as a major risk to AI infrastructure expansion.
- Crypto-market weakness accompanied dollar strength and equity volatility, with commentary also citing investor concerns following the Binance hack.
Conclusion:
Nvidia’s pending earnings and leadership developments are the central equity catalysts in the supplied coverage. Broad AI weakness coincides with major indexes below their 200-day moving averages and a four-session rise in the VIX.
Regulatory investigations and tighter chip-export controls add pressure to the technology backdrop. Williams’s preference for tighter policy, dollar strength and operational outages form additional cross-currents.
Market News Sentiment
Sentiment Bias shows the balance of positive and negative news coverage sampled from 2026-11-16 16:00 to 2026-11-17 16:00 ET, covering stocks, energy and gold.
▼ Market news
- Bias
- ▼ -13.89%
- Articles
- 288
- Positive
- ▲ 23.26%
- Neutral
- — 39.58%
- Negative
- ▼ 37.15%
▼ GLD / Gold
- Bias
- ▼ -25.00%
- Articles
- 16
- Positive
- ▲ 25.00%
- Neutral
- — 25.00%
- Negative
- ▼ 50.00%
Sentiment Summary: Gold coverage leaned negative (50% negative versus 25% positive), with reports linking weakness near one-year lows to dollar strength, elevated real yields and December Fed hike expectations; Monday’s technology-led equity selloff also pressured metals. On November 17, gold fell near $3,848 after October retail sales rose 0.2%, with core sales up 0.6%, although an afternoon dollar pullback and falling Treasury yields supported a rebound. Healthy October Indian demand and continued ETF inflows provided a counterweight to the rate-driven pressure.
Conclusion: Wednesday, November 18 Fed minutes remain the next reported policy catalyst for the cross-market rates backdrop.
▼ USO / Oil
- Bias
- ▼ -72.73%
- Articles
- 11
- Positive
- ▲ 9.09%
- Neutral
- — 9.09%
- Negative
- ▼ 81.82%
Sentiment Summary: Oil coverage was 82% negative as reports from November 16 into November 17 emphasized recovering Middle Eastern exports and the IEA’s surplus outlook; Saudi Arabia reported October output of 10.5 million barrels daily, and Iraq resumed pipeline exports through Turkey on November 17. Tanker attacks and constrained Hormuz shipping remained the main counterweight, supporting a November 17 rebound even as rising supply limited gains and WTI and Brent remained range-bound near their 200-day moving averages.
Conclusion: Wednesday, November 18’s U.S. crude inventory release remains an upcoming catalyst, distinct from the supply recovery already reported.
Glossary: Sentiment Bias = (positive articles − negative articles) ÷ total articles × 100. It ranges from −100% negative to +100% positive. A reading near zero indicates little directional bias. Neutral articles reduce the score’s strength. ▲ positive; ▼ negative; — balanced. These readings describe news coverage, not market-price direction.
Market Technical Analysis
Analysis of VIX volatility, the completed session in major ETFs and mega-cap tech stocks, and futures snapshots and higher-time-frame analysis.
VIX — Market Fear Gauge Daily
| Level | Open | High | MaxVix | Low | MinVix | DNC% | DOC% | VR | MaxVR | MinVR |
|---|---|---|---|---|---|---|---|---|---|---|
| 25.45 | 23.02 | 27.73 | 28.36 | 22.39 | 16.21 | +11.09% | +10.56% | 10.92 | 56.57 | -6.27 |
VIX rose 10.56% from the session's opening level. VIX rose 11.09% versus the previous session close. Expected volatility rose from the period open. VIX is 76.0% up the recent 15-session range (16.21–28.36), in the 70–80% band.
VR: ATN Volatility Ratio (VR): 10.92 – Stocks fell while expected volatility rose. VR is in the lower part of its preceding 15-session VR range (-6.27 to 56.57), in the 20–30% band. VR rose 4.75 points from the previous session, a small shift relative to that range.
Range lookback: preceding 15 completed sessions.
Major ETFs and Mega Cap Tech Stocks
- Stocks traded lower ahead of Nvidia’s quarterly results, with the S&P 500 joining other major U.S. indexes below its 200-day moving average.
- Nvidia options priced an 8.5% earnings move, roughly twice its average move after the previous eight reports.
- The VIX rose for a fourth consecutive session, with options-market fear reaching levels unseen since April.
- Jensen Huang’s offer to return to Nvidia reportedly added about $90 billion to the company’s market value within ten minutes, without confirmation of his reinstatement.
- The SEC is investigating whether Nvidia violated investor disclosure laws following Huang’s departure.
- Nvidia’s investments have linked dozens of AI companies to its performance, adding exposure across the sector as the shares struggle.
- Waymo suspended freeway rides nationwide after California regulators restricted its freeway operations following safety incidents.
- Meta shares fell 0.65% despite a UBS Buy initiation and an $815 price target centered on its AI initiatives.
ETF, Mag7, and Cross-Market ETF Insights
Overall Tone
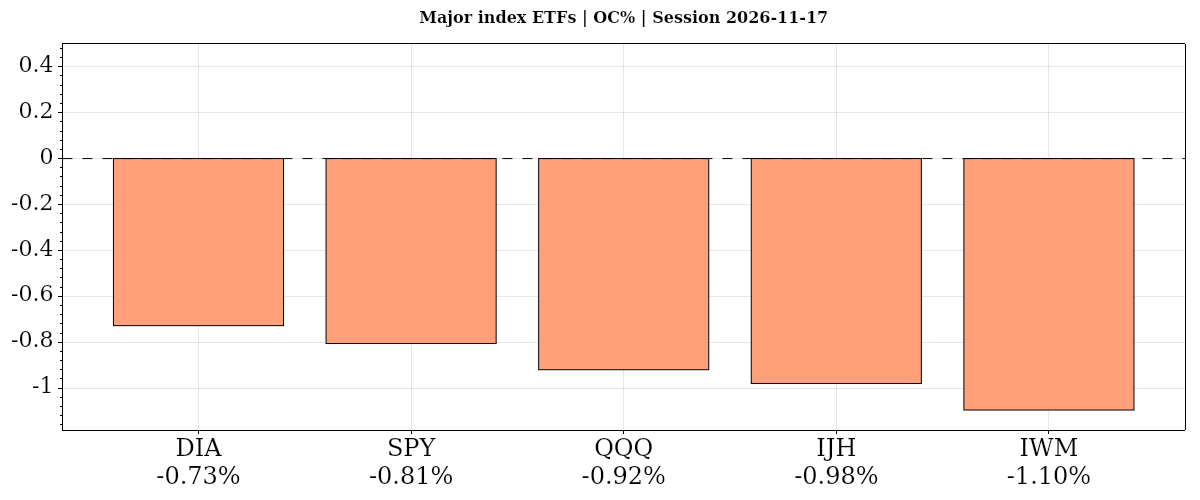
The completed daily session on 2026-11-17 showed a defensive tone, with declines from the open widespread and losses also prevailing versus the prior close.
| Instrument | Bias | Date | DNC% | DOC% | O | H | L | C | VWAP | Vol |
|---|---|---|---|---|---|---|---|---|---|---|
| ▼ DIA | ▼ ▼ ▼ | 2026-11-17 | ▼ -1.62% | ▼ -0.73% | 511.03 | 514.27 | 505.29 | 507.31 | ▼ 509.02 | 3,776,995 |
| ▼ SPY | ▼ ▼ ▲ | 2026-11-17 | ▼ -1.01% | ▼ -0.81% | 738.39 | 739.76 | 727.00 | 732.44 | ▲ 731.96 | 68,604,858 |
| ▼ QQQ | ▼ ▼ ▲ | 2026-11-17 | ▼ -0.73% | ▼ -0.92% | 663.05 | 663.36 | 646.64 | 656.95 | ▲ 654.89 | 51,215,685 |
| ▼ IJH | ▼ ▼ ▼ | 2026-11-17 | ▼ -1.31% | ▼ -0.98% | 72.46 | 72.85 | 71.50 | 71.75 | ▼ 72.00 | 9,420,156 |
| ▼ IWM | ▼ ▼ ▼ | 2026-11-17 | ▼ -1.43% | ▼ -1.10% | 272.03 | 273.05 | 267.87 | 269.05 | ▼ 269.96 | 28,269,425 |
| AVG/Sum | — | — | -1.22% | -0.91% | — | — | — | — | — | 161,287,119 |
Index ETFs
Negative confluence: average DOC% -0.91% from the open, DNC% -1.22% versus the prior close. All five index ETFs fell on both comparisons: DIA held up best from the open, IWM lagged, while QQQ was most resilient versus the prior close and DIA weakest. SPY’s decline came on above-average volume; IWM’s moving-average downtrends remained aligned.
DIA · D:2026-11-17 NC% ▼ -1.62% OC% ▼ -0.73%
DIA – Dow Jones Technicals Summary
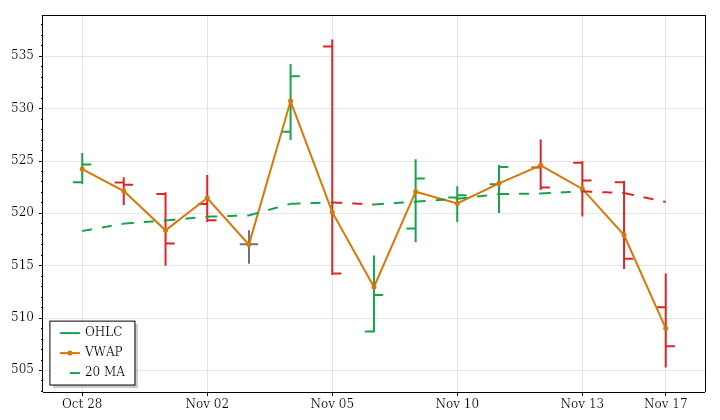
DIA’s completed November 17 daily session extended short-term weakness. The close at 507.31 fell 1.62% from the prior close, versus a 0.73% decline from the open, reflecting an opening gap lower that remained unfilled. Although trading crossed both sides of the open, the session formed lower highs and lows and closed beneath the previous day’s low and session VWAP.
The near-term downtrend aligns with the slightly negative 15-session price trend. Intermediate- and far-term structures are more conflicted: their benchmarks still rise, but price is below both. A second consecutive large-range session reinforced the expanding-range lookback pattern, while volume was slightly below average within a declining volume trend. Thus, price deterioration was not accompanied by above-average participation. The ATR-median measure crossed bearish; a next-session high above 523.2189 would conditionally reverse the downward PSAR state.
SPY · D:2026-11-17 NC% ▼ -1.01% OC% ▼ -0.81%
SPY – S&P 500 Technicals Summary
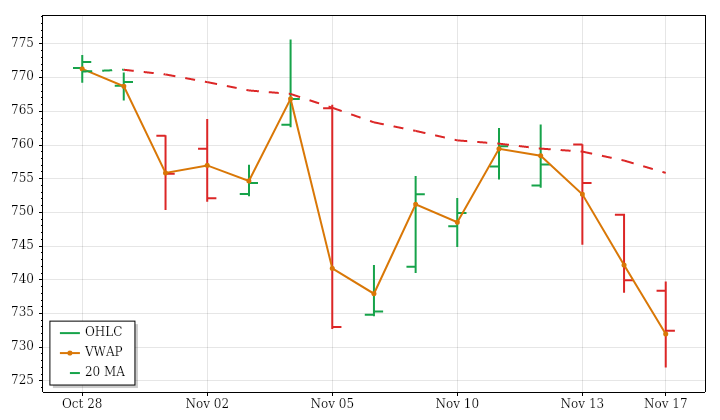
SPY’s completed November 17 daily session continued near- and intermediate-term weakness. The close at 732.44 declined 1.01% from the prior close and 0.81% from the open. Its opening gap lower remained unfilled, and lower highs and lows culminated in a finish below the previous day’s low. The close was slightly above session VWAP, showing a modest intraday offset to the otherwise negative session.
The far-term structure remains mixed because price is below a benchmark that still rises, unlike the falling near- and intermediate-term averages. A third consecutive large-range session reinforced the prior 15 sessions’ expanding-range pattern. Volume was about 32% above average, also consistent with an increasing lookback trend, giving the decline stronger participation. Both technical trend measures remain bearish; a next-session high above 760.9051 would conditionally trigger an upward PSAR reversal.
S&P 500 News and Fundamentals
The Federal Reserve’s next interest-rate decision is scheduled for December 9. Reporting tied to the S&P 500 described a hike as widely expected, with a half-percentage-point increase presented as a possibility rather than a confirmed outcome.
QQQ · D:2026-11-17 NC% ▼ -0.73% OC% ▼ -0.92%
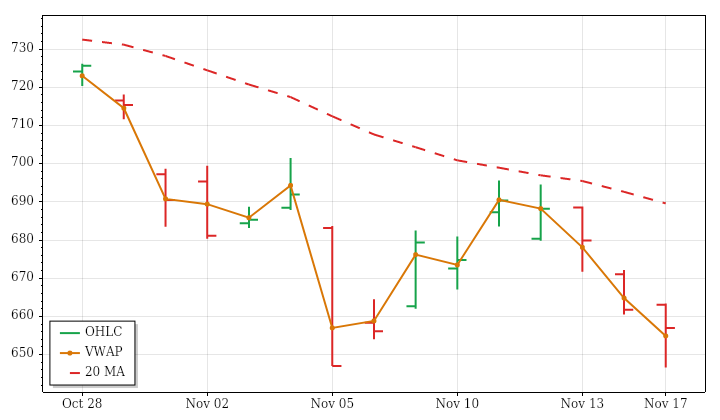
QQQ – Nasdaq 100 Technicals Summary
QQQ’s completed November 17 daily session extended an aligned decline across all three trend horizons. The close at 656.95 fell 0.73% from the prior close and 0.92% from the open, after an opening gap higher was filled. The session formed lower highs and lows and closed beneath the previous day’s low. It nevertheless finished above session VWAP, providing an intraday counterpoint without undoing the negative daily structure.
Near-, intermediate- and far-term benchmarks are falling with price below each, consistent with the downward 15-session price trend. The latest range was above average and matched the expanding lookback range pattern. Volume was slightly below average, broadly consistent with its gently decreasing trend, so the larger move did not bring increased participation. ATR-median remains downward and PSAR is short; a next-session high above 695.57 would conditionally reverse PSAR upward.
IJH · D:2026-11-17 NC% ▼ -1.31% OC% ▼ -0.98%
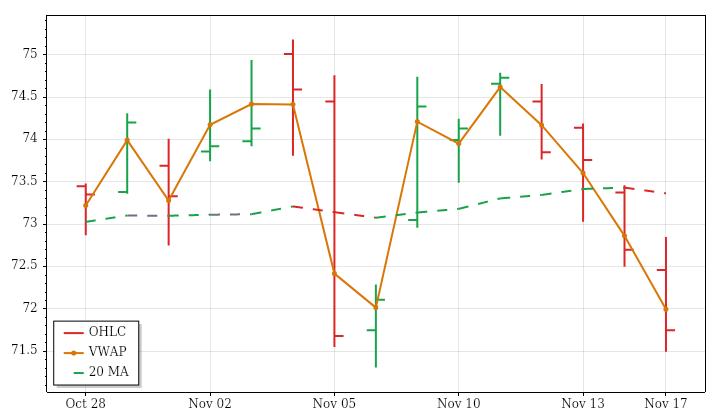
IJH – Mid Cap Technicals Summary
IJH’s completed November 17 daily session showed a decisive decline relative to its nearly flat lookback price trend. The close at 71.75 fell 1.31% from the prior close and 0.98% from the open. Its opening gap lower was filled, but the session ultimately formed lower highs and lows and closed below the previous day’s low. The finish below session VWAP reinforced that deterioration.
Intermediate-term direction is downward. Near- and far-term structures remain mixed because price is beneath benchmarks that are still rising, although the far-term slope is nearly flat. The latest session combined an above-average range with above-average volume, consistent with expanding ranges and increasing participation across the prior 15 sessions. That gives the decline greater participation than a quiet pullback. ATR-median crossed bearish; a next-session high above 74.7899 would conditionally trigger an upward PSAR reversal.
IWM · D:2026-11-17 NC% ▼ -1.43% OC% ▼ -1.10%
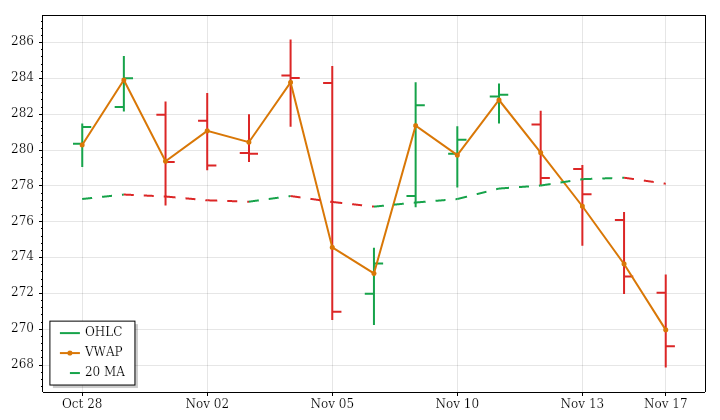
IWM – Small Cap Technicals Summary
IWM’s completed November 17 daily session extended weakness across an aligned downward trend structure. The close at 269.05 declined 1.43% from the prior close and 1.10% from the open. An opening gap lower was filled, but trading subsequently left a lower high and lower low and ended beneath the previous day’s low. The close below session VWAP was consistent with that negative finish.
Near-, intermediate- and far-term benchmarks are all falling, with price below each, matching the negative price trend across the prior 15 sessions. The latest range was moderately above average and volume was about 15% above average. Both features fit the lookback pattern of expanding ranges and increasing participation, rather than standing as isolated session effects. PSAR and ATR-median remain bearish; a next-session high above 279.8277 would conditionally reverse PSAR upward.
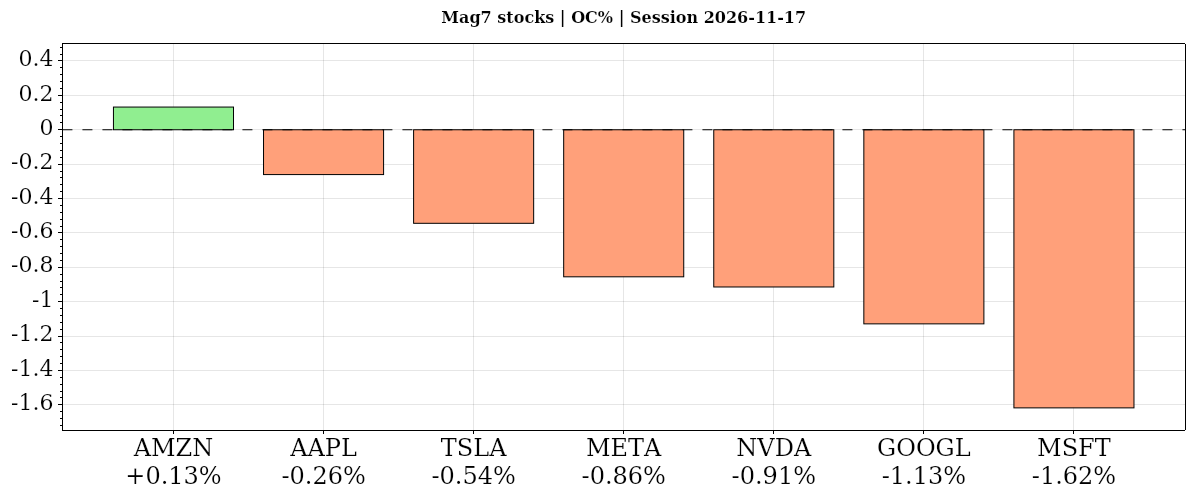
| Instrument | Bias | Date | DNC% | DOC% | O | H | L | C | VWAP | Vol |
|---|---|---|---|---|---|---|---|---|---|---|
| ▲ AMZN | ▲ ▲ ▲ | 2026-11-17 | ▲ +0.05% | ▲ +0.13% | 257.55 | 259.90 | 254.00 | 257.89 | ▲ 257.12 | 36,616,292 |
| ▼ AAPL | ▼ ▼ ▲ | 2026-11-17 | ▼ -0.25% | ▼ -0.26% | 352.83 | 355.36 | 349.67 | 351.91 | ▲ 351.84 | 36,298,480 |
| ▼ TSLA | ▲ ▼ ▲ | 2026-11-17 | ▲ +0.10% | ▼ -0.54% | 382.19 | 382.84 | 374.13 | 380.11 | ▲ 379.76 | 21,967,510 |
| ▼ META | ▼ ▼ ▼ | 2026-11-17 | ▼ -1.20% | ▼ -0.86% | 624.21 | 627.48 | 613.51 | 618.87 | ▼ 620.05 | 12,640,686 |
| ▼ NVDA | ▼ ▼ ▲ | 2026-11-17 | ▼ -0.44% | ▼ -0.91% | 156.90 | 158.19 | 150.33 | 155.46 | ▲ 154.00 | 358,937,347 |
| ▼ GOOGL | ▼ ▼ ▼ | 2026-11-17 | ▼ -1.24% | ▼ -1.13% | 283.40 | 284.09 | 278.46 | 280.20 | ▼ 280.79 | 31,326,193 |
| ▼ MSFT | ▼ ▼ ▲ | 2026-11-17 | ▼ -2.27% | ▼ -1.62% | 514.57 | 515.64 | 496.51 | 506.24 | ▲ 504.94 | 27,298,296 |
| AVG/Sum | — | — | -0.75% | -0.74% | — | — | — | — | — | 525,084,804 |
Mag7 Stocks
Negative confluence: average DOC% -0.74% from the open, DNC% -0.75% versus the prior close. Amazon alone gained from the open, though nearly flat; Microsoft lagged, while Tesla led versus the prior close despite declining from the open. Microsoft retained a rising longer-term structure, unlike Nvidia’s aligned downtrends.
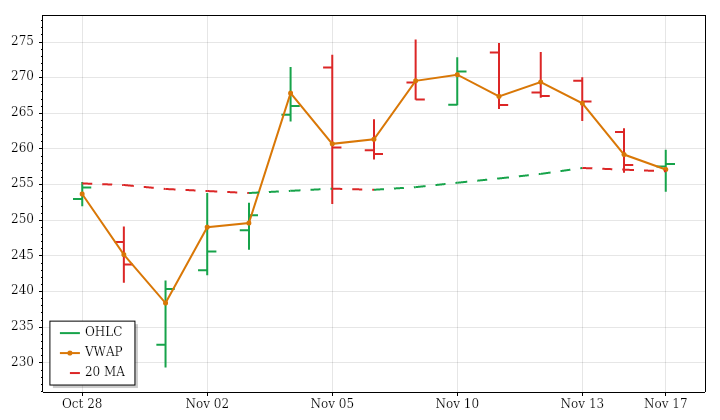
AMZN · D:2026-11-17 NC% ▲ +0.05% OC% ▲ +0.13%
AMZN – Amazon Technicals Summary
AMZN’s completed November 17 daily session produced little net progress despite recovering its opening gap lower. The close at 257.89 gained 0.05% against the prior close and 0.13% from the open. Price traded on both sides of the open, formed a lower high and lower low, and finished inside the previous day’s range. That combination describes consolidation rather than a clear directional advance.
Price remains below its rising near-term benchmark, creating a mixed short-term picture, while intermediate- and far-term trends remain upward. Finishing above session VWAP provided some intraday strength, but the narrow gain did not resolve that trend conflict. Range and volume were both below average, matching the prior 15 sessions’ contraction and declining participation. PSAR has turned downward despite an upward ATR-median state; a next-session high above 274.273 would conditionally reverse PSAR upward.
Amazon News and Fundamentals
A failed launch left 40 Amazon Leo satellites unable to reach orbit. ULA said preliminary data indicated that the Vulcan rocket’s first stage underperformed shortly after liftoff on Sunday.
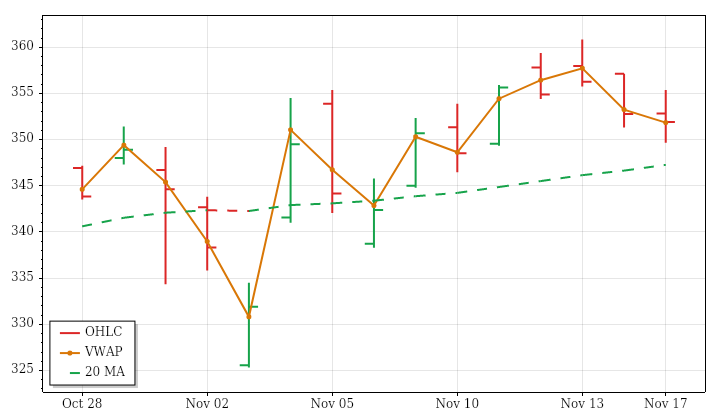
AAPL · D:2026-11-17 NC% ▼ -0.25% OC% ▼ -0.26%
AAPL – Apple Technicals Summary
AAPL’s completed November 17 daily session was a modest pullback within a still-rising broader structure. The close at 351.91 was down 0.25% from the prior close and 0.26% from the open. A marginal opening gap higher was filled, and trading crossed both sides of the open before finishing inside the prior day’s range. Lower highs and lows nevertheless gave the session a weaker tone.
The near-term picture is mixed because price sits below a rising short-term benchmark, while intermediate- and far-term trends remain upward. The close was barely above session VWAP, offering a limited counterpoint to the decline. Both range and volume were below their recent averages, consistent with contracting ranges and declining participation across the prior 15 sessions. PSAR remains upward; a next-session low below 349.67 would conditionally trigger a bearish reversal.
Apple News and Fundamentals
Apple services were disrupted amid a series of outages reported on November 17. Separately, Apple will stand trial in Paris in June 2027 over allegations that it organized planned obsolescence of several iPhone models by preventing repairs outside official outlets, a source close to the case told AFP.
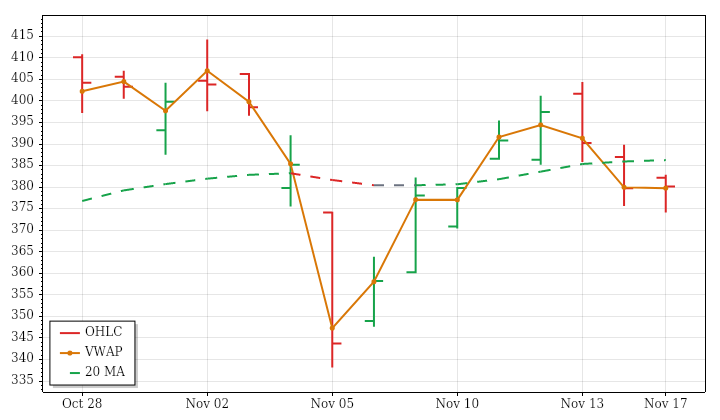
TSLA · D:2026-11-17 NC% ▲ +0.10% OC% ▼ -0.54%
TSLA – Tesla Technicals Summary
TSLA’s completed November 17 daily session finished marginally higher against the prior close but declined during regular-session trading. The close at 380.11 gained 0.10% from the prior close while losing 0.54% from the open, after the opening gap higher was filled. Lower highs and lows accompanied a finish inside the previous day’s range. The close was slightly above session VWAP, leaving a mixed intraday picture.
The near-term trend remains downward. Intermediate-term positioning is mixed, with price just below a rising benchmark, while the far-term picture is also mixed because price is above a falling benchmark. Session range and volume were substantially below average; the former contrasted with expanding lookback ranges, while the latter matched declining participation. PSAR and ATR-median remain upward despite the near-term average trend. A next-session low below 363.3715 would conditionally reverse PSAR downward.
Tesla News and Fundamentals
Tesla plans to invest €3 billion, roughly $3.3 billion, to expand its Grünheide Gigafactory in Germany with a facility designed to produce up to 1 million Cybercabs annually. Elon Musk also criticized the Cybercab’s $299 fee as too high. Separately, Tesla was reported to be sold out of Megapacks and considering a large solar plant in Texas.
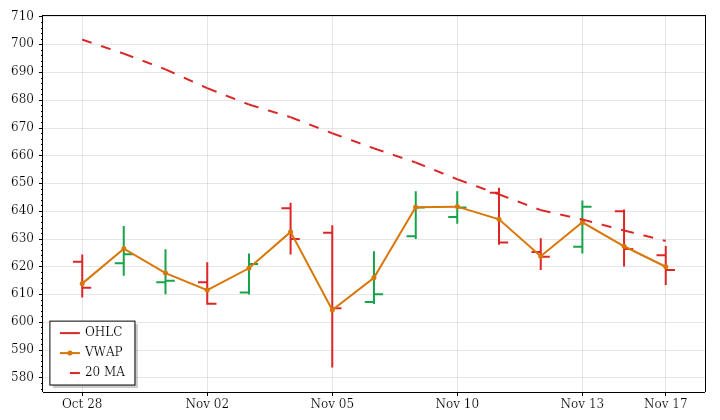
META · D:2026-11-17 NC% ▼ -1.20% OC% ▼ -0.86%
META – Meta Platforms Technicals Summary
META’s completed November 17 daily session weakened despite a mildly rising 15-session price trend. The close at 618.87 fell 1.20% against the prior close and 0.86% from the open. The opening gap lower was filled, but the session then formed lower highs and lows and closed below the previous day’s low. Finishing below session VWAP supported the negative daily reading.
Near- and intermediate-term trends are downward, while the far-term picture is mixed because price remains below a still-rising benchmark. The very low directional efficiency of the lookback advance helps explain why that positive price trend does not imply broad technical strength. Session range was below average despite an expanding lookback range trend. Volume was only about 56% of average, consistent with falling participation. ATR-median remains upward despite PSAR’s short state; a next-session high above 648.4499 would conditionally reverse PSAR.
Meta News and Fundamentals
Meta is testing Direct, a standalone messaging app that houses Instagram direct messages. The initial rollout is in Turkey and Thailand, and users can access the app with or without an Instagram account.
NVDA · D:2026-11-17 NC% ▼ -0.44% OC% ▼ -0.91%
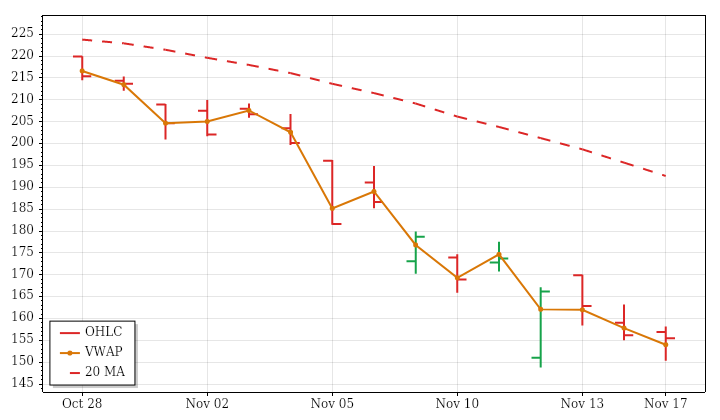
NVDA – Nvidia Technicals Summary
NVDA’s completed November 17 daily session declined within an established bearish structure, but its intraday positioning was less uniformly weak. The close at 155.46 fell 0.44% from the prior close and 0.91% from the open after an opening gap higher was filled. Price formed lower highs and lows, yet closed inside the previous day’s range and above session VWAP.
Near-, intermediate- and far-term trends remain downward, matching the strongly directional decline across the prior 15 sessions. The above-VWAP finish therefore represents an intraday contrast, not a change in broader alignment. Volume was about 36% above average, consistent with the sharply increasing lookback volume trend. Range was slightly below average despite the broader expansion in ranges. PSAR and ATR-median remain bearish; a next-session high above 165.76 would conditionally trigger an upward PSAR reversal.
Nvidia News and Fundamentals
The SEC is conducting a civil investigation into whether Nvidia violated investor-disclosure laws following Jensen Huang’s departure. Huang signaled willingness to return as CEO. The Justice and Commerce departments also confirmed a criminal investigation into Megaspeed over suspected chip diversion; Megaspeed denies wrongdoing and says inspections found no illicit transfers. Nvidia’s quarterly results were due later on November 17, its first earnings report without Huang.
GOOGL · D:2026-11-17 NC% ▼ -1.24% OC% ▼ -1.13%
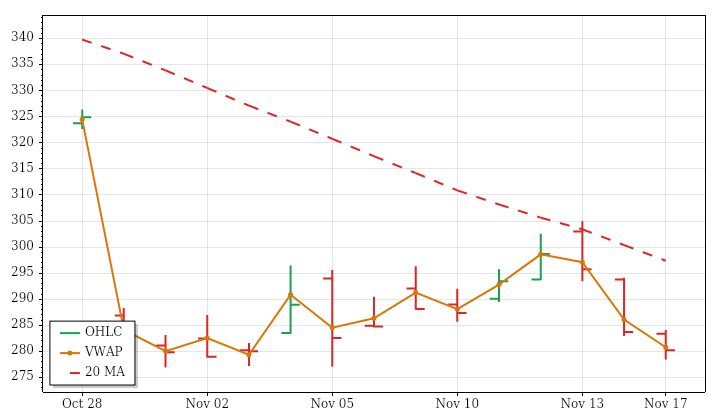
GOOGL – Alphabet Technicals Summary
GOOGL’s completed November 17 daily session reinforced an already aligned bearish structure. The close at 280.20 declined 1.24% from the prior close and 1.13% from the open. An initial gap lower was filled, but the recovery did not hold: price formed lower highs and lows and finished below the previous day’s low. The close also sat below session VWAP, consistent with the session’s negative direction.
Near-, intermediate- and far-term benchmarks are all falling with price beneath them, matching the downward price trend across the prior 15 sessions. The latest range was below average, however, contrasting with the expanding lookback range trend. Volume was also below average, in line with declining participation, so the fresh price weakness did not involve a volume expansion. ATR-median crossed bearish, while a next-session high above 304.9699 would conditionally trigger an upward PSAR reversal.
MSFT · D:2026-11-17 NC% ▼ -2.27% OC% ▼ -1.62%
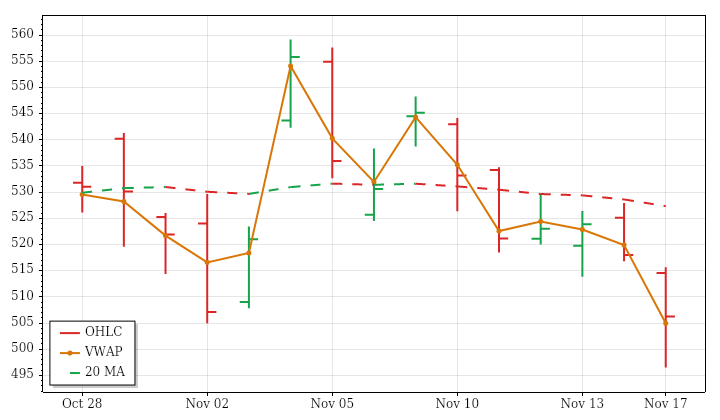
MSFT – Microsoft Technicals Summary
MSFT’s completed November 17 daily session was a substantial decline within a still-rising far-term structure. The close at 506.24 lost 2.27% from the prior close and 1.62% from the open. An opening gap lower remained unfilled, and price formed lower highs and lows before closing beneath the previous day’s low. Nevertheless, the finish was above session VWAP, a limited intraday counterpoint rather than a reversal of the day’s loss.
Near- and intermediate-term structures are mixed because price has fallen below benchmarks that continue to rise. The far-term trend remains upward, contrasting with the slightly negative 15-session price trend. The latest range expanded above average against a contracting lookback pattern, while volume stayed below average within a decreasing trend. Both technical trend measures are bearish; a next-session high above 553.8648 would conditionally trigger an upward PSAR reversal.
Microsoft News and Fundamentals
Microsoft is offering voluntary exits to engineers for the first time while increasing AI investment, with plans to spend $50 billion on AI capital expenditure this quarter. On November 17, Atlan announced a collaboration with Microsoft to extend data lineage and governance alongside the OneLake catalog across customers’ broader data estates, including data inside and outside Microsoft Fabric.
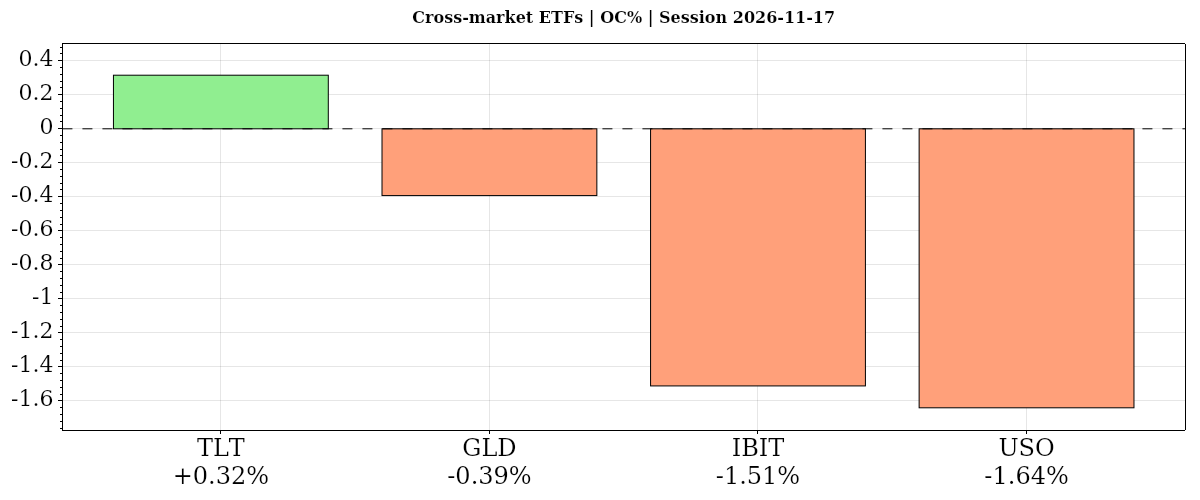
| Instrument | Bias | Date | DNC% | DOC% | O | H | L | C | VWAP | Vol |
|---|---|---|---|---|---|---|---|---|---|---|
| ▲ TLT | ▲ ▲ ▼ | 2026-11-17 | ▲ +0.21% | ▲ +0.32% | 79.30 | 79.77 | 79.23 | 79.55 | ▼ 79.58 | 33,256,090 |
| ▼ GLD | ▼ ▼ ▼ | 2026-11-17 | ▼ -0.13% | ▼ -0.39% | 353.87 | 356.53 | 352.00 | 352.48 | ▼ 354.14 | 7,822,304 |
| ▼ IBIT | ▼ ▼ ▼ | 2026-11-17 | ▼ -1.77% | ▼ -1.51% | 36.70 | 37.01 | 35.78 | 36.14 | ▼ 36.23 | 47,093,322 |
| ▼ USO | ▲ ▼ ▼ | 2026-11-17 | ▲ +0.15% | ▼ -1.64% | 142.58 | 142.74 | 139.56 | 140.24 | ▼ 141.15 | 2,980,458 |
| AVG/Sum | — | — | -0.38% | -0.81% | — | — | — | — | — | 91,152,174 |
Cross-Market ETFs
Negative confluence: average DOC% -0.81% from the open, DNC% -0.39% versus the prior close. Bonds alone rose from the open, diverging from equities; oil lagged intraday but finished slightly above the prior close. Gold slipped, bitcoin fell on both comparisons, and bonds’ daily gain contrasted with their falling longer-term structure.
TLT · D:2026-11-17 NC% ▲ +0.21% OC% ▲ +0.32%
TLT – Long-Term Treasury Bonds Technicals Summary
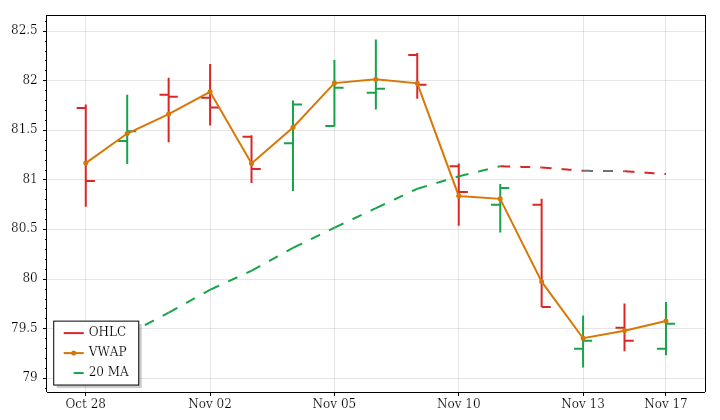
TLT’s completed November 17 daily session advanced against a generally weak trend background. The close at 79.55 gained 0.21% from the prior close and 0.32% from the open after filling an opening gap lower. The session formed an outside bar but finished inside the previous day’s range, limiting the directional message of the gain. It also closed slightly below session VWAP.
Near- and far-term trends remain downward. The intermediate-term structure is mixed because its benchmark still rises while price trades beneath it, leaving the latest advance short of broader alignment. Range was below average, consistent with contraction across the prior 15 sessions. Volume was slightly below average despite an increasing lookback trend, so participation did not expand with the gain. PSAR and ATR-median remain bearish; a next-session high above 80.7141 would conditionally trigger an upward PSAR reversal.
GLD · D:2026-11-17 NC% ▼ -0.13% OC% ▼ -0.39%
GLD – Gold Technicals Summary
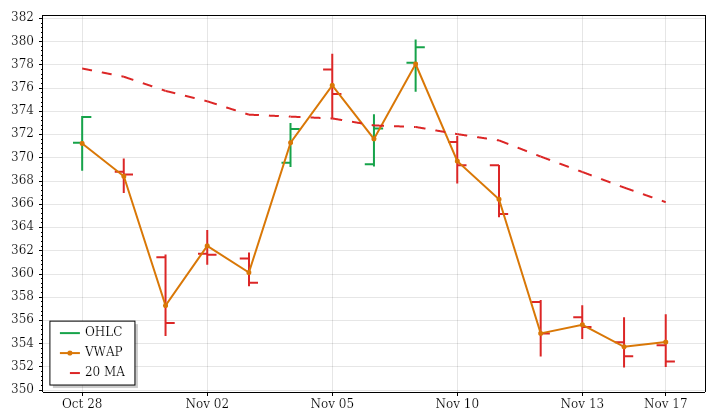
GLD’s completed November 17 daily session surrendered an opening advance and finished at 352.48, down 0.13% from the prior close and 0.39% from the open. The opening gap higher was filled. Despite a higher high and higher low, the close returned inside the previous day’s range and finished near the session low, below VWAP. That distinction makes the stronger daily extremes less constructive than they initially appear.
Near-, intermediate- and far-term downtrends remain aligned, so the latest decline fits the broader technical structure. The close also remained very close to the supplied 52-week low. Session range was slightly above average, unlike the contracting range trend across the prior 15 sessions. Volume was below average despite an increasing lookback trend. Both trend signals remain bearish; a next-session high above 374.9223 would conditionally reverse PSAR upward.
Gold News and Fundamentals
Gold traded near session lows on November 17 after U.S. October retail sales rose 0.2%, matching expectations, versus September’s 0.8% increase. Reports linked gold’s weakness to persistent expectations of further Federal Reserve tightening. In India, lower October prices supported festive-period demand, according to the World Gold Council: gold ETFs recorded a fifth consecutive month of net inflows, while imports rebounded from September’s lows.
IBIT · D:2026-11-17 NC% ▼ -1.77% OC% ▼ -1.51%
IBIT – Bitcoin Technicals Summary
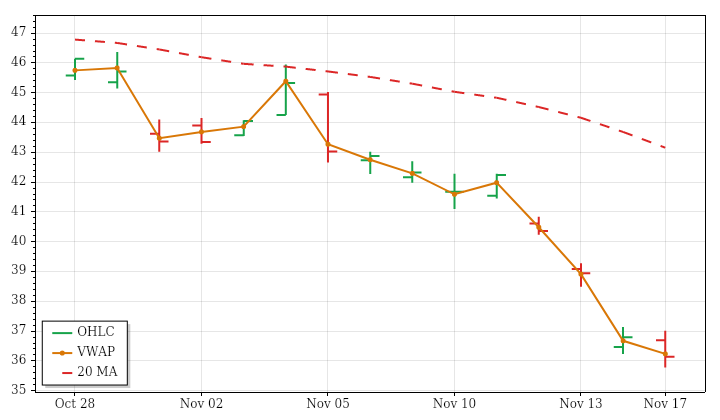
IBIT’s completed November 17 daily session extended its near- and intermediate-term decline. The close at 36.14 lost 1.77% against the prior close and 1.51% from the open. The opening gap lower was filled, but subsequent trading produced a lower high and lower low and a close beneath the previous day’s low. Finishing below session VWAP added to the weak intraday picture.
The far-term structure remains mixed rather than fully bearish: price is below its benchmark, but that benchmark still slopes upward. This contrasts with falling near- and intermediate-term averages and the comparatively directional decline across the prior 15 sessions. The latest range was above average despite a contracting lookback range trend. Volume was approximately average, whereas its broader trend was increasing. Both technical trend measures remain downward; a next-session high above 39.78 would conditionally reverse PSAR upward.
USO · D:2026-11-17 NC% ▲ +0.15% OC% ▼ -1.64%
USO – Oil Technicals Summary
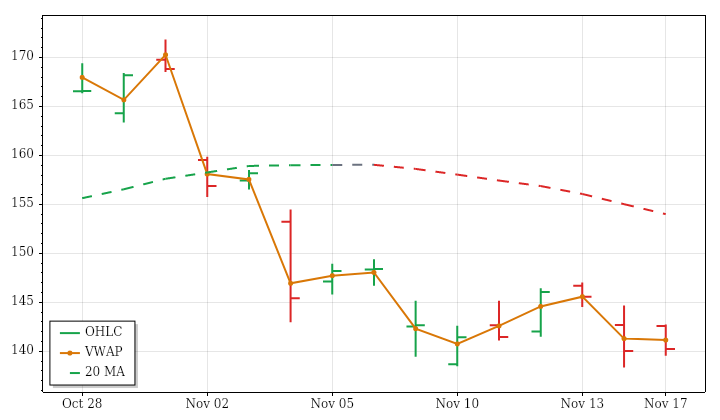
USO’s completed November 17 daily session retained only a small portion of its opening advance. The close at 140.24 rose 0.15% from the prior close but fell 1.64% from the open after filling a sizable gap higher. The inside bar ended near its low and below session VWAP, making the modest prior-close gain less constructive than its positive sign alone suggests.
Near-term direction remains downward, while the intermediate-term structure is mixed because price is below a still-rising benchmark. The far-term trend remains upward, leaving shorter-term weakness in conflict with the broader structure. Range and volume were below average. The smaller range contrasted with expansion across the prior 15 sessions, whereas light volume matched declining participation. Both technical trend measures remain bearish; a next-session high above 145.288 would conditionally trigger an upward PSAR reversal.
Oil News and Fundamentals
Oil reports on November 17 described competing supply and security pressures. Recovering Middle Eastern exports, rising inventories and expectations of a global surplus weighed on prices. A subsequent crude rebound was attributed to tanker-attack risks, while the International Energy Agency’s surplus forecast and rising supply limited gains. Strong U.S. refinery runs and global shipping constraints added conflicting signals.
Glossary: Instrument — ticker symbol; hover for the instrument or company name; Date — session date. DNC% — prior-session close to this session’s close; DOC% — daily session open-to-close percentage change. O — open; H — high; L — low; C — close, all for the table’s daily or weekly session; VWAP — volume-weighted average price; its arrow shows whether the close is above or below VWAP. Vol — period trading volume.
Bias — three directional readings, in order: DNC%, DOC%, then VWAP. ▲ positive/above; ▼ negative/below; — neutral or unavailable. Matching arrows show alignment; opposing arrows show mixed conditions. AVG/Sum — simple average of percentage changes and sum of reported volumes.
Futures Session Fib Grid Analysis – Snapshot
Session Fib Grids normalise market positioning as percentages, making direction and alignment comparable across different asset types.
Latest available snapshot for each instrument; Time(CT) shows the individual update date and time.
| Instrument | Bias | Time(CT) | YSFG | MSFG | WSFG | RSFG | SFG | TSI |
|---|---|---|---|---|---|---|---|---|
| ▼ ES | ▲ ▼ ▼ ▼ ▼ ▲ | 2026-11-17 18:17:26 | ▲ +25 | ▼ -75 | ▼ -58 | ▼ -11 | ▼ -1 | ▲ +44 |
| ▲ NQ | ▲ ▼ ▼ ▲ ― ▲ | 2026-11-17 18:17:23 | ▲ +18 | ▼ -48 | ▼ -33 | ▲ +14 | — 0 | ▲ +55 |
| ▼ YM | ▲ ▼ ▼ ▼ ― ▲ | 2026-11-17 18:17:26 | ▲ +12 | ▼ -47 | ▼ -78 | ▼ -35 | — 0 | ▲ +22 |
| ▼ EMD | ▲ ▼ ▼ ▼ ▼ ▲ | 2026-11-17 18:15:30 | ▲ +22 | ▼ -43 | ▼ -74 | ▼ -39 | ▼ -4 | ▲ +73 |
| ▼ RTY | ▲ ▼ ▼ ▼ ▼ ▲ | 2026-11-17 18:17:02 | ▲ +19 | ▼ -74 | ▼ -68 | ▼ -41 | ▼ -2 | ▲ +16 |
| ▼ FDAX | ▲ ▲ ▼ ▼ ▼ ▲ | 2026-11-17 18:17:06 | ▲ +34 | ▲ +24 | ▼ -65 | ▼ -55 | ▼ -8 | ▲ +79 |
| ▼ NKD | ▲ ▼ ▼ ▼ ▼ ▼ | 2026-11-17 18:17:20 | ▲ +106 | ▼ -41 | ▼ -32 | ▼ -17 | ▼ -17 | ▼ -36 |
| Instrument | Bias | Time(CT) | YSFG | MSFG | WSFG | RSFG | SFG | TSI |
|---|---|---|---|---|---|---|---|---|
| ▼ BTC | ▼ ▼ ▲ ▼ ▼ ▲ | 2026-11-17 18:17:19 | ▼ -92 | ▼ -90 | ▲ +1 | ▼ -5 | ▼ -7 | ▲ +45 |
| ▼ GC | ▼ ▼ ▼ ▼ ▼ ▼ | 2026-11-17 18:17:18 | ▼ -179 | ▼ -12 | ▼ -11 | ▼ -22 | ▼ -19 | ▼ -159 |
| ▼ CL | ▲ ▼ ▼ ▼ ▼ ▼ | 2026-11-17 18:17:17 | ▲ +139 | ▼ -103 | ▼ -45 | ▼ -36 | ▼ -9 | ▼ -61 |
| ▲ 6E | ▼ ▼ ▼ ▲ ▼ ▼ | 2026-11-17 18:16:37 | ▼ -74 | ▼ -70 | ▼ -26 | ▲ +6 | ▼ -9 | ▼ -158 |
| ▲ ZB | ▼ ▼ ▲ ▲ ▲ ▼ | 2026-11-17 18:16:46 | ▼ -42 | ▼ -44 | ▲ +7 | ▲ +3 | ▲ +7 | ▼ -22 |
Glossary: YSFG — yearly; MSFG — monthly; WSFG — weekly; RSFG — regular trading hours (RTH); SFG — the current session, including pre-market or other sessions. TSI indicates trend strength and power.
Bias shows trend alignment across these six readings. The arrows follow the column order: YSFG, MSFG, WSFG, RSFG, SFG and TSI. Matching arrows show alignment; opposing arrows show mixed conditions.
Futures Higher Time Frame Analysis
Summary of the current state of US Indices Futures based on higher time-frame (HTF) technical analysis as of: 2026-11-17 16:00 -05:00 CT.
US Indices Futures
- ES bullish YSFG, bearish MSFG/WSFG, below daily benchmarks and 55-week benchmark, evolving pivot support 7308, yearly neutral zone 7060–7260, pivot-reversal resistance 7683.25.
- NQ bullish YSFG, bearish MSFG/WSFG, below daily and 5–55-week benchmarks, pivot support 26366.50, 100-week support 25944.25, overhead references 28016.25–28789.
- YM bullish YSFG, bearish MSFG/WSFG, below daily benchmarks, testing rising 55-week benchmark, declining daily pivots, support 50568–50628, resistance 52227–52468.
- EMD bullish YSFG, bearish MSFG/WSFG, below daily and 5–55-week benchmarks, declining daily pivots, support 3560.7–3577.9, yearly neutral zone 3420–3540, pivot-reversal threshold 3773.1.
- RTY bullish YSFG, bearish MSFG/WSFG, below daily benchmarks, declining daily pivots, support 2699.5, yearly neutral-zone boundary 2670, benchmark resistance near 2778, pivot-reversal threshold 2897.5.
- FDAX bullish YSFG/MSFG, bearish WSFG, above weekly benchmarks, below 5/10-day benchmarks, declining near-term pivots, support 26082 then 25695, resistance 27084.
Overall State
- Short-Term: Bearish
- Intermediate-Term: Bearish
- Long-Term: Bullish
Conclusion
Bearish WSFG readings and recent short signals align across all six instruments. US contracts also share bearish MSFG readings and prices below every daily benchmark. Intermediate-term weakness is broader on daily charts; weekly structures remain mixed. Bullish YSFG readings and rising long-term weekly benchmarks preserve the broader upward context, despite predominantly bearish daily far-term ratings. FDAX shows relative structural strength through its bullish MSFG and price above all weekly benchmarks. Nearby pivot supports remain the principal downside references, with benchmark clusters and pivot-reversal thresholds defining overhead resistance.
Note: Intra-day counter-trend pullbacks or retracements may occur, HTF is context for informational usage and market structure. Glossary: Session Fib Grids periods of YSFG:’Yearly’, MSFG:’Monthly’, WSFG:’Weekly’
For full details visit: AlphaWebTrader Technicals
SPY Daily View
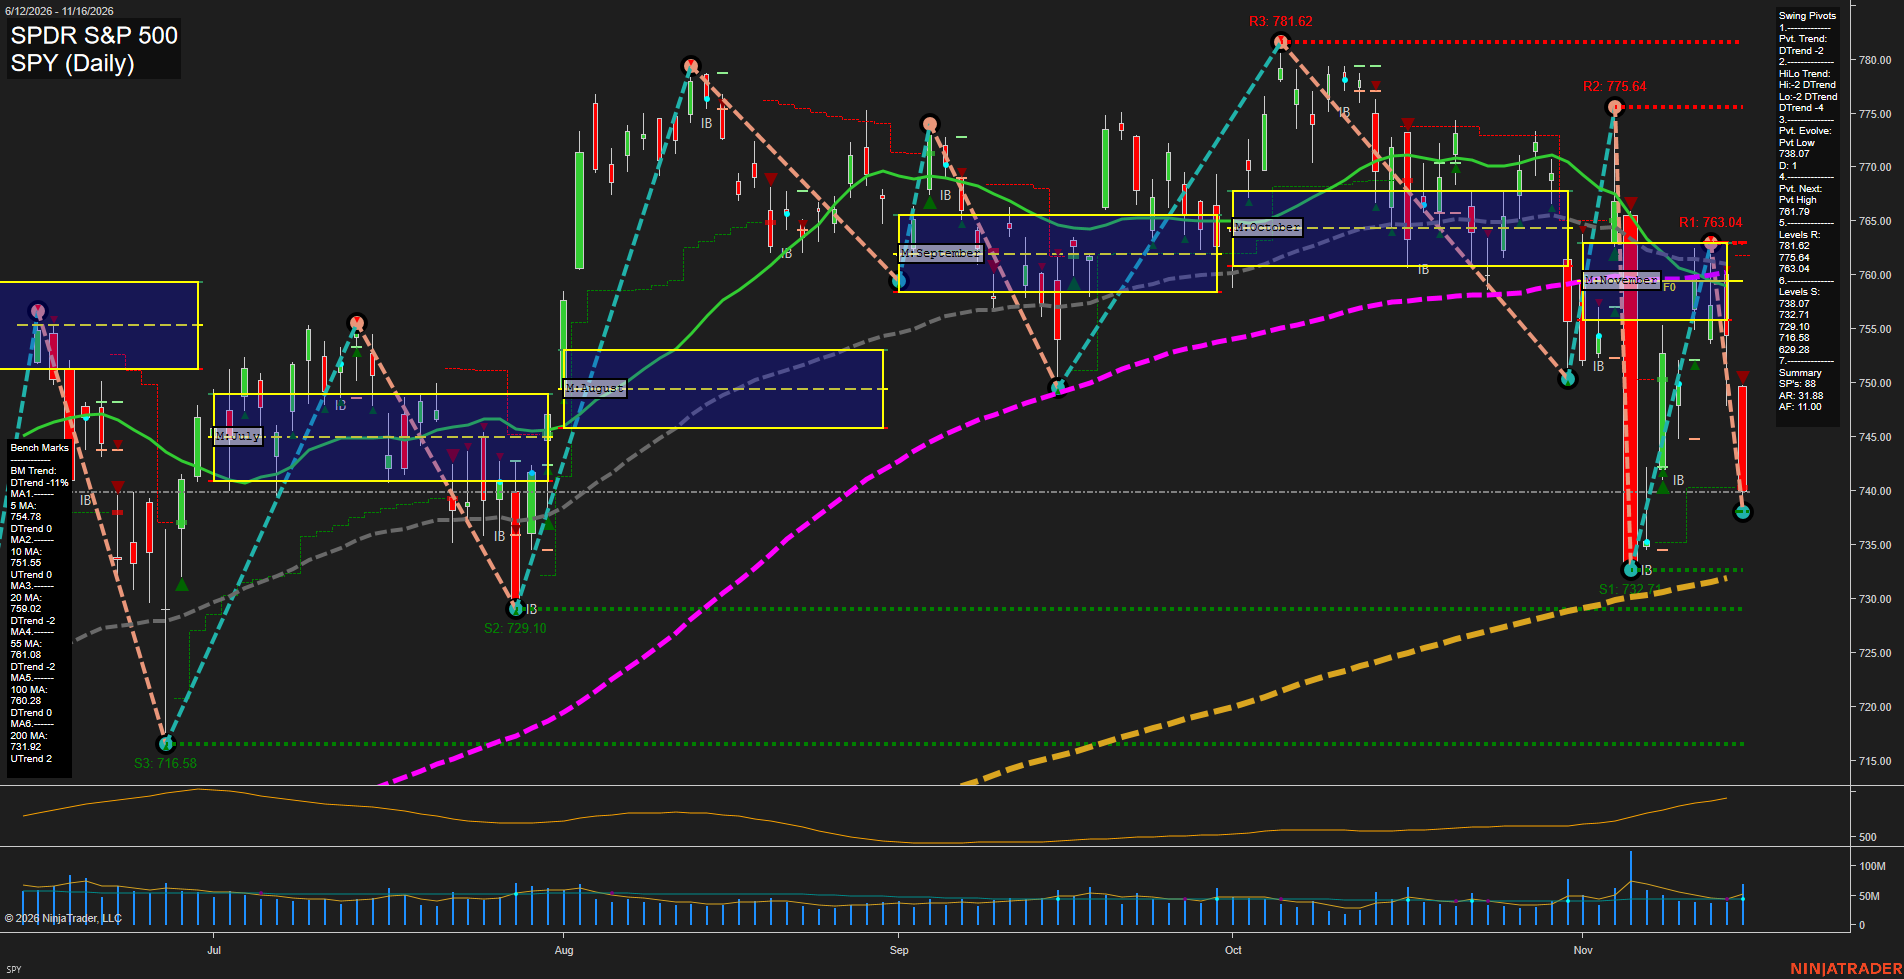
Overall Rating
- Near-Term: Bearish
- Medium-Term: Bearish
- Far-Term: Neutral.
Key Insights Summary
From a futures swing trader’s perspective, SPY shows accelerating downside expansion following a failed rebound and successive lower swing highs. Both pivot trends are bearish, and price is below every listed benchmark, including the still-rising 200-day average. The 727.00 evolving pivot low and 716.58 support frame the immediate downside structure; overhead resistance begins with the moving-average cluster around 750–760, followed by the 763.04 pivot. The latest large bearish bars and rising ATR indicate expanding volatility rather than orderly consolidation. Far-term conditions are mixed: the 100-day benchmark is declining while the 200-day remains rising, although price has broken beneath both. Despite the neutral grid placeholders above, the visible November monthly grid places price clearly below its NTZ, a bearish technical position; weekly and yearly grids are not displayed. The specified named trade signals and news catalysts cannot be verified from this image. SPY levels describe the ETF and are not directly interchangeable with equity-index futures prices.
View charts on: AlphaWebTrader HTF Charts
ES Daily View
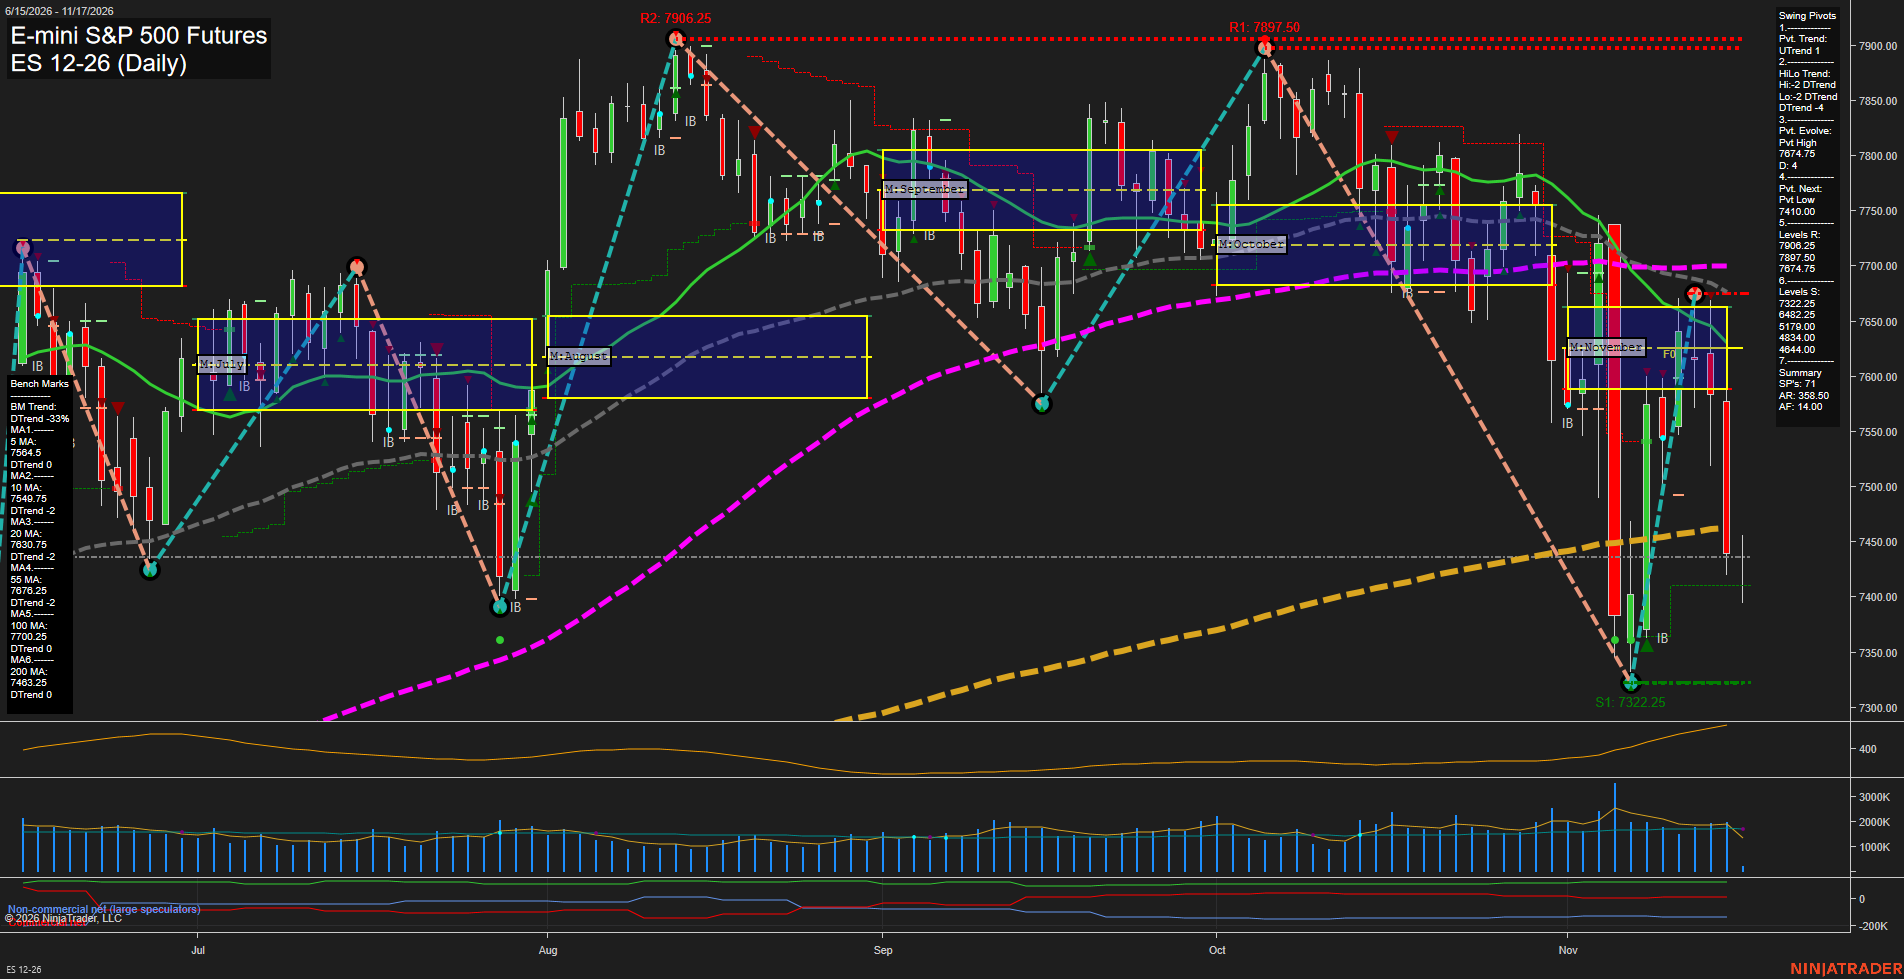
Overall Rating
- Near-Term: Bearish
- Medium-Term: Bearish
- Far-Term: Bearish.
Key Insights Summary
From a futures swing-trading perspective, the failed rebound into 7674.75 has given way to a fast selloff and a fresh evolving pivot low at 7308.00, below the preceding 7322.25 low. Lower swing highs and lows, negative weekly and monthly grid readings, and price beneath every benchmark reinforce bearish near- and medium-term alignment. The approximately 7350 close remains near the latest low, while ATR of 413 reflects an unusually wide trading-range environment. The reported short signals align with the decline. Far-term conditions are mixed but bearish on balance across the supplied metrics, with the positive yearly grid contrasting against negative benchmark readings and price below the 100- and 200-day benchmarks. The 200-day average still slopes upward visually, distinguishing the longer-run backdrop from the immediate downswing. No accompanying news evidence establishes a catalyst, and seasonal tendencies do not override the observed technical deterioration.
View charts on: AlphaWebTrader HTF Charts
QQQ Daily View
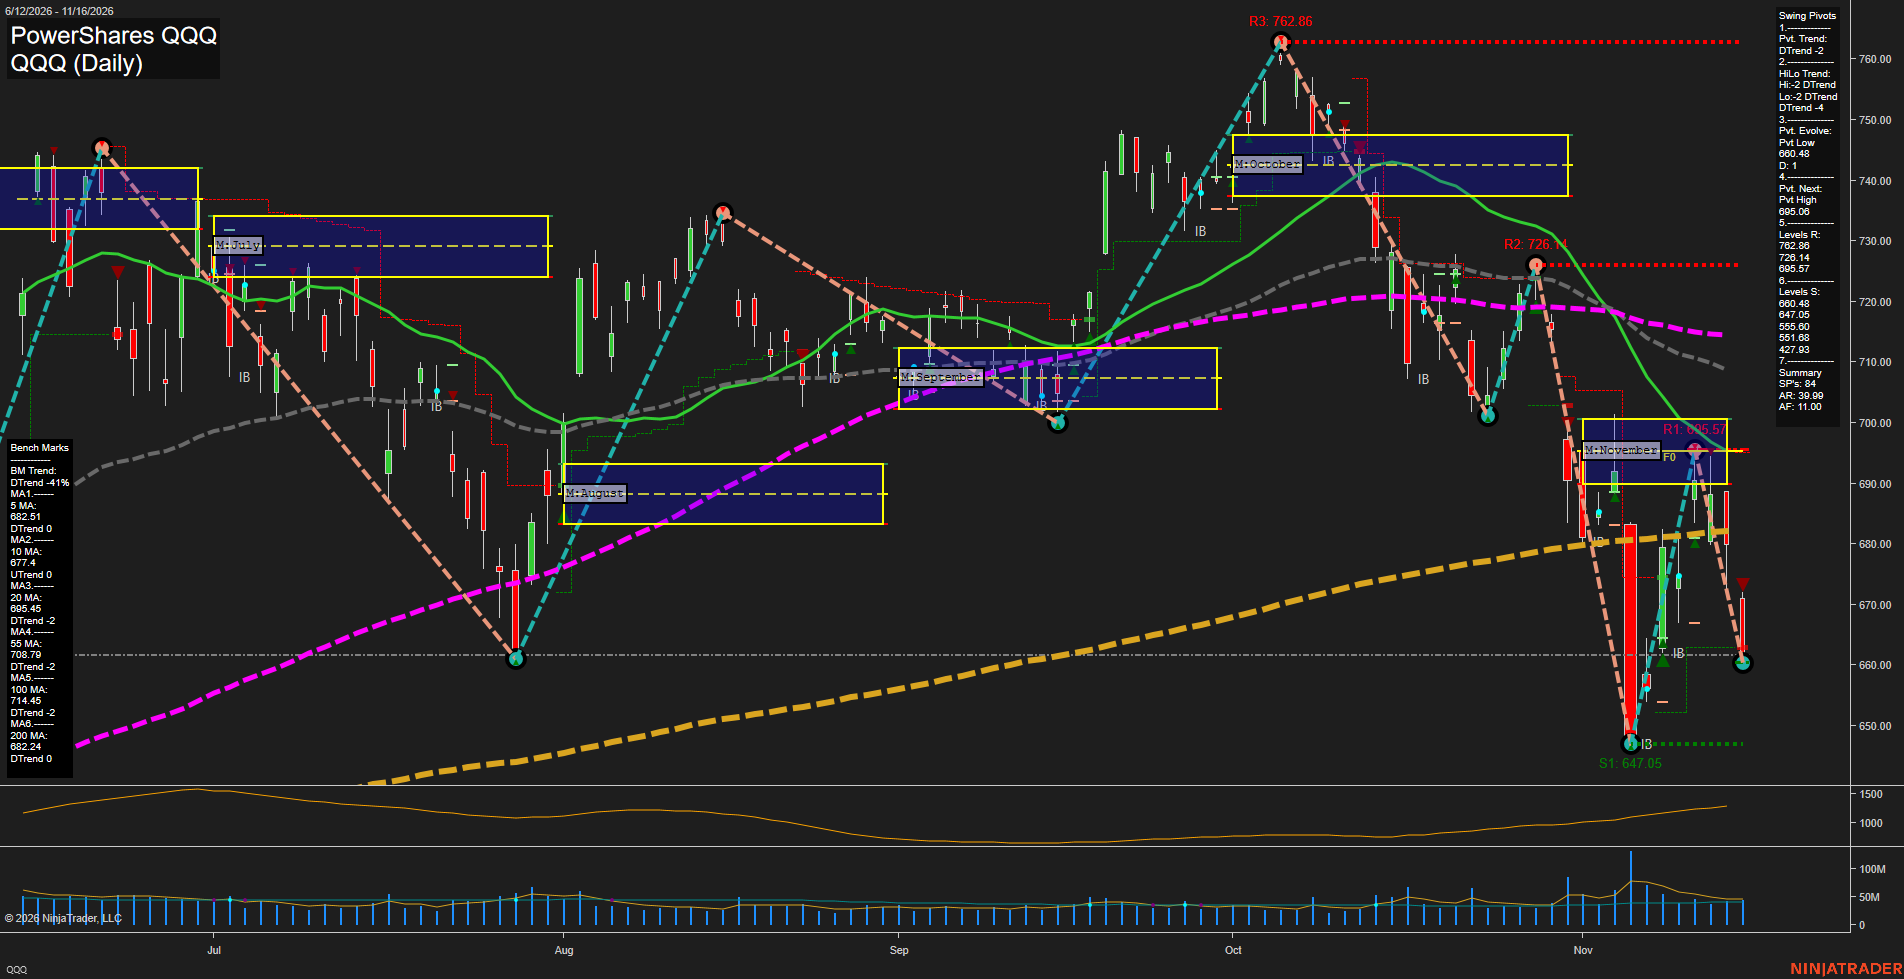
Overall Rating
- Near-Term: Bearish
- Medium-Term: Bearish
- Far-Term: Bearish.
Key Insights Summary
From a futures swing trader’s perspective, QQQ reflects a bearish Nasdaq directional backdrop, not a direct NQ futures price map. Lower pivot highs and lows, price beneath every benchmark, and rejection near 695.57 characterize a failed countertrend rebound followed by renewed selling. The evolving 646.64 low marginally undercuts the earlier 647.05 low; this is a support retest, not a confirmed W reversal. The next opposite-pivot threshold is 681.54, while November’s neutral zone around 690–701 remains overhead. Rising ATR and wide daily ranges indicate expanding volatility. Far-term weakness includes price below the 200-day benchmark, although its displayed DTrend 0 reading indicates a flat rather than decisively falling slope. Weekly and yearly grids and the named USAR signals are not visible; their neutral entries represent unavailable confirmation. ATR and volume-average readings are approximate, and the chart alone does not establish a news or seasonal explanation.
View charts on: AlphaWebTrader HTF Charts
NQ Daily View
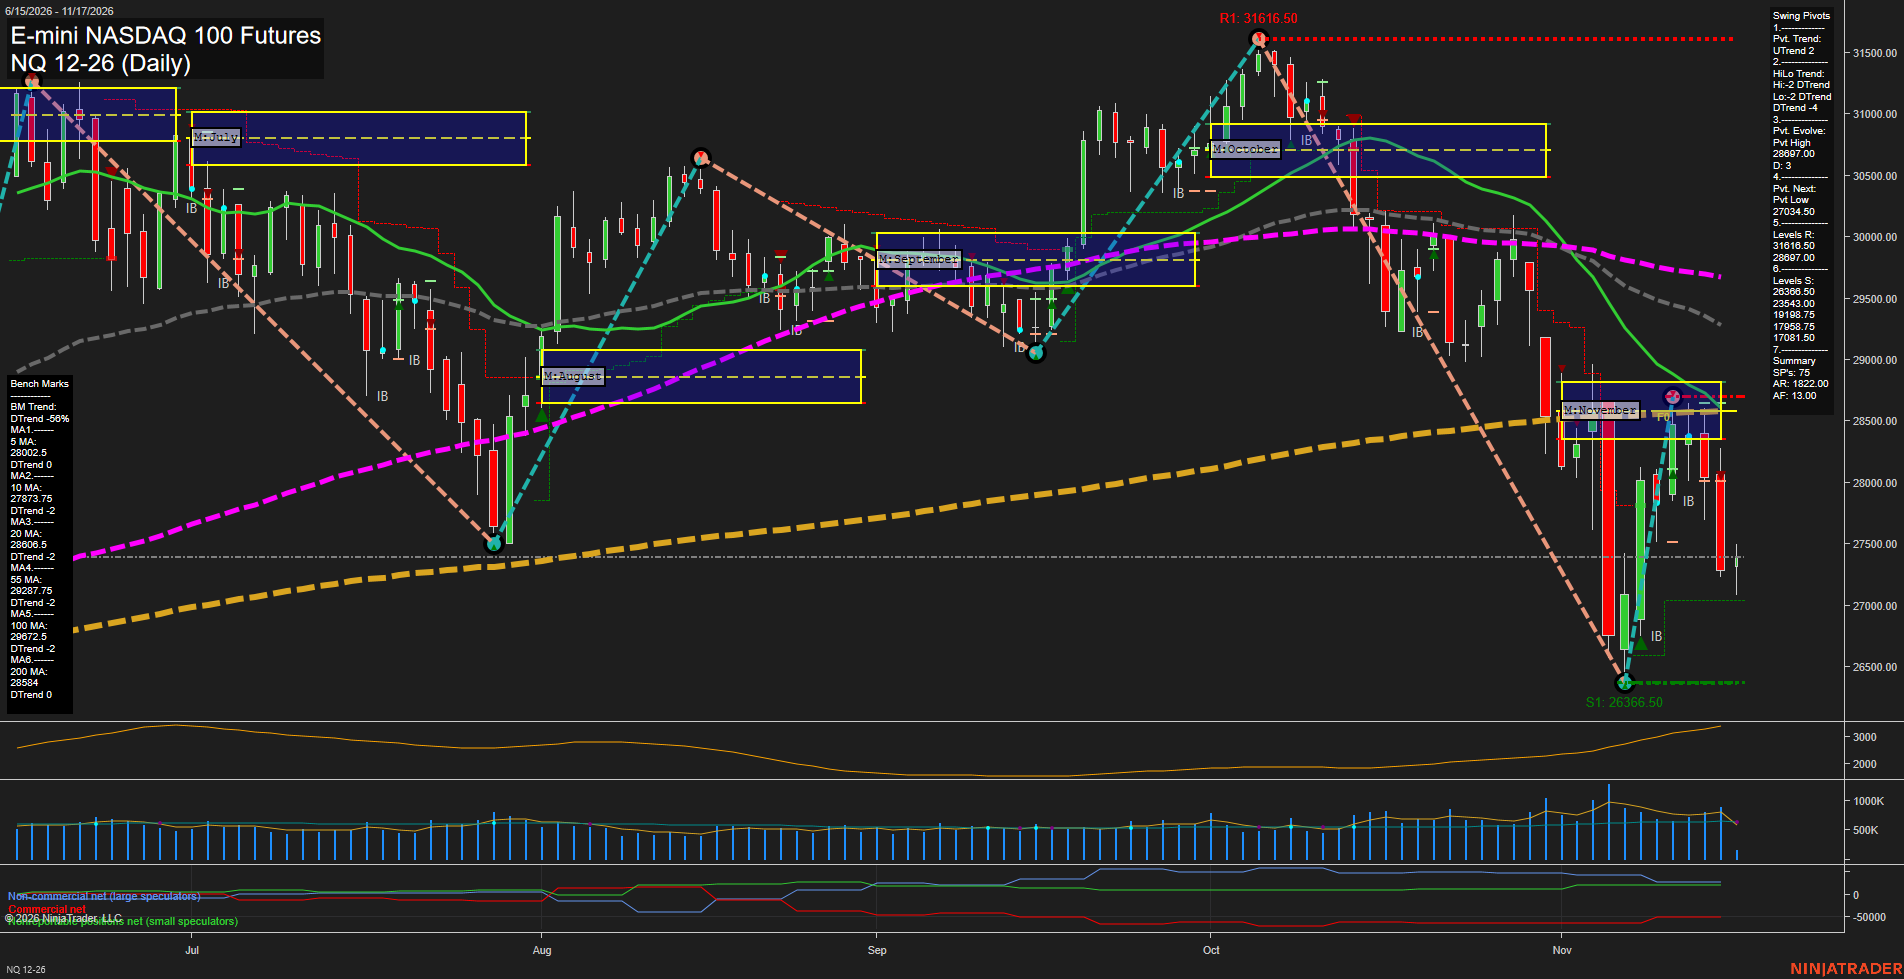
Overall Rating
- Near-Term: Bearish
- Medium-Term: Bearish
- Far-Term: Bearish.
Key Insights Summary
From a futures swing perspective, the rebound from 26366.50 to 28697.00 formed a lower high beneath the October peak of 31616.50. Renewed selling has carried price below every benchmark average and back toward the evolving 26658.50 pivot low. That low remains above 26366.50, so the latest downswing has not yet broken the early-November trough. Nevertheless, bearish weekly and monthly grids, declining pivot trends, and both recent short signals favor a downside interpretation of the current structure. Large daily ranges and rising ATR characterize an expanding-volatility selloff rather than quiet consolidation. The positive yearly grid provides a longer-horizon counterpoint, but declining 100-day and 200-day benchmarks leave the far-term majority bearish. No news catalyst can be established from the chart, and seasonal tendencies do not override its current technical deterioration.
View charts on: AlphaWebTrader HTF Charts
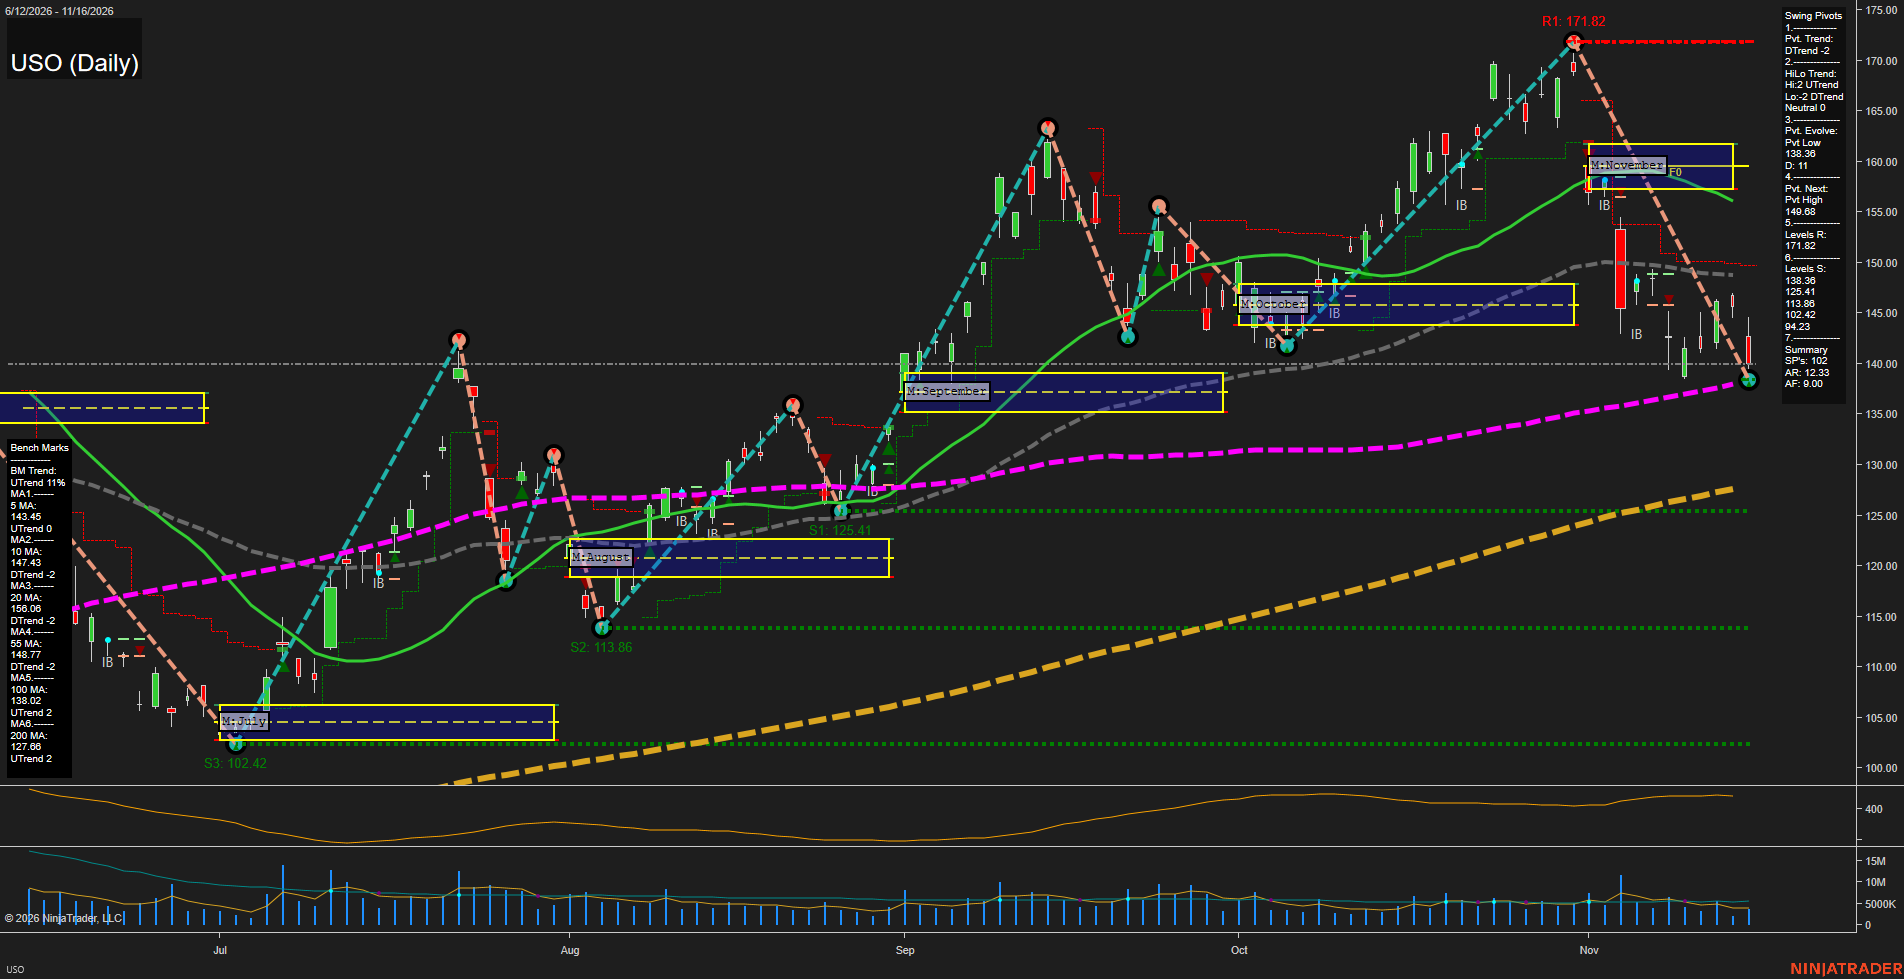
USO Daily View
Overall Rating
- Near-Term: Bearish
- Medium-Term: Bearish
- Far-Term: Bullish.
Key Insights Summary
From a futures swing trader’s perspective, USO shows a sharp countertrend downswing within a still-rising long-term structure. The decline from 171.82 to 138.36 represents approximately a 19.5% retracement, with price below all four short- and medium-term benchmarks and beneath November’s monthly neutral zone around 157–162. The developing pivot low at 138.36 nearly coincides with the rising 100-day benchmark at 138.33, creating the principal support confluence. Recent smaller candles suggest downside momentum is moderating, but do not establish a reversal. The 142.92–145.75 benchmarks mark nearby overhead resistance, followed by the 148.46 benchmark and 149.52 opposite-pivot threshold. Mixed higher-high/lower-low pivot structure indicates expanding swings rather than an orderly medium-term uptrend. Weekly and yearly grids and the named trading-signal series are not visible; their neutral entries reflect unavailable evidence rather than confirmed balance. ATR and VOLMA values are supplied template figures, not independently verified chart readings. USO is an oil-futures-linked fund rather than a futures contract; roll effects can influence its performance. No news or seasonal catalyst is established by this chart.
View charts on: AlphaWebTrader HTF Charts
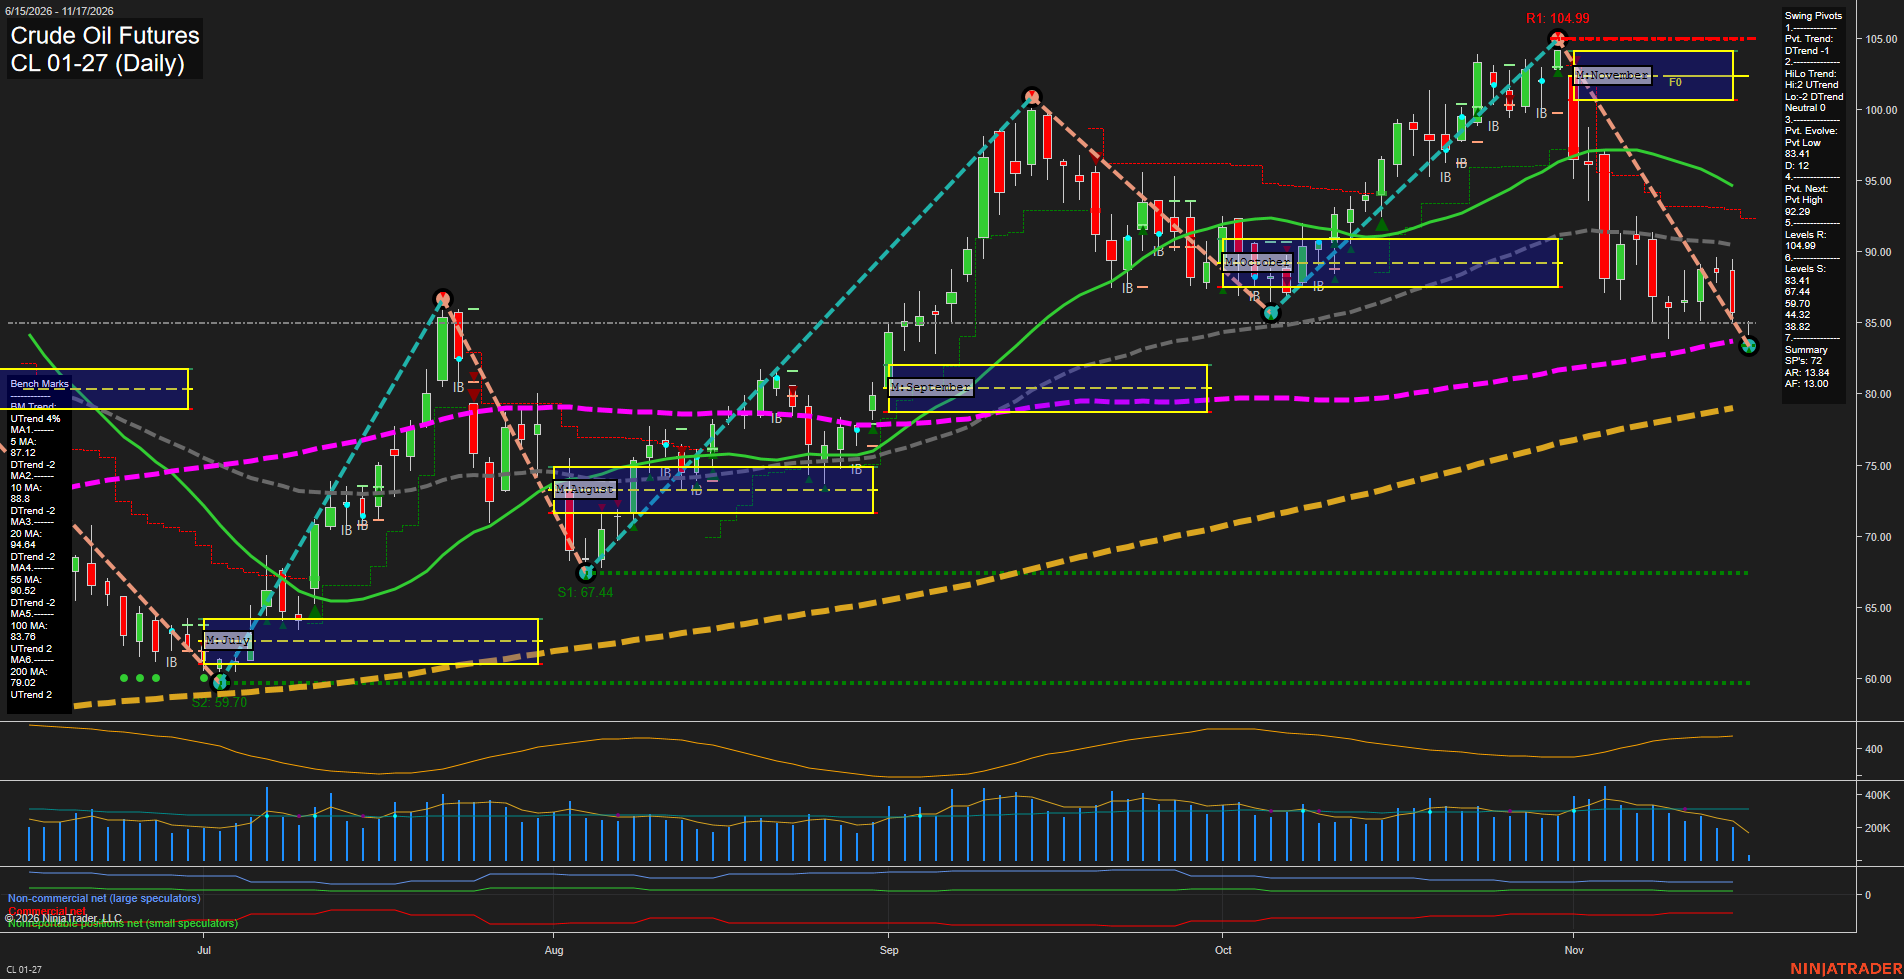
CL Daily View
Overall Rating
- Near-Term: Bearish
- Medium-Term: Bearish
- Far-Term: Bullish.
Key Insights Summary
The daily chart shows a sharp downswing from 104.99, with price below falling 5-, 10-, 20- and 55-day benchmarks. Negative weekly and monthly grid readings reinforce bearish swing momentum, consistent with both reported short signals. The medium-term pivot summary remains neutral because higher highs and lower lows conflict, rather than confirming a uniform downtrend. The evolving 83.41 low and rising 100-day benchmark at 83.76 define the nearest support area; the 200-day benchmark remains lower at 79.02. Near-term benchmark resistance spans 87.12–88.80, followed by 90.52 and the 92.29 pivot-reversal threshold. Structurally, this is a substantial correction within a still-positive far-term trend, not a confirmed bullish reversal. Recent displayed volume has tapered despite the decline. The chart does not establish a news catalyst or seasonal explanation.
View charts on: AlphaWebTrader HTF Charts
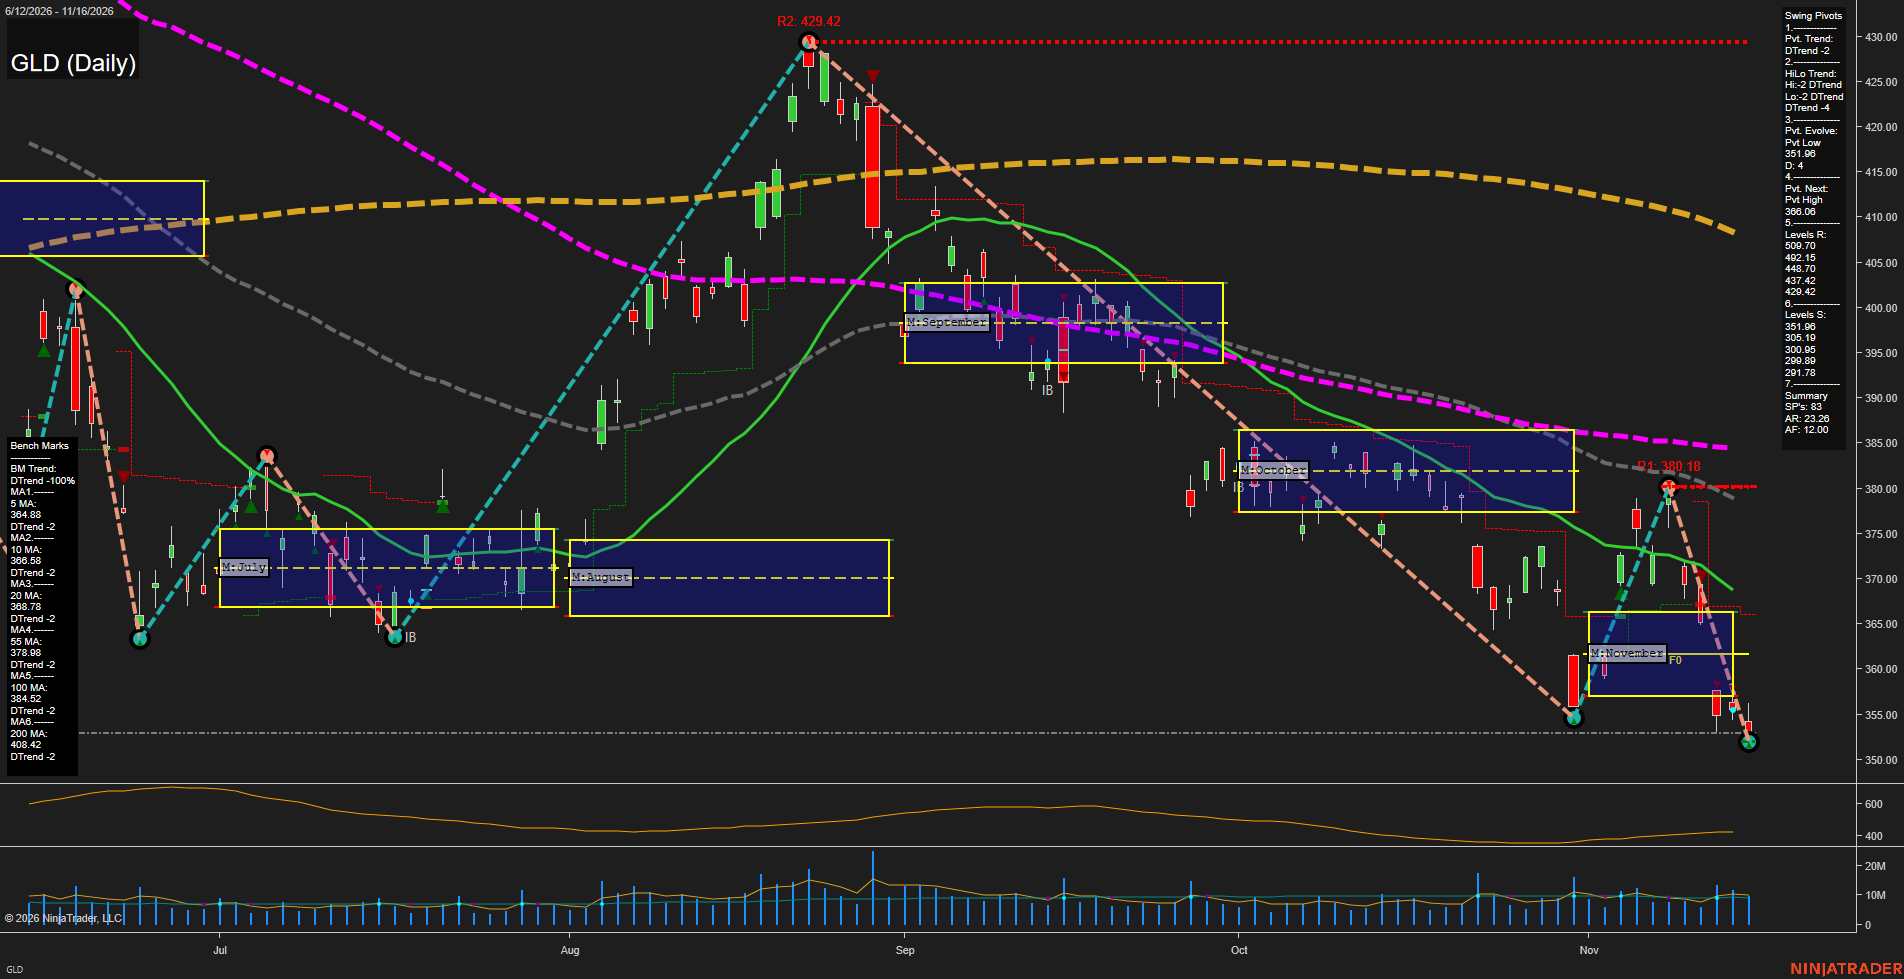
GLD Daily View
Overall Rating
- Near-Term: Bearish
- Medium-Term: Bearish
- Far-Term: Bearish.
Key Insights Summary
From a futures swing trader’s perspective, GLD shows bearish trend continuation rather than a confirmed reversal. The rebound to 380.18 failed, followed by a fresh evolving pivot low at 351.96. Price is below all six declining benchmarks and below November’s approximately 357–366 neutral zone, centered near 362. Smaller recent bars indicate localized compression near the lows, not an established bullish turn. The displayed next-pivot reversal threshold is 365.94; the recent 380.18 swing high remains an important overhead reference, separate from the summary’s listed resistance levels. Weekly and yearly grids and the named USAR signal readings are not visible, so their direction cannot be verified; their neutral template entries do not establish neutral market conditions. ATR and VOLMA above are supplied template values rather than independently verified chart readings. This is an ETF-based assessment of gold’s directional structure, not a futures-contract price or volatility measurement; futures basis and contract-roll effects are not shown.
View charts on: AlphaWebTrader HTF Charts
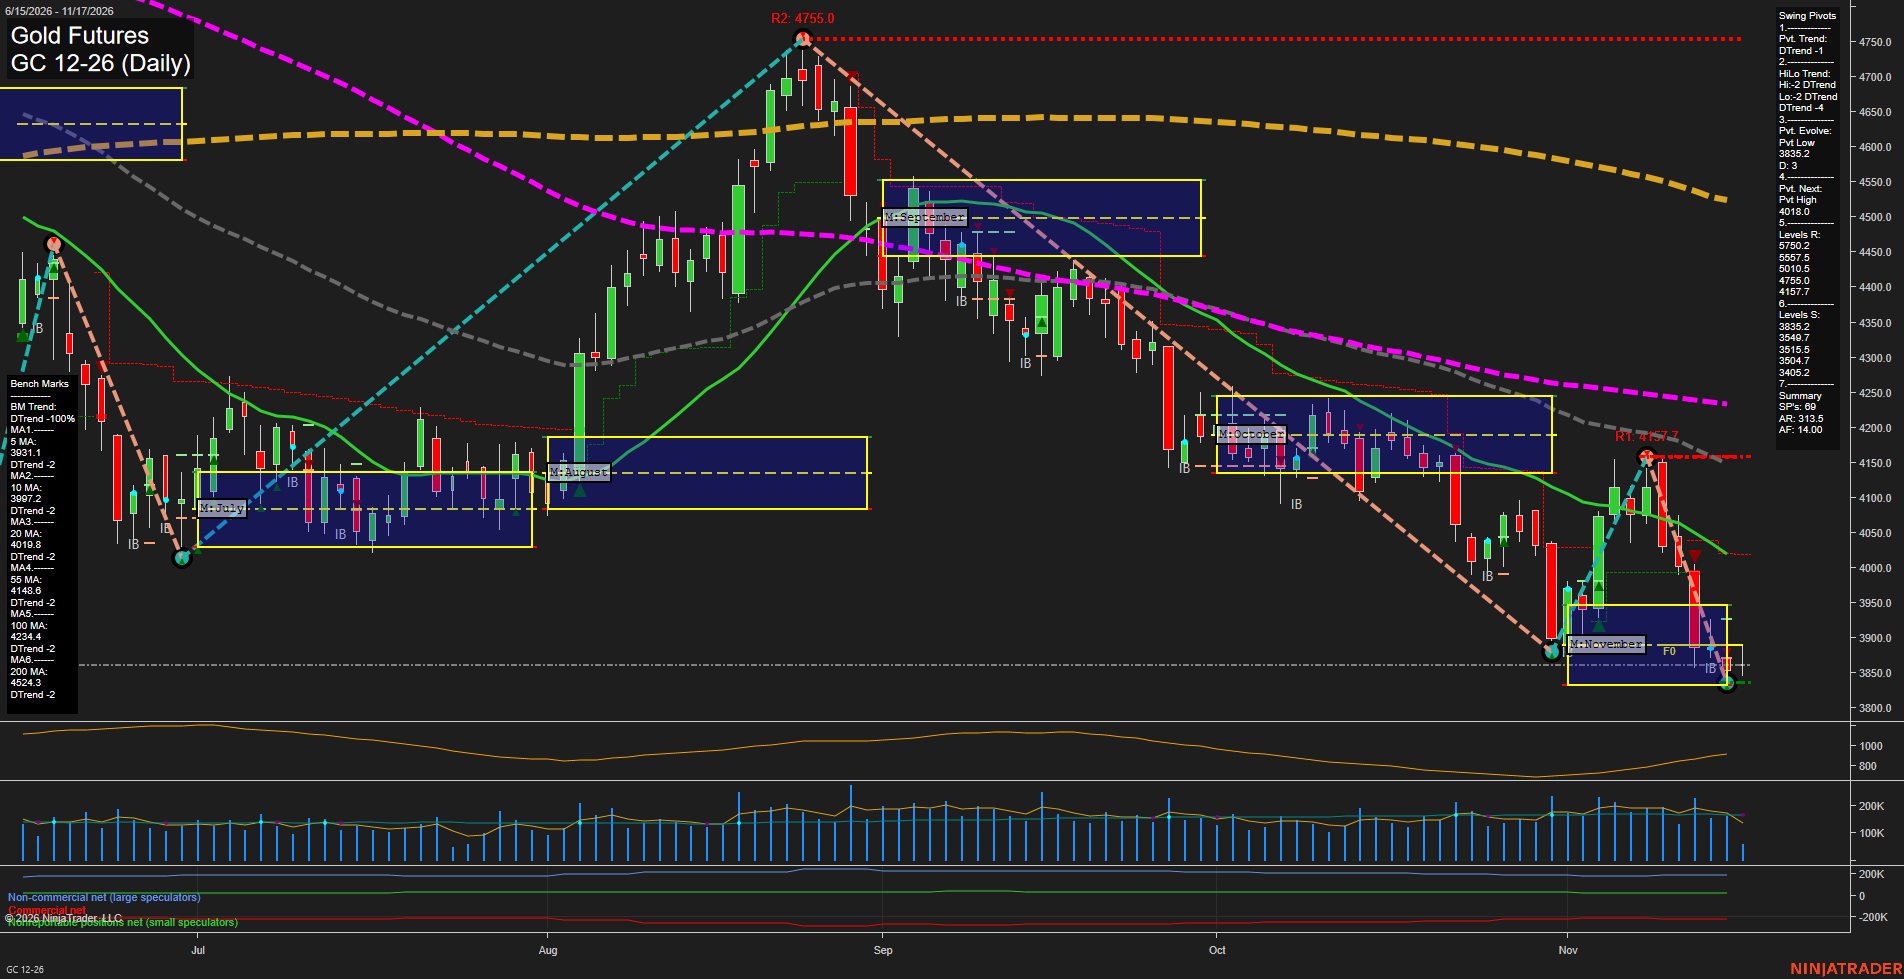
GC Daily View
Overall Rating
- Near-Term: Bearish
- Medium-Term: Bearish
- Far-Term: Bearish.
Key Insights Summary
From a futures swing-trading perspective, the dominant structure remains bearish across all three horizons. The November rebound failed at 4157.7, establishing a lower high before selling extended to the evolving 3835.2 pivot low. Price remains below all six declining benchmarks and below the weekly, monthly and yearly grid centers. Small latest bars suggest near-term deceleration around support rather than a confirmed reversal. The 4018.4 pivot-reversal threshold closely aligns with the 4019.8 twenty-day benchmark, marking an important structural reference overhead. The latest WSFG long signal is countertrend relative to the broader technical picture and the recent TR120 and TR720 short signals. No MSFG trade signal is supplied, and the chart alone does not establish news or seasonal drivers.
View charts on: AlphaWebTrader HTF Charts
ZB Daily View
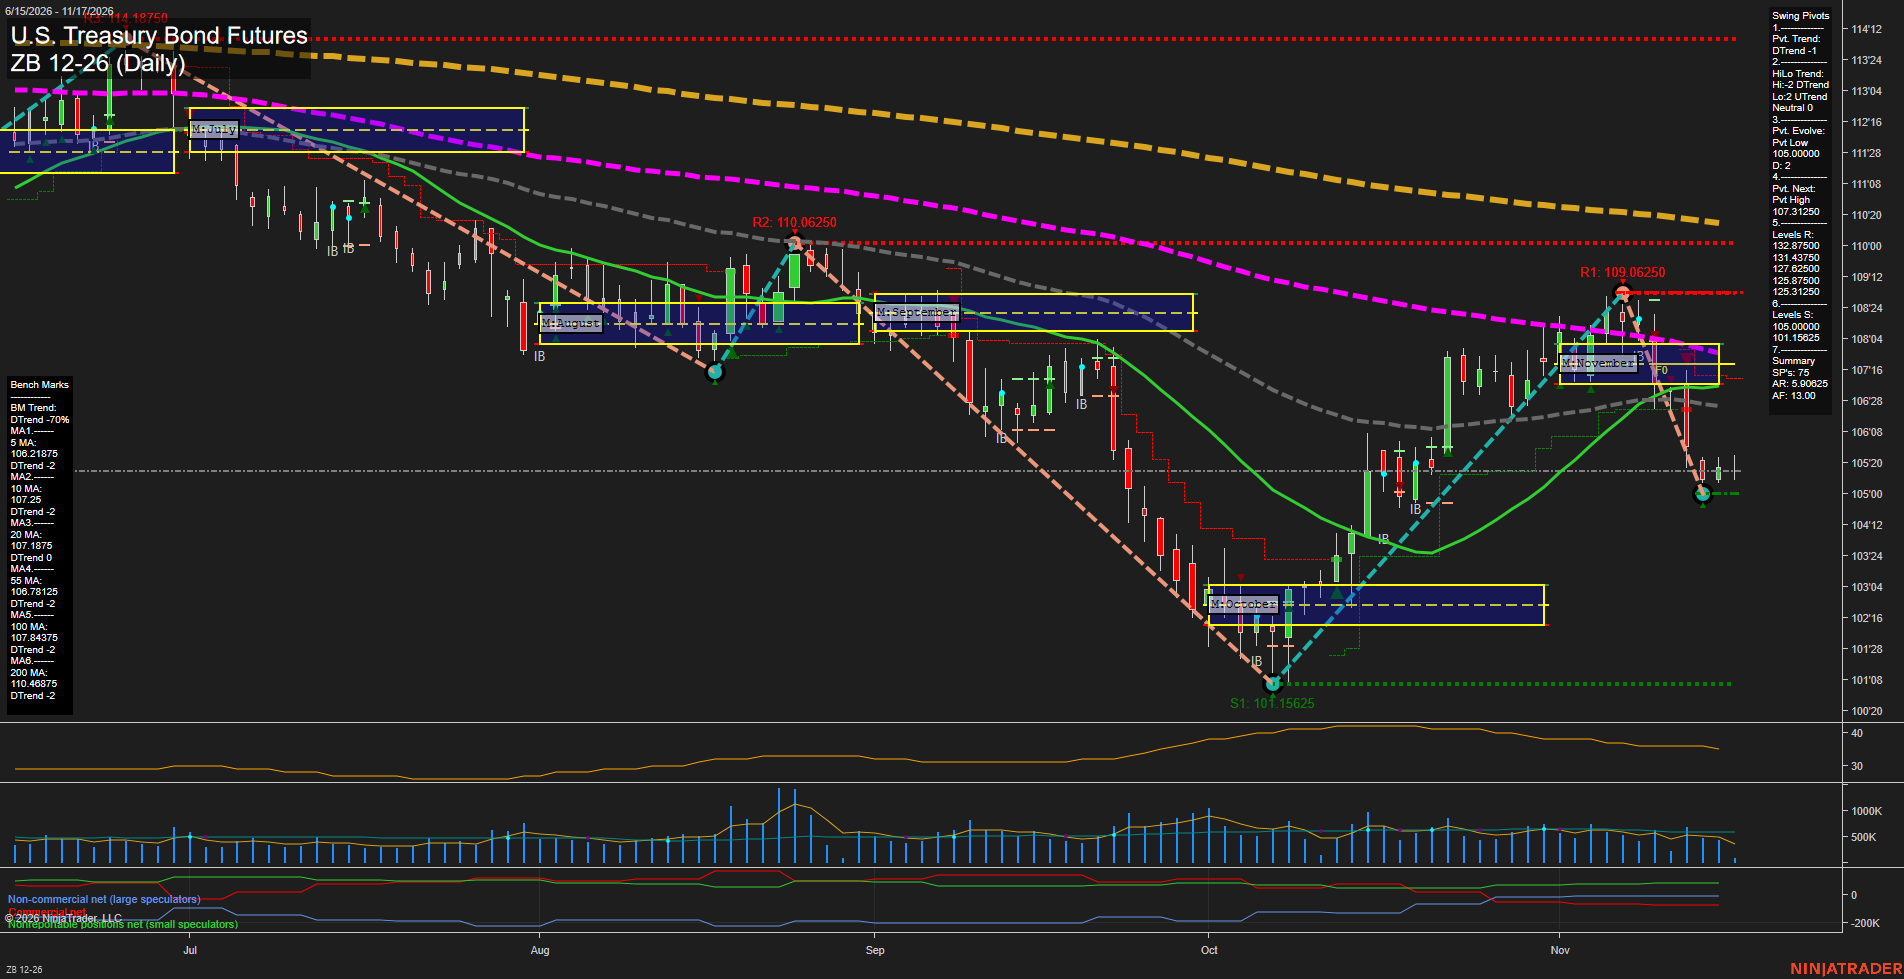
Overall Rating
- Near-Term: Bearish
- Medium-Term: Bearish
- Far-Term: Bearish.
Key Insights Summary
The October rebound from 101.15625 reached 109.06250 before reversing sharply. Recent small candles above the evolving 105.00000 pivot low indicate slowing downside momentum and tentative stabilization, rather than a confirmed bullish reversal. The positive weekly grid contrasts with the declining near-term pivot trend and falling 5- and 10-day benchmarks, making the latest bounce countertrend. Price remains below every benchmark and November's neutral zone, supporting bearish medium- and far-term readings. The mixed high/low pivot structure reflects a lower high but a higher low relative to October. Visible chart resistance stands at 109.06250 and 110.06250; the summary's listed resistance levels are substantially above the displayed trading range. ATR has eased from its October peak, consistent with contracting volatility. The named trade-signal series and news catalysts are not identifiable from this image, and seasonality alone does not establish a directional conclusion.
View charts on: AlphaWebTrader HTF Charts
Sentiment Summary: Neutral coverage led at 40%, but negative news outweighed positive 37% to 23%, reflecting Nvidia leadership and regulatory uncertainty following Jensen Huang’s November 12 resignation, tighter chip-export rules announced November 16, and caution before November 17 after-close earnings. November 17 releases showed October import prices rising 1.1%, above the 0.7% forecast, alongside Fed calls for further tightening, adding to technology-sector pressure. Strong reported AI/cloud demand and resilience in healthcare, staples and financials provided counterweights, indicating sector divergence rather than uniform weakness.
Conclusion: A fourth consecutive VIX increase underscored elevated event risk for index futures at the close.