Tech steadies ahead of Nvidia after-close earnings; Tuesday retail sales 8:30, output 9:15, $100B bills 11:30 ET; U.S. futures trends remain bearish.
Fundamentals: Tuesday’s premarket setup is cautious, with tech edging higher ahead of Nvidia earnings after the close following earlier broad futures weakness. Retail sales arrive at 8:30 ET, followed by Waller’s remarks at 9:10, industrial production at 9:15, Hammack’s remarks at 9:30, a $100B six-week bill auction at 11:30 and Williams’s remarks at 14:25 ET. Tomorrow, Wednesday, brings housing data, a $16B 20-year bond auction at 13:00 and FOMC minutes at 14:00 ET.
Technicals: U.S. stock futures enter the session with bearish near-term signals after failed rebounds, while Nasdaq futures remain below all six daily benchmarks. S&P 500, Nasdaq and Russell 2000 daily trends are bearish across time horizons, contrasting with bullish longer-term weekly structures. Dow futures are testing their rising 200-day benchmark, while Germany's DAX retains bullish medium- and far-term trends.
Pre-Market Trading 360° view Market Radar of: holidays, earnings, eco-news, market-news summary, news sentiment, prior session major ETFs, MAG7, Higher Time Frame Analysis Indices Futures Summary, and E-mini S&P500, Nasdaq 100, NYMEX Crude, Gold Futures Daily Chart analysis.
As of: November 17, 2026 07:15 CT
Earnings Radar
Monitoring for earnings releases by the Magnificent 7, AI-tech-related firms, and major financial institutions.
| Date/Day | Impact | Company / Symbol | Time | EPS | Revenue | ||||
|---|---|---|---|---|---|---|---|---|---|
| 2026-11-17 – Tuesday | High | Nvidia (NVDA) | After close |
|
|
Conclusion: NVDA’s earnings release is scheduled for after market close today, November 17, 2026; results remain ahead as of publication. Its MAG7, AI, and semiconductor relevance makes it a broad-index event; market momentum and volume can slow ahead of major earnings releases.
For full details visit: Yahoo Earnings Calendar
EcoNews Radar U.S. Events
| Date | Impact | Event, Prev, Forecast, Actual | Info |
|---|---|---|---|
| 2026-11-17 Tuesday 07:30 | Medium | Fed's Musalem speech Prev: — Forecast: — Actual: — | Remarks may clarify the policymaker’s economic outlook and policy preferences; traders monitor potential implications for interest-rate expectations and equity valuations. |
| 2026-11-17 Tuesday 08:15 | Medium | ADP Employment Change 4-week average Prev: 20K Forecast: — Actual: — | Tracks average private-sector job growth over a rolling period, helping traders assess hiring momentum and its implications for spending and monetary policy. |
| 2026-11-17 Tuesday 08:30 | High | Retail Sales ex Autos (MoM) Prev: 0.9 Forecast: 0.4 Actual: — | Measures changes in retailer receipts excluding motor vehicles, helping traders assess consumer demand with less exposure to volatile vehicle purchases. |
| 2026-11-17 Tuesday 08:30 | High | Retail Sales (MoM) Prev: 0.8 Forecast: 0.2 Actual: — | Measures changes in overall retailer receipts, providing a timely gauge of consumer demand relevant to economic growth and corporate revenue expectations. |
| 2026-11-17 Tuesday 08:30 | High | Retail Sales Control Group Prev: 0.10% Forecast: — Actual: — | Tracks a narrower spending basket used to estimate goods consumption in GDP; traders monitor it for signals about underlying consumer spending and growth. |
| 2026-11-17 Tuesday 09:10 | Medium | Fed's Waller speech Prev: — Forecast: — Actual: — | Remarks may reveal views on inflation, employment and policy settings; traders watch for signals that could reshape the expected interest-rate path. |
| 2026-11-17 Tuesday 09:15 | Medium | Industrial Production (MoM) Prev: 0.7 Forecast: 0.1 Actual: — | Measures changes in output from factories, mines and utilities; traders use it to assess goods-sector momentum and implications for cyclical earnings. |
| 2026-11-17 Tuesday 09:30 | Medium | Fed's Hammack speech Prev: — Forecast: — Actual: — | Comments can offer insight into the policymaker’s assessment of economic conditions; traders monitor any implications for monetary policy and discount rates. |
| 2026-11-17 Tuesday 11:30 | Medium | 6-Week Bill Auction · $100B Prev: — Forecast: — Actual: — | Reveals demand and clearing yields for short-term government funding; traders monitor money-market conditions and front-end interest rates. |
| 2026-11-17 Tuesday 14:25 | Medium | Fed's Williams speech Prev: — Forecast: — Actual: — | Remarks may shed light on the economic outlook and policy trade-offs; traders assess their implications for rate expectations and financial conditions. |
| 2026-11-17 Tuesday 16:30 | Low | API Weekly Crude Oil Stock Prev: 9.00M Forecast: — Actual: — | Provides an industry estimate of changes in domestic crude inventories; traders monitor the supply-demand signal for energy prices and energy-sector earnings. |
| 2026-11-18 Wednesday 08:30 | Medium | Building Permits (MoM) Prev: 1.40M Forecast: 1.38M Actual: — | Tracks authorizations for residential construction, offering a forward-looking gauge of housing activity and demand in an interest-sensitive sector. |
| 2026-11-18 Wednesday 08:30 | Medium | Housing Starts (MoM) Prev: 1.22M Forecast: 1.27M Actual: — | Measures the initiation of residential construction projects; traders monitor its implications for investment, building-material demand and broader economic momentum. |
| 2026-11-18 Wednesday 10:00 | Medium | Pending Home Sales (MoM) Prev: -7.3 Forecast: -2.1 Actual: — | Tracks signed contracts for existing-home purchases, providing an early signal of completed transactions and interest-sensitive household demand. |
| 2026-11-18 Wednesday 10:30 | Low | EIA Crude Oil Stocks Change Prev: 4.66M Forecast: — Actual: — | Reports changes in commercial crude inventories, helping traders assess petroleum supply-demand conditions and potential implications for energy costs and sector earnings. |
| 2026-11-18 Wednesday 11:30 | Medium | 17-Week Bill Auction Prev: — Forecast: — Actual: — | Shows investor demand and clearing yields for short-term Treasury financing; traders monitor signals about liquidity and front-end funding conditions. |
| 2026-11-18 Wednesday 12:15 | Medium | Fed's Daly speech Prev: — Forecast: — Actual: — | Comments may clarify the policymaker’s views on economic risks and the policy outlook; traders watch for implications for expected borrowing costs. |
| 2026-11-18 Wednesday 13:00 | High | 20-Year Bond Auction · $16B Prev: 5.46% Forecast: — Actual: — | Tests demand for long-duration government debt; traders monitor clearing yields and bidding strength for implications for long-term borrowing costs and equity discount rates. |
| 2026-11-18 Wednesday 13:35 | Medium | Fed's Barr speech Prev: — Forecast: — Actual: — | Remarks may address monetary policy, financial stability or banking conditions; traders monitor any implications for rates and financial-sector risk. |
| 2026-11-18 Wednesday 14:00 | High | FOMC Minutes Prev: — Forecast: — Actual: — | Details policymakers’ deliberations at the prior meeting, revealing areas of agreement, uncertainty and risk that traders use to assess the policy outlook. |
| 2026-11-18 Wednesday 14:30 | Medium | Fed's Williams speech Prev: — Forecast: — Actual: — | Comments may refine the policymaker’s outlook on growth, inflation and policy; traders monitor changes in emphasis relevant to interest-rate expectations. |
| 2026-11-18 Wednesday 16:15 | Medium | Fed's Kashkari speech Prev: — Forecast: — Actual: — | Remarks provide insight into the policymaker’s assessment of inflation and employment risks; traders watch for implications for the expected policy path. |
| 2026-11-19 Thursday 08:30 | Medium | Philadelphia Fed Manufacturing Survey Prev: 20.9 Forecast: 19.2 Actual: — | Surveys regional manufacturers about business conditions, including orders, employment and prices; traders use it as an early signal of factory-sector momentum. |
| 2026-11-19 Thursday 08:30 | Medium | Initial Jobless Claims Prev: 200K Forecast: 196K Actual: — | Counts new applications for unemployment benefits, offering a timely gauge of layoffs that informs assessments of labor demand, growth and monetary policy. |
| 2026-11-19 Thursday 11:30 | Medium | 4-Week Bill Auction Prev: 3.955% Forecast: — Actual: — | Reveals demand and clearing yields at the shortest end of Treasury issuance; traders monitor cash-market conditions and near-term interest rates. |
| 2026-11-19 Thursday 11:30 | Medium | 8-Week Bill Auction Prev: — Forecast: — Actual: — | Gauges investor appetite for short-term government debt; traders watch auction pricing and demand for signals about front-end rates and liquidity. |
| 2026-11-19 Thursday 12:30 | Medium | Fed's Goolsbee speech Prev: — Forecast: — Actual: — | Comments may illuminate the policymaker’s economic assessment and policy preferences; traders monitor signals relevant to the interest-rate outlook. |
| 2026-11-19 Thursday 13:00 | High | 10-Year TIPS Auction · $19B Prev: 2.653% Forecast: — Actual: — | Tests demand for inflation-protected government debt and establishes a real yield; traders monitor implications for real discount rates and market-based inflation compensation. |
| 2026-11-19 Thursday 14:15 | Medium | Fed's Barr speech Prev: — Forecast: — Actual: — | Remarks may offer perspectives on policy or banking-system conditions; traders assess any implications for financial stability, credit availability and interest rates. |
| 2026-11-19 Thursday 18:30 | Medium | Fed's Paulson speech Prev: — Forecast: — Actual: — | Comments may reveal the policymaker’s assessment of economic conditions and policy risks; traders monitor any implications for the expected interest-rate path. |
| 2026-11-20 Friday 08:25 | Medium | Fed's Waller speech Prev: — Forecast: — Actual: — | Remarks may clarify views on inflation progress and labor-market conditions; traders assess their implications for monetary-policy expectations and equity valuations. |
| 2026-11-20 Friday 10:00 | Medium | Michigan Consumer Sentiment Index Prev: 51 Forecast: 52 Actual: — | Gauges households’ assessments of personal finances and economic conditions; traders monitor confidence as a potential signal of consumer spending. |
| 2026-11-20 Friday 10:00 | Medium | UoM 1-year Consumer Inflation Expectations Prev: 4.3 Forecast: 4.3 Actual: — | Measures households’ near-term expected price growth; traders watch for signs of inflation persistence that could influence wage demands and monetary-policy assessments. |
| 2026-11-20 Friday 10:00 | Medium | Michigan Consumer Expectations Index Prev: 50.9 Forecast: 50.9 Actual: — | Measures households’ outlook for personal finances and business conditions; traders use it to assess prospective consumer demand and perceived economic risks. |
| 2026-11-20 Friday 10:00 | Medium | UoM 5-year Consumer Inflation Expectation Prev: 3.4 Forecast: 3.4 Actual: — | Gauges households’ longer-run expected price growth; traders monitor whether inflation expectations remain anchored, a key consideration for monetary-policy credibility. |
| 2026-11-20 Friday 12:15 | Medium | Fed's Cook speech Prev: — Forecast: — Actual: — | Comments may shed light on the policymaker’s economic outlook and policy priorities; traders watch for implications for rates and broader financial conditions. |
Summary: The calendar centers on U.S. demand and monetary-policy expectations, alongside labor, housing, production and Treasury financing indicators.
Conclusion: Higher-impact releases are concentrated from Tuesday through Thursday.
NYSE Session Open Gap Radar
Session gaps compare the predicted opening price with the prior session’s close to predict the upcoming session’s opening gap pattern.
| Instrument | Gap | Prior Close | Predicted Open | Gap % |
|---|---|---|---|---|
| QQQ | ▼ IGU | 661.75 | 664.75 | ▲ +0.45% |
| GLD | ▼ IGU | 352.93 | 353.43 | ▲ +0.14% |
| TLT | ▼ IGU | 79.38 | 79.48 | ▲ +0.13% |
| SPY | ▼ IGU | 739.95 | 740.05 | ▲ +0.01% |
| IJH | ▲ IGD | 72.70 | 72.52 | ▼ -0.25% |
| IWM | ▲ IGD | 272.94 | 272.13 | ▼ -0.30% |
| USO | ▲ IGD | 140.03 | 139.30 | ▼ -0.52% |
| DIA | ▼ OGD | 515.68 | 512.78 | ▼ -0.56% |
Before the session opens, the table shows the predicted opening price and gap. Once the session opens, it uses the recorded opening price.
Glossary: IGU — Inside Gap Up: above the prior close, within the prior session’s range. IGD — Inside Gap Down: below the prior close, within that range. OGU — Outside Gap Up: above the prior session’s high. OGD — Outside Gap Down: below the prior session’s low.
As of: 2026-11-17 07:15 CT. Predicted gaps are best estimates as of publication and may change before the regular-session open, particularly when the session is still some time away.
Market News Summary:
Nvidia earnings, technology-sector selling and hawkish Fed commentary dominate the November 17 premarket news.
Primary Drivers & Risks:
- Primary Driver: Nvidia earnings and technology-sector repositioning
- Primary Risk: Leadership uncertainty and renewed rate-hike pressure
Tone:
Cautious overall, with some easing in technology selling ahead of earnings.
Data, Market and System
Geopolitical:
- The Commerce Department is moving to tighten chip-export restrictions amid scrutiny of a China-related loophole.
- Nvidia’s board established a committee overseeing national security policies and export controls.
Oil / Energy:
- Amazon announced a $7 billion renewable-energy investment in India.
- Google signed a 50-megawatt geothermal power purchase agreement with Quaise Energy for a Central Oregon project supporting data centers and nearby communities.
- Indian companies have arrangements to buy US LPG in 2027 from Aramco, Chevron, Vitol and Totsa.
Fed / Financials:
- Fed official Musalem said several rate increases by spring are needed to control inflation.
- Warsh said the Fed is examining how AI reshapes the economy.
- Fund managers became less bearish on bonds as they reduced megacap technology exposure.
Macro / Other:
- Fresh consumer-spending figures are on investors’ agenda alongside Nvidia earnings.
Conclusion:
Nvidia’s earnings and leadership transition are the central focus for the AI trade and technology-heavy indices. Broad futures weakness accompanied substantial reductions in technology allocations, although later coverage reported some premarket improvement in tech.
Musalem’s rate-hike comments and tighter chip-export scrutiny add monetary-policy and regulatory risks. Consumer-spending figures provide a separate macroeconomic focus.
Market News Sentiment
Sentiment Bias shows the balance of positive and negative news coverage sampled from 2026-11-16 08:16 to 2026-11-17 07:46 ET, covering stocks, energy and gold.
▼ Market news
- Bias
- ▼ -16.60%
- Articles
- 259
- Positive
- ▲ 20.46%
- Neutral
- — 42.47%
- Negative
- ▼ 37.07%
▼ GLD / Gold
- Bias
- ▼ -28.57%
- Articles
- 14
- Positive
- ▲ 28.57%
- Neutral
- — 14.29%
- Negative
- ▼ 57.14%
Sentiment Summary: Gold coverage was 57% negative versus 29% positive, with reports linking losses on November 16 and stabilization near year-plus lows on November 17 to dollar strength, elevated yields and Fed hike expectations. Monday’s technology-led equity selloff also pressured metals, while weaker Empire State manufacturing data failed to generate safe-haven demand. The main counterweight was tentative price stabilization and analysts’ longer-term bullish views, including potential rotation from technology into precious metals; those views did not establish a current recovery.
Conclusion: For indices futures, the supported context is simultaneous technology and metals weakness ahead of Fed minutes scheduled for November 18.
▼ USO / Oil
- Bias
- ▼ -68.75%
- Articles
- 16
- Positive
- ▲ 12.50%
- Neutral
- — 6.25%
- Negative
- ▼ 81.25%
Sentiment Summary: Oil coverage was 81% negative as recovering Middle East exports and surplus expectations drove crude lower on November 16–17; Saudi Arabia reported October output of 10.5 million barrels daily, and Iraq announced resumed pipeline exports through Turkey on November 17. Persistent Hormuz disruption and renewed conflict concerns counterbalanced improving supply, while U.S. signals against a prolonged Iran war and Tehran’s openness to diplomacy provided reassurance. Separately, November 16 coverage reported a stronger dollar and Treasury-yield pressure on equities amid hawkish Fed expectations.
Conclusion: Falling crude accompanied continued geopolitical risk and reported rate-related pressure on equities, rather than broad market relief.
Glossary: Sentiment Bias = (positive articles − negative articles) ÷ total articles × 100. It ranges from −100% negative to +100% positive. A reading near zero indicates little directional bias. Neutral articles reduce the score’s strength. ▲ positive; ▼ negative; — balanced. These readings describe news coverage, not market-price direction.
Market Technical Analysis
Analysis of VIX volatility, prior-session major ETFs and mega-cap tech stocks, and real-time futures snapshots and higher-time-frame analysis.
VIX — Market Fear Gauge Daily
| Level | Open | High | MaxVix | Low | MinVix | DNC% | DOC% | VR | MaxVR | MinVR |
|---|---|---|---|---|---|---|---|---|---|---|
| 22.90 | 20.87 | 24.52 | 28.36 | 20.43 | 16.21 | +11.76% | +9.73% | 6.15 | 56.57 | -6.27 |
VIX rose 9.73% from the session's opening level. VIX rose 11.76% versus the previous session close. Expected volatility rose from the period open. VIX is 55.1% up the recent 15-session range (16.21–28.36), in the 50–60% band.
VR: ATN Volatility Ratio (VR): 6.15 – Stocks fell while expected volatility rose. VR is in the lower part of its preceding 15-session VR range (-6.27 to 56.57), in the 10–20% band. VR fell 20.20 points from the previous session, a large shift relative to that range.
Range lookback: preceding 15 completed sessions.
Major ETFs and Mega Cap Tech Stocks
- Dow Jones, S&P 500 and Nasdaq 100 futures were each down approximately 0.4% in an earlier premarket report following a sharp technology-led sell-off.
- Later coverage described technology stocks edging higher ahead of the open.
- Nvidia reports third-quarter earnings after the close on November 17, with interim chief executive Colette Kress leading the call following Jensen Huang’s departure.
- Nvidia has lost $2 trillion in market value from its peak, and options pricing indicates a larger-than-usual earnings-related move.
- Fund managers reduced technology allocations at the fastest pace since 2006 while retaining very low cash positions.
- Alphabet shares have fallen amid pressure on AI-stock valuations.
- Apple faces a Paris trial in June 2027 over allegations that restrictions on independent repairs constituted planned obsolescence.
- S&P 500 quarterly dividend projections from the fourth quarter of 2026 through the fourth quarter of 2027 declined from their month-earlier levels.
ETF, Mag7, and Cross-Market ETF prior day Insights
Overall Tone
The completed daily session on 2026-11-16 was risk-off: equities broadly fell from the open and versus the prior close.
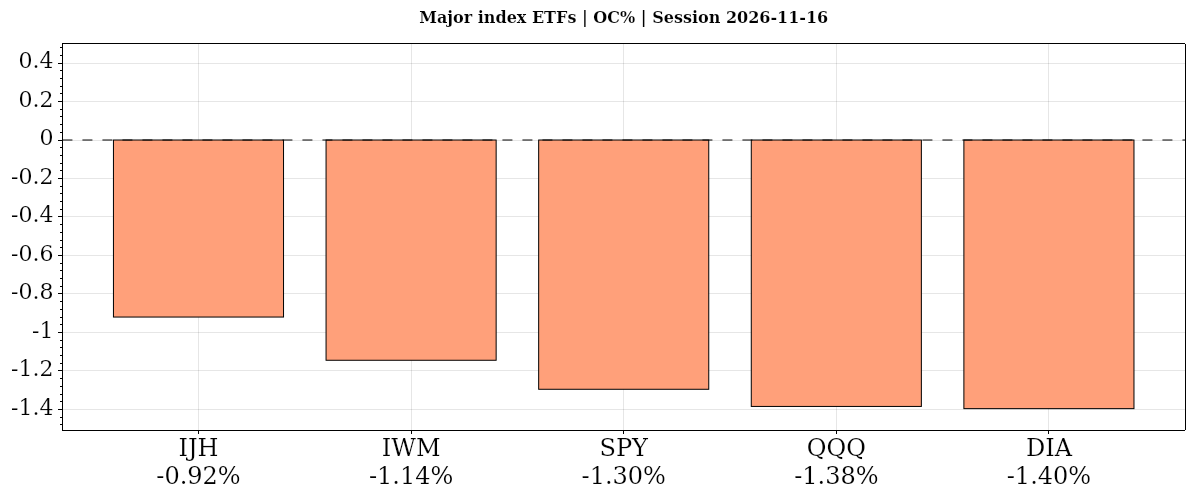
| Instrument | Bias | Date | DNC% | DOC% | O | H | L | C | VWAP | Vol |
|---|---|---|---|---|---|---|---|---|---|---|
| ▼ IJH | ▼ ▼ ▼ | 2026-11-16 | ▼ -1.44% | ▼ -0.92% | 73.38 | 73.46 | 72.50 | 72.70 | ▼ 72.86 | 7,619,206 |
| ▼ IWM | ▼ ▼ ▼ | 2026-11-16 | ▼ -1.66% | ▼ -1.14% | 276.10 | 276.54 | 271.97 | 272.94 | ▼ 273.64 | 25,490,580 |
| ▼ SPY | ▼ ▼ ▼ | 2026-11-16 | ▼ -1.91% | ▼ -1.30% | 749.66 | 749.82 | 738.07 | 739.95 | ▼ 742.18 | 67,391,273 |
| ▼ QQQ | ▼ ▼ ▼ | 2026-11-16 | ▼ -2.67% | ▼ -1.38% | 671.04 | 672.15 | 660.48 | 661.75 | ▼ 664.81 | 41,875,129 |
| ▼ DIA | ▼ ▼ ▼ | 2026-11-16 | ▼ -1.43% | ▼ -1.40% | 522.98 | 523.09 | 514.70 | 515.68 | ▼ 517.93 | 3,382,712 |
| AVG/Sum | — | — | -1.82% | -1.23% | — | — | — | — | — | 145,758,900 |
Index ETFs
Negative confluence: average DOC% -1.23% from the open; DNC% -1.82% versus the prior close. All five index ETFs declined on both measures: IJH led from the open, DIA lagged, while DIA was most resilient versus the prior close and QQQ weakest. SPY fell on above-average volume; QQQ’s moving-average downtrends remained aligned.
IJH · D:2026-11-16 NC% ▼ -1.44% OC% ▼ -0.92%
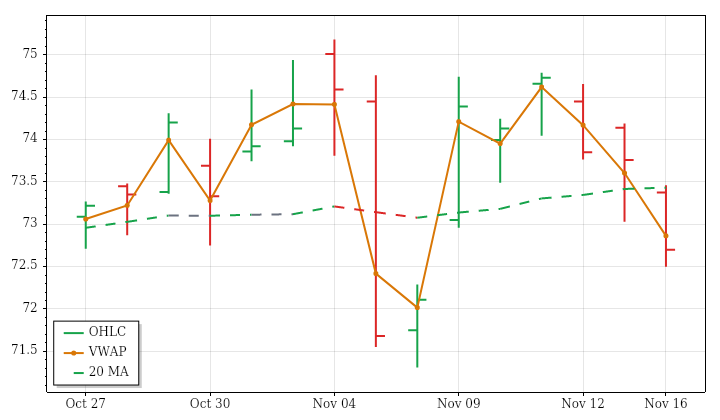
IJH – Mid Cap Technicals Summary
IJH's completed daily session on November 16 ended at 72.70, down 1.44% from the prior close and 0.92% from the open. The initial gap down remained unfilled. Although price traded on both sides of the open, a lower high and lower low led to a close beneath the prior day's low, near the session low and below VWAP.
The latest weakness contrasted with the modest upward price trend over the preceding 15 sessions. Near- and far-term averages still rose, but price stood below both, while the intermediate-term structure was outright bearish. That combination leaves the broader picture conflicted rather than aligned. The session's range and volume were below average, opposing recent trends toward expanding ranges and increasing participation. PSAR and the ATR-median measure retained upward states despite the weak finish; a next-session low below 71.8063 would conditionally reverse PSAR bearishly.
IWM · D:2026-11-16 NC% ▼ -1.66% OC% ▼ -1.14%
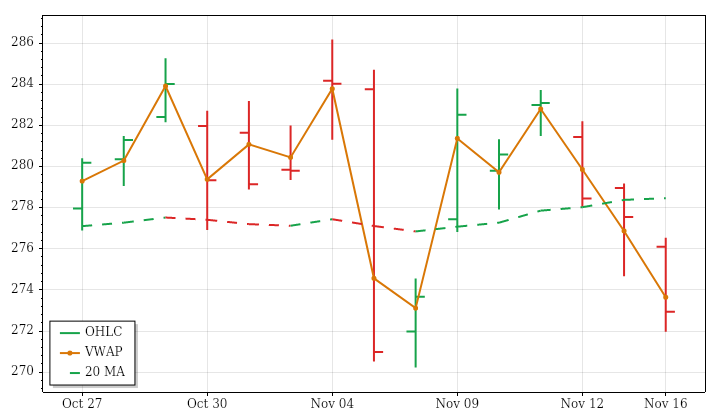
IWM – Small Cap Technicals Summary
IWM's completed daily session on November 16 closed at 272.94, declining 1.66% from the prior close and 1.14% from the open. The opening gap down was not filled, and the session recorded a lower high and lower low before finishing below the previous day's low and beneath VWAP. The weakness therefore extended beyond the opening adjustment into the trading session itself.
Price remained below a still-rising near-term average, leaving that horizon mixed, while intermediate- and far-term averages were falling above the close. The broader bearish alignment was stronger than the short-term average's residual upward direction suggested. Over the prior 15 sessions, directional efficiency was very low, indicating substantial back-and-forth movement with little net progress. The latest range was approximately average and volume modestly elevated, against rising range and volume trends. A next-session high above 281.1569 would conditionally reverse bearish PSAR.
SPY · D:2026-11-16 NC% ▼ -1.91% OC% ▼ -1.30%
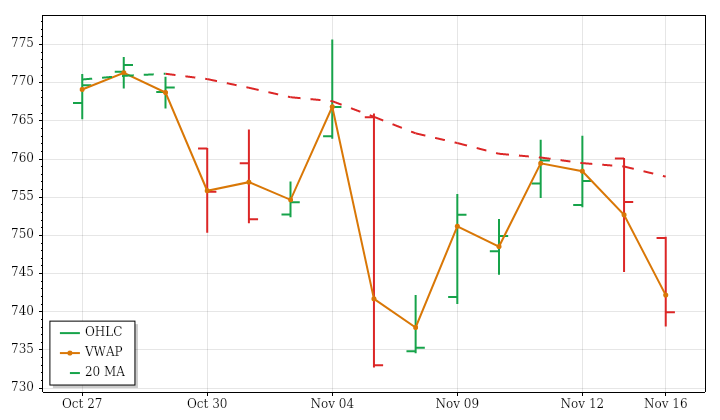
SPY – S&P 500 Technicals Summary
SPY's completed daily session on November 16 closed at 739.95, down 1.91% from the prior close and 1.30% from the open. The opening gap down remained unfilled, and subsequent trading produced a lower high and lower low. The finish below the prior day's low, near the daily low and beneath VWAP gave the session a consistently weak closing profile.
Near- and intermediate-term averages were falling above price. The far-term average still rose, but the close was below it, leaving that horizon mixed rather than confirming an across-the-board downtrend. The latest range exceeded average and volume was about 36% above average, both consistent with expanding movement and increasing participation over the prior 15 sessions. Despite that activity, the lookback's directional efficiency remained low. PSAR and the ATR-median measure were bearish; a next-session high above 762.6896 would conditionally trigger a bullish PSAR reversal.
S&P 500 News and Fundamentals
The S&P 500 fell off pace for a fourth consecutive year of double-digit gains as Nvidia turmoil weighed on the AI trade and broader index. Apple has contributed 124 index points this year, while Nvidia has subtracted 77. Separately, the index’s forward price-to-earnings ratio reached its lowest level since November 2023 this month, while stronger-than-expected corporate earnings pushed analysts’ earnings expectations higher.
QQQ · D:2026-11-16 NC% ▼ -2.67% OC% ▼ -1.38%
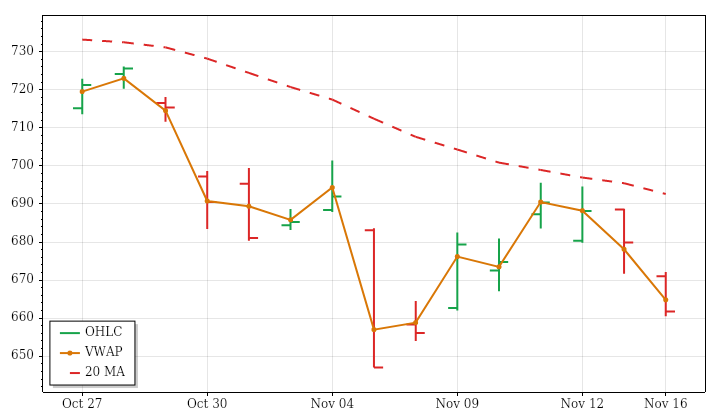
QQQ – Nasdaq 100 Technicals Summary
QQQ's completed daily session on November 16 ended at 661.75, down 2.67% from the prior close and 1.38% from the open. An opening gap down remained unfilled, followed by additional intraday weakness. The session produced a lower high and lower low, with the close below the previous day's low, near the daily low and beneath VWAP.
Near-, intermediate- and far-term averages were all falling above price, so the latest decline aligned with the broader trend structure. The ATR-median measure also remained bearish, although PSAR still held an upward state, showing that not every indicator agreed. A next-session low below 653.9702 would conditionally reverse PSAR bearishly. Both range and volume were below their prior 15-session averages, contrasting with expanding ranges and increasing volume across that lookback. Thus, the weak price outcome occurred on a quieter session than the recent baseline.
DIA · D:2026-11-16 NC% ▼ -1.43% OC% ▼ -1.40%
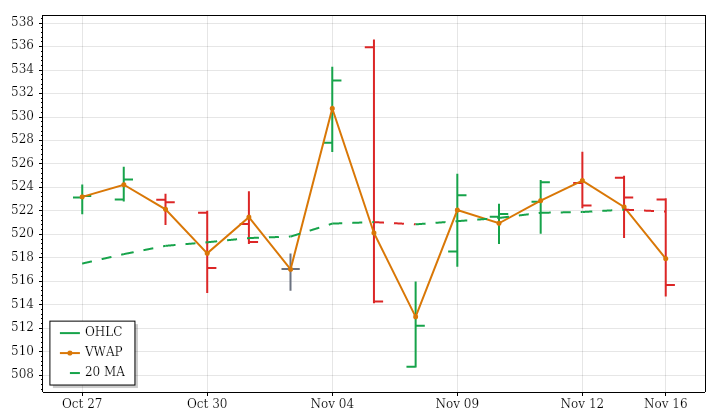
DIA – Dow Jones Technicals Summary
DIA's completed daily session on November 16 closed at 515.68, down 1.43% from the prior close and 1.40% from the open. With little opening displacement, most of the loss developed during the session. A lower high and lower low culminated in a finish below the previous day's low, near the daily low and below VWAP, giving the day's enlarged range a distinctly negative outcome.
Near-term weakness aligned with a falling short-horizon average. The intermediate and far-term pictures were mixed: their averages still rose, but price finished below both, sitting almost exactly beneath the far-term benchmark. The 15-session price path had made very little net directional progress despite substantial movement. The latest range was about 40% above average, consistent with ongoing expansion, while volume was below average. A next-session high above 525.211 would conditionally reverse the bearish PSAR state.
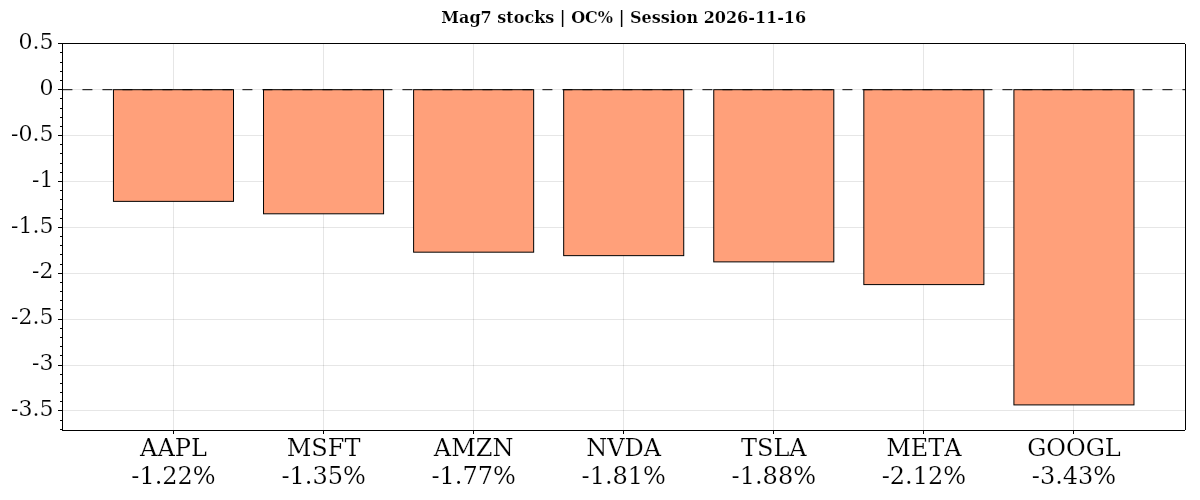
| Instrument | Bias | Date | DNC% | DOC% | O | H | L | C | VWAP | Vol |
|---|---|---|---|---|---|---|---|---|---|---|
| ▼ AAPL | ▼ ▼ ▼ | 2026-11-16 | ▼ -0.98% | ▼ -1.22% | 357.12 | 357.12 | 351.31 | 352.78 | ▼ 353.25 | 44,937,302 |
| ▼ MSFT | ▼ ▼ ▼ | 2026-11-16 | ▼ -1.12% | ▼ -1.35% | 525.09 | 527.95 | 516.82 | 517.99 | ▼ 519.91 | 29,816,092 |
| ▼ AMZN | ▼ ▼ ▼ | 2026-11-16 | ▼ -3.34% | ▼ -1.77% | 262.39 | 262.92 | 256.68 | 257.75 | ▼ 259.22 | 47,383,931 |
| ▼ NVDA | ▼ ▼ ▼ | 2026-11-16 | ▼ -4.12% | ▼ -1.81% | 159.01 | 163.20 | 155.01 | 156.14 | ▼ 157.80 | 328,454,049 |
| ▼ TSLA | ▼ ▼ ▼ | 2026-11-16 | ▼ -2.69% | ▼ -1.88% | 387.00 | 389.80 | 375.63 | 379.74 | ▼ 379.95 | 29,935,704 |
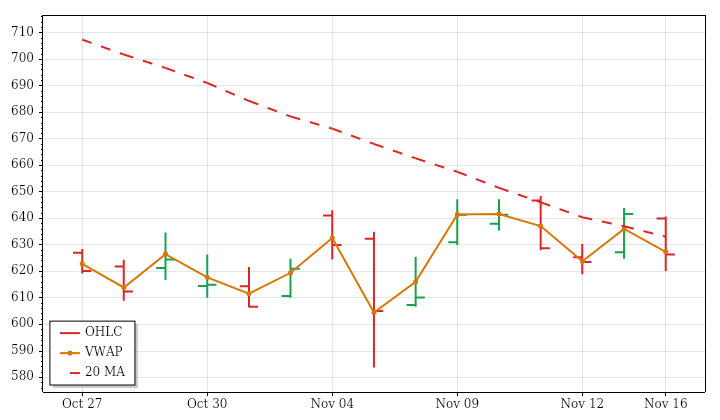
| ▼ META | ▼ ▼ ▼ | 2026-11-16 | ▼ -2.38% | ▼ -2.12% | 640.00 | 640.70 | 620.14 | 626.41 | ▼ 627.42 | 11,517,158 |
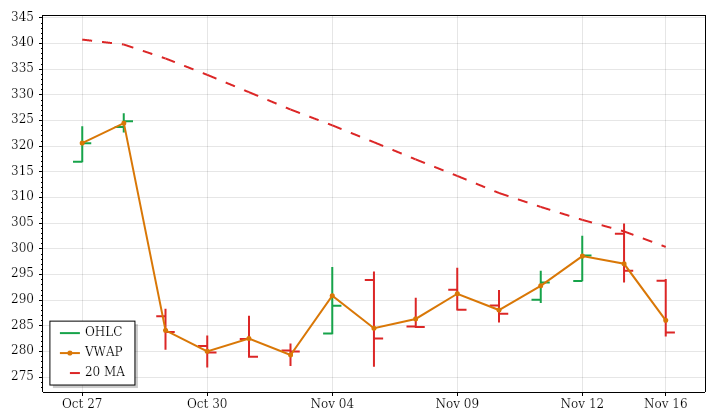
| ▼ GOOGL | ▼ ▼ ▼ | 2026-11-16 | ▼ -4.07% | ▼ -3.43% | 293.81 | 294.14 | 282.96 | 283.72 | ▼ 286.09 | 34,208,077 |
| AVG/Sum | — | — | -2.67% | -1.94% | — | — | — | — | — | 526,252,313 |
Mag7 Stocks
Negative confluence: average DOC% -1.94% from the open; DNC% -2.67% versus the prior close. All seven declined on both measures: Apple led from the open and Alphabet lagged; Apple was most resilient versus the prior close, while Nvidia was weakest. Apple retained rising moving-average structures, unlike Nvidia’s aligned downtrends.
AAPL · D:2026-11-16 NC% ▼ -0.98% OC% ▼ -1.22%
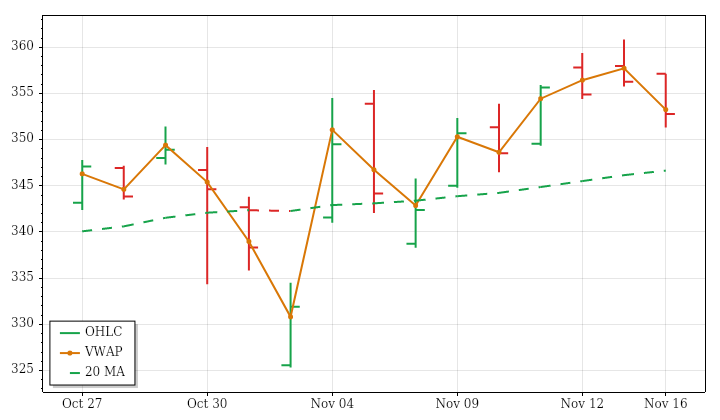
AAPL – Apple Technicals Summary
AAPL's completed daily session on November 16 closed at 352.78, down 0.98% from the prior close and 1.22% from the open. A small opening gain was erased, and the session produced a lower high and lower low before finishing below the previous day's low and near its own low. The close also sat below session VWAP, reinforcing the weak intraday finish.
That decline contrasted with rising near-, intermediate- and far-term moving-average structures, with price still above all three benchmarks. The broader uptrend therefore remained intact despite the latest setback, although low directional efficiency shows that recent progress has been uneven. Both the day's range and volume were below their prior 15-session averages, consistent with contracting ranges and declining participation over that window. PSAR remained in an upward state; a next-session low below 347.5646 would conditionally trigger a bearish reversal.
Apple News and Fundamentals
Apple announced new Mac security controls on November 16 designed to protect user data as AI agents increasingly seek full disk access. Bloomberg reported that 26-year Apple veteran Corey Fugman will lead Apple Pay and Wallet, succeeding Jennifer Bailey, who is retiring but will consult in the coming months. Apple was also scheduled to pay its final dividend of 2026 on November 16.
MSFT · D:2026-11-16 NC% ▼ -1.12% OC% ▼ -1.35%
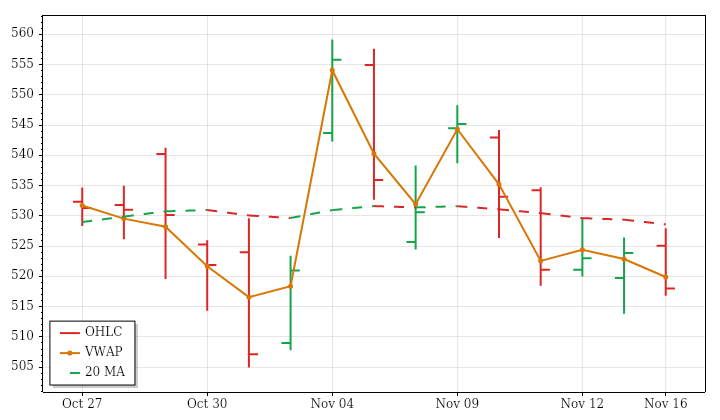
MSFT – Microsoft Technicals Summary
MSFT's completed daily session on November 16 closed at 517.99, down 1.12% from the prior close and 1.35% from the open. An opening gain was erased, and the close finished near the session low and below VWAP. Nevertheless, the day's high and low were both above the previous day's, and the finish remained within that earlier range, making the structure less uniformly negative than the closing return alone.
Near- and intermediate-term averages continued rising, but price was below both, creating mixed shorter-horizon conditions. The far-term structure remained clearly upward, with price above its rising benchmark. Recent directional efficiency was extremely low, reflecting a largely back-and-forth lookback. The daily range was below average despite recent expansion, while volume was approximately average against a declining trend. Both PSAR and the ATR-median measure had shifted bearish; a next-session high above 556.8835 would conditionally reverse PSAR upward.
Microsoft News and Fundamentals
Azure grew 48% despite capacity constraints, while Microsoft’s December-quarter guidance called for 49%–50% growth in constant currency. Free cash flow fell 27% as capital expenditure more than doubled, with infrastructure spending and depreciation posing risks to margins and cash conversion. Microsoft is positioning Copilot as a new operating system for work, a theme expected at its Ignite conference. Copilot has more than 30 million seats alongside over 450 million paid commercial seats.
AMZN · D:2026-11-16 NC% ▼ -3.34% OC% ▼ -1.77%
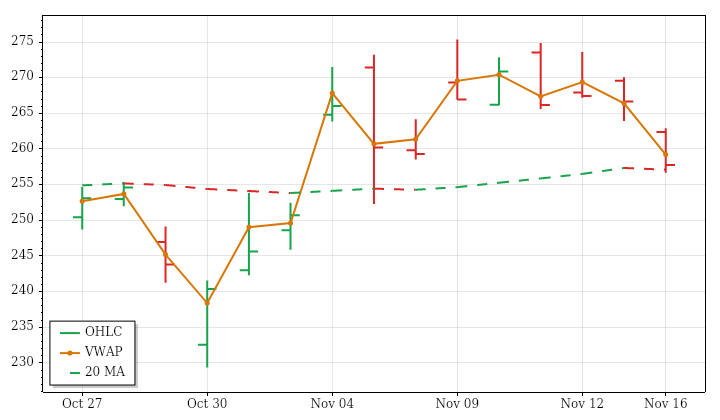
AMZN – Amazon Technicals Summary
AMZN's completed daily session on November 16 ended at 257.75, falling 3.34% from the prior close and 1.77% from the open. The opening gap down remained unfilled, and further selling left the close below the previous day's low, near the session low and beneath VWAP. This was weakness both between sessions and during the trading day, rather than a gap-only decline.
The setback pushed price below its still-rising near-term benchmark, creating a conflict between position and direction. Intermediate- and far-term averages remained rising with price above them, so the longer-horizon structure was stronger than the immediate picture. The day's range was below average despite an expanding 15-session range trend, while below-average volume matched the declining participation trend. PSAR was in a short state; only a next-session high above 275.34 would meet its conditional bullish reversal threshold.
Amazon News and Fundamentals
A Vulcan rocket failure destroyed 40 Amazon Leo satellites, creating potential delays and additional costs. Amazon purchased 38 Vulcan launches for a constellation requiring more than 3,300 satellites; a prolonged interruption could postpone revenue opportunities. AWS growth accelerated to 39%, with management expecting growth above 40% in 2027 and 2028. Lower-margin AI revenue and aggressive infrastructure spending were identified as risks to profitability and free cash flow.
NVDA · D:2026-11-16 NC% ▼ -4.12% OC% ▼ -1.81%
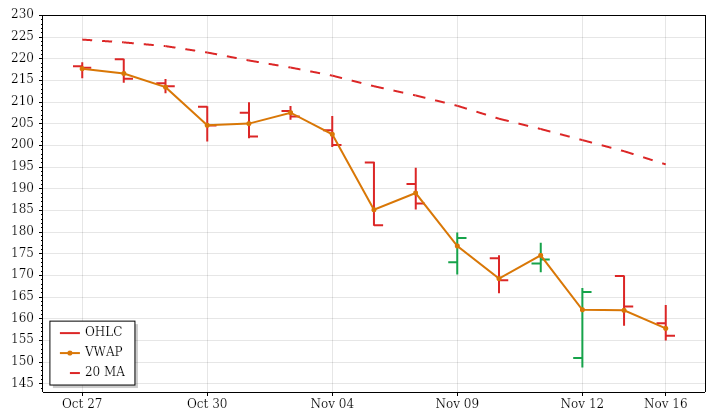
NVDA – Nvidia Technicals Summary
NVDA's completed daily session on November 16 closed at 156.14, losing 4.12% from the prior close and 1.81% from the open. The opening gap down was filled intraday, but the recovery failed to hold. A lower high and lower low ended with price below the previous day's low, near the daily low and beneath session VWAP.
That finish reinforced aligned near-, intermediate- and far-term downtrends, with price below all three falling benchmarks. The prior 15-session decline was relatively directional compared with the total back-and-forth movement, and both PSAR and the ATR-median measure remained bearish. Although the latest daily range was approximately average, it occurred within a strongly expanding range trend. Volume was about one-third above average, consistent with increasing participation rather than a quiet pullback. A next-session high above 170 would conditionally trigger a bullish PSAR reversal, not establish one in advance.
Nvidia News and Fundamentals
Reports said Jensen Huang resigned amid a scandal involving extramarital affairs and possible Chinese espionage. An employee letter warned Nvidia’s board of irreplaceable talent losses and urged his reinstatement; Bill Ackman also voiced support. Treasury Secretary Scott Bessent reportedly questioned whether inappropriate China sales inflated revenue and earnings and called for outside leadership. These allegations remain reported concerns, not established findings. Nvidia’s earnings release was described as days away.
TSLA · D:2026-11-16 NC% ▼ -2.69% OC% ▼ -1.88%
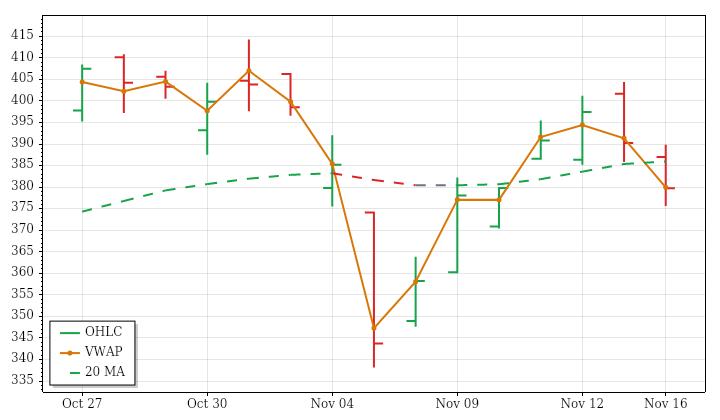
TSLA – Tesla Technicals Summary
TSLA's completed daily session on November 16 finished at 379.74, down 2.69% from the prior close and 1.88% from the open. The opening gap down remained unfilled, and a lower high and lower low culminated in a close beneath the previous day's low. Price ended only slightly below VWAP, so the negative daily return was more pronounced than its separation from the session's volume-weighted average.
The near-term structure was bearish, while the intermediate and far-term pictures were mixed for different reasons. Price sat just below a rising intermediate average but above a falling far-term average. PSAR and the ATR-median measure retained upward states, adding to the lack of agreement across horizons. Range and volume were below average; the smaller range opposed recent expansion, while lighter volume matched its declining trend. A next-session low below 356.1312 would conditionally reverse PSAR bearishly.
Tesla News and Fundamentals
Tesla plans to invest €3 billion, approximately $3.3 billion, in an additional production facility at its Berlin-Brandenburg factory. Cybercab production there is targeted to begin in 2029, eventually reaching one million vehicles annually. Separately, reported Cybercab ownership terms allow Tesla to buy back a vehicle at any time and remotely disable it if an owner attempts to resell it.
META · D:2026-11-16 NC% ▼ -2.38% OC% ▼ -2.12%
META – Meta Platforms Technicals Summary
META's completed daily session on November 16 finished at 626.41, down 2.38% from the prior close and 2.12% from the open. Most of the loss occurred after trading began. The session made a lower high and lower low and closed below VWAP, although the finish remained inside the previous day's range. It was the second consecutive large-range bar, consistent with the recent expansion in daily movement.
Near- and intermediate-term averages were falling, with price beneath them. The far-term average still rose, but price was below it as well, leaving that horizon mixed. The slightly upward 15-session price trend offered little evidence of smooth progress because directional efficiency was exceptionally low. Volume was less than half its average, extending the declining participation trend despite the larger range. PSAR remained upward; a next-session low below 614.4713 would conditionally trigger a bearish reversal.
Meta News and Fundamentals
Meta shares fell about 2.4% on November 16, extending a multiweek decline and bringing their roughly one-month loss to 12%. The reported concerns centered on Meta’s rising debt load and questions about the sustainability of the artificial intelligence boom.
GOOGL · D:2026-11-16 NC% ▼ -4.07% OC% ▼ -3.43%
GOOGL – Alphabet Technicals Summary
GOOGL's completed daily session on November 16 closed at 283.72, losing 4.07% from the prior close and 3.43% from the open. The opening gap down remained unfilled, and the session extended lower to finish beneath the previous day's low, near its own low and below VWAP. This was the third consecutive large-range bar, reinforcing the recent pattern of expanding daily movement.
Near-, intermediate- and far-term moving-average trends were all falling, with price below their benchmarks. However, the indicators were not unanimous: PSAR retained an upward state and the ATR-median measure crossed bullishly during the bar, conflicting with the broader price structure. The close was near the PSAR threshold; a next-session low below 282.96 would conditionally reverse that indicator bearishly. Volume was only about 73% of average, matching its declining 15-session trend despite the enlarged downside range.
| Instrument | Bias | Date | DNC% | DOC% | O | H | L | C | VWAP | Vol |
|---|---|---|---|---|---|---|---|---|---|---|
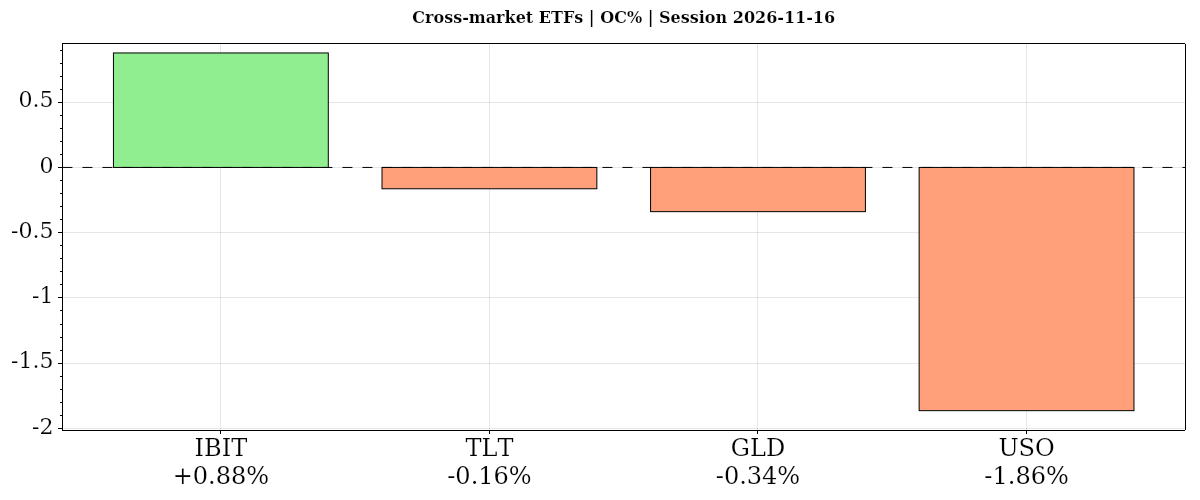
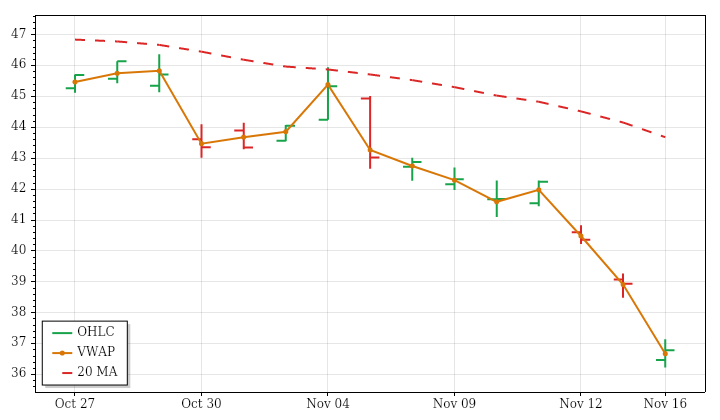
| ▲ IBIT | ▼ ▲ ▲ | 2026-11-16 | ▼ -5.52% | ▲ +0.88% | 36.47 | 37.14 | 36.23 | 36.79 | ▲ 36.67 | 60,945,014 |
| ▼ TLT | ― ▼ ▼ | 2026-11-16 | ― 0.00% | ▼ -0.16% | 79.51 | 79.75 | 79.28 | 79.38 | ▼ 79.48 | 30,903,571 |
| ▼ GLD | ▼ ▼ ▼ | 2026-11-16 | ▼ -0.71% | ▼ -0.34% | 354.13 | 356.29 | 351.96 | 352.93 | ▼ 353.74 | 9,687,003 |
| ▼ USO | ▼ ▼ ▼ | 2026-11-16 | ▼ -3.81% | ▼ -1.86% | 142.69 | 144.68 | 138.36 | 140.03 | ▼ 141.30 | 3,644,766 |
| AVG/Sum | — | — | -2.51% | -0.37% | — | — | — | — | — | 105,180,354 |
Cross-Market ETFs
Negative confluence: average DOC% -0.37% from the open; DNC% -2.51% versus the prior close. Bitcoin led from the open, gaining 0.88%, but lost 5.52% versus the prior close after a gap down; oil lagged from the open. Bonds finished unchanged versus the prior close, diverging from equities, while gold declined within aligned downtrends.
IBIT · D:2026-11-16 NC% ▼ -5.52% OC% ▲ +0.88%
IBIT – Bitcoin Technicals Summary
IBIT's completed daily session on November 16 closed at 36.79, down 5.52% from the prior close but up 0.88% from the open. That distinction is central: a substantial opening gap down remained unfilled, while trading after the open achieved a modest recovery. The close finished above session VWAP, yet remained below the previous day's low, so intraday improvement did not undo the between-session damage.
Near- and intermediate-term averages were falling with price below them. The far-term average still rose, but price was also below that benchmark, leaving the longer horizon mixed rather than clearly bullish. The daily range was slightly below average despite an expanding 15-session range trend. Volume was roughly one-third above average, consistent with increasing participation. PSAR and the ATR-median measure remained bearish; a next-session high above 40.78 would conditionally trigger a bullish PSAR reversal.
TLT · D:2026-11-16 NC% — 0.00% OC% ▼ -0.16%
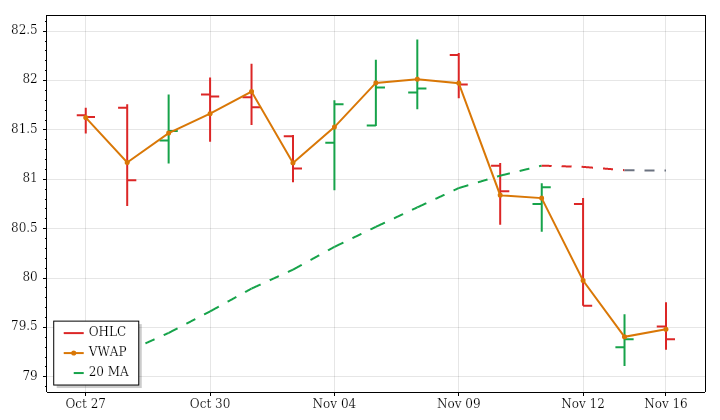
TLT – Long-Term Treasury Bonds Technicals Summary
TLT's completed daily session on November 16 closed at 79.38, unchanged from the prior close but down 0.16% from the open. The initial opening gain was surrendered. Although the session established a higher high and higher low, the close remained inside the previous day's range, near the daily low and below VWAP. The flat headline return therefore concealed a softer open-to-close performance.
Near- and far-term averages were falling, with price beneath both. The intermediate average still rose, but price was below that benchmark too, leaving the middle horizon mixed within an otherwise weak structure. PSAR and the ATR-median measure remained bearish. The daily range and volume were below their prior 15-session averages, contrasting with the lookback's expanding ranges and increasing participation. A next-session high above 81.1149 would conditionally trigger a bullish PSAR reversal; the completed session had not supplied that signal.
GLD · D:2026-11-16 NC% ▼ -0.71% OC% ▼ -0.34%
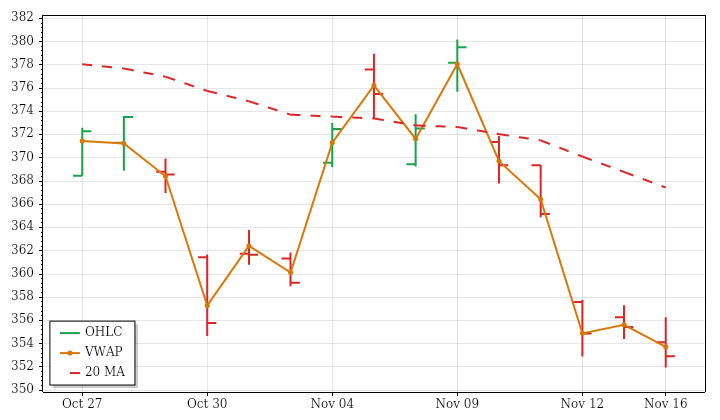
GLD – Gold Technicals Summary
GLD's completed daily session on November 16 finished at 352.93, down 0.71% from the prior close and 0.34% from the open. Although the opening gap down was filled during the session, that recovery did not hold. Price recorded a lower high and lower low, breached the preceding inside bar's low, and closed below both the prior day's low and session VWAP.
The decline reinforced an aligned bearish structure: near-, intermediate- and far-term averages were falling, with price below each. The close was just 0.28% above the supplied 52-week low, placing the latest weakness near the bottom of that longer lookback. Daily range and volume were modestly above average, but their recent trends differed: ranges had been contracting while participation increased. Both PSAR and the ATR-median measure remained bearish. A next-session high above 377.4737 would be required for a conditional bullish PSAR reversal.
Gold News and Fundamentals
Gold remained near its weakest levels in more than a year on November 16, with a firm dollar and hawkish Federal Reserve rate expectations weighing on prices. Disappointing manufacturing activity in the New York Fed’s latest report failed to generate safe-haven demand. Elevated energy prices have also pressured gold this year, leaving it unable to sustain recent gains above $4,000 an ounce.
USO · D:2026-11-16 NC% ▼ -3.81% OC% ▼ -1.86%
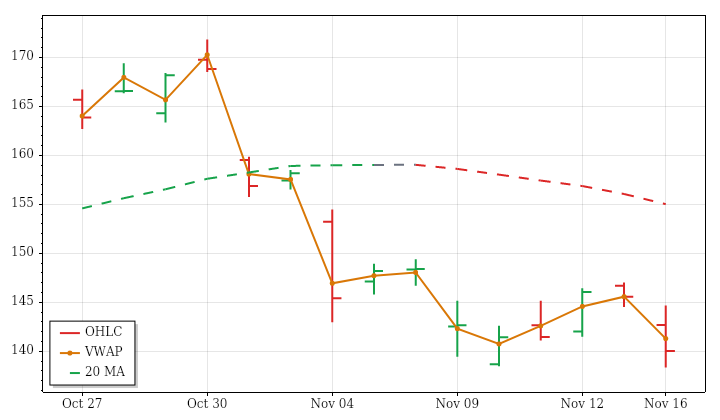
USO – Oil Technicals Summary
USO's completed daily session on November 16 closed at 140.03, declining 3.81% from the prior close and 1.86% from the open. The opening gap down remained unfilled, and further weakness produced a lower high and lower low. The close finished below the previous day's low and beneath VWAP, extending the recent downward price path.
The near-term average was falling above price, while the intermediate average still rose despite price trading below it. Farther out, price remained above a rising long-term benchmark, preserving a clear conflict between shorter-term weakness and the longer-term uptrend. The latest range was about 46% above average, sharply contrasting with the prior 15 sessions' contracting range trend. Volume was below average, consistent with declining participation. PSAR and the ATR-median measure remained bearish; a next-session high above 147.02 would conditionally trigger a bullish PSAR reversal.
Oil News and Fundamentals
Oil reversed early gains on November 16 as recovering Middle East exports and surplus expectations outweighed regional tensions. U.S. crude declined to about $87 a barrel as Strait of Hormuz shipments recovered. ANZ analysts cited Saudi October production of 10.5 million barrels daily and large increases from Iraq and Kuwait. The IEA forecast a fourth-quarter supply surplus, while Wednesday’s U.S. crude inventory release remained an upcoming catalyst.
Glossary: Instrument — ticker symbol; hover for the instrument or company name; Date — session date. DNC% — prior-session close to this session’s close; DOC% — daily session open-to-close percentage change. O — open; H — high; L — low; C — close, all for the table’s daily or weekly session; VWAP — volume-weighted average price; its arrow shows whether the close is above or below VWAP. Vol — period trading volume.
Bias — three directional readings, in order: DNC%, DOC%, then VWAP. ▲ positive/above; ▼ negative/below; — neutral or unavailable. Matching arrows show alignment; opposing arrows show mixed conditions. AVG/Sum — simple average of percentage changes and sum of reported volumes.
Futures Session Fib Grid Analysis – Snapshot
Session Fib Grids normalise market positioning as percentages, making direction and alignment comparable across different asset types.
Latest available snapshot for each instrument; Time(CT) shows the individual update date and time.
| Instrument | Bias | Time(CT) | YSFG | MSFG | WSFG | RSFG | SFG | TSI |
|---|---|---|---|---|---|---|---|---|
| ▼ ES | ▲ ▼ ▼ ▼ ▼ ▼ | 2026-11-17 07:18:07 | ▲ +28 | ▼ -66 | ▼ -48 | ▼ -88 | ▼ -1 | ▼ -7 |
| ▼ NQ | ▲ ▼ ▼ ▼ ▼ ▲ | 2026-11-17 07:18:07 | ▲ +17 | ▼ -50 | ▼ -35 | ▼ -39 | ▼ -1 | ▲ +36 |
| ▼ YM | ▲ ▼ ▼ ▼ ― ▼ | 2026-11-17 07:18:07 | ▲ +18 | ▼ -29 | ▼ -56 | ▼ -173 | — 0 | ▼ -100 |
| ▼ EMD | ▲ ▼ ▼ ▼ ▲ ▼ | 2026-11-17 07:13:21 | ▲ +26 | ▼ -27 | ▼ -56 | ▼ -78 | ▲ +2 | ▼ -31 |
| ▼ RTY | ▲ ▼ ▼ ▼ ▼ ▲ | 2026-11-17 07:18:07 | ▲ +23 | ▼ -60 | ▼ -50 | ▼ -86 | ▼ -2 | ▲ +10 |
| ▼ FDAX | ▲ ▲ ▼ ▼ ▼ ▼ | 2026-11-17 07:18:01 | ▲ +39 | ▲ +38 | ▼ -50 | ▼ -8 | ▼ -9 | ▼ -312 |
| ▲ NKD | ▲ ▼ ▼ ▲ ▼ ▲ | 2026-11-17 07:11:23 | ▲ +103 | ▼ -44 | ▼ -38 | ▲ +7 | ▼ -1 | ▲ +36 |
| Instrument | Bias | Time(CT) | YSFG | MSFG | WSFG | RSFG | SFG | TSI |
|---|---|---|---|---|---|---|---|---|
| ▲ BTC | ▼ ▼ ▲ ▲ ― ▲ | 2026-11-17 07:18:07 | ▼ -92 | ▼ -89 | ▲ +3 | ▲ +34 | — 0 | ▲ +84 |
| ▼ GC | ▼ ▼ ▼ ▼ ▼ ▼ | 2026-11-17 07:18:09 | ▼ -175 | ▼ -7 | ▼ -4 | ▼ -11 | ▼ -5 | ▼ -37 |
| ▼ CL | ▲ ▼ ▼ ▼ ▲ ▲ | 2026-11-17 07:17:56 | ▲ +141 | ▼ -99 | ▼ -38 | ▼ -80 | ▲ +3 | ▲ +74 |
| ▼ 6E | ▼ ▼ ▼ ▼ ▼ ▼ | 2026-11-17 07:17:44 | ▼ -75 | ▼ -71 | ▼ -26 | ▼ -44 | ▼ -7 | ▼ -83 |
| ▲ ZB | ▼ ▼ ▲ ▲ ▲ ▼ | 2026-11-17 07:17:53 | ▼ -42 | ▼ -43 | ▲ +8 | ▲ +9 | ▲ +3 | ▼ -22 |
Glossary: YSFG — yearly; MSFG — monthly; WSFG — weekly; RSFG — regular trading hours (RTH); SFG — the current session, including pre-market or other sessions. TSI indicates trend strength and power.
Bias shows trend alignment across these six readings. The arrows follow the column order: YSFG, MSFG, WSFG, RSFG, SFG and TSI. Matching arrows show alignment; opposing arrows show mixed conditions.
Futures Higher Time Frame Analysis
Summary of the current state of US Indices Futures based on higher time-frame (HTF) technical analysis as of: 2026-11-17 07:15 -06:00 CT.
US Indices Futures
- ES bullish YSFG, bearish MSFG/WSFG, below all daily benchmarks, bearish medium-term pivots, support 7322.25, weekly benchmark resistance 7592.50–7692.75.
- NQ bullish YSFG, bearish MSFG/WSFG, below all daily benchmarks, daily lower-high/lower-low structure, support 26366.50–26386.50, resistance 28697.00.
- YM bullish YSFG, bearish MSFG/WSFG, below all daily benchmarks, bearish daily medium-term pivots, support 50859–50891, benchmark resistance 52227–52395.
- EMD bullish YSFG, bearish MSFG/WSFG, below all daily benchmarks, rising weekly but falling daily medium-term pivots, support 3560.7, resistance 3750.3–3770.1.
- RTY bullish YSFG, bearish MSFG/WSFG, below all declining daily benchmarks, daily lower highs, support 2714.2, benchmark resistance 2807–2810.
- FDAX bullish YSFG/MSFG, bearish WSFG, above all weekly benchmarks, rising daily pivots, daily benchmark reference 26102, swing support 25695, resistance 27084.
Overall State
- Short-Term: Bearish
- Intermediate-Term: Bearish
- Long-Term: Bullish
Conclusion
Bearish WSFG readings and recent short signals align across all six instruments. US contracts share bearish MSFG readings and trade below all daily benchmarks, while FDAX retains bullish monthly structure and relative technical strength. US daily medium-term pivots remain bearish despite several near-term UTrend classifications. Weekly medium-term structure is mixed in YM and EMD, contrasting with broader weakness in ES, NQ and RTY. Bullish YSFG positioning and rising 100- and 200-week benchmarks preserve the longer-term bullish framework, although daily far-term readings remain bearish in ES, NQ, EMD and RTY. Listed swing supports and overhead benchmark clusters frame the ongoing correction; pivot-reversal thresholds remain distinct from established support or resistance.
Note: Intra-day counter-trend pullbacks or retracements may occur, HTF is context for informational usage and market structure. Glossary: Session Fib Grids periods of YSFG:’Yearly’, MSFG:’Monthly’, WSFG:’Weekly’
For full details visit: AlphaWebTrader Technicals
SPY Daily View
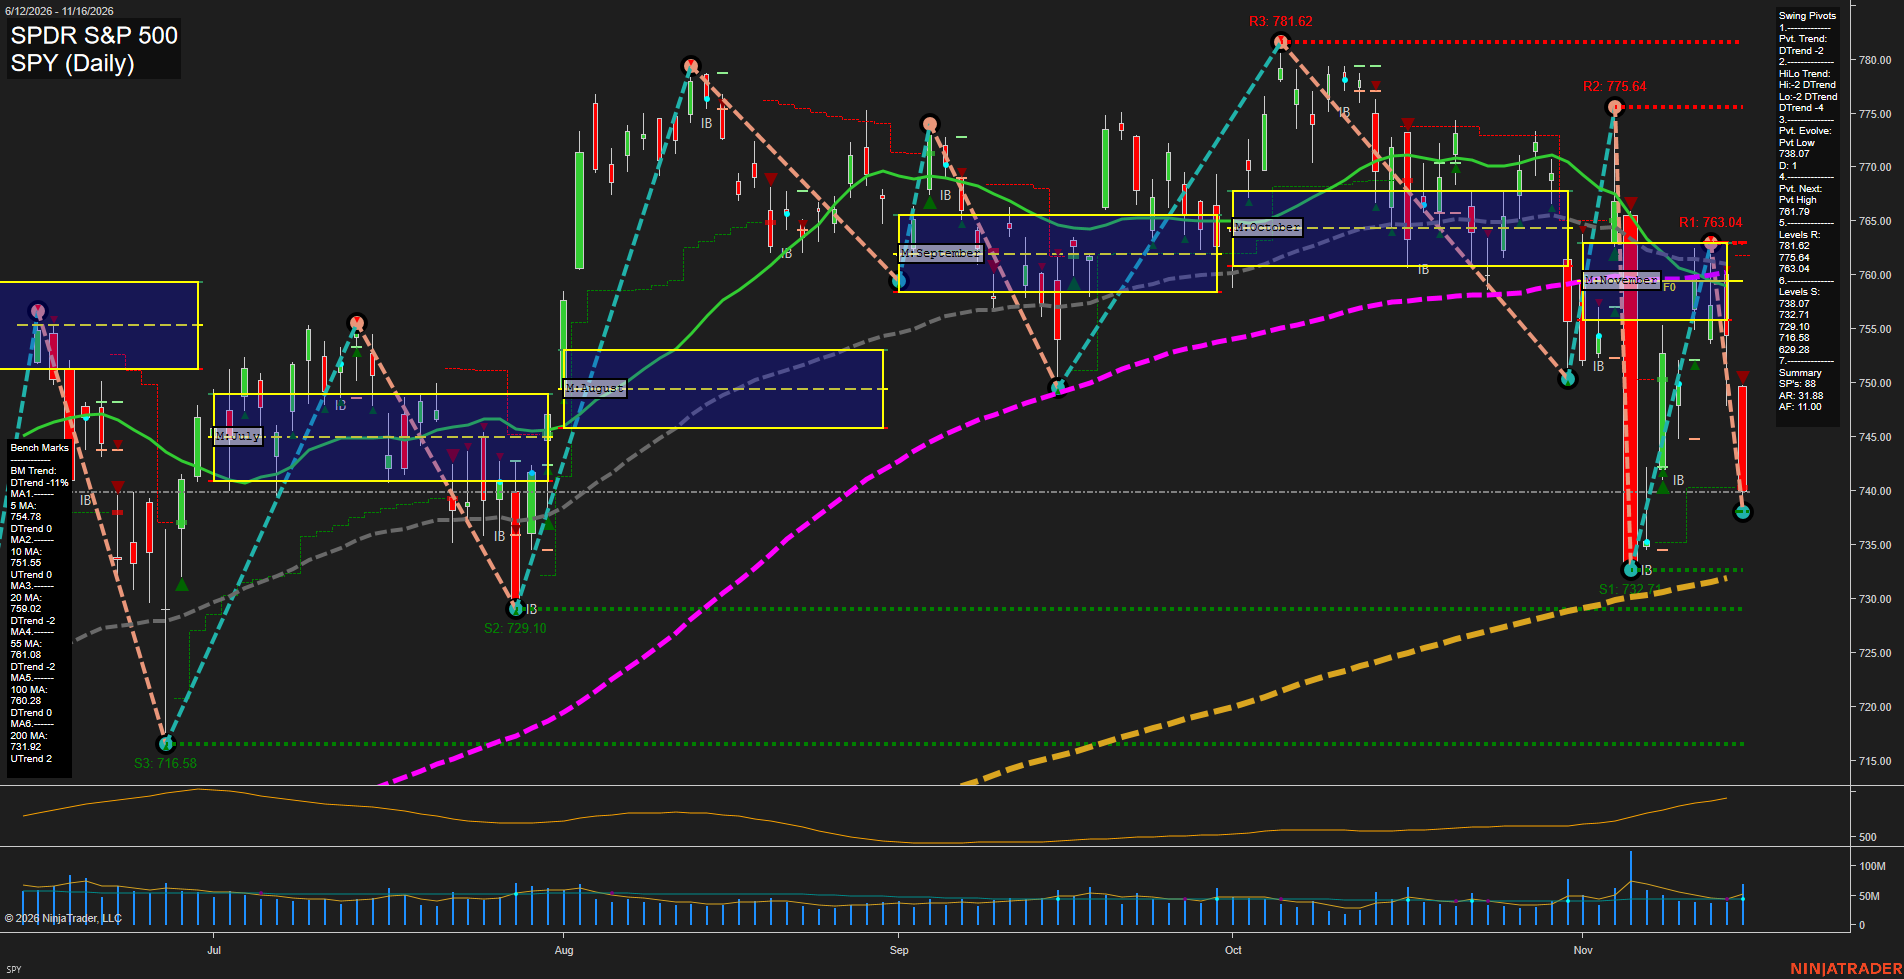
Overall Rating
- Near-Term: Bearish
- Medium-Term: Bearish
- Far-Term: Neutral.
Key Insights Summary
From a futures swing trader’s perspective, SPY reflects renewed downside expansion after a failed rebound. The lower swing high at 763.04 versus 775.64, declining short- and medium-term benchmarks, and price below November’s NTZ reinforce the bearish daily structure. The latest large down bar brings price close to evolving pivot support at 738.07; the next support cluster combines 732.71, the rising 200-day average at 731.92, and 729.10. Overhead, the 751.55–754.78 short-term averages precede a broader resistance cluster around 759.02–763.04. Rising ATR indicates expanding daily volatility, while the recent rebound has not reversed the prevailing pivot downtrend. The rising 200-day benchmark leaves the longer-term picture mixed rather than uniformly bearish. These are SPY reference levels, not executable futures prices. Weekly and yearly grids and named strategy signals are not displayed; their neutral placeholders are not confirmed readings. News and seasonal drivers cannot be established from this chart alone.
View charts on: AlphaWebTrader HTF Charts
ES Daily View
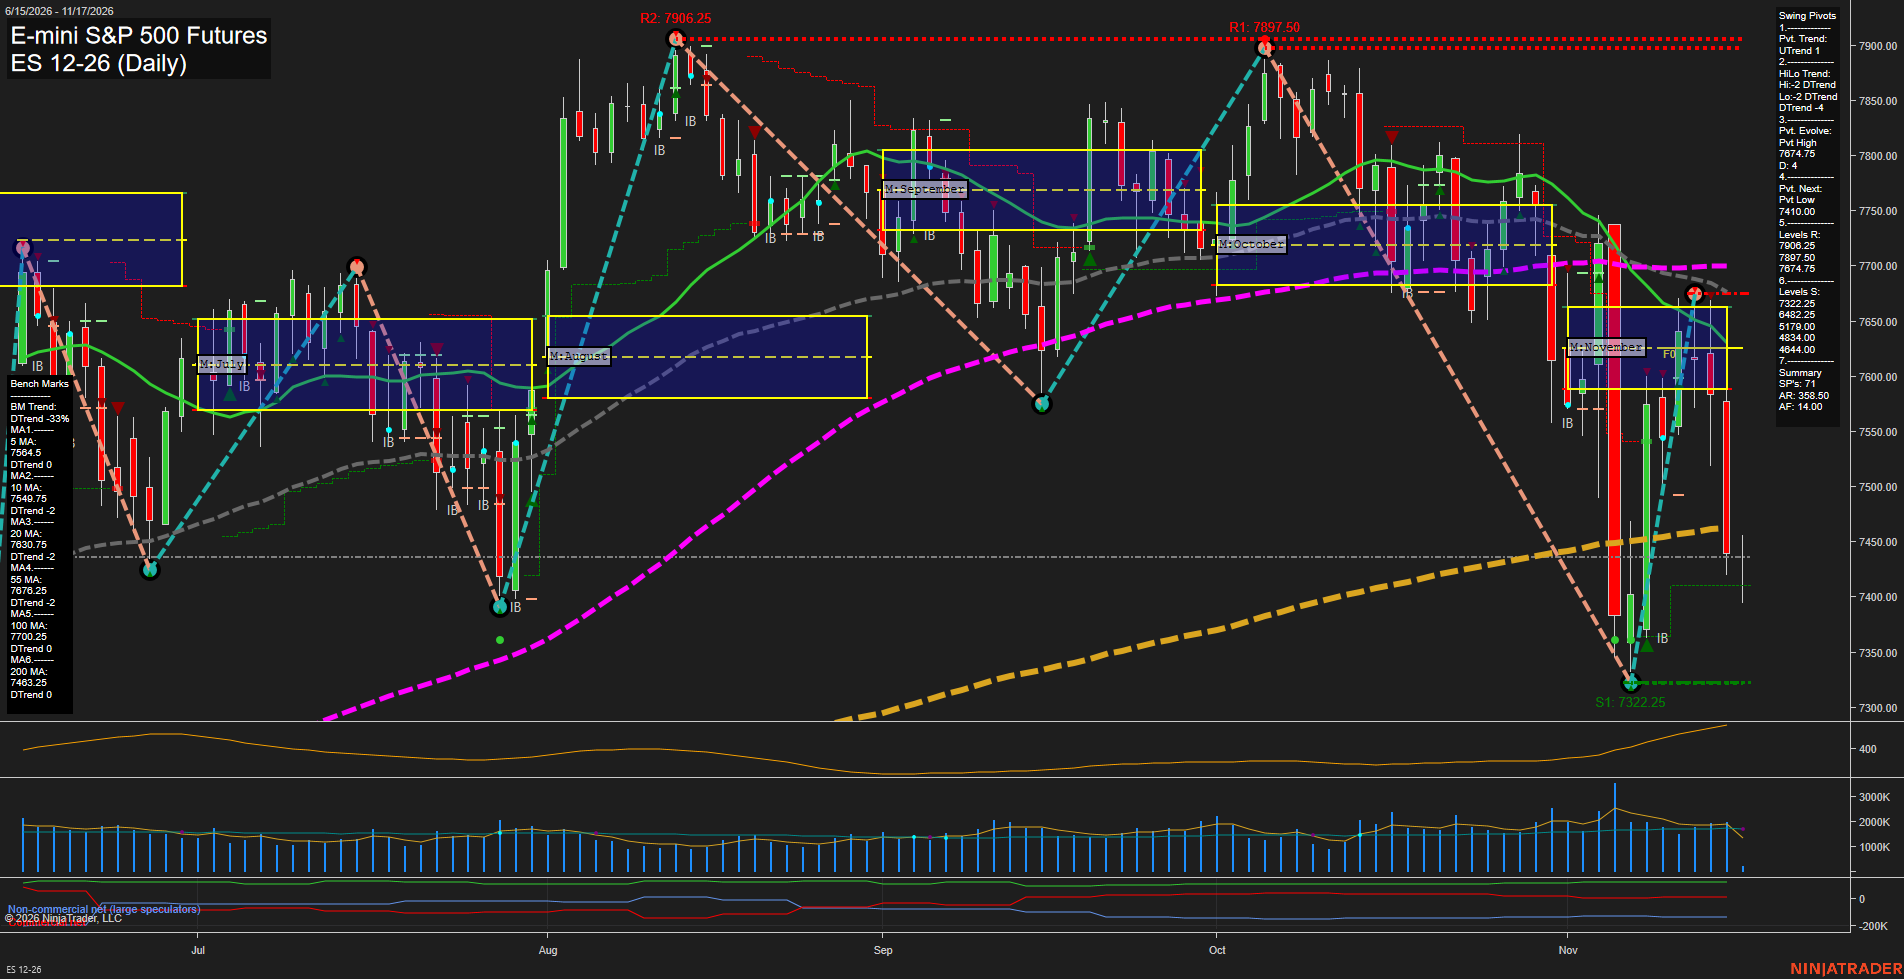
Overall Rating
- Near-Term: Bearish
- Medium-Term: Bearish
- Far-Term: Bearish.
Key Insights Summary
The swing-trading picture is dominated by a sharp rejection of the rebound from 7322.25 to 7674.75. Price has fallen below all six benchmarks, including the 200-day average at 7463.25, while weekly and monthly grids and the latest short signals reinforce downside momentum. The pivot summary still records a near-term UTrend, but this conflicts with the bearish medium-term high/low structure; 7410.00 is the listed reversal threshold for the next pivot low. The 7322.25 swing low remains the nearest established pivot support, with resistance at 7674.75 closely aligned with the 55-day benchmark. Large recent candles and rising ATR describe an expanding-volatility selloff rather than orderly consolidation. The positive yearly grid provides a longer-horizon bullish offset, but the majority of far-term metrics remain bearish. The chart alone does not establish a news catalyst or seasonal explanation.
View charts on: AlphaWebTrader HTF Charts
QQQ Daily View
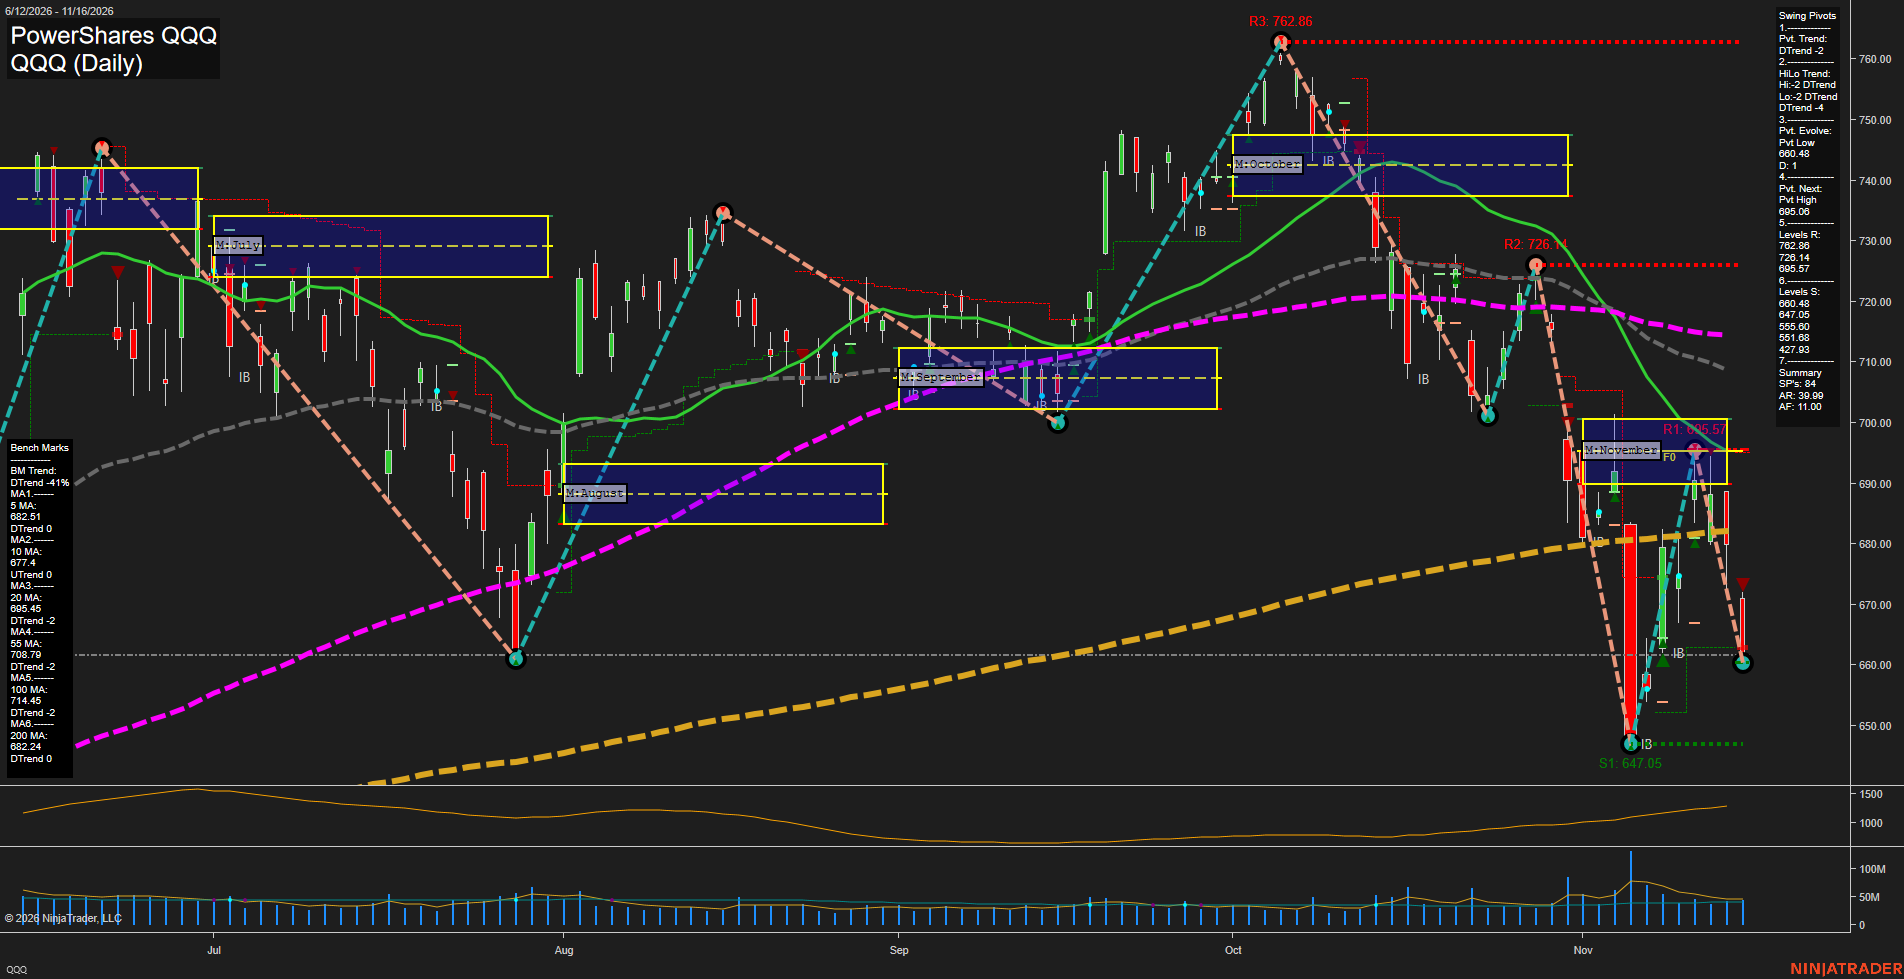
Overall Rating
- Near-Term: Bearish
- Medium-Term: Bearish
- Far-Term: Bearish.
Key Insights Summary
From a futures swing trader’s perspective, QQQ reflects bearish Nasdaq-linked equity momentum, although these are ETF levels rather than executable futures prices. Successively lower swing highs at 762.86, 726.14 and 695.57 define the dominant downswing. The rebound from 647.05 failed near 695.57, followed by a sharp return toward evolving support at 660.48. That leaves a potential higher low above 647.05, but no confirmed bullish pivot reversal. Price is below all six benchmarks, with the 200-day benchmark near 682.24 also overhead. November’s monthly grid appears approximately 690–701, placing price below its neutral zone; consequently, the neutral grid entries above should be treated as placeholders rather than confirmation of neutral conditions. Weekly and yearly grid readings and the requested USAR signal states are not identifiable in this image. Large recent bars and the rising ATR plot indicate expanding daily volatility. The ATR and VOLMA numbers above reproduce the supplied template values, as exact current readings are not displayed clearly. No contemporaneous news catalyst or seasonal conclusion can be established from this chart alone.
View charts on: AlphaWebTrader HTF Charts
NQ Daily View
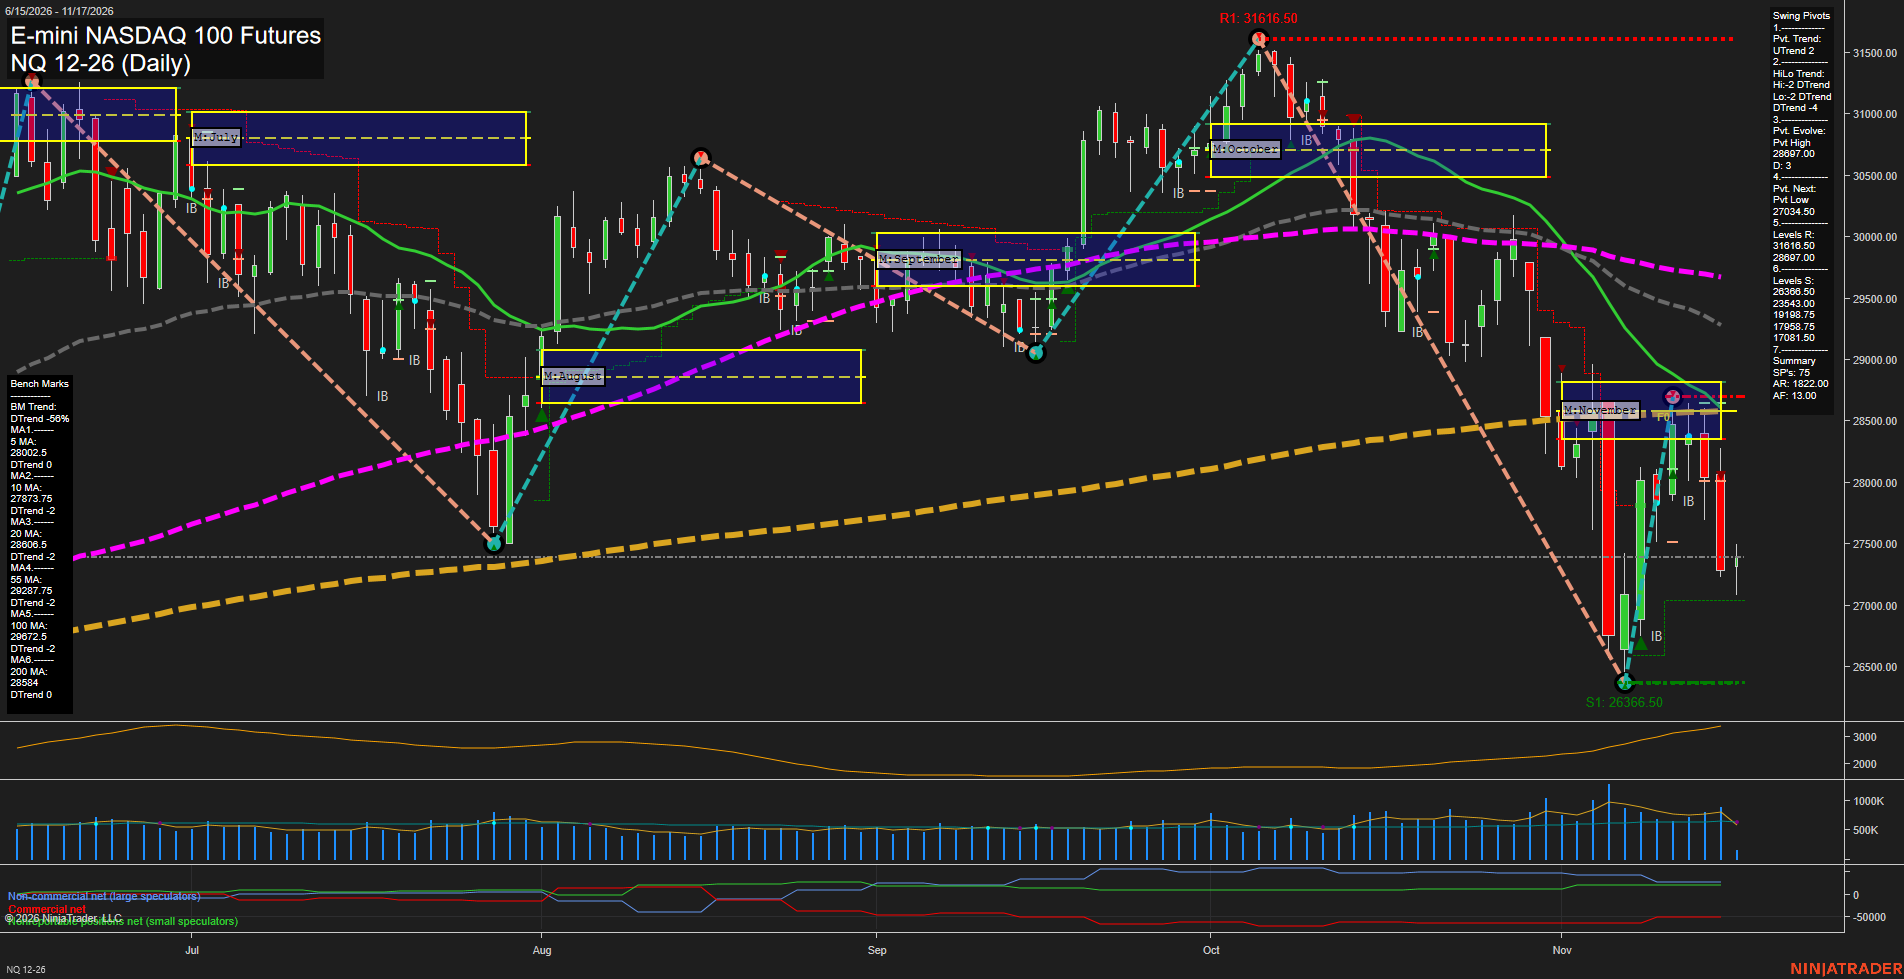
Overall Rating
- Near-Term: Bearish
- Medium-Term: Bearish
- Far-Term: Bearish.
Key Insights Summary
From a futures swing perspective, the rebound from 26366.50 to 28697.00 remains a countertrend recovery within a broader lower-high/lower-low structure. Rejection around November’s NTZ and the 200-day benchmark has been followed by renewed selling, leaving price below all six daily benchmarks. The near-term pivot summary still reads UTrend, but this conflicts with falling short-term averages, negative weekly positioning and both recent short signals; 27034.50 is the listed reversal threshold for the next pivot low, not an established support pivot. Medium-term evidence is consistently bearish, with monthly grid weakness and declining 20-day and 55-day benchmarks. The positive yearly grid offsets some longer-horizon weakness, but declining 100-day and 200-day benchmarks leave the far-term majority bearish. Large recent candles and rising volatility characterize an unstable retracement rather than a confirmed sustained recovery. The developing pre-open bar is small and incomplete; no news catalyst or seasonal edge can be established from this chart alone.
View charts on: AlphaWebTrader HTF Charts
USO Daily View
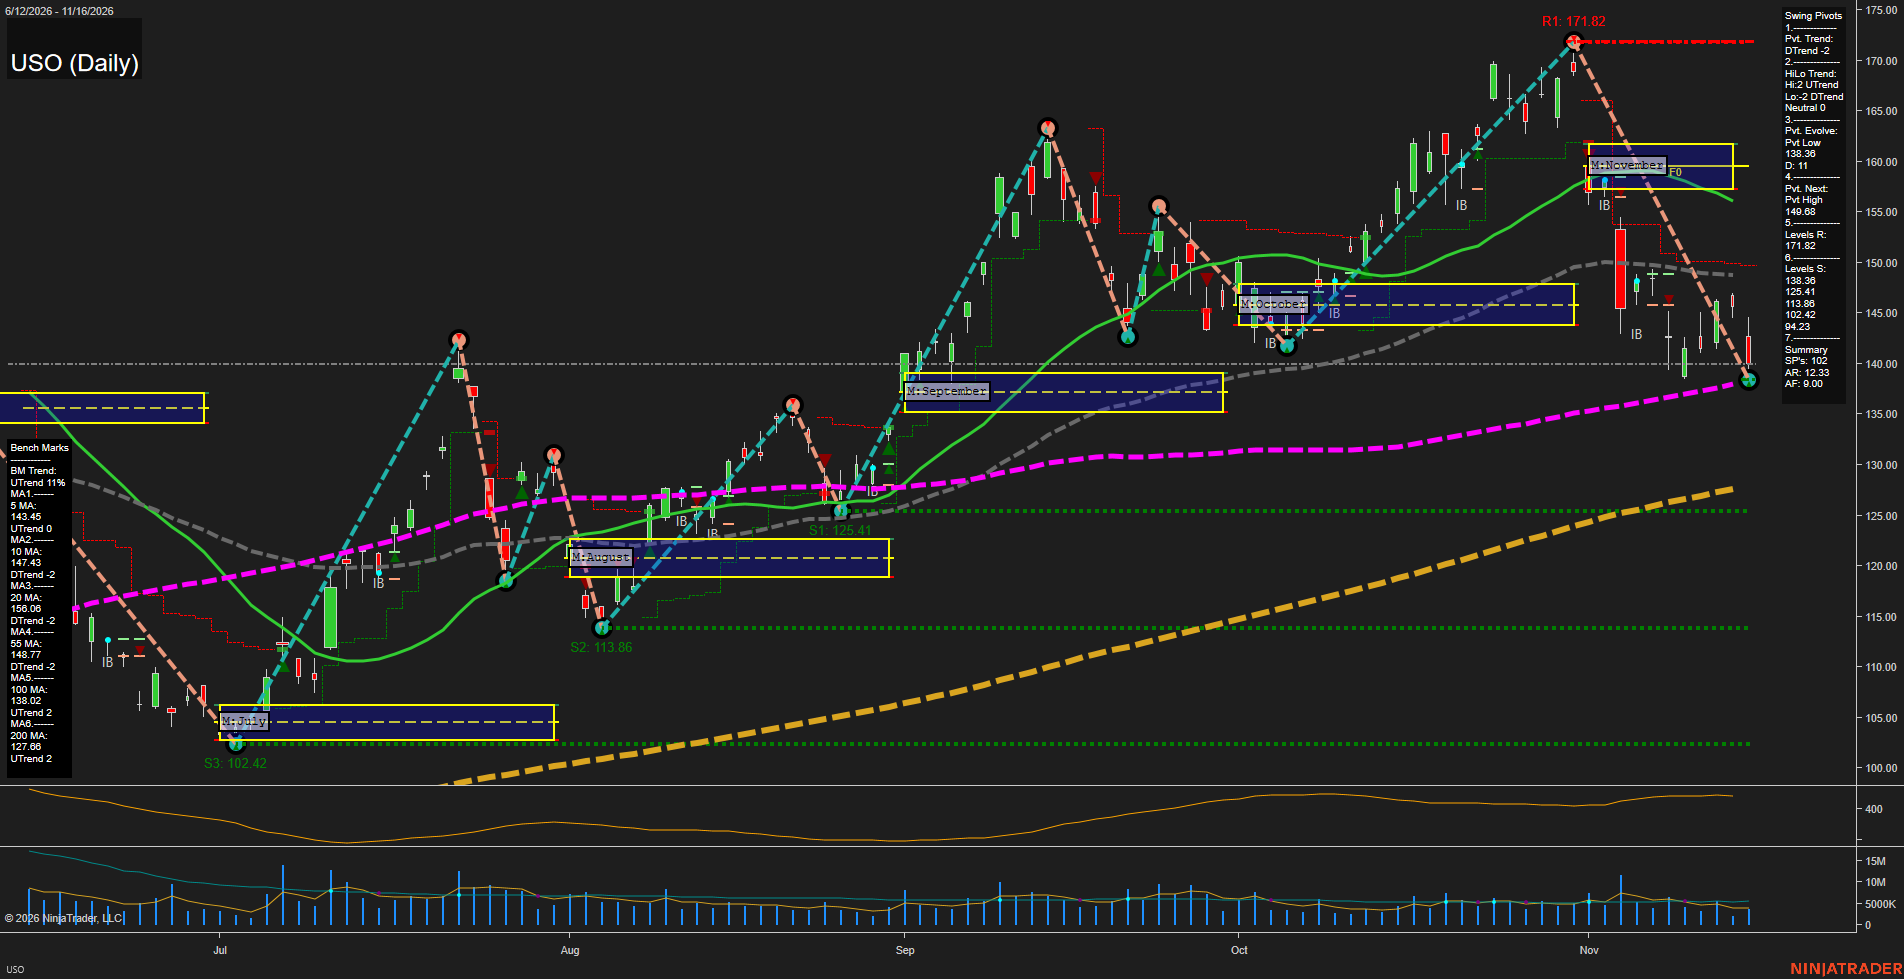
Overall Rating
- Near-Term: Bearish
- Medium-Term: Bearish
- Far-Term: Bullish.
Key Insights Summary
From a futures swing trader’s perspective, USO is undergoing a sharp corrective downswing within a still-rising longer-term structure. The decline from 171.82 to the evolving 138.36 pivot low represents approximately a 19.5% retracement. Price sits below its 5-, 10-, 20- and 55-day benchmarks and below November’s monthly neutral zone, approximately 157–162, confirming weak near- and medium-term positioning. The 138.36 pivot and rising 100-day benchmark at 138.02 form a closely aligned support area; the rising 200-day benchmark remains substantially lower. The pivot summary places the next opposite-pivot reversal threshold at 149.68, while its mixed higher-high/lower-low structure leaves the medium-term HiLo trend neutral. Overall, this is a bearish corrective phase rather than a confirmed long-term downtrend. Weekly and yearly grids and named strategy signals are not displayed, so their direction cannot be independently verified. USO is an oil-futures ETF, and its share-price levels are not crude-oil futures prices; news and seasonal drivers cannot be established from this chart alone.
View charts on: AlphaWebTrader HTF Charts
CL Daily View
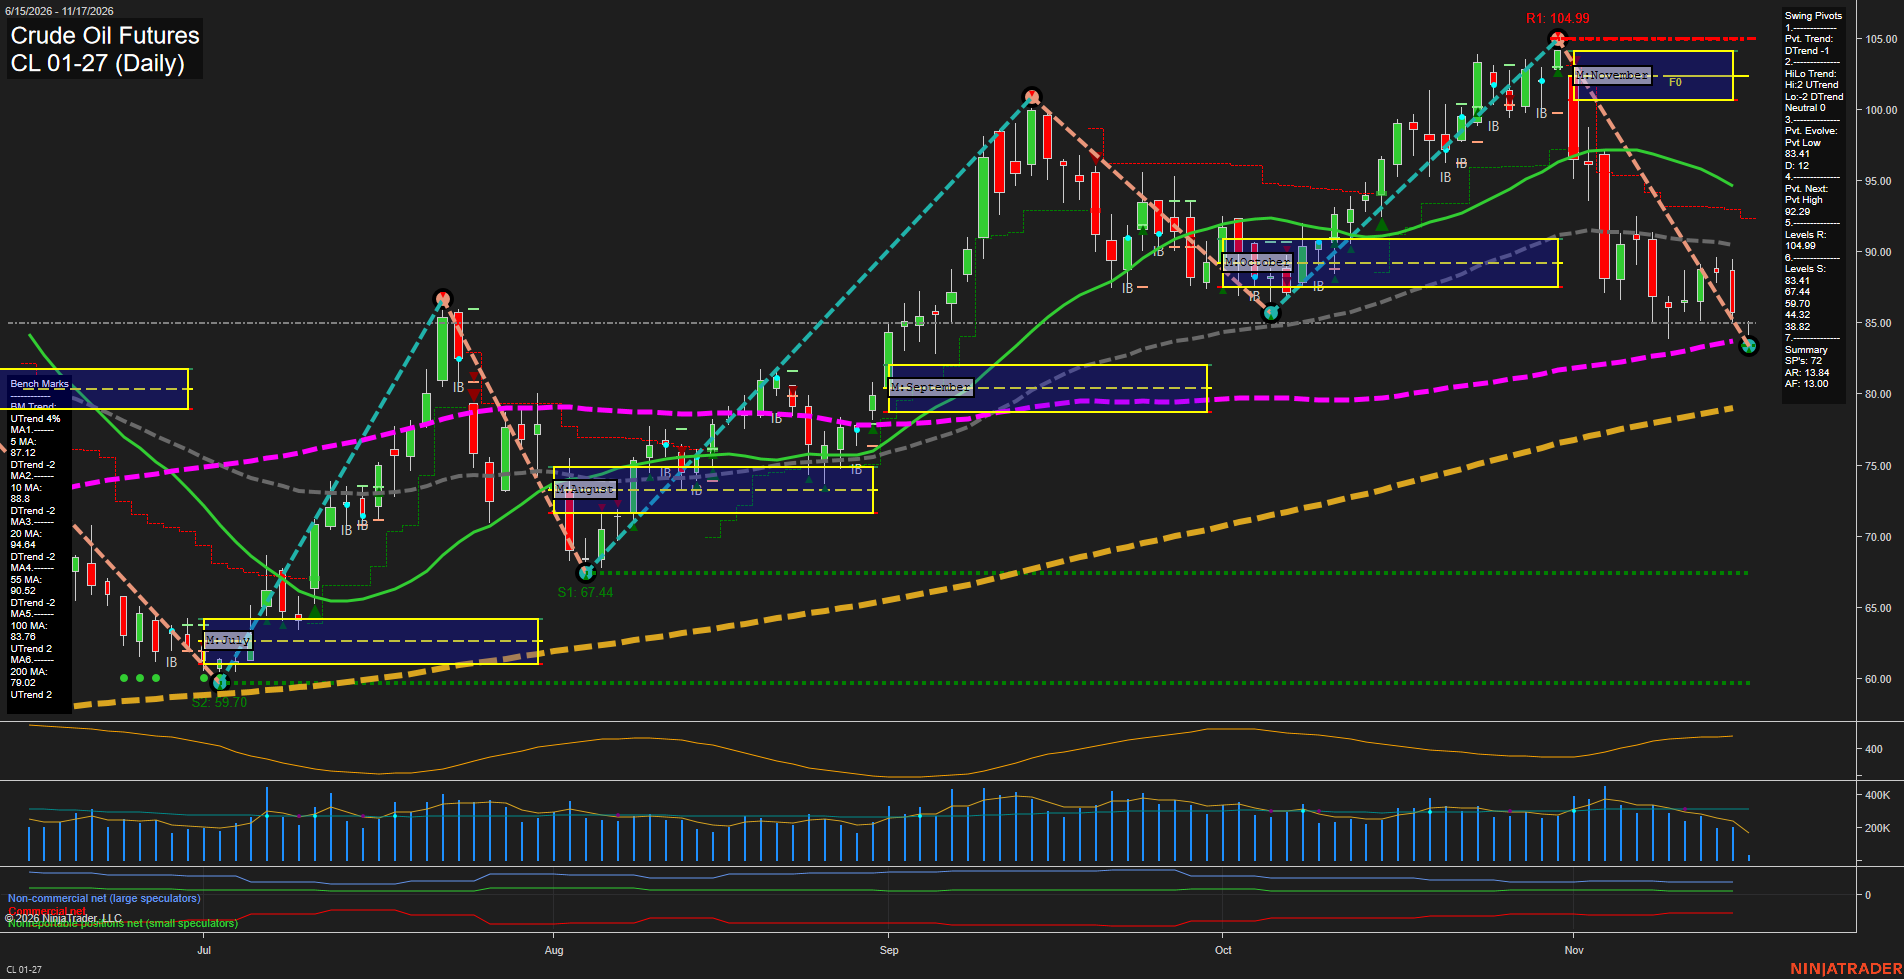
Overall Rating
- Near-Term: Bearish
- Medium-Term: Bearish
- Far-Term: Bullish.
Key Insights Summary
The sharp November reversal from 104.99 has developed into a fast downswing, with large bearish bars and brief rebounds failing to reverse the decline. Price is below the falling 5-, 10-, 20- and 55-day benchmarks and both weekly and monthly neutral zones, reinforcing bearish near- and medium-term conditions. The evolving 83.41 pivot low lies near the rising 100-day benchmark at 83.76, making this a significant test of the longer-term advance. The HiLo pivot summary remains neutral rather than confirming a fully established medium-term downtrend; 92.29 is the listed opposite-pivot reversal threshold, not a confirmed resistance pivot. Rising 100- and 200-day benchmarks and the positive yearly grid retain a bullish far-term backdrop despite the deep retracement. Both supplied short signals align with the near-term decline, although they reference December futures while the displayed chart is January futures. News catalysts and seasonal effects cannot be established from this chart alone.
View charts on: AlphaWebTrader HTF Charts
GLD Daily View
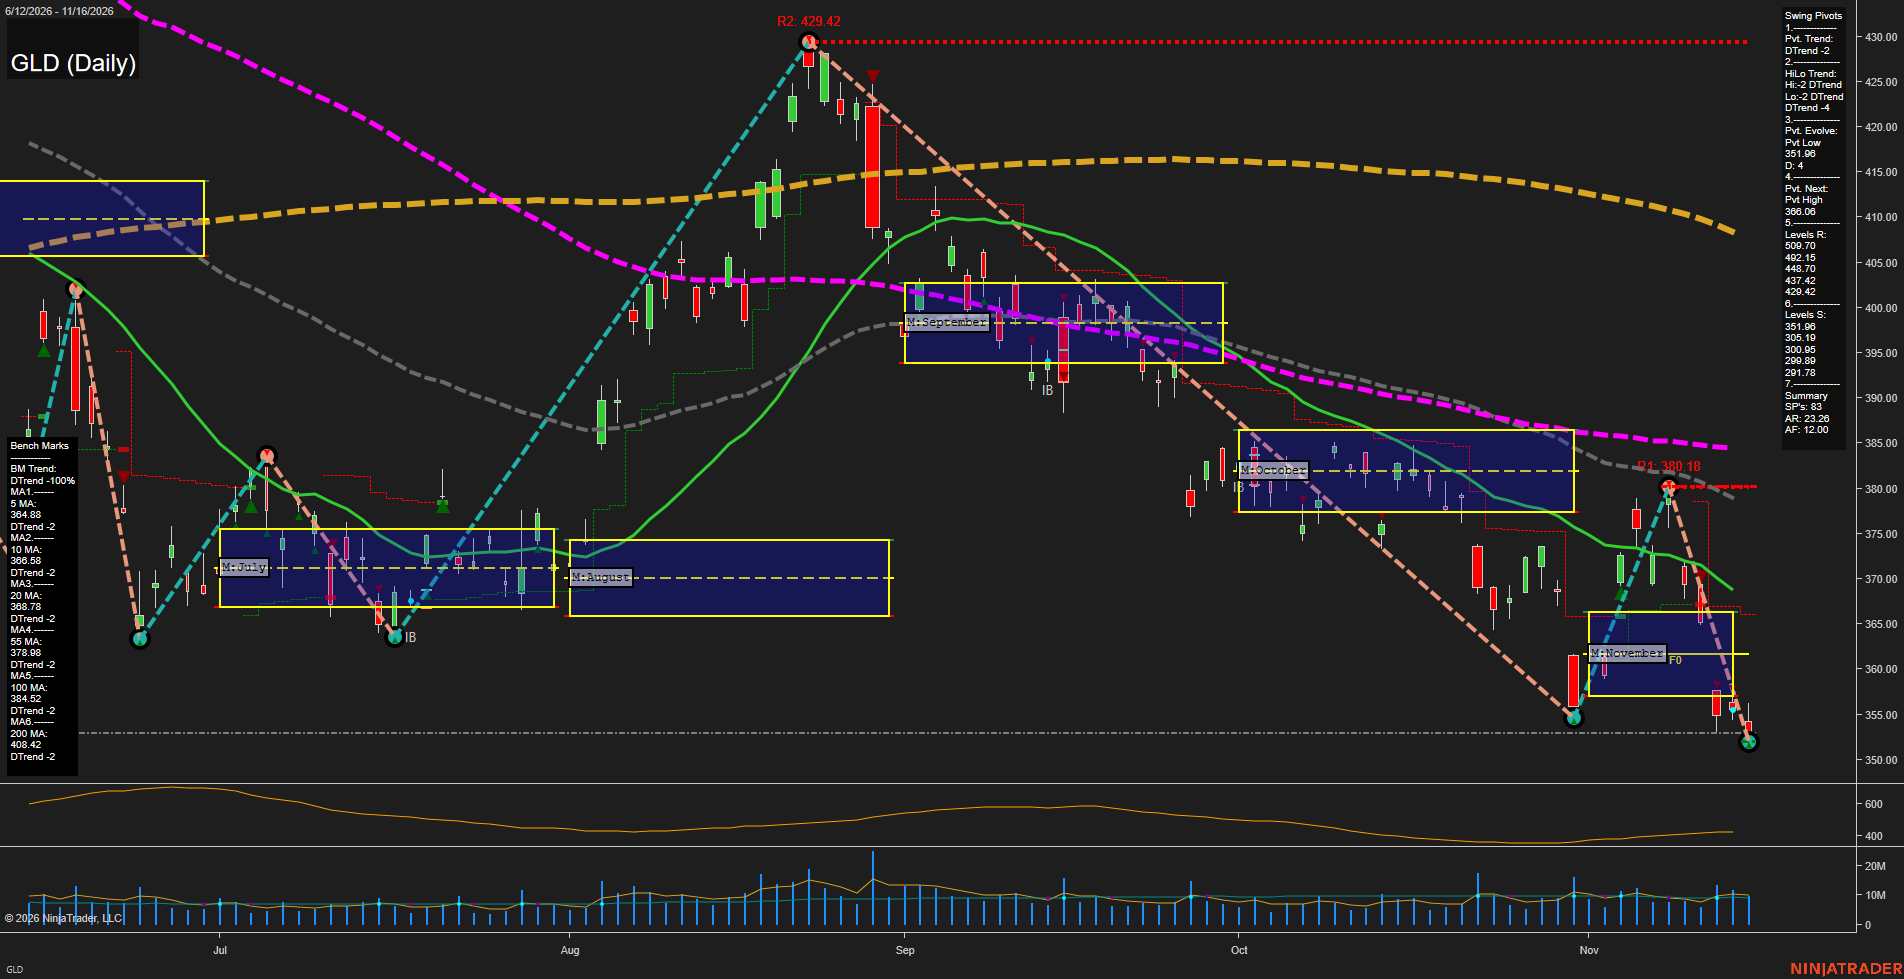
Overall Rating
- Near-Term: Bearish
- Medium-Term: Bearish
- Far-Term: Bearish.
Key Insights Summary
From a futures swing trader’s perspective, GLD displays bearish alignment across time horizons: lower swing highs and lows, price beneath every benchmark, and all six averages declining. The rebound into 380.18 failed, followed by a renewed decline through November’s monthly neutral zone, approximately 357–366, toward the evolving 351.96 pivot low. This is a downside continuation structure rather than a confirmed reversal. The 366.06 opposite-pivot threshold and recent 380.18 swing high provide nearer structural references than the summary’s distant resistance list. ATR is turning higher as price weakens, suggesting expanding daily movement; volume does not show an unmistakable climactic surge. Weekly and yearly grids and the named USAR signals are not displayed, so their neutral entries are placeholders rather than confirmed readings. GLD levels are ETF prices, not gold-futures contract prices; news and seasonal effects cannot be established from this chart alone.
View charts on: AlphaWebTrader HTF Charts
GC Daily View
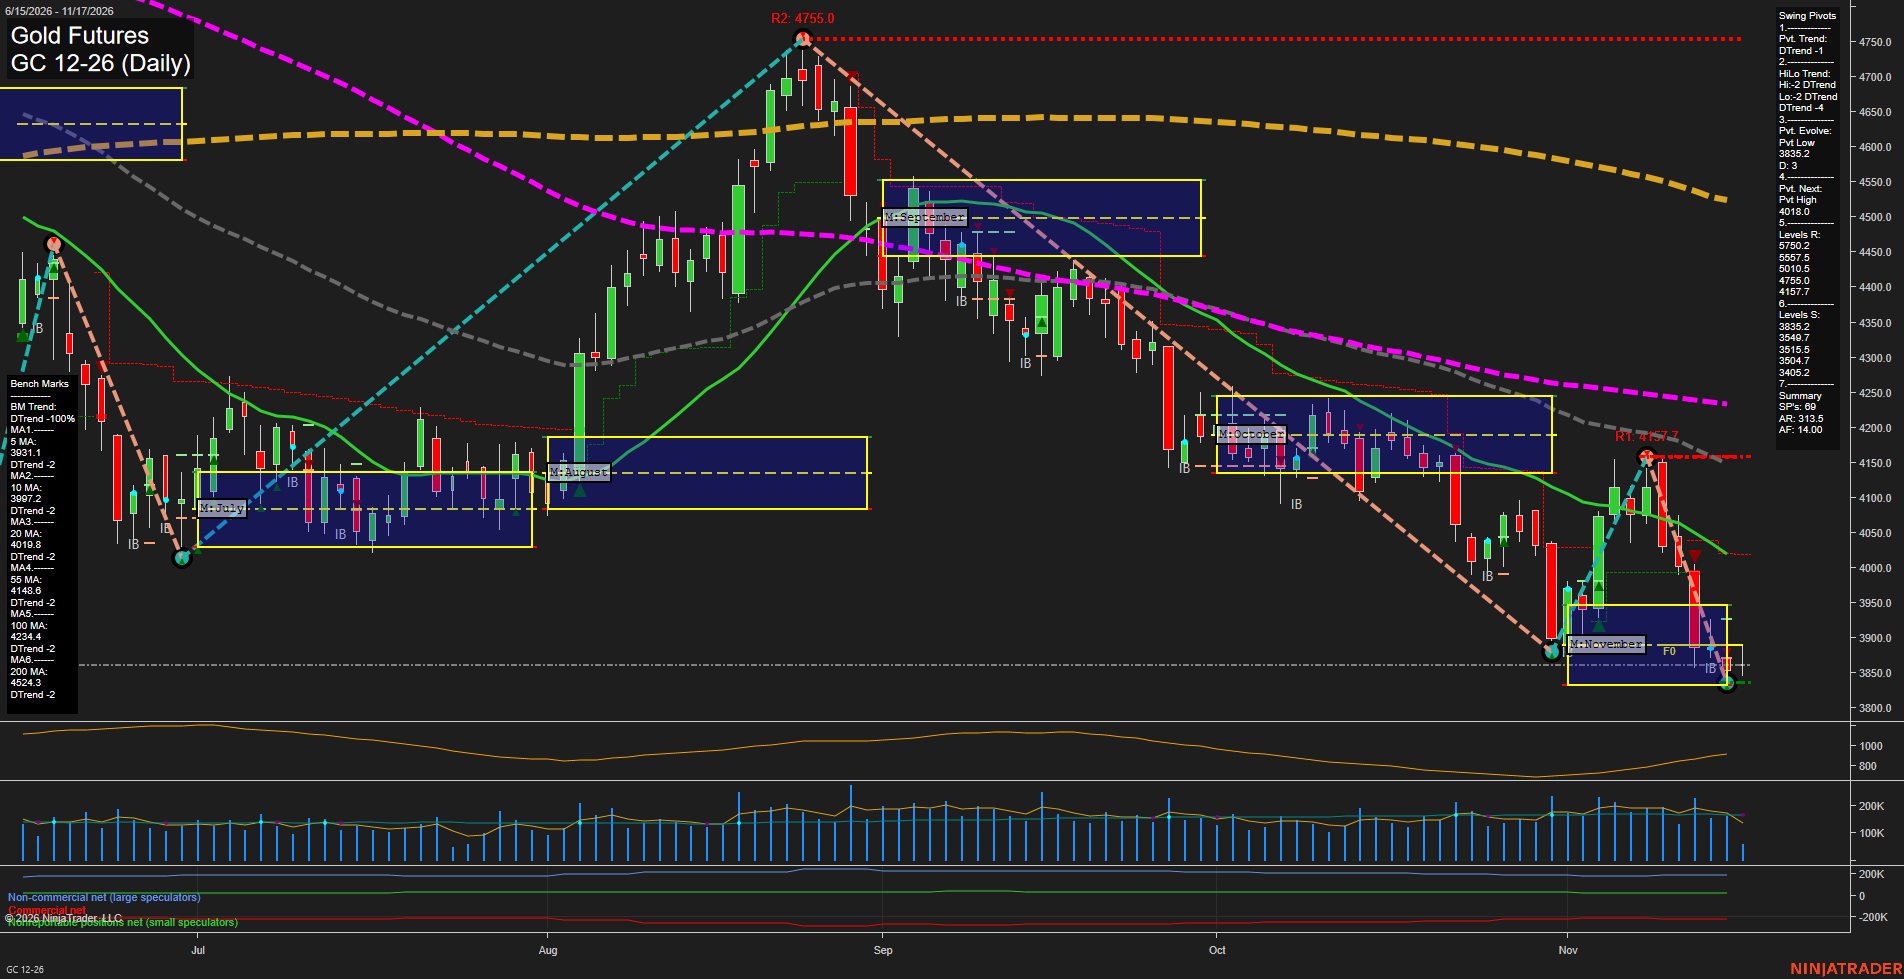
Overall Rating
- Near-Term: Bearish
- Medium-Term: Bearish
- Far-Term: Bearish.
Key Insights Summary
From a futures swing-trading perspective, the dominant structure is bearish trend continuation following a failed countertrend rally to 4157.7. The subsequent selloff established an evolving pivot low at 3835.2, extending the lower-high/lower-low sequence. Price remains beneath all six declining benchmarks, while the weekly, monthly and yearly grids reinforce the downside alignment. Recent large bearish bars indicate forceful selling, although the latest small candle near support suggests a pause rather than a confirmed reversal. The 4018.0 next-pivot threshold nearly coincides with the 4019.8 declining 20-day benchmark, forming a notable structural reference above price. The November 16 weekly-grid long signal is countertrend against the near-term and far-term short signals and the broader bearish structure. No medium-term MSFG trade signal is supplied. News catalysts and seasonal influences cannot be established from this chart alone.
View charts on: AlphaWebTrader HTF Charts
ZB Daily View
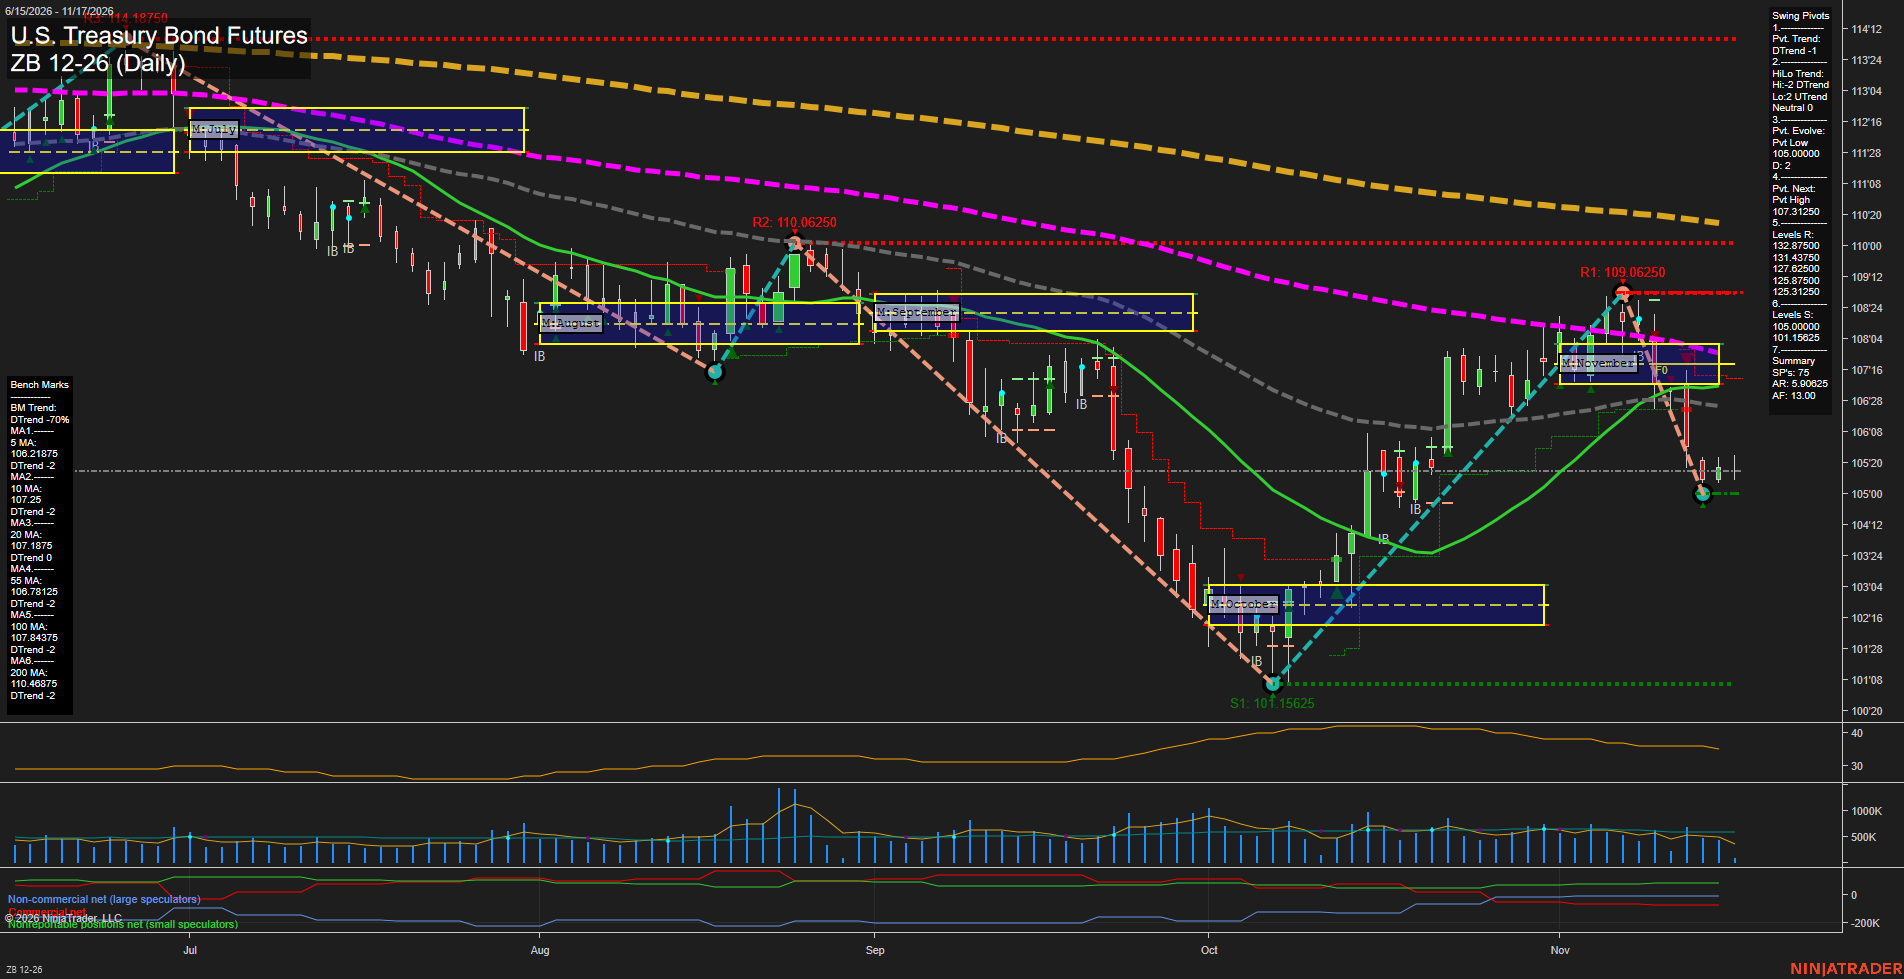
Overall Rating
- Near-Term: Bearish
- Medium-Term: Bearish
- Far-Term: Bearish.
Key Insights Summary
The October recovery from 101.15625 stalled at 109.06250, below the preceding 110.06250 swing high, reinforcing a lower-high resistance structure. The subsequent selloff returned price beneath all six daily benchmarks and November’s neutral trading zone. Small recent bars near 105.00000 indicate stabilization and slowing immediate momentum, but not a confirmed bullish reversal. The positive weekly grid is a countertrend feature within bearish monthly, yearly and pivot conditions. The next opposite-pivot reversal threshold is 107.31250. The summary’s resistance list contains distant historical levels; the nearer chart-marked swing resistance levels are 109.06250 and 110.06250. Named trade-signal readings are not visible, and the chart alone does not establish news or seasonal drivers.
View charts on: AlphaWebTrader HTF Charts
Sentiment Summary: Neutral coverage led at 42%, but negative news outweighed positive 37% to 20%, reflecting Nvidia’s leadership turmoil, tighter U.S. chip-export rules announced November 16, and Fed calls for further rate hikes. Following Monday’s technology-led selloff, Dow, S&P 500 and Nasdaq 100 futures were reported about 0.4% lower Tuesday morning ahead of retail sales and Nvidia’s November 17 after-close earnings. Strong AI-demand evidence, including CoreWeave’s 168% quarterly revenue growth and raised full-year outlook, provided a counterweight as technology selling pressure eased.
Conclusion: Nvidia options pricing indicated elevated earnings-event risk, with an approximately 8% move implied in either direction.