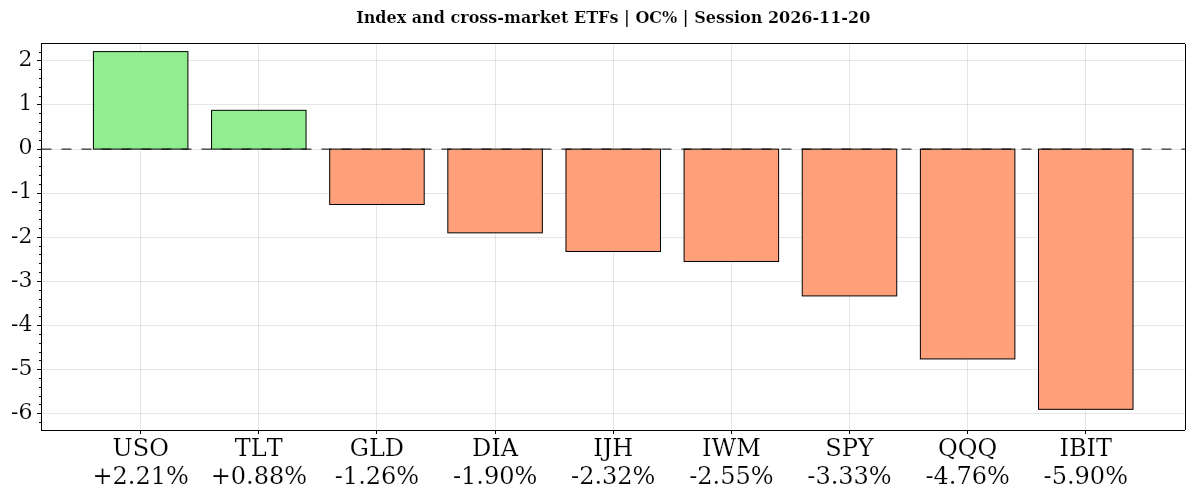
Stocks and tech ended Friday lower as chip shares sank and volatility rose. Nvidia lost 12.53% from its open; oil and Treasuries rose, while gold fell.
Fundamentals: Stocks and technology ended Friday lower as Nvidia and Broadcom fell 12% in afternoon trading amid reported accounting scrutiny and AI chip order concerns. The VIX topped 31, while rotation into value and defensive shares cushioned the broader market. Oil and bonds rose, while gold declined. Michigan consumer sentiment met forecasts at 51.5, and one-year inflation expectations fell to 3.7%.
Technicals: Stocks ended Friday's session sharply below their opens: the S&P 500 ETF fell 3.33%, the Nasdaq-100 ETF lost 4.76% and Nvidia dropped 12.53%. Equity futures charts showed accelerating daily downtrends, though longer-term weekly structures remained mixed. The oil ETF gained 2.21% from its open, the gold ETF fell 1.26% and the far-term Treasury ETF rose 0.88%. Equity selling came on above-average volume.
After Market Close daily snapshot: market news summary and sentiment, major ETFs, Magnificent 7 analysis, Indices Futures Higher Time Frame Analysis, and E-mini S&P500, Nasdaq 100, NYMEX Crude, Gold Futures Daily Chart analysis.
As of: November 20, 2026 04:00 CT
EcoNews Radar U.S. Events Day Recap
| Date | Impact | Event, Prev, Forecast, Actual | Info |
|---|---|---|---|
| 2026-11-20 Friday 08:25 | Medium | Fed's Waller speech Prev: — Forecast: — Actual: — | Remarks can clarify the policymaker’s views on inflation, employment and monetary policy; index futures traders monitor them for signals about the interest-rate outlook. |
| 2026-11-20 Friday 10:00 | Medium | Michigan Consumer Sentiment Index Prev: 51 Forecast: 51.5 Actual: 51.5 | Measures households’ assessments of current conditions and future prospects; traders monitor it for clues about consumer spending and the economic growth outlook. |
| 2026-11-20 Friday 10:00 | Medium | UoM 1-year Consumer Inflation Expectations Prev: 4.3 Forecast: 4.3 Actual: 3.7 | Measures households’ expected inflation over the coming year; traders watch it for potential implications for spending behavior, wage demands and monetary policy. |
| 2026-11-20 Friday 10:00 | Medium | Michigan Consumer Expectations Index Prev: 50.9 Forecast: 50.9 Actual: 52.9 | Measures households’ outlook for personal finances, business conditions and employment; traders monitor it as a signal of prospective consumer demand and growth. |
| 2026-11-20 Friday 10:00 | Medium | UoM 5-year Consumer Inflation Expectation Prev: 3.4 Forecast: 3.4 Actual: 3.3 | Measures households’ longer-term inflation outlook; traders monitor whether expectations remain anchored, which can influence monetary-policy expectations and bond yields. |
| 2026-11-20 Friday 12:00 | Medium | President Trump Speaks Prev: — Forecast: — Actual: — | Presidential remarks may address fiscal, trade or regulatory policy; traders monitor them for potential implications for corporate earnings, growth and market uncertainty. |
| 2026-11-20 Friday 12:15 | Medium | Fed's Cook speech Prev: — Forecast: — Actual: — | Remarks can provide insight into the policymaker’s economic assessment and policy preferences; traders monitor them for shifts in the expected interest-rate path. |
Summary: The calendar centers on U.S. household attitudes, inflation expectations and policy communication.
Conclusion: The scheduled survey releases are clustered in a single publication window.
Market News Summary:
Friday afternoon coverage centered on a semiconductor selloff, Nvidia accounting scrutiny, and rotation away from AI stocks amid elevated volatility.
Primary Drivers & Risks:
- Primary Driver: Nvidia-led semiconductor and AI equity selloff
- Primary Risk: Accounting scrutiny and AI financing concerns
Tone:
Risk-off, with technology under pressure and defensive rotation in focus.
Data, Market and System
Geopolitical:
- California’s attorney general subpoenaed Nvidia over whether its chips or confidential information reached China.
- Donald Trump, Xi Jinping, and Vladimir Putin discussed nuclear security, energy supplies, and global stability, with a reported pledge to increase gas and diesel supplies.
Oil / Energy:
- Jet fuel prices were double year-earlier levels amid the Iran war, contributing to the highest holiday airfares in a decade.
Gold / Metals:
- Gold and junior gold miners sold off, while separate commentary identified rising real yields and a stronger dollar as pressures on precious metals.
- Market commentary identified $3,500 spot gold and $3,573 gold futures as support levels during Friday’s deepening decline.
Fed / Financials:
- Economists described the Fed as focused on fighting inflation and continuing interest-rate increases despite the equity selloff.
- Nvidia’s circular financing arrangements and the debt supporting AI investment faced renewed scrutiny.
Conclusion:
Nvidia’s reported accounting investigation and Broadcom’s reported AI chip order reduction dominated the equity news flow. Semiconductor losses and elevated volatility were central pressures on technology-heavy index exposure.
Rotation into value and defensive sectors provided a counterweight to AI weakness. Inflation-focused Fed commentary, AI financing concerns, and energy-related cost pressures added cross-currents, while gold also declined.
Market News Sentiment
Sentiment Bias shows the balance of positive and negative news coverage sampled from 2026-11-19 16:00 to 2026-11-20 15:55 ET, covering stocks, energy and gold.
▼ Market news
- Bias
- ▼ -17.50%
- Articles
- 240
- Positive
- ▲ 21.25%
- Neutral
- — 40.00%
- Negative
- ▼ 38.75%
▼ GLD / Gold
- Bias
- ▼ -31.58%
- Articles
- 19
- Positive
- ▲ 26.32%
- Neutral
- — 15.79%
- Negative
- ▼ 57.89%
Sentiment Summary: Gold coverage was predominantly negative (58% versus 26% positive), with elevated yields, dollar strength and tighter Fed expectations pressuring bullion from November 19 into November 20 as reports described metals selling to raise cash. Gold traded near $3,568 after November 20’s final Michigan consumer sentiment reading met expectations at 51.5 and inflation expectations eased, but later coverage highlighted pressure toward $3,500 support. ETF inflows and Q3 central-bank purchases of 321 tonnes provided counterweights without reversing the reported weakness.
Conclusion: Simultaneous gold and equity declines highlighted broad risk aversion rather than a straightforward rotation into bullion.
▲ USO / Oil
- Bias
- ▲ +15.38%
- Articles
- 13
- Positive
- ▲ 38.46%
- Neutral
- — 38.46%
- Negative
- ▼ 23.08%
Sentiment Summary: Oil coverage leaned modestly positive, with 38% positive, 23% negative and 38% neutral, as November 19 reports linked crude gains to Houthi attacks on Riyadh and Middle East supply concerns. November 20 coverage shifted toward supply counterweights: steady Middle East exports, rising U.S. inventories and recovering global supply accompanied WTI and Brent declines, despite persistent shipping threats ahead of the OPEC+ meeting. Separately, chip exports surpassed oil and gas exports over the four quarters through Q2 2026, highlighting technology’s growing economic weight.
Conclusion: The main energy-market tension remains geopolitical disruption risk against improving supply availability.
Glossary: Sentiment Bias = (positive articles − negative articles) ÷ total articles × 100. It ranges from −100% negative to +100% positive. A reading near zero indicates little directional bias. Neutral articles reduce the score’s strength. ▲ positive; ▼ negative; — balanced. These readings describe news coverage, not market-price direction.
Market Technical Analysis
Analysis of VIX volatility, the completed session in major ETFs and mega-cap tech stocks, and futures snapshots and higher-time-frame analysis.
Major ETFs and Mega Cap Tech Stocks
- Nvidia fell 12% following reports of an SEC accounting investigation and stood 46% below its October record.
- Broadcom dropped 12% Friday afternoon after an analyst reported that Google removed about one million Broadcom-designed AI chips from its 2027 plans.
- The VIX was above 31 as negative technology headlines accompanied heightened market volatility.
- Investors rotated into value and defensive stocks, while diversification helped cushion the broader market.
- The day’s largest reported options trade was a bearish position in the VanEck Semiconductor ETF targeting an additional 8% decline.
- Michael Burry reported selling half his Nvidia and semiconductor ETF put options to realize gains after the technology selloff.
- SpaceX traded below its IPO price, adding to coverage of pressure on recently listed growth stocks.
- The S&P 500 lost 2% on November 19, while Anthropic closed its debut session 17.1% above its offer price.
ETF, Mag7, and Cross-Market ETF Insights
Overall Tone
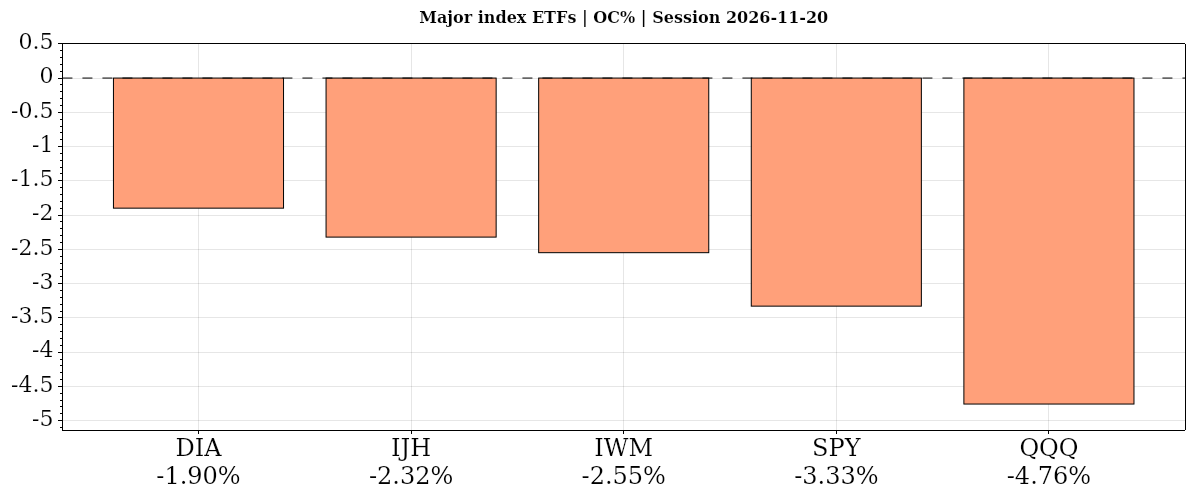
The 2026-11-20 daily session was risk-off: every index ETF and Mag7 stock fell from the open and versus the prior close, while bonds and oil diverged positively.
| Instrument | Bias | Date | DNC% | DOC% | O | H | L | C | VWAP | Vol |
|---|---|---|---|---|---|---|---|---|---|---|
| ▼ DIA | ▼ ▼ ▼ | 2026-11-20 | ▼ -1.98% | ▼ -1.90% | 490.39 | 495.28 | 479.40 | 481.08 | ▼ 487.37 | 5,740,632 |
| ▼ IJH | ▼ ▼ ▼ | 2026-11-20 | ▼ -2.68% | ▼ -2.32% | 70.23 | 70.86 | 68.45 | 68.60 | ▼ 69.50 | 18,406,965 |
| ▼ IWM | ▼ ▼ ▼ | 2026-11-20 | ▼ -2.88% | ▼ -2.55% | 263.32 | 265.85 | 256.32 | 256.61 | ▼ 260.18 | 56,036,641 |
| ▼ SPY | ▼ ▼ ▼ | 2026-11-20 | ▼ -3.64% | ▼ -3.33% | 713.56 | 718.29 | 686.75 | 689.81 | ▼ 699.84 | 148,966,754 |
| ▼ QQQ | ▼ ▼ ▼ | 2026-11-20 | ▼ -5.67% | ▼ -4.76% | 638.84 | 643.28 | 606.23 | 608.45 | ▼ 621.97 | 133,390,116 |
| AVG/Sum | — | — | -3.37% | -2.97% | — | — | — | — | — | 362,541,108 |
Index ETFs
Negative confluence: average DOC% -2.97% from the open, DNC% -3.37% versus the prior close. DIA led relative resilience and QQQ lagged on both comparisons, with mid- and small-caps outperforming SPY. All five closed below VWAP on above-average volume; QQQ’s moving-average downtrends remained aligned.
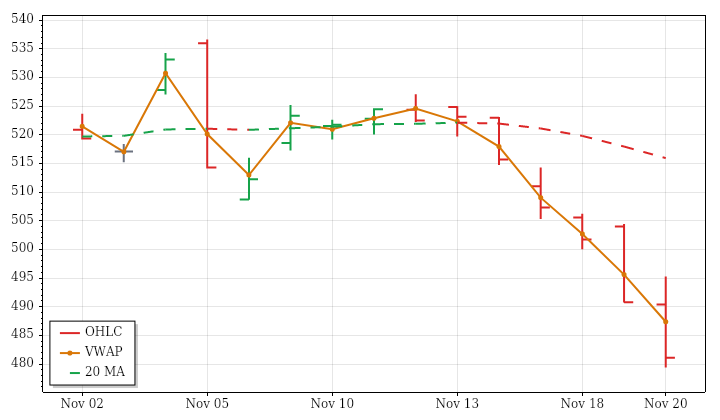
DIA · D:2026-11-20 NC% ▼ -1.98% OC% ▼ -1.90%
DIA – Dow Jones Technicals Summary
DIA closed its completed November 20 daily session at 481.08, losing 1.98% versus the prior close and 1.90% from the open. A small opening gap lower was filled, but trading ultimately produced a lower high, lower low and close below the prior day's low. Finishing beneath session VWAP kept the closing position weak despite trading on both sides of the open.
The decline aligned with the preceding 15-session price downtrend and falling near- and intermediate-term averages. Far-term conditions remained mixed because price was below a still slightly rising benchmark. The day's range exceeded twice average, extending the lookback tendency toward wider ranges, while volume rose above average against its declining trend. PSAR and ATR-median remained bearish. A next-session high above 507.0308 would trigger a PSAR upward reversal, but the completed session did not establish that change.
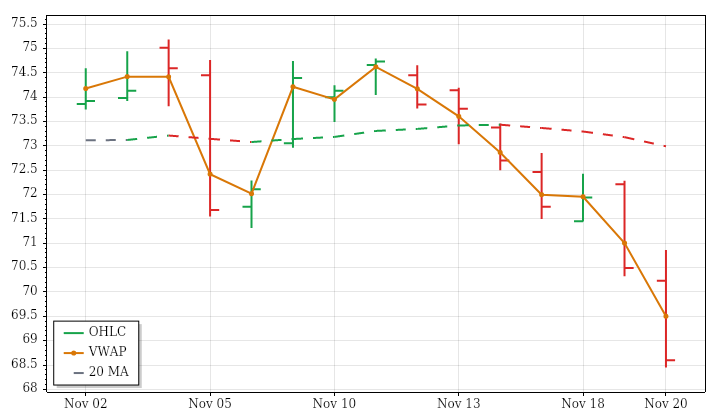
IJH · D:2026-11-20 NC% ▼ -2.68% OC% ▼ -2.32%
IJH – Mid Cap Technicals Summary
IJH closed the completed November 20 daily session at 68.60, down 2.68% from the prior close and 2.32% from the open. Its opening gap lower was filled, but price could not sustain that recovery. A lower high and lower low culminated in a close near the session low, below the prior day's low and session VWAP, leaving the daily structure clearly weak.
The latest decline agreed with the preceding 15-session price downtrend and falling near-, intermediate- and far-term averages. Participation and volatility intensified for this session: range was roughly 1.88 times average and volume slightly more than twice average. Both stood against lookback trends of contracting ranges and decreasing volume. PSAR and ATR-median also remained bearish. A next-session high above 73.331 would trigger a PSAR upward reversal; until that condition occurs, it is only a possible state change.
IWM · D:2026-11-20 NC% ▼ -2.88% OC% ▼ -2.55%
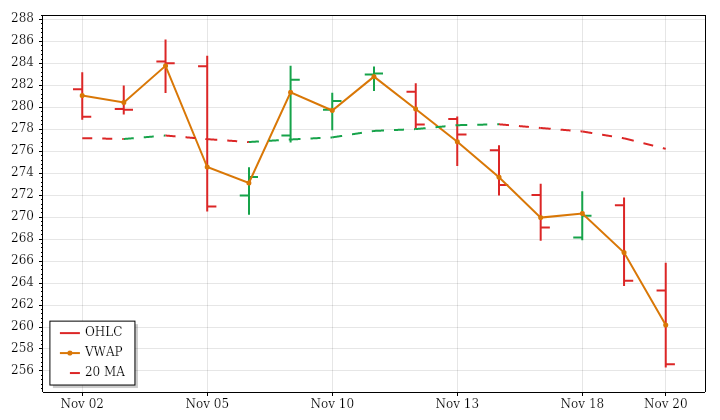
IWM – Small Cap Technicals Summary
IWM's completed daily session on November 20 ended at 256.61, losing 2.88% versus the prior close and 2.55% from the open. The opening gap lower was filled, but the session then finished near its low, beneath both the prior day's low and VWAP. A lower high and lower low, together with a second consecutive large-range bar, extended the weak daily structure.
The decline aligned with the preceding 15-session price downtrend and with falling near-, intermediate- and far-term averages. The latest range reached about 1.79 times average and volume 2.14 times average, a marked departure from contracting ranges and declining volume over the lookback. PSAR and ATR-median remained bearish, supporting the agreement among trend horizons. A next-session high above 271.9754 would trigger a PSAR upward reversal, but no such reversal was established by this completed session.
SPY · D:2026-11-20 NC% ▼ -3.64% OC% ▼ -3.33%
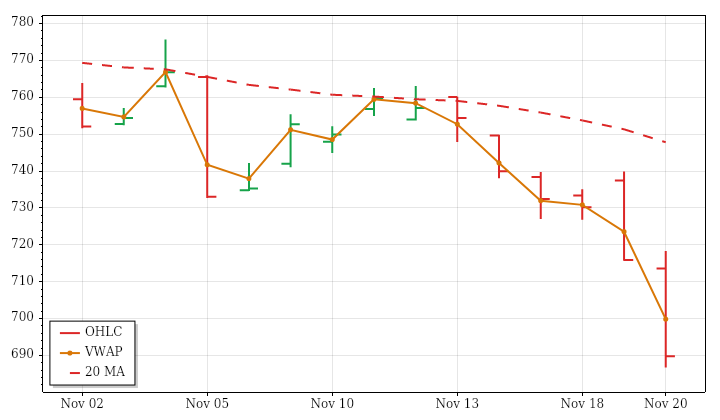
SPY – S&P 500 Technicals Summary
SPY closed the completed November 20 daily session at 689.81, falling 3.64% versus the prior close and 3.33% from the open. Although the opening gap lower was filled, price subsequently made a lower high and lower low and finished beneath the prior day's low and session VWAP. The prior outside bar's low was also breached, extending the weak daily structure.
The session aligned with the preceding 15-session decline and near- and intermediate-term downtrends. Far-term conditions remained mixed because price was below an average that still tilted upward. Range and volume were each roughly two-and-a-half times average: wider movement extended the lookback range expansion, while heavier volume contrasted with declining participation. PSAR and ATR-median remained bearish. A next-session high above 739.8999 would conditionally trigger a PSAR upward reversal; the completed session itself supplied no such change.
S&P 500 News and Fundamentals
The S&P 500’s losing streak reached six sessions, marking its worst stretch since the 2025 “Liberation Day” tariffs. Its latest session featured early buying that faded by the close. Reports linked the reversal to AI-related concerns, a surprise CEO departure and the possibility of renewed Federal Reserve rate increases.
QQQ · D:2026-11-20 NC% ▼ -5.67% OC% ▼ -4.76%
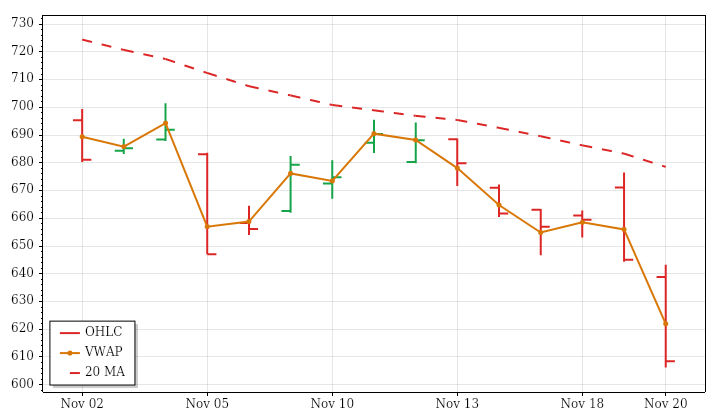
QQQ – Nasdaq 100 Technicals Summary
QQQ's completed daily session on November 20 closed at 608.45, down 5.67% from the prior close and 4.76% from the open. The opening gap lower remained unfilled. Price made a lower high and lower low, breached the prior outside bar's low, and finished near the session low below both the prior day's low and VWAP.
The decline reinforced the preceding 15-session price downtrend and aligned near-, intermediate- and far-term downtrends. Range exceeded twice average, consistent with the lookback expansion in daily ranges. Volume also exceeded twice average, but this represented a reversal of the recent tendency toward decreasing participation rather than a continuation of it. The second consecutive large-range bar accompanied bearish PSAR and ATR-median states. A next-session high above 682.2388 would trigger a PSAR upward reversal, remaining a conditional threshold rather than evidence of an existing recovery.
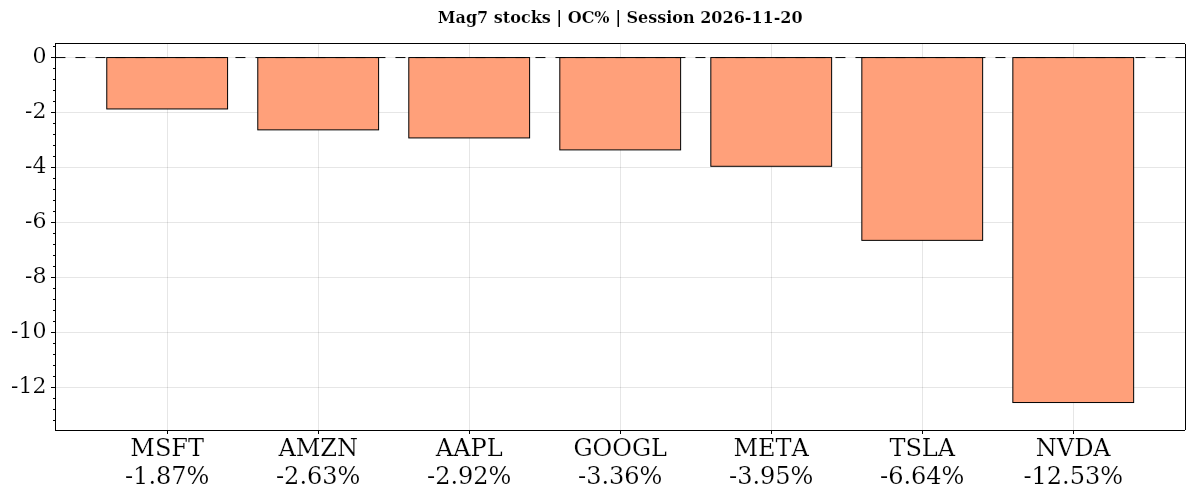
| Instrument | Bias | Date | DNC% | DOC% | O | H | L | C | VWAP | Vol |
|---|---|---|---|---|---|---|---|---|---|---|
| ▼ MSFT | ▼ ▼ ▼ | 2026-11-20 | ▼ -2.77% | ▼ -1.87% | 493.74 | 503.80 | 481.03 | 484.52 | ▼ 488.70 | 46,623,759 |
| ▼ AMZN | ▼ ▼ ▼ | 2026-11-20 | ▼ -4.10% | ▼ -2.63% | 253.48 | 259.97 | 245.31 | 246.82 | ▼ 250.31 | 72,942,263 |
| ▼ AAPL | ▼ ▼ ▼ | 2026-11-20 | ▼ -1.90% | ▼ -2.92% | 352.87 | 354.34 | 340.56 | 342.56 | ▼ 345.29 | 80,492,641 |
| ▼ GOOGL | ▼ ▼ ▼ | 2026-11-20 | ▼ -2.70% | ▼ -3.36% | 274.50 | 283.15 | 264.22 | 265.29 | ▼ 271.92 | 57,387,041 |
| ▼ META | ▼ ▼ ▼ | 2026-11-20 | ▼ -5.93% | ▼ -3.95% | 583.91 | 588.69 | 558.68 | 560.84 | ▼ 570.03 | 25,683,371 |
| ▼ TSLA | ▼ ▼ ▼ | 2026-11-20 | ▼ -7.64% | ▼ -6.64% | 370.43 | 373.88 | 344.33 | 345.82 | ▼ 354.21 | 45,329,344 |
| ▼ NVDA | ▼ ▼ ▼ | 2026-11-20 | ▼ -14.01% | ▼ -12.53% | 143.52 | 143.72 | 124.50 | 125.53 | ▼ 132.95 | 621,681,213 |
| AVG/Sum | — | — | -5.58% | -4.84% | — | — | — | — | — | 950,139,632 |
Mag7 Stocks
Negative confluence: average DOC% -4.84% from the open, DNC% -5.58% versus the prior close. MSFT declined least from the open, while AAPL was most resilient versus the prior close; NVDA lagged sharply on both measures. All seven comparisons aligned negatively, though AAPL and MSFT retained rising longer-term structures, unlike NVDA’s aligned downtrends.
MSFT · D:2026-11-20 NC% ▼ -2.77% OC% ▼ -1.87%
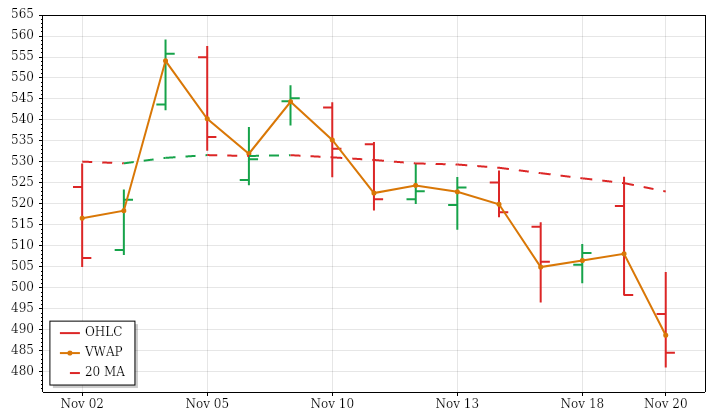
MSFT – Microsoft Technicals Summary
MSFT's completed November 20 daily session closed at 484.52, declining 2.77% from the prior close and 1.87% from the open. An opening gap lower was filled, but price later finished below the prior day's low and session VWAP. The lower high and lower low, along with a breach of the prior outside bar's low, extended the immediate weakness.
That weakness matched the preceding 15-session decline and near-term downtrend, but not the entire longer-term structure. Intermediate conditions were mixed, with price below a still rising average, while the far-term uptrend remained intact with price above its rising benchmark. Range was about 1.41 times average and volume 1.57 times average, interrupting lookback contraction and declining volume. PSAR and ATR-median remained bearish. A next-session high above 536.7737 would trigger a PSAR upward reversal, a conditional possibility rather than a completed signal.
Microsoft News and Fundamentals
Microsoft is broadening its enterprise AI strategy across business software, cloud infrastructure, proprietary models, data and security. November’s outage reportedly produced limited direct costs because seat subscriptions continued and service credits required customer claims. A shift toward usage billing could increase revenue exposure when Copilot tasks fail, although that exposure remains small. Azure continued operating during the outage and grew 48% last quarter; Microsoft’s reported backlog stood at $677 billion.
AMZN · D:2026-11-20 NC% ▼ -4.10% OC% ▼ -2.63%
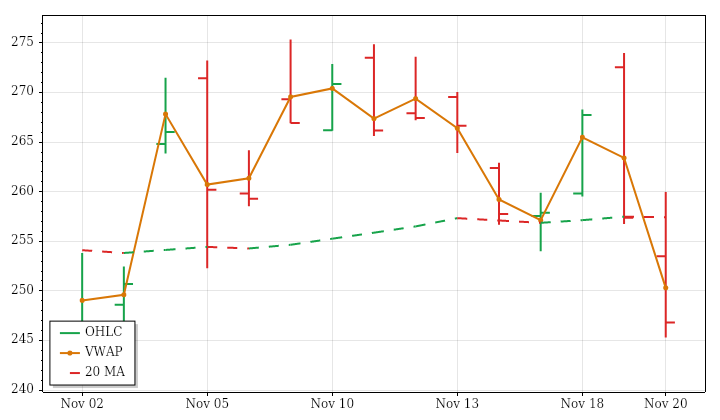
AMZN – Amazon Technicals Summary
AMZN's completed November 20 daily session ended at 246.82, down 4.10% from the prior close and 2.63% from the open. The opening gap lower was filled, but that recovery did not hold: price subsequently closed near the session low, beneath the prior day's low and VWAP. This was the third consecutive large-range bar, with the latest range roughly 1.57 times average and volume 1.37 times average.
The session challenged the preceding 15-session price uptrend. Across near-, intermediate- and far-term horizons, price was below benchmarks whose averages remained upward-sloping, leaving all three structures mixed rather than fully aligned downtrends. The latest expansion in activity also interrupted contracting range and declining volume trends. A bearish ATR-median crossover accompanied the short PSAR state. Only a next-session high above 274 would trigger the specified PSAR upward reversal.
Amazon News and Fundamentals
Amazon said it would increase delivery fees in New York City if the City Council passes a delivery bill, creating a potential cost increase tied to local regulation. Separately, AWS posted its fastest growth in nearly five years, while Amazon’s heavy spending and cash outflows remained a focus.
AAPL · D:2026-11-20 NC% ▼ -1.90% OC% ▼ -2.92%
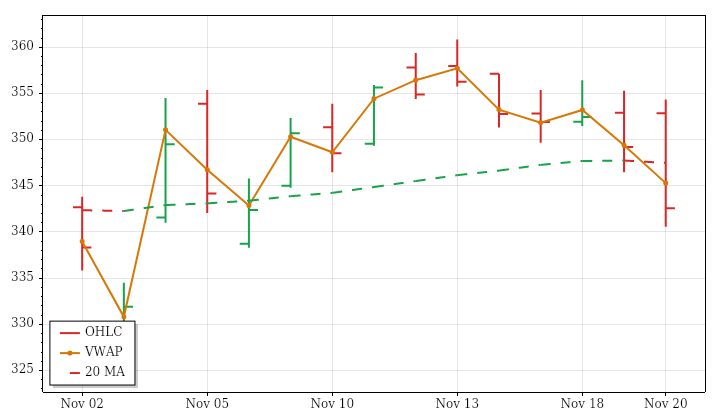
AAPL – Apple Technicals Summary
AAPL's completed daily session on November 20 closed at 342.56, down 1.90% from the prior close and 2.92% from the open. An opening gap higher was filled before price finished below the prior day's low and session VWAP. The lower high and lower low reinforced the day's weakness. Range reached roughly 1.68 times average and volume 1.60 times average, contrasting with contracting ranges and declining volume over the preceding 15 sessions.
The decline conflicted with the lookback price uptrend and an intact far-term uptrend. Near- and intermediate-term conditions were mixed: price stood below both benchmarks even though their averages were still rising. PSAR turned downward while the ATR-median trend remained positive, adding another disagreement. A next-session high above 359.8165 would trigger a PSAR upward reversal; that remains conditional rather than an established recovery.
Apple News and Fundamentals
Apple is developing an autonomous AI agent capable of controlling apps, browsing the web and writing code, Bloomberg reported on November 19. Job listings outline plans for a proactive, agentic assistant, including a search for a senior engineering manager to lead development. The software is described as capable of operating a Mac on a user’s behalf, marking an expansion of Apple’s AI assistant efforts.
GOOGL · D:2026-11-20 NC% ▼ -2.70% OC% ▼ -3.36%
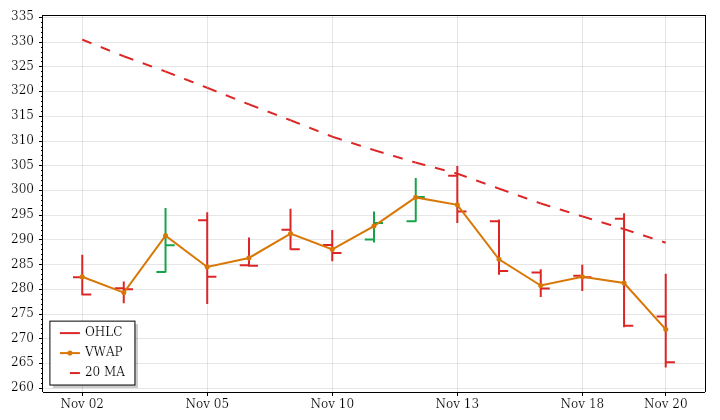
GOOGL – Alphabet Technicals Summary
GOOGL ended its completed November 20 daily session at 265.29, down 2.70% versus the prior close and 3.36% from the open. The opening gap higher was filled, and price subsequently finished near the day's low, below the prior day's low and session VWAP. Its closing position was just 0.40% above the 52-week low, emphasizing the weakness of the latest daily bar.
Near-, intermediate- and far-term downtrends were aligned, despite a marginally positive price trend across the preceding 15 sessions. That small lookback gain therefore did not represent agreement with the broader moving-average structure. The latest range was nearly twice average, consistent with expanding ranges, while above-average volume interrupted a declining volume trend. Both PSAR and ATR-median remained bearish. A next-session high above 298.2942 would trigger a PSAR upward reversal, not confirm one in the completed session.
META · D:2026-11-20 NC% ▼ -5.93% OC% ▼ -3.95%
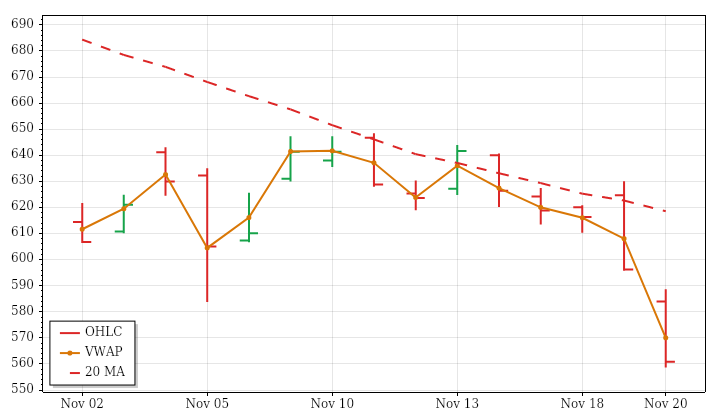
META – Meta Platforms Technicals Summary
META closed its completed November 20 daily session at 560.84, down 5.93% from the prior close and 3.95% from the open. The opening gap lower remained unfilled, adding to the intraday loss. Price finished near the session low, below the prior day's low and VWAP, after making a lower high and lower low and breaching the prior outside bar's low.
Near- and intermediate-term downtrends agreed with the latest weakness, while the far-term picture remained mixed because its average was still rising beneath neither price nor the shorter benchmarks: price was below it. The marginally positive 15-session price trend contrasted with this weak positioning. Range and volume were both about one-and-a-half times average despite contracting and declining lookback trends. ATR-median joined PSAR in a bearish state. A next-session high above 630.06 would conditionally trigger a PSAR upward reversal.
Meta News and Fundamentals
Meta said on November 19 that it was reconsidering its 2030 deadline for achieving net-zero emissions because of the artificial intelligence boom. The reassessment connects the company’s expanding AI infrastructure ambitions with pressure on its existing climate commitments.
TSLA · D:2026-11-20 NC% ▼ -7.64% OC% ▼ -6.64%
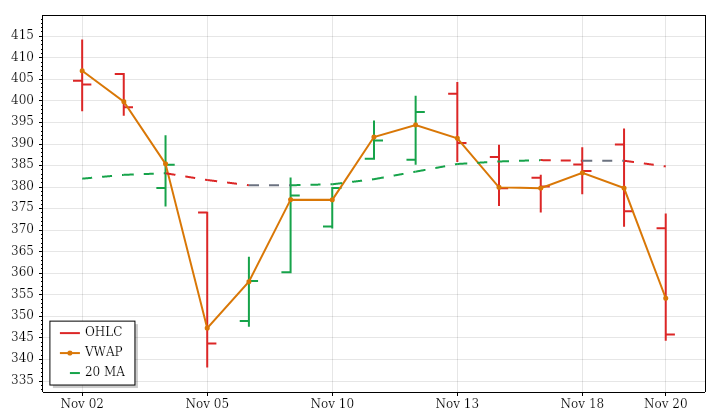
TSLA – Tesla Technicals Summary
TSLA closed its completed daily session on November 20 at 345.82, down 7.64% versus the prior close and 6.64% from the open. The opening gap lower remained unfilled, and the session finished near its low, below the prior day's low and VWAP. A lower high and lower low and a breach of the prior outside bar's low reinforced the immediate weakness.
The decline agreed with the preceding 15-session price downtrend and falling near- and far-term averages. Intermediate conditions were mixed: price stood below an average that was still rising, so the horizons were not fully aligned. Range was approximately 1.81 times average and volume 1.27 times average, contrasting with contracting ranges and declining volume over the lookback. PSAR was in a short state and ATR-median remained bearish. A next-session high above 404.4 would conditionally trigger a PSAR upward reversal.
Tesla News and Fundamentals
Tesla plans to increase Shanghai production despite a 66.1% decline in October mainland China deliveries, as exports rise and Chinese EV demand weakens. Shares fell more than 3% on November 20 as analysts questioned the benefits of a possible SpaceX combination. HSBC cited speculation about such a deal in reassessing Tesla; a combination remained speculative.
NVDA · D:2026-11-20 NC% ▼ -14.01% OC% ▼ -12.53%
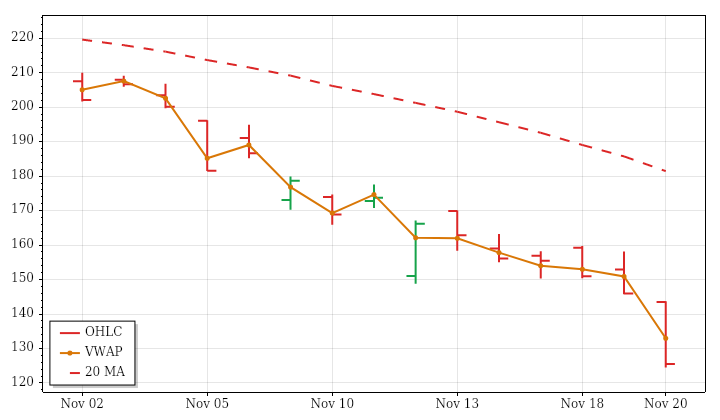
NVDA – Nvidia Technicals Summary
NVDA ended the completed November 20 daily session at 125.53, down 14.01% versus the prior close and 12.53% from the open. The opening gap lower remained unfilled, and price finished near the day's low, below the prior day's low and session VWAP. The close was less than 1% above the 52-week low, placing the latest sharp loss near the bottom of the supplied annual range.
Near-, intermediate- and far-term downtrends aligned with the pronounced preceding 15-session decline. The latest range was approximately twice average and volume nearly twice average, reinforcing existing trends toward wider ranges and increasing volume rather than contradicting them. A third consecutive large-range bar and bearish PSAR and ATR-median states further characterized the ongoing weakness. A next-session high above 158.1301 would trigger a PSAR upward reversal; that condition was not established here.
Nvidia News and Fundamentals
Nvidia fell 12% on November 20 after Reuters reported that SEC enforcement staff were examining potential accounting issues. California Attorney General Rob Bonta also subpoenaed Nvidia over whether chips or confidential information reached China. Former CEO Jensen Huang is set to appear publicly before the Senate banking committee, according to Senator Tim Scott’s office. Separately, reported revenue more than doubled to $115.8 billion, with Vera Rubin contributing nearly $20 billion, while supply constraints and higher costs pressured growth and margins.
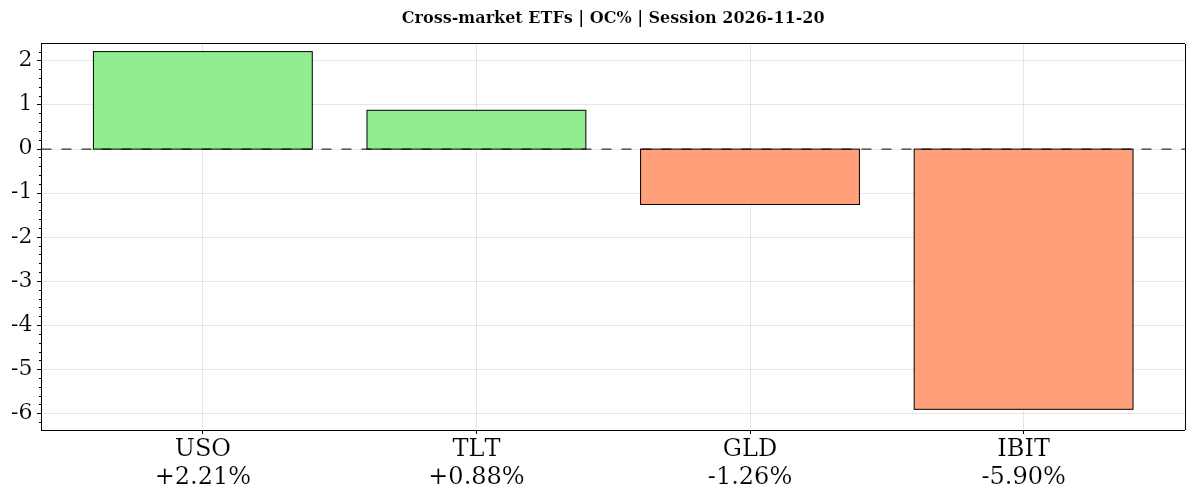
| Instrument | Bias | Date | DNC% | DOC% | O | H | L | C | VWAP | Vol |
|---|---|---|---|---|---|---|---|---|---|---|
| ▲ USO | ▲ ▲ ▲ | 2026-11-20 | ▲ +1.12% | ▲ +2.21% | 136.61 | 139.79 | 135.13 | 139.63 | ▲ 137.33 | 4,521,098 |
| ▲ TLT | ▲ ▲ ▲ | 2026-11-20 | ▲ +1.37% | ▲ +0.88% | 80.74 | 81.71 | 80.69 | 81.45 | ▲ 81.26 | 65,121,057 |
| ▼ GLD | ▼ ▼ ▼ | 2026-11-20 | ▼ -3.67% | ▼ -1.26% | 326.98 | 328.60 | 320.95 | 322.87 | ▼ 324.26 | 23,070,411 |
| ▼ IBIT | ▼ ▼ ▼ | 2026-11-20 | ▼ -5.87% | ▼ -5.90% | 35.09 | 35.12 | 32.62 | 33.02 | ▼ 33.60 | 108,528,505 |
| AVG/Sum | — | — | -1.77% | -1.02% | — | — | — | — | — | 201,241,071 |
Cross-Market ETFs
Negative confluence: average DOC% -1.02% from the open, DNC% -1.76% versus the prior close. Oil led from the open, but bonds led versus the prior close; both rose against falling equities. Bitcoin lagged both comparisons, while gold also declined within aligned moving-average downtrends.
USO · D:2026-11-20 NC% ▲ +1.12% OC% ▲ +2.21%
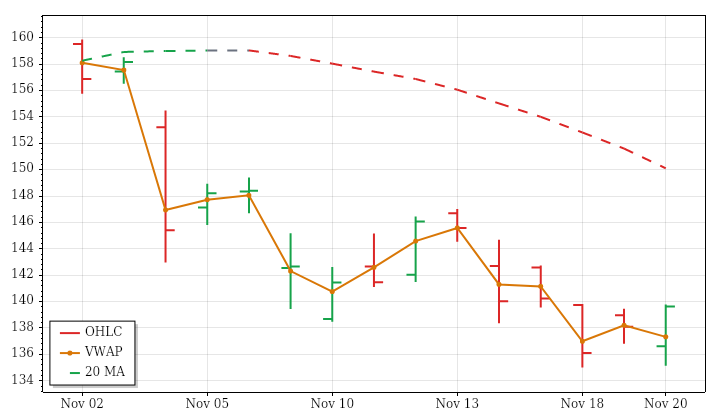
USO – Oil Technicals Summary
USO's completed November 20 daily session closed at 139.63, up 1.12% from the prior close and 2.21% from the open. The larger intraday gain reflects recovery from an opening gap lower, which was filled. An outside bar breached both prior-pattern boundaries before finishing near the session high, above the prior day's high and VWAP. Range was only modestly above average, while volume remained below average.
The rebound opposed the preceding 15-session price decline and near- and intermediate-term downtrends, although it agreed with the intact far-term uptrend. Price ended just below the falling near-term benchmark, leaving the bounce short of broad trend alignment. Below-average volume remained consistent with decreasing lookback participation, while the slightly wider session interrupted range contraction. PSAR and ATR-median stayed bearish. A next-session high above 140.2723 would trigger a PSAR upward reversal, but that remains conditional.
Oil News and Fundamentals
WTI and Brent futures fell as steady Middle Eastern exports heightened surplus concerns, outweighing worries about attacks on tankers and energy infrastructure. Rising U.S. inventories and recovering global supply also pressured prices, with WTI near $80 a barrel. Persistent shipping risks and an upcoming OPEC+ meeting remained key developments for the oil market.
TLT · D:2026-11-20 NC% ▲ +1.37% OC% ▲ +0.88%
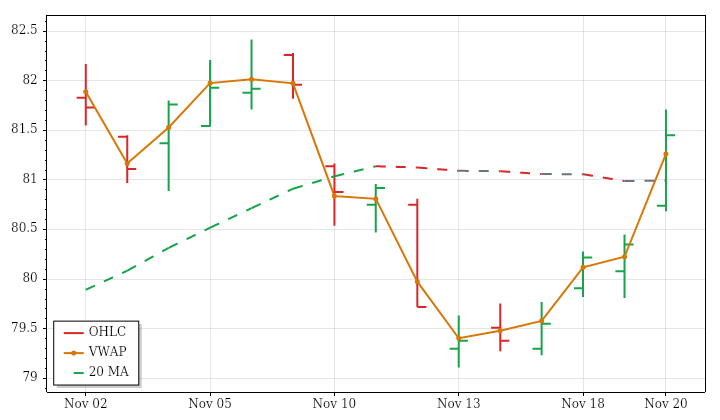
TLT – Long-Term Treasury Bonds Technicals Summary
TLT's completed November 20 daily session ended at 81.45, gaining 1.37% from the prior close and 0.88% from the open. The opening gap higher remained unfilled. Price made a higher high and higher low, breached the prior outside bar's high, and closed above the prior day's high and session VWAP, giving the latest daily action a constructive character.
The advance conflicted with the preceding 15-session decline and far-term downtrend. Near-term conditions were mixed because price had moved above a still falling average, while the intermediate-term uptrend aligned with the session's strength. Range reached about 1.65 times average and volume 1.75 times average, interrupting contracting ranges and declining volume. PSAR was positive, but ATR-median remained bearish. A next-session low below 79.2409 would trigger a PSAR downward reversal, preserving a conditional distinction between current strength and possible deterioration.
GLD · D:2026-11-20 NC% ▼ -3.67% OC% ▼ -1.26%
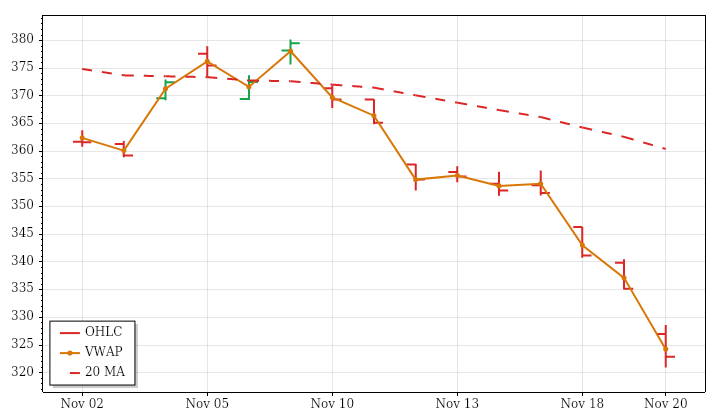
GLD – Gold Technicals Summary
GLD's completed daily session on November 20 closed at 322.87, down 3.67% from the prior close and 1.26% from the open. The larger prior-close loss reflects an opening gap lower that remained unfilled. Price made a lower high and lower low, finished below the prior day's low and session VWAP, and ended only 0.60% above its 52-week low.
This weakness aligned with falling near-, intermediate- and far-term averages and the preceding 15-session price downtrend. Range was about 1.70 times average and volume 2.27 times average, reinforcing existing trends toward expanding ranges and increasing participation. Five consecutive large-range bars indicate that the latest session was part of an ongoing volatile sequence rather than an isolated expansion. PSAR and ATR-median remained bearish; a next-session high above 357.0201 would conditionally trigger a PSAR upward reversal.
Gold News and Fundamentals
Gold’s selloff deepened on November 20, with restrictive Federal Reserve expectations and dollar strength reportedly outweighing ETF inflows. Earlier, bullion traded near $3,568 an ounce after November’s final University of Michigan consumer sentiment reading came in at 51.5, matching expectations, while inflation expectations declined. Walsh Trading’s Sean Lusk warned that a break below $3,500 could trigger further losses and said buyers might remain cautious until early December.
IBIT · D:2026-11-20 NC% ▼ -5.87% OC% ▼ -5.90%
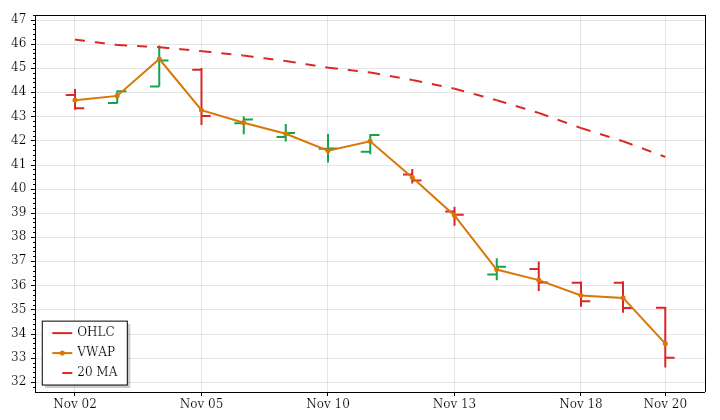
IBIT – Bitcoin Technicals Summary
IBIT's completed November 20 daily session closed at 33.02, falling 5.87% from the prior close and 5.90% from the open. The nearly unchanged opening left most of the loss within the session itself. Price formed a lower high and lower low, breached the prior outside bar's low, and finished beneath the prior day's low and session VWAP. The close remained close to the 52-week low.
The selloff reinforced the preceding 15-session decline and aligned near- and intermediate-term downtrends. Far-term conditions were still mixed because price lay below a barely rising average. Range expanded to roughly 2.36 times average and volume doubled, contrasting with modest contraction and declining participation across the lookback. This was the fourth consecutive large-range bar. Bearish PSAR and ATR-median states persisted; a next-session high above 36.9688 would conditionally trigger a PSAR upward reversal.
Glossary: Instrument — ticker symbol; hover for the instrument or company name; Date — session date. DNC% — prior-session close to this session’s close; DOC% — daily session open-to-close percentage change. O — open; H — high; L — low; C — close, all for the table’s daily or weekly session; VWAP — volume-weighted average price; its arrow shows whether the close is above or below VWAP. Vol — period trading volume.
Bias — three directional readings, in order: DNC%, DOC%, then VWAP. ▲ positive/above; ▼ negative/below; — neutral or unavailable. Matching arrows show alignment; opposing arrows show mixed conditions. AVG/Sum — simple average of percentage changes and sum of reported volumes.
Futures Session Fib Grid Analysis – Snapshot
Session Fib Grids normalise market positioning as percentages, making direction and alignment comparable across different asset types.
Latest available snapshot for each instrument; Time(CT) shows the individual update date and time.
| Instrument | Bias | Time(CT) | YSFG | MSFG | WSFG | RSFG | SFG | TSI |
|---|---|---|---|---|---|---|---|---|
| ▼ ES | ▼ ▼ ▼ ▼ ▼ ▼ | 2026-11-20 15:59:58 | ▼ -19 | ▼ -234 | ▼ -211 | ▼ -154 | ▼ -154 | ▼ -34 |
| ▼ NQ | ▼ ▼ ▼ ▼ ▼ ▼ | 2026-11-20 15:59:58 | ▼ -31 | ▼ -140 | ▼ -146 | ▼ -141 | ▼ -141 | ▼ -53 |
| ▼ YM | ▼ ▼ ▼ ▼ ▼ ▼ | 2026-11-20 15:59:56 | ▼ -25 | ▼ -162 | ▼ -226 | ▼ -105 | ▼ -105 | ▼ -34 |
| ▼ EMD | ▼ ▼ ▼ ▼ ▼ ▼ | 2026-11-20 15:58:53 | ▼ -5 | ▼ -139 | ▼ -188 | ▼ -107 | ▼ -107 | ▼ -23 |
| ▼ RTY | ▼ ▼ ▼ ▼ ▼ ▼ | 2026-11-20 15:59:57 | ▼ -2 | ▼ -160 | ▼ -187 | ▼ -119 | ▼ -119 | ▼ -63 |
| ▼ FDAX | ▼ ▼ ▼ ▼ ▼ ▼ | 2026-11-20 14:59:50 | ▼ -13 | ▼ -118 | ▼ -222 | ▼ -150 | ▼ -114 | ▼ -185 |
| ▼ NKD | ▲ ▼ ▼ ▼ ▼ ▼ | 2026-11-20 15:58:17 | ▲ +49 | ▼ -105 | ▼ -130 | ▼ -184 | ▼ -105 | ▼ -41 |
| Instrument | Bias | Time(CT) | YSFG | MSFG | WSFG | RSFG | SFG | TSI |
|---|---|---|---|---|---|---|---|---|
| ▼ BTC | ▼ ▼ ▼ ▼ ▼ ▼ | 2026-11-20 17:59:46 | ▼ -113 | ▼ -132 | ▼ -77 | ▼ -120 | ▼ -126 | ▼ -31 |
| ▼ GC | ▼ ▼ ▼ ▼ ▼ ▲ | 2026-11-20 15:59:57 | ▼ -240 | ▼ -87 | ▼ -138 | ▼ -33 | ▼ -32 | ▲ +62 |
| ▲ CL | ▲ ▼ ▼ ▲ ▲ ▲ | 2026-11-20 15:59:56 | ▲ +140 | ▼ -100 | ▼ -41 | ▲ +45 | ▲ +53 | ▲ +50 |
| ▼ 6E | ▼ ▼ ▼ ▼ ▼ ▼ | 2026-11-20 15:59:49 | ▼ -76 | ▼ -80 | ▼ -43 | ▼ -59 | ▼ -34 | ▼ -25 |
| ▲ ZB | ▼ ▼ ▲ ▲ ▲ ▼ | 2026-11-20 15:59:04 | ▼ -33 | ▼ -7 | ▲ +79 | ▲ +24 | ▲ +42 | ▼ -44 |
Glossary: YSFG — yearly; MSFG — monthly; WSFG — weekly; RSFG — regular trading hours (RTH); SFG — the current session, including pre-market or other sessions. TSI indicates trend strength and power.
Bias shows trend alignment across these six readings. The arrows follow the column order: YSFG, MSFG, WSFG, RSFG, SFG and TSI. Matching arrows show alignment; opposing arrows show mixed conditions.
Futures Higher Time Frame Analysis
Summary of the current state of US Indices Futures based on higher time-frame (HTF) technical analysis as of: 2026-11-20 16:00 -05:00 CT.
US Indices Futures
- ES YSFG below neutral zone, MSFG/WSFG bearish, below all daily benchmarks, evolving pivot support 6925.50, lower support 6482.25, swing resistance 7906.25.
- NQ below YSFG zone, MSFG/WSFG bearish, below daily benchmarks and 100-week benchmark, evolving pivot support 25088.25, lower support 23543, swing resistance 31616.50.
- YM below YSFG zone, MSFG/WSFG bearish, below daily benchmarks, evolving pivots 48054 weekly/48191 daily, lower support 45862, swing resistance 55316.
- EMD lower YSFG neutral-zone test, MSFG/WSFG bearish, below daily benchmarks, rising long-cycle weekly benchmarks, evolving pivot support 3430.7, lower support 3332.6, resistance 3969.6.
- RTY lower YSFG neutral-zone test, MSFG/WSFG bearish, below daily benchmarks, testing 100-week benchmark 2577, evolving pivot support 2585.7, lower support 2451.7, resistance 3101.8.
- FDAX below YSFG zone, MSFG/WSFG bearish, below daily benchmarks, testing 100-week benchmark 24656, evolving pivot support 24595, supports 24312/24009, swing resistance 27084.
Overall State
- Short-Term: Bearish
- Intermediate-Term: Bearish
- Long-Term: Neutral
Conclusion
Daily benchmark positioning, bearish MSFG/WSFG readings and recent short signals show correlated downside alignment across all six contracts. YSFG positioning remains below neutral zones or within their lower portions. Evolving pivot lows remain unconfirmed support; opposite-pivot thresholds are reversal references, not established resistance. Longer-term conditions diverge: daily ratings are bearish throughout, while weekly ratings remain neutral for ES/NQ and bullish for YM/EMD/RTY/FDAX. NQ has broken its 100-week benchmark and prior weekly swing low, while ES, RTY and FDAX are testing rising 100-week benchmarks.
Note: Intra-day counter-trend pullbacks or retracements may occur, HTF is context for informational usage and market structure. Glossary: Session Fib Grids periods of YSFG:’Yearly’, MSFG:’Monthly’, WSFG:’Weekly’
For full details visit: AlphaWebTrader Technicals
SPY Daily View
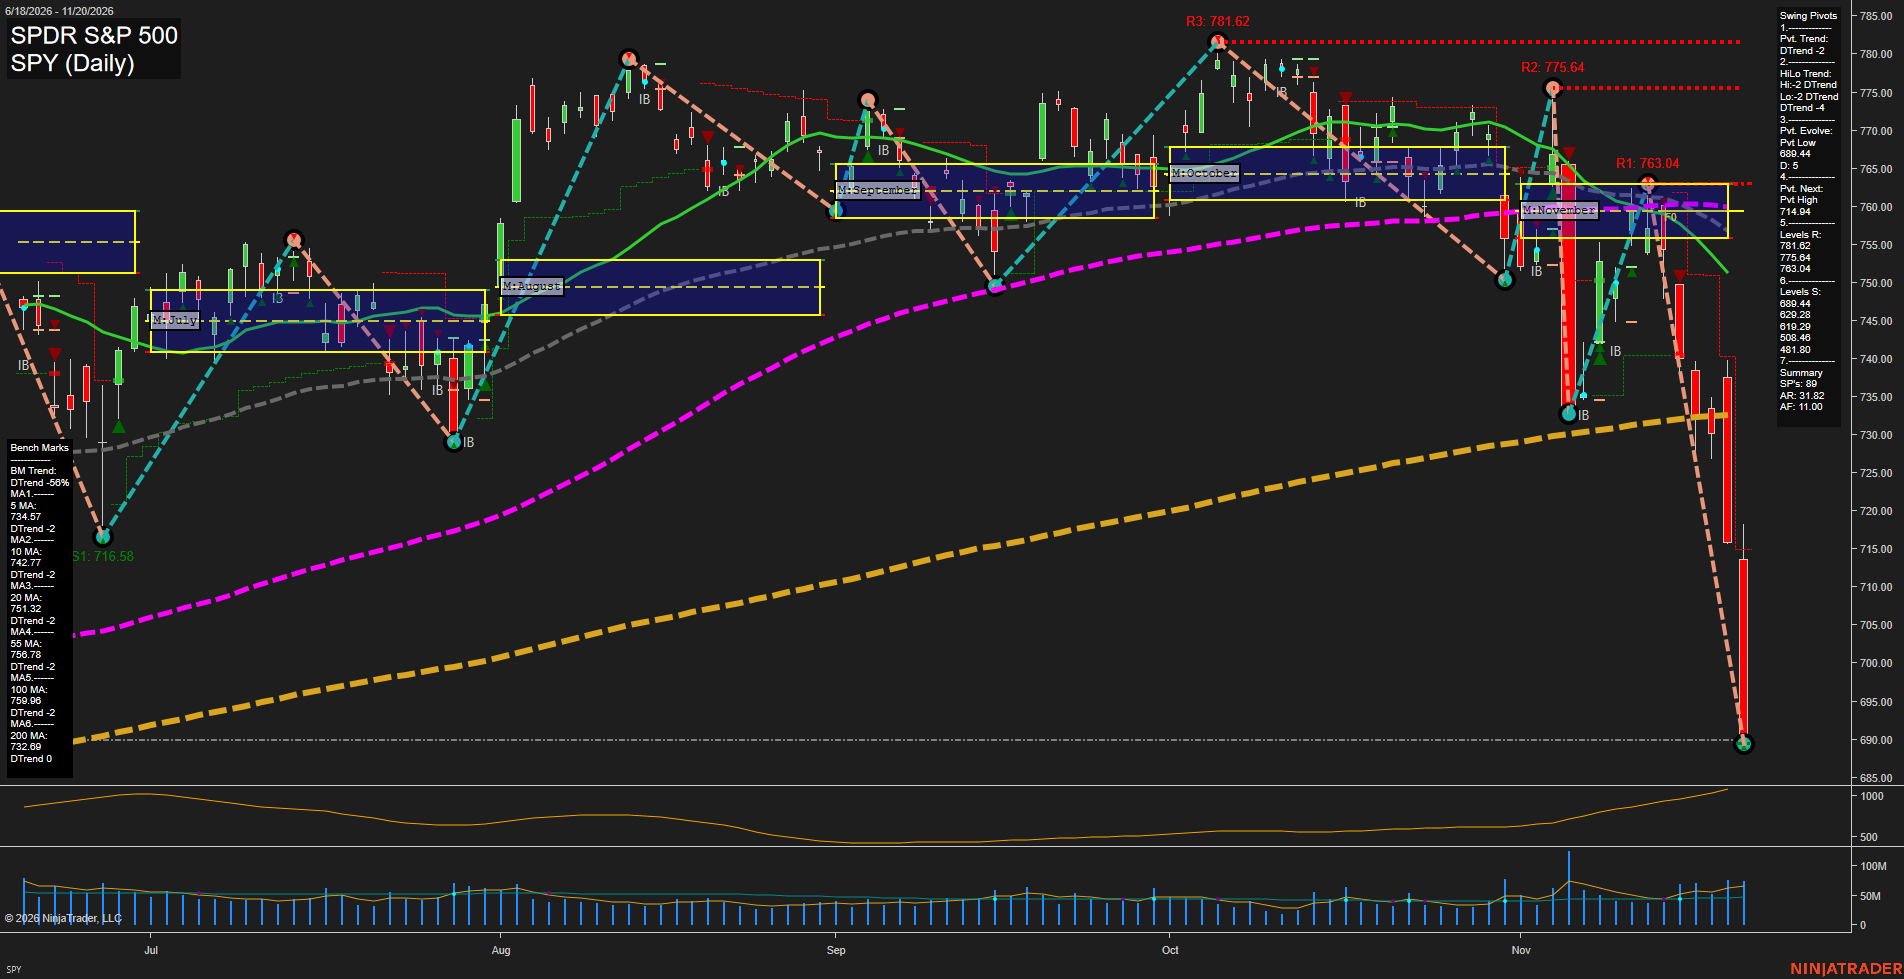
Overall Rating
- Near-Term: Bearish
- Medium-Term: Bearish
- Far-Term: Bearish.
Key Insights Summary
From a futures swing trader’s perspective, SPY indicates an accelerating equity-index downswing rather than an ordinary pullback. Lower swing highs, declining short- and medium-term averages, and large downside candles confirm bearish alignment. The rebound toward 763.04 failed, followed by a decisive break beneath the 200-day benchmark at 732.69 and an extension toward evolving support at 689.44. Price remains substantially below every benchmark; the flat 200-day average contrasts with the abrupt deterioration in price. Rising volatility and heavier recent volume reinforce the expansionary selloff. The 714.94 level is the chart’s next pivot-reversal threshold, not an established resistance pivot. The displayed November grid is visibly above price, consistent with a downside breakdown despite the neutral grid placeholders above. Weekly/yearly grid readings and named strategy signals are unavailable. SPY levels are ETF references, not executable futures prices; no news catalyst or seasonal explanation can be established from this chart alone.
View charts on: AlphaWebTrader HTF Charts
ES Daily View
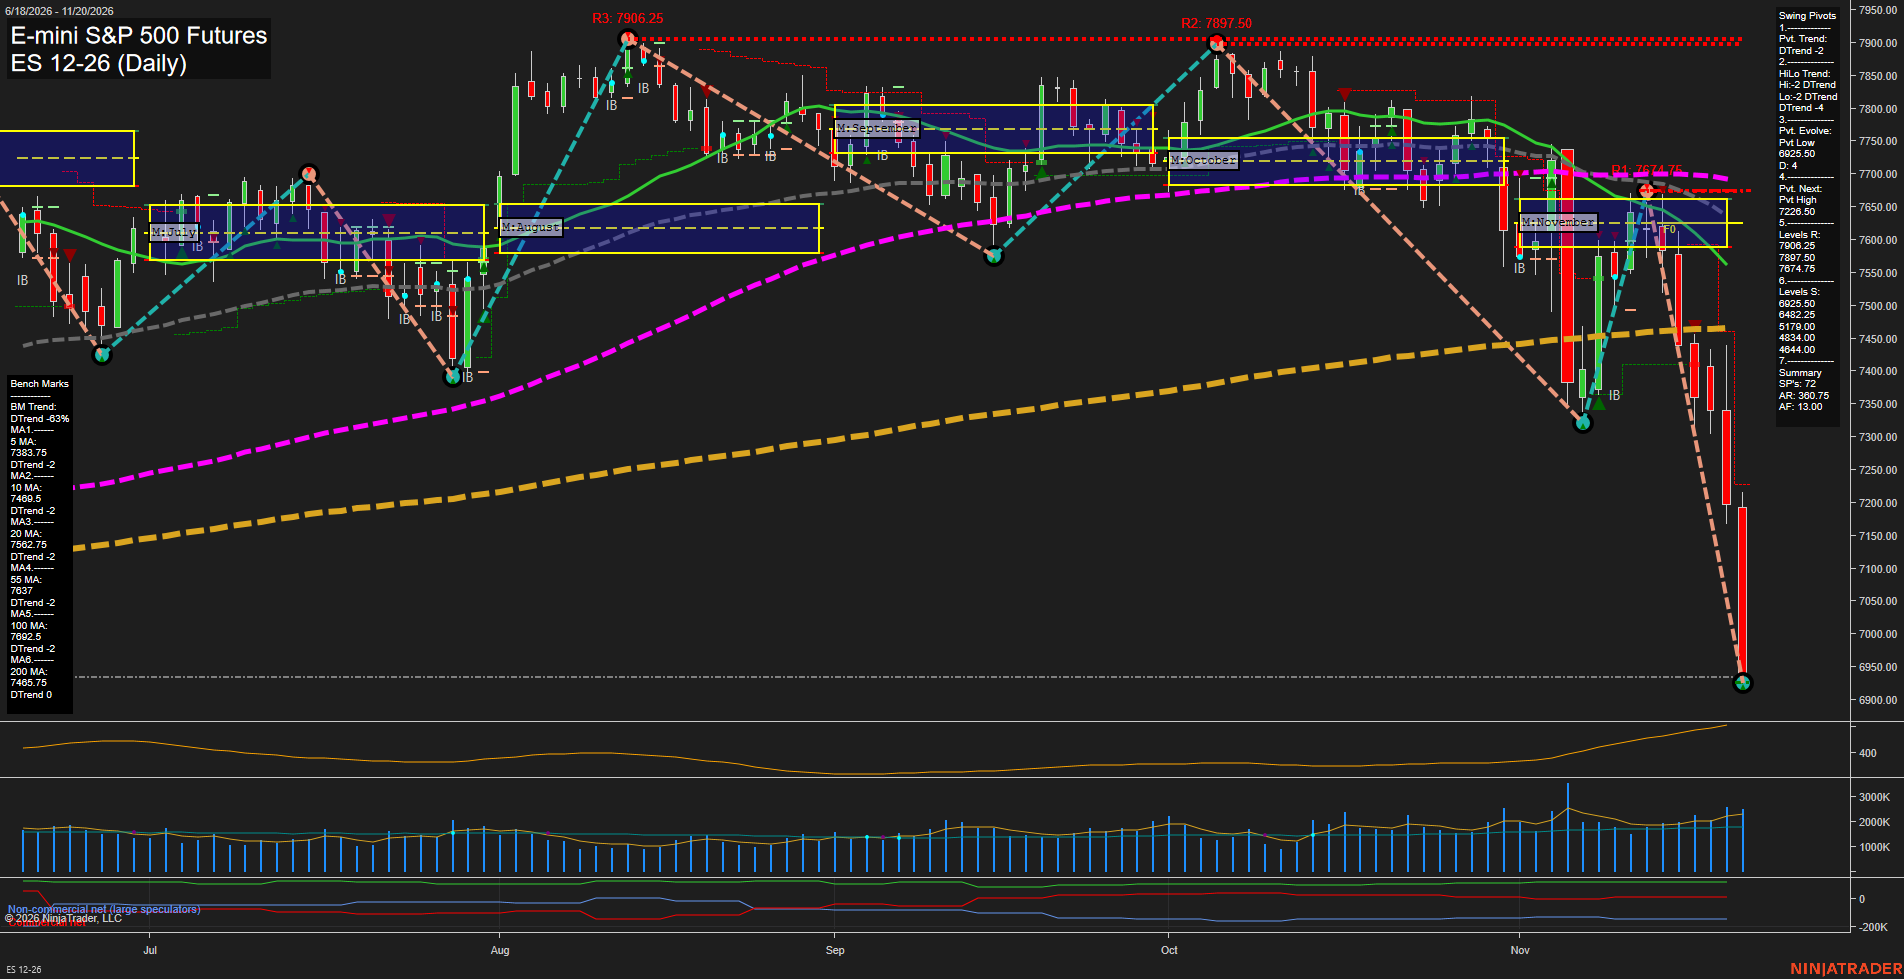
Overall Rating
- Near-Term: Bearish
- Medium-Term: Bearish
- Far-Term: Bearish.
Key Insights Summary
From a futures swing-trading perspective, the chart depicts an accelerating downside continuation following a failed rebound to the 7674.75 lower high. Large red candles and a finish near the evolving 6925.50 pivot low indicate persistent selling pressure rather than consolidation. Price is below all six benchmarks and all three session-grid reference zones, aligning near-, medium-, and far-term bearish readings. The break beneath the 200-day benchmark marks a deterioration beyond an ordinary short-term pullback. Rising ATR and elevated recent volume accompany the decline, indicating expanding volatility. The 7226.50 next-pivot threshold defines the chart's near-term reversal reference, while 6925.50 remains evolving support rather than a confirmed bottom. Both supplied November 16 short signals align with the subsequent downswing; no additional signal history or news catalysts are supplied.
View charts on: AlphaWebTrader HTF Charts
QQQ Daily View
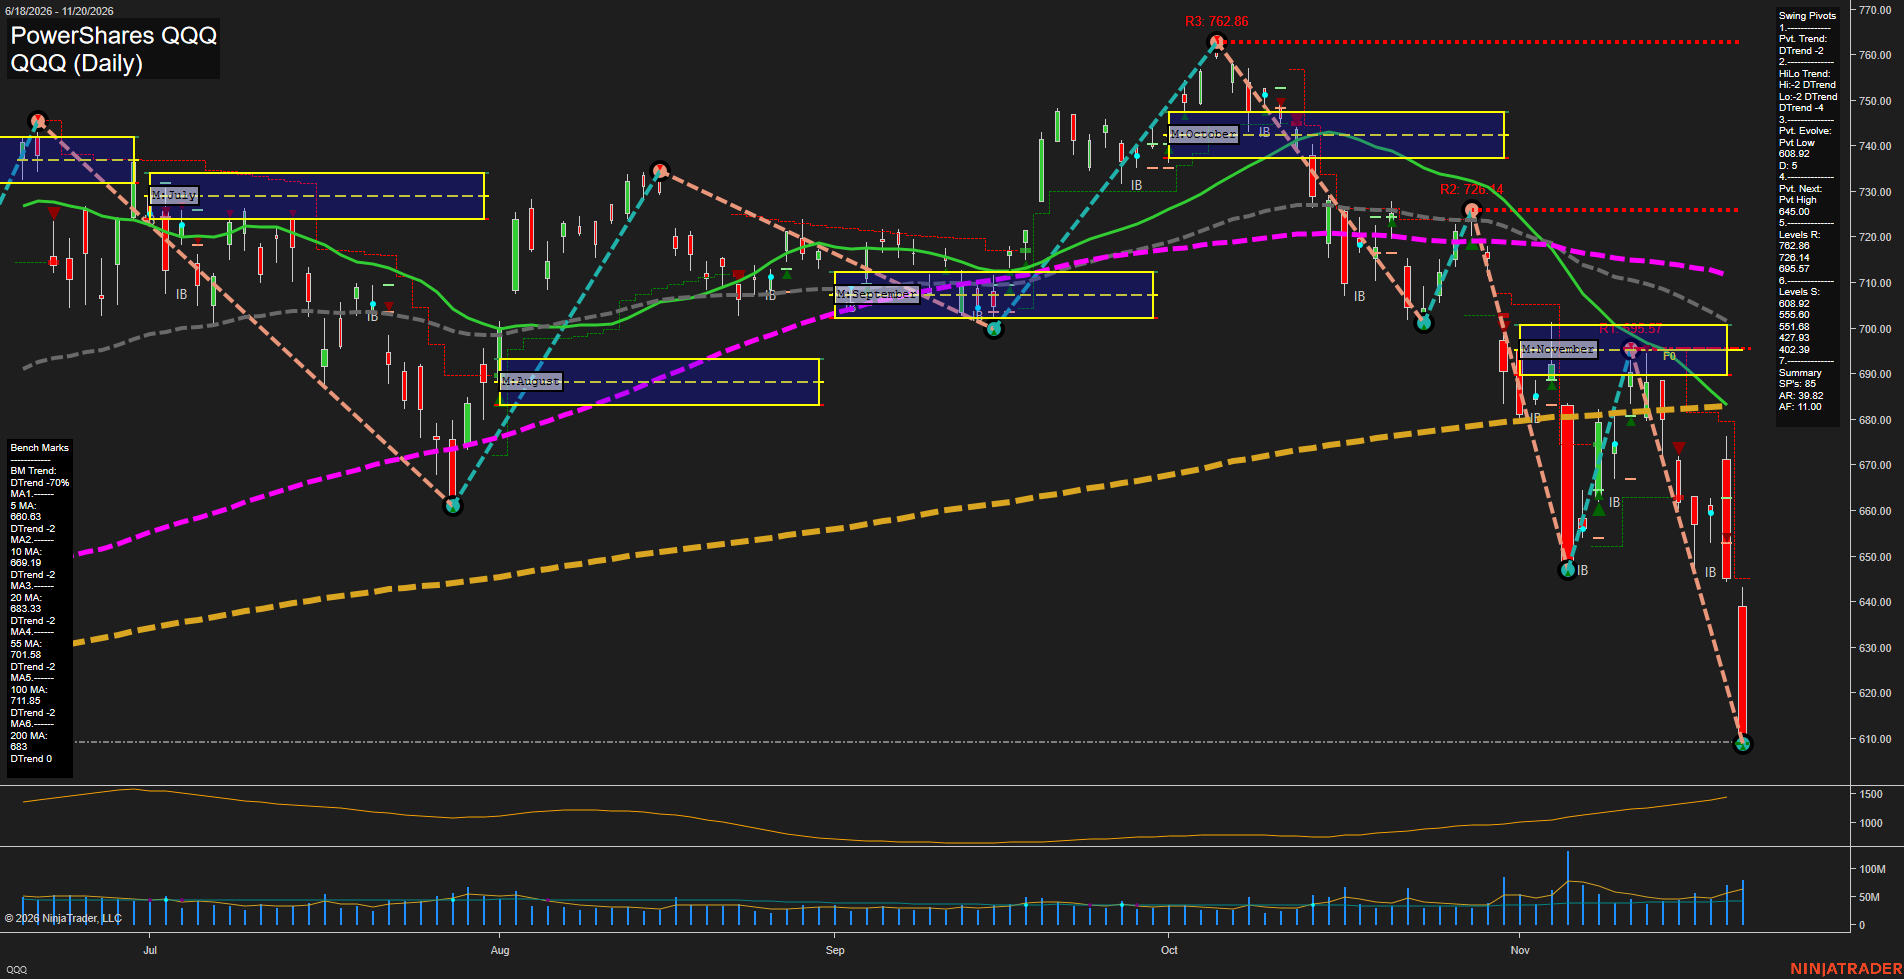
Overall Rating
- Near-Term: Bearish
- Medium-Term: Bearish
- Far-Term: Bearish.
Key Insights Summary
From a futures swing trader’s perspective, this QQQ chart depicts an accelerating Nasdaq-related downside impulse, not a normal shallow retracement. Successive lower highs and lower lows culminate in a large bearish bar finishing near the evolving 608.92 pivot low. The rebound to 695.57 failed, followed by a break beneath the previous November low near 647. Price is below every benchmark, including the approximately 683 long-term average, while the November neutral zone near 690–701 sits substantially overhead. Rising ATR and heavier recent volume indicate expanding volatility and stronger selling participation. The 645.00 next-pivot threshold is a structural reversal reference, not confirmation of an established uptrend. Far-term conditions are bearish despite the still-flat 200-day benchmark. QQQ levels are ETF reference prices rather than executable Nasdaq futures levels; futures basis and session differences matter. Weekly/yearly grids and the named USAR signals are not visible, and no news catalyst can be established from this chart.
View charts on: AlphaWebTrader HTF Charts
NQ Daily View
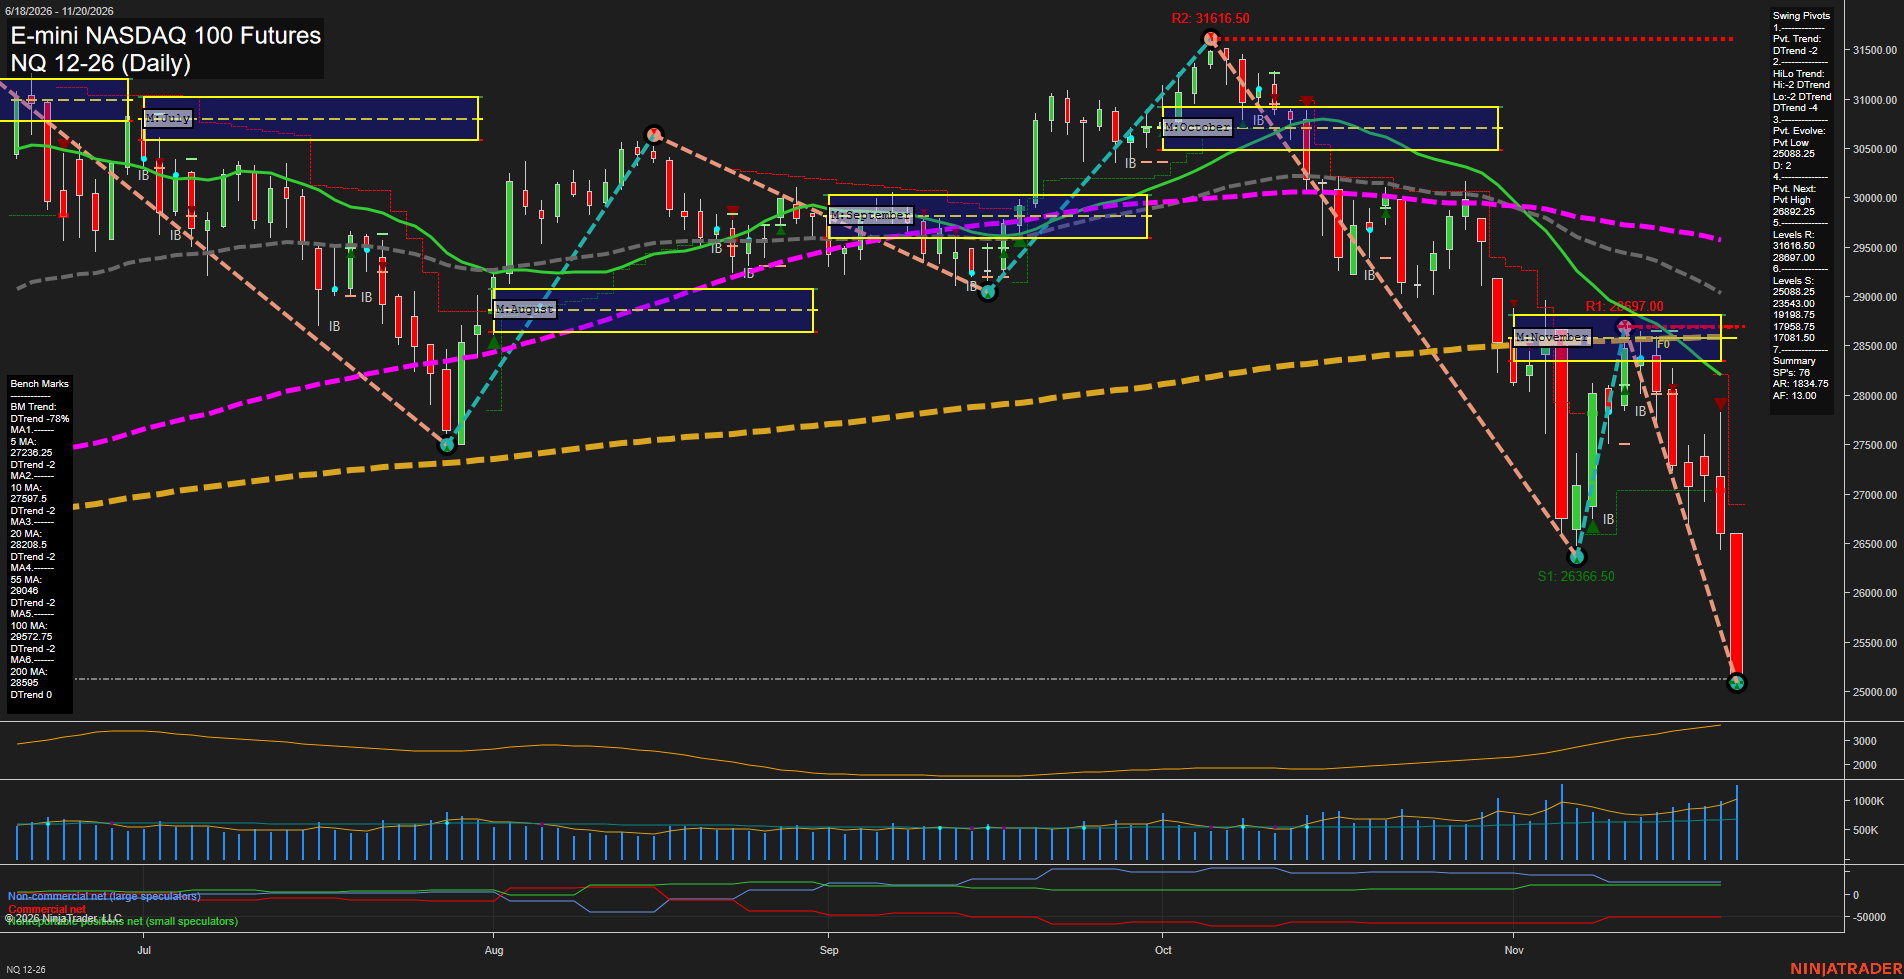
Overall Rating
- Near-Term: Bearish
- Medium-Term: Bearish
- Far-Term: Bearish.
Key Insights Summary
The swing structure shows an accelerating bearish continuation rather than consolidation. November’s rebound stalled at 28697 near the monthly NTZ and 200-day benchmark, forming a lower high beneath October’s 31616.50 peak. The subsequent decline broke the prior 26366.50 swing low and extended the evolving low to 25088.25. Large bearish bars, a close near the latest low, rising volatility and elevated volume indicate forceful selling. Price remains below every benchmark and all three session-grid reference zones, reinforcing bearish alignment across time horizons. The 200-day benchmark’s DTrend 0 reading is less established than the other benchmark declines. The listed short signals align with the subsequent breakdown; no additional medium- or far-term signal entries are supplied. The evolving low is the immediate support reference, with 23543 the next listed lower support. No news catalyst or seasonal explanation can be established from this chart alone.
View charts on: AlphaWebTrader HTF Charts
USO Daily View
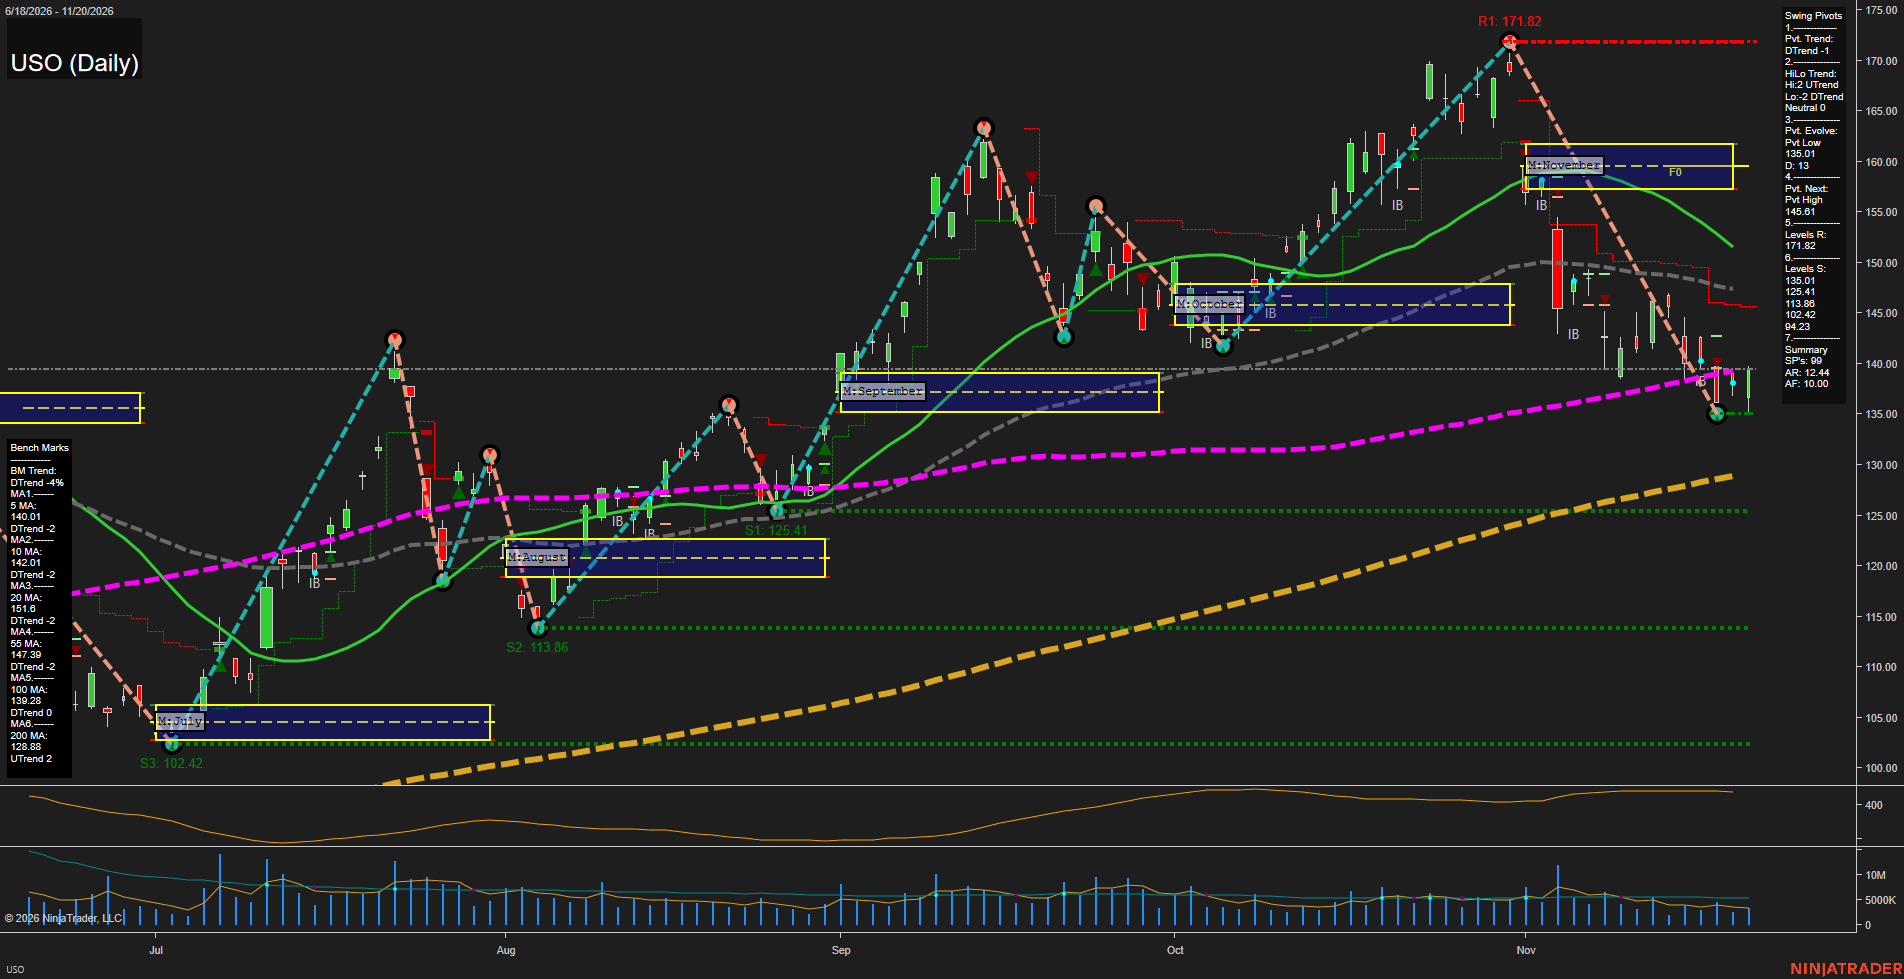
Overall Rating
- Near-Term: Bearish
- Medium-Term: Bearish
- Far-Term: Neutral.
Key Insights Summary
From a futures swing trader’s perspective, USO shows a sharp corrective downswing from 171.82 to 135.01, followed by a small-bar stabilization near the 100-day benchmark. Price remains below declining 5-, 10-, 20- and 55-day averages and well beneath November’s monthly neutral zone around 157–162, leaving the rebound countertrend rather than a confirmed reversal. The pivot summary remains in a near-term downtrend, with 145.61 identified as the next opposite-pivot reversal threshold. Medium-term pivot structure is mixed, combining higher highs with lower lows. Support is concentrated at 135.01, followed by 125.41; the rising 200-day average at 128.88 preserves a contrasting longer-term bullish element. Recent volume is subdued relative to earlier selloff activity, suggesting limited participation in stabilization. Weekly and yearly grids and named strategy signals are not visible, so their direction cannot be independently verified. USO is an oil-futures-linked fund rather than a futures contract; contract-specific roll effects and spreads are not shown, and the chart alone does not establish news or seasonal drivers.
View charts on: AlphaWebTrader HTF Charts
CL Daily View
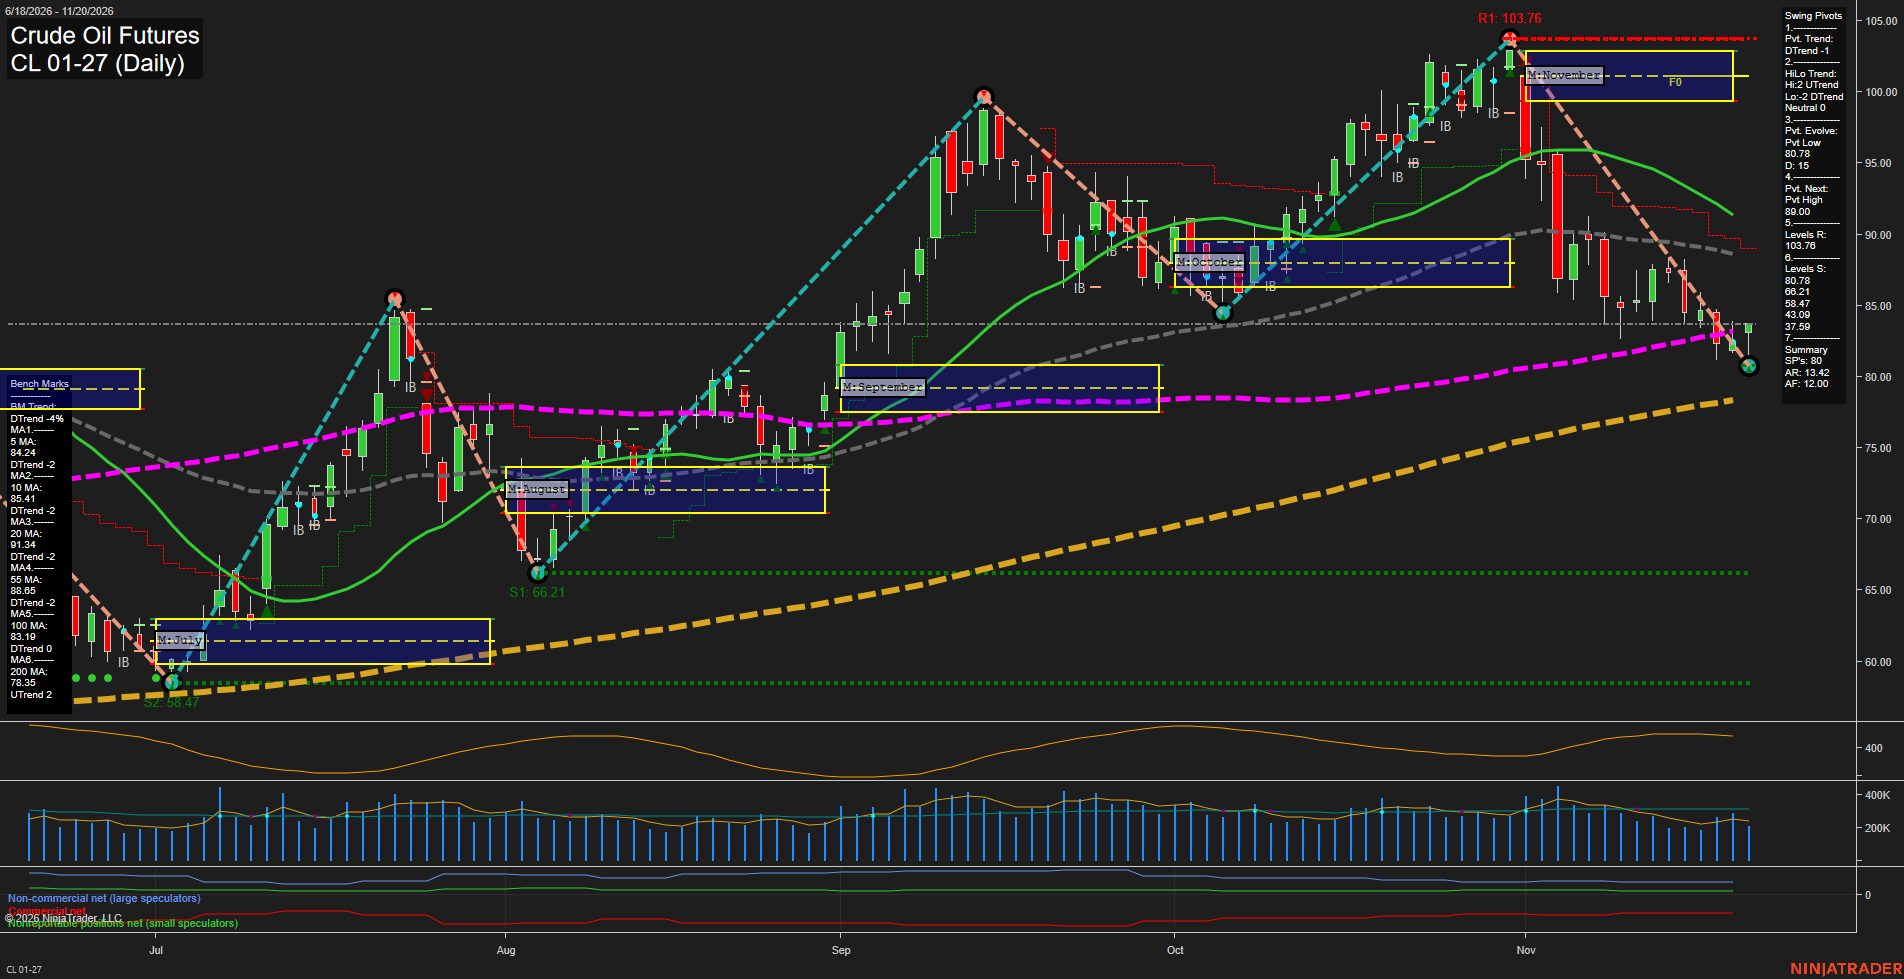
Overall Rating
- Near-Term: Bearish
- Medium-Term: Bearish
- Far-Term: Bullish.
Key Insights Summary
November's decline from 103.76 to the evolving 80.78 pivot low represents an approximately 22% correction. The latest rebound toward 83.80 remains a countertrend bounce beneath declining 5-, 10-, 20- and 55-day benchmarks. Negative weekly and monthly grid readings reinforce bearish swing momentum, consistent with the two recorded short signals. The medium-term high/low pivot classification remains neutral rather than confirming a fully aligned downtrend. Price is testing the 100-day benchmark area, while the rising 200-day average and positive yearly grid preserve a broader bullish backdrop. The 89.00 opposite-pivot threshold marks a structural reference above current price; 80.78 is the nearest recorded pivot support. The chart displays CL 01-27, whereas the supplied signals reference CL 12-26, so their prices are not directly equivalent. No specific news catalyst or seasonal conclusion can be established from this chart alone.
View charts on: AlphaWebTrader HTF Charts
GLD Daily View
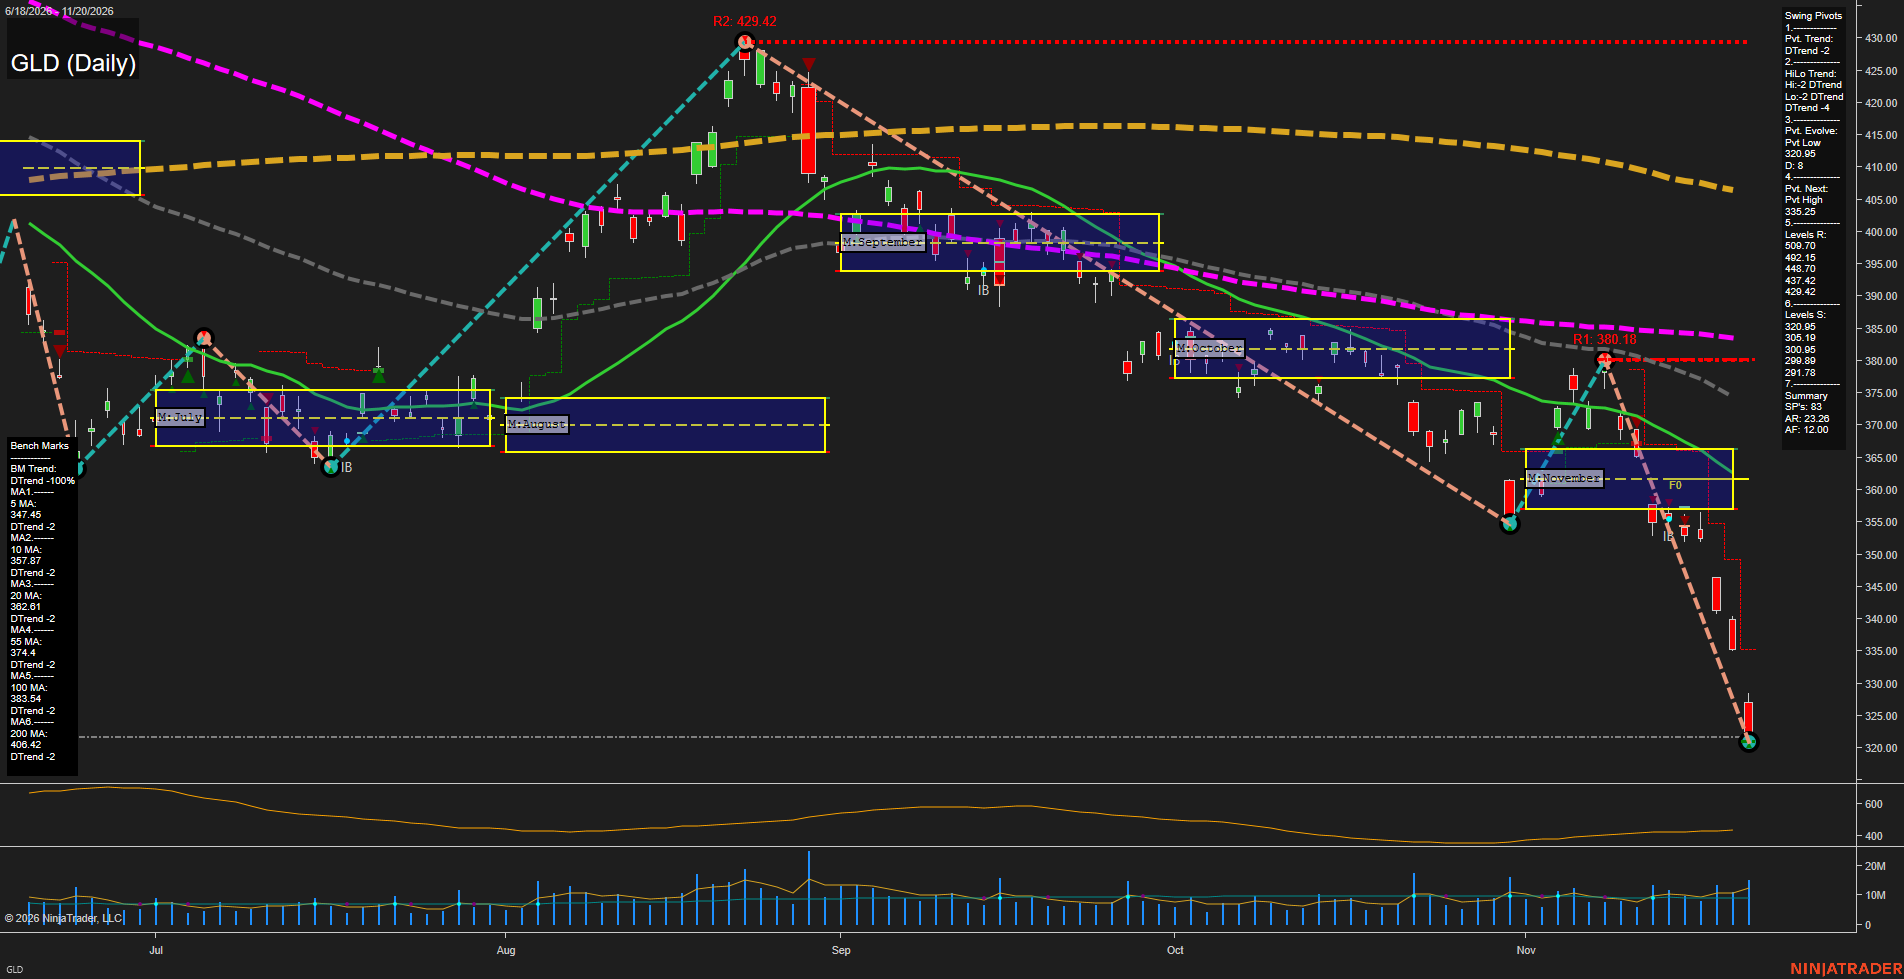
Overall Rating
- Near-Term: Bearish
- Medium-Term: Bearish
- Far-Term: Bearish.
Key Insights Summary
From a futures swing trader’s perspective, GLD shows an accelerating downside continuation rather than a routine pullback. The rebound to 380.18 failed below the August peak at 429.42, followed by a break beneath November’s approximately 357–366 balance area and a fresh evolving low at 320.95. Lower highs, lower lows and price beneath all six declining benchmarks establish bearish alignment across time horizons. Recent large downside candles and rising volume suggest stronger selling participation, while the substantial distance below the 5-day average signals a stretched short-term move without confirming a reversal. The summary identifies 335.25 as the next opposite-pivot threshold, not an established resistance pivot. Weekly and yearly grids and the named USAR signal readings are not visible, so their directional confirmation is unavailable. These are GLD ETF price levels, not gold futures contract levels; news and seasonal drivers cannot be established from this chart.
View charts on: AlphaWebTrader HTF Charts
GC Daily View
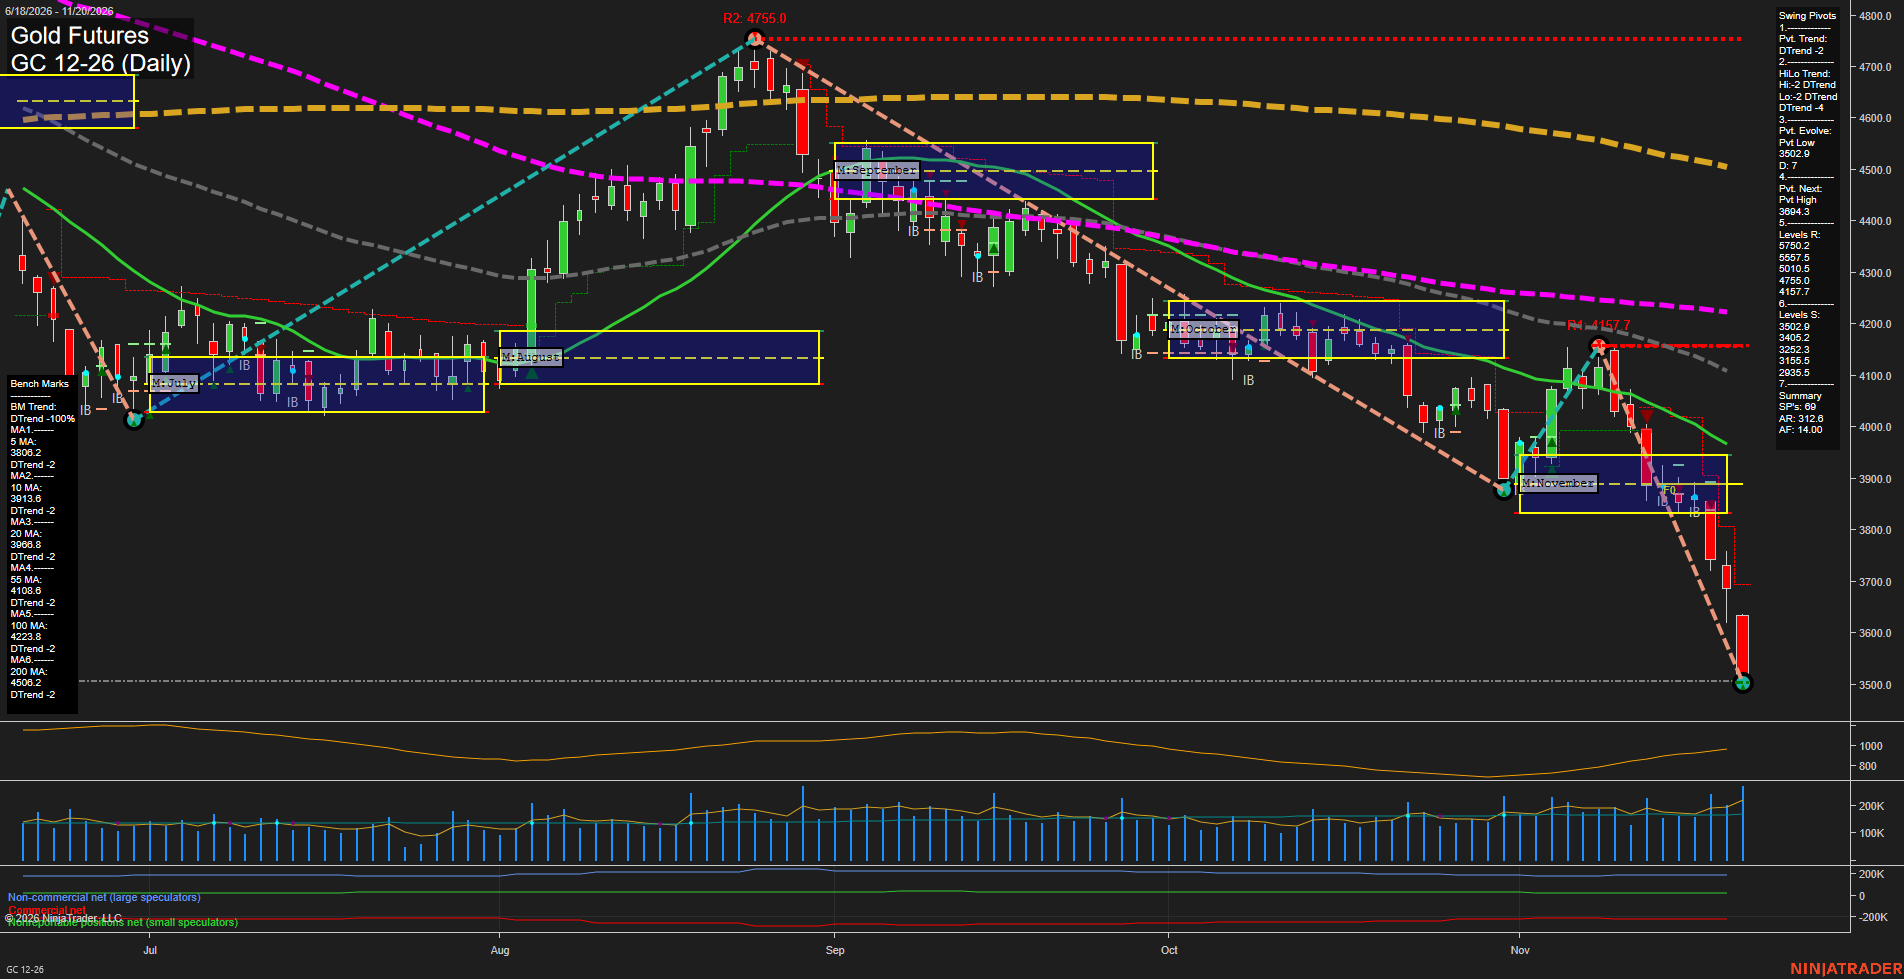
Overall Rating
- Near-Term: Bearish
- Medium-Term: Bearish
- Far-Term: Bearish.
Key Insights Summary
Gold displays an accelerating bearish swing continuation following the failed November rebound to 4157.7. Large declining candles have broken below the November NTZ and the prior swing low near 3880, extending the lower-high/lower-low structure toward 3502.9. Price remains beneath all six declining benchmarks, while weekly, monthly and yearly grids reinforce the downside alignment. Rising recent volume accompanies the selloff, indicating stronger participation rather than a quiet pullback. The evolving pivot low is not yet a confirmed reversal; 3694.3 is the chart’s next opposite-pivot threshold. The listed short signals align with the prevailing decline across time horizons. Although price is substantially stretched below its benchmarks, the chart does not yet establish a recovery structure. News catalysts and seasonal influences cannot be verified from this image.
View charts on: AlphaWebTrader HTF Charts
ZB Daily View
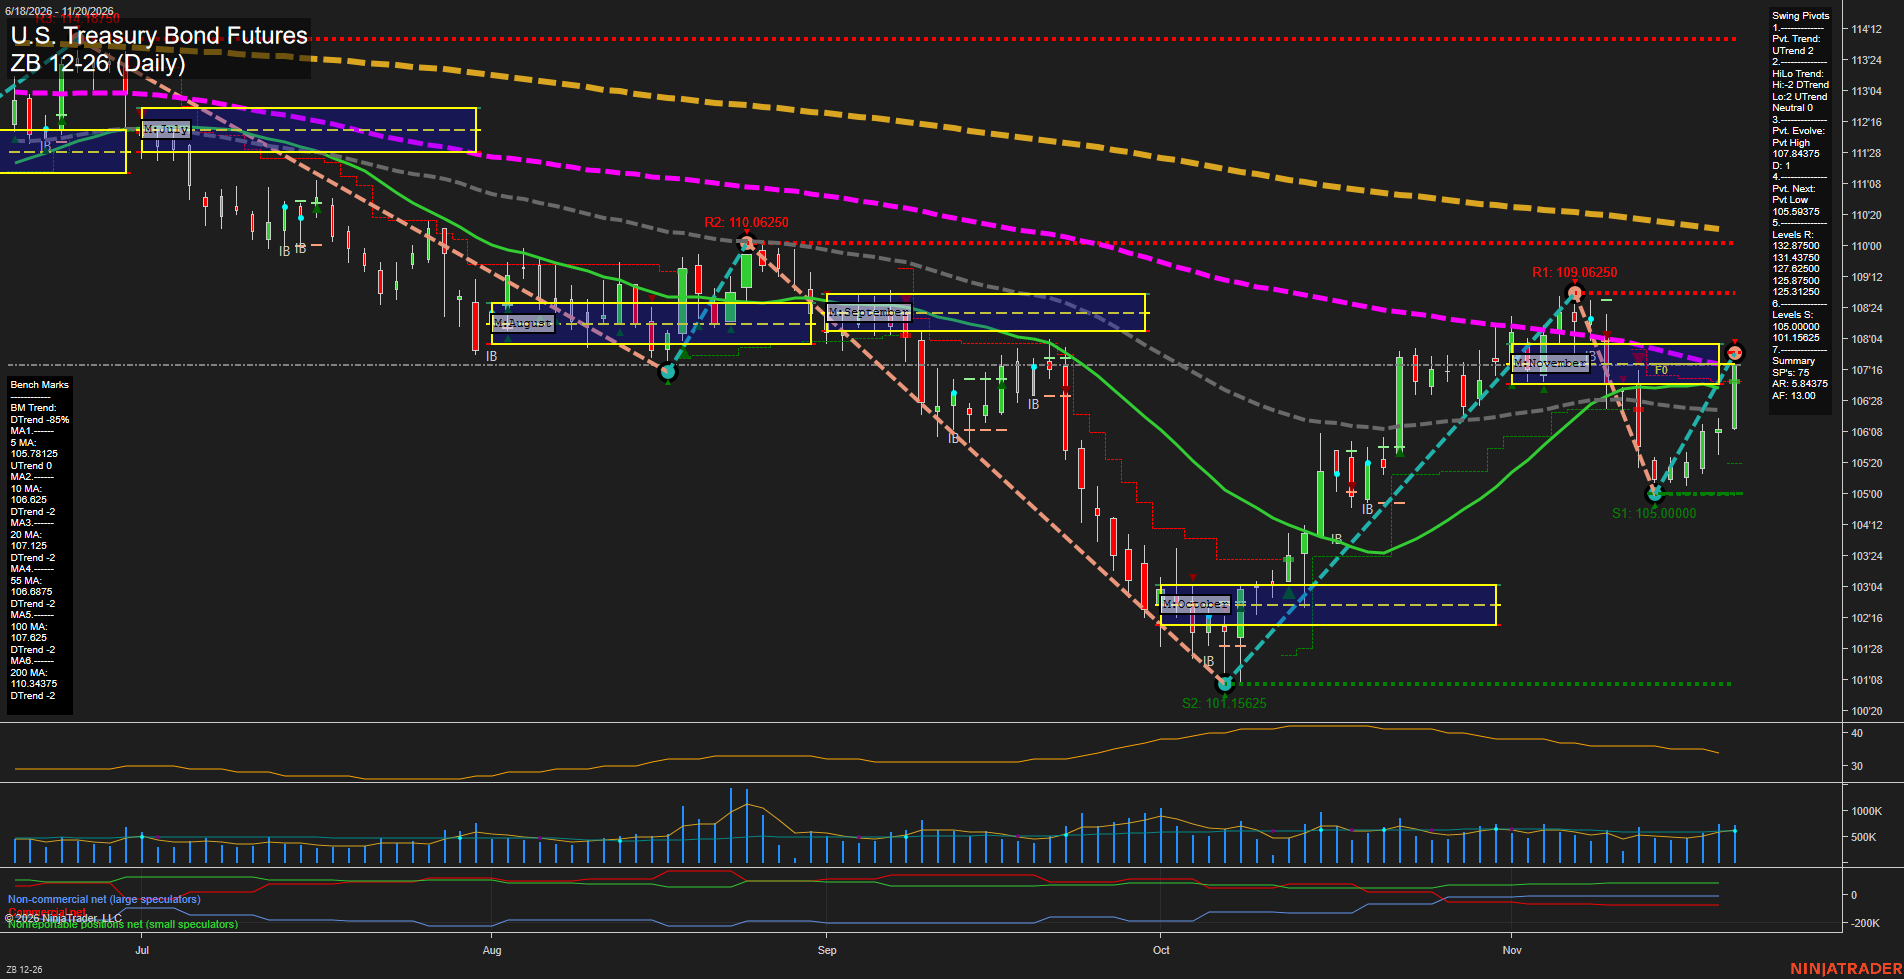
Overall Rating
- Near-Term: Bullish
- Medium-Term: Bearish
- Far-Term: Bearish.
Key Insights Summary
The near-term swing has turned upward following the rebound from 105.00000, a higher low relative to October’s 101.15625 trough. Expanding bullish price action and an evolving pivot high at 107.84375 show renewed buying momentum. Price has recovered above the medium-term benchmarks and is testing the declining 100-day average and November consolidation area. However, the monthly grid remains marginally negative, the 20- and 55-day benchmark trends remain down, and mixed high/low pivot trends indicate an unresolved medium-term structure. The recovery therefore remains a countertrend advance within the broader decline rather than a confirmed major reversal. Visible chart resistance sits at 109.06250 and 110.06250; these plotted levels differ from the resistance values displayed in the Swing Pivots summary above. The declining 200-day average near 110.34375 reinforces overhead resistance. ATR has eased from October’s peak despite the latest strong rebound. The four named trade-signal readings are not displayed, and the image alone does not establish news or seasonal drivers.
View charts on: AlphaWebTrader HTF Charts
Sentiment Summary: Neutral coverage led at 40%, but negative news outweighed positive 39% to 21%, reflecting an AI-led selloff as Nvidia faced reported SEC accounting scrutiny on November 20 following California’s November 19 subpoena. Anthropic’s November 19 IPO failed to sustain optimism, while Fed Governor Cook’s November 20 call for rate hikes reinforced inflation concerns and the VIX rose above 31. Nvidia’s strong earnings and raised guidance, alongside reported rotation into value and defensive sectors, provided counterweights without reversing technology weakness.
Conclusion: Technology concentration and elevated volatility remained the central index-futures risk context.