Friday brings Fed's Waller at 08:25, Michigan surveys at 10:00 and Cook at 12:15 ET as tech selling weighs on stock futures; weekly uptrends remain intact.
Fundamentals: Friday's agenda features Fed Governor Waller at 08:25 ET, Michigan sentiment, consumer expectations and inflation expectations at 10:00 ET, and Fed Governor Cook at 12:15 ET. Ahead of the open, AI-related selling is weighing on global stocks and the Nasdaq, with the S&P 500's losing streak at six sessions and volatility elevated. Apple is gaining premarket, while gold and silver are lower and Treasurys are stronger.
Technicals: Stock index futures show accelerating bearish daily trends ahead of Friday’s open, following sharp prior-session losses in Nvidia, Alphabet and Amazon. The S&P 500 and Nasdaq futures remain below every tracked daily benchmark, with no confirmed bullish pivot reversal. Weekly charts still retain bullish longer-term structures despite the selloff, while oil and Treasury bond ETFs gained in the prior session.
Pre-Market Trading 360° view Market Radar of: holidays, earnings, eco-news, market-news summary, news sentiment, prior session major ETFs, MAG7, Higher Time Frame Analysis Indices Futures Summary, and E-mini S&P500, Nasdaq 100, NYMEX Crude, Gold Futures Daily Chart analysis.
As of: November 20, 2026 07:15 CT
Holiday Radar
- 2026-11-26 Thanksgiving Day
- 2026-11-27 Thanksgiving Day (09:30-13:00)
EcoNews Radar U.S. Events
| Date | Impact | Event, Prev, Forecast, Actual | Info |
|---|---|---|---|
| 2026-11-20 Friday 08:25 | Medium | Fed's Waller speech Prev: — Forecast: — Actual: — | Remarks may clarify the policymaker’s assessment of inflation, employment and monetary policy; index futures traders monitor them for signals about interest rates and financial conditions. |
| 2026-11-20 Friday 10:00 | Medium | Michigan Consumer Sentiment Index Prev: 51 Forecast: 51.5 Actual: — | Measures households’ assessments of current conditions and future prospects; traders monitor it for clues about consumer spending, economic momentum and corporate earnings. |
| 2026-11-20 Friday 10:00 | Medium | UoM 1-year Consumer Inflation Expectations Prev: 4.3 Forecast: 4.3 Actual: — | Measures households’ expected inflation over the next year; traders watch for changes that could influence wage demands, spending decisions and the monetary policy outlook. |
| 2026-11-20 Friday 10:00 | Medium | Michigan Consumer Expectations Index Prev: 50.9 Forecast: 50.9 Actual: — | Measures households’ outlook for personal finances and business conditions; traders use it to gauge prospective consumer demand and risks to economic growth. |
| 2026-11-20 Friday 10:00 | Medium | UoM 5-year Consumer Inflation Expectation Prev: 3.4 Forecast: 3.4 Actual: — | Measures households’ longer-term inflation expectations; traders monitor whether expectations remain anchored, a consideration for monetary policy and bond yields that affect equity valuations. |
| 2026-11-20 Friday 12:15 | Medium | Fed's Cook speech Prev: — Forecast: — Actual: — | Remarks may offer insight into the policymaker’s economic assessment and policy preferences; traders monitor potential implications for the interest-rate outlook and equity valuations. |
Summary: The calendar centers on US household attitudes, inflation expectations and Federal Reserve communication.
Conclusion: The survey releases are clustered in a single publication window between two policymaker appearances.
NYSE Session Open Gap Radar
Session gaps compare the predicted opening price with the prior session’s close to predict the upcoming session’s opening gap pattern.
| Instrument | Gap | Prior Close | Predicted Open | Gap % |
|---|---|---|---|---|
| TLT | ▲ OGU | 80.35 | 80.83 | ▲ +0.60% |
| DIA | ▼ OGD | 490.79 | 488.79 | ▼ -0.41% |
| IWM | ▼ OGD | 264.22 | 262.83 | ▼ -0.52% |
| IJH | ▼ OGD | 70.49 | 70.08 | ▼ -0.58% |
| SPY | ▼ OGD | 715.87 | 708.67 | ▼ -1.01% |
| USO | ▼ OGD | 138.09 | 136.50 | ▼ -1.15% |
| QQQ | ▼ OGD | 645.04 | 632.95 | ▼ -1.87% |
| GLD | ▼ OGD | 335.18 | 326.94 | ▼ -2.46% |
Before the session opens, the table shows the predicted opening price and gap. Once the session opens, it uses the recorded opening price.
Glossary: IGU — Inside Gap Up: above the prior close, within the prior session’s range. IGD — Inside Gap Down: below the prior close, within that range. OGU — Outside Gap Up: above the prior session’s high. OGD — Outside Gap Down: below the prior session’s low.
As of: 2026-11-20 07:15 CT. Predicted gaps are best estimates as of publication and may change before the regular-session open, particularly when the session is still some time away.
Market News Summary:
AI-related selling is weighing on global equities, with Nasdaq weakness, elevated volatility, and stronger Treasurys defining the premarket backdrop.
Primary Drivers & Risks:
- Primary Driver: Deteriorating confidence in AI stocks
- Primary Risk: Elevated volatility amid prolonged equity declines
Tone:
Risk-averse, with technology under pressure and selective megacap gains.
Market News Sentiment
Sentiment Bias shows the balance of positive and negative news coverage sampled from 2026-11-19 08:22 to 2026-11-20 07:16 ET, covering stocks, energy and gold.
▼ Market news
- Bias
- ▼ -13.33%
- Articles
- 210
- Positive
- ▲ 19.52%
- Neutral
- — 47.62%
- Negative
- ▼ 32.86%
▼ GLD / Gold
- Bias
- ▼ -16.67%
- Articles
- 18
- Positive
- ▲ 33.33%
- Neutral
- — 16.67%
- Negative
- ▼ 50.00%
Sentiment Summary: Gold coverage leaned negative (50% negative versus 33% positive) into November 20, with reports attributing selling pressure to expectations of further Fed hikes, elevated Treasury yields and a stronger dollar. November 19 releases showing weekly jobless claims rising to 203,000 and Philadelphia Fed manufacturing activity at a six-month low failed to restore safe-haven demand, while November 20 coverage described gold heading for its worst week in eight months. The main counterweight was longer-term institutional support, including Morgan Stanley naming gold its top commodity pick for 2027.
Conclusion: This coverage highlights persistent rate pressure rather than a clear equity-risk signal.
▼ USO / Oil
- Bias
- ▼ -6.67%
- Articles
- 15
- Positive
- ▲ 26.67%
- Neutral
- — 40.00%
- Negative
- ▼ 33.33%
Sentiment Summary: Oil coverage was mildly negative, with 33% negative, 27% positive and 40% neutral, as November 19 reports highlighted rising U.S. inventories, weaker export economics and ample fuel supplies, including Asian gasoline margins at more than three-year lows. The main counterweight was oil’s rise following the November 19 Houthi strike in Riyadh; November 20 coverage continued to balance Middle East shipping threats against improving global supply conditions.
Conclusion: For indices futures day traders, the supported cross-market context is a two-sided oil backdrop, with supply-driven price pressure alongside geopolitical disruption risk.
Glossary: Sentiment Bias = (positive articles − negative articles) ÷ total articles × 100. It ranges from −100% negative to +100% positive. A reading near zero indicates little directional bias. Neutral articles reduce the score’s strength. ▲ positive; ▼ negative; — balanced. These readings describe news coverage, not market-price direction.
Market Technical Analysis
Analysis of VIX volatility, prior-session major ETFs and mega-cap tech stocks, and real-time futures snapshots and higher-time-frame analysis.
VIX — Market Fear Gauge Daily
| Level | Open | High | MaxVix | Low | MinVix | DNC% | DOC% | VR | MaxVR | MinVR |
|---|---|---|---|---|---|---|---|---|---|---|
| 28.44 | 22.06 | 29.13 | 28.36 | 21.84 | 16.21 | +15.80% | +28.92% | 8.05 | 56.57 | -11.56 |
VIX rose 28.92% from the session's opening level. VIX rose 15.80% versus the previous session close. Expected volatility rose from the period open. VIX is above the recent 15-session range (16.21–28.36).
VR: ATN Volatility Ratio (VR): 8.05 – Stocks fell while expected volatility rose. VR is in the lower part of its preceding 15-session VR range (-11.56 to 56.57), in the 20–30% band. VR rose 19.61 points from the previous session, a moderate shift relative to that range.
Range lookback: preceding 15 completed sessions.
Major ETFs and Mega Cap Tech Stocks
- The Nasdaq was positioned for another decline as global stocks sold off amid weakening confidence in the AI trade.
- The S&P 500 losing streak reached six sessions, marking its worst stretch since the 2025 “Liberation Day” tariffs.
- Wall Street’s fear gauge touched a seven-month high as AI concerns intensified.
- Nvidia was down 40% from its October 6 record high after six consecutive daily declines.
- Democrats opened a probe into Nvidia’s influence on the U.S. Megaspeed investigation, adding to company-specific scrutiny.
- A separate headline reported Jensen Huang’s sudden resignation, without further details in the accompanying excerpt.
- Apple shares rose in premarket trading after job postings indicated work on an agentic AI system.
- HSBC upgraded Tesla from Reduce to Hold and raised its price target from $157 to $359 amid SpaceX transaction optimism.
- A SpaceX-Tesla merger faces approval requirements exceeding half of all outstanding Tesla shares, alongside proxy-adviser opposition, potential litigation, and antitrust scrutiny.
Oil / Energy:
- Traders and analysts described $85–$95 per barrel as a persistent oil-price range.
Gold / Metals:
- Gold and silver fell to their lowest levels in more than a year as tighter monetary-policy expectations outweighed traditional safe-haven demand.
Fed / Financials:
- Treasurys strengthened during the global equity selloff.
- Citi strategists maintained a risk-averse stance despite steep equity declines and flagged a stock-market signal nearing a warning threshold.
Macro / Other:
- Eurozone negotiated wage growth accelerated to 2.57% in the third quarter from 2.45% in the previous quarter.
- Black Friday consumer spending is a focus for the coming week amid the AI-driven market downturn.
Conclusion:
Weakening AI confidence is the central driver of equity selling, with Nvidia’s drawdown underscoring technology-sector pressure. The extended S&P 500 decline and seven-month high in the fear gauge frame a volatile index backdrop.
Apple’s premarket gain and Tesla’s analyst upgrade provide stock-specific counterpoints to the broader weakness. Stronger Treasurys contrast with falling precious metals, while Nvidia scrutiny and Tesla transaction hurdles add company-level risks.
ETF, Mag7, and Cross-Market ETF prior day Insights
Overall Tone
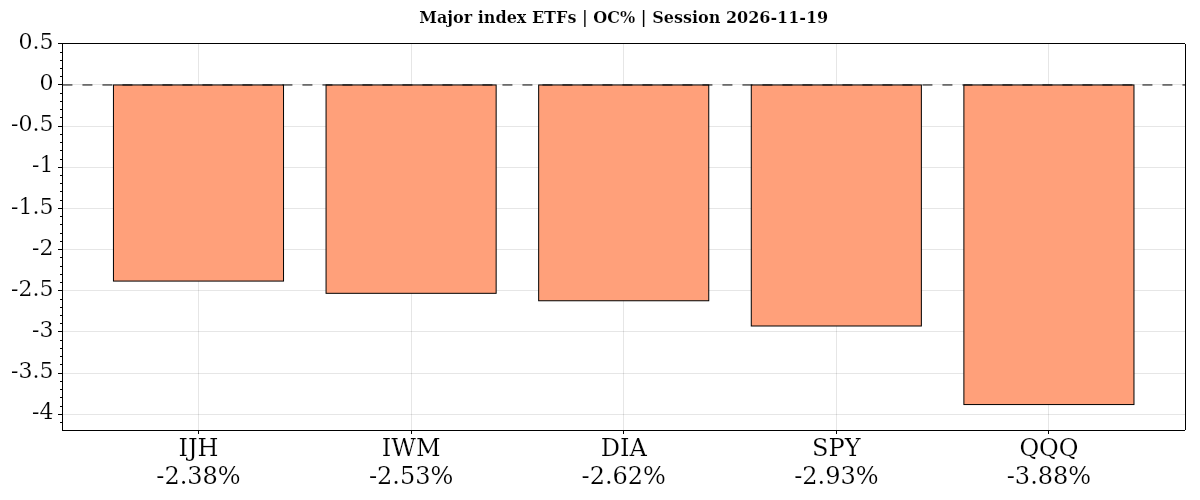
The November 19, 2026 daily session was risk-off, with broad equity losses from the open and versus the prior close.
| Instrument | Bias | Date | DNC% | DOC% | O | H | L | C | VWAP | Vol |
|---|---|---|---|---|---|---|---|---|---|---|
| ▼ IJH | ▼ ▼ ▼ | 2026-11-19 | ▼ -2.02% | ▼ -2.38% | 72.21 | 72.28 | 70.32 | 70.49 | ▼ 71.00 | 10,393,768 |
| ▼ IWM | ▼ ▼ ▼ | 2026-11-19 | ▼ -2.18% | ▼ -2.53% | 271.08 | 271.80 | 263.74 | 264.22 | ▼ 266.78 | 31,435,390 |
| ▼ DIA | ▼ ▼ ▼ | 2026-11-19 | ▼ -2.18% | ▼ -2.62% | 504.00 | 504.43 | 490.73 | 490.79 | ▼ 495.60 | 4,914,119 |
| ▼ SPY | ▼ ▼ ▼ | 2026-11-19 | ▼ -1.96% | ▼ -2.93% | 737.46 | 739.90 | 715.65 | 715.87 | ▼ 723.55 | 76,779,335 |
| ▼ QQQ | ▼ ▼ ▼ | 2026-11-19 | ▼ -2.19% | ▼ -3.88% | 671.09 | 676.49 | 644.34 | 645.04 | ▼ 656.00 | 71,662,659 |
| AVG/Sum | — | — | -2.11% | -2.87% | — | — | — | — | — | 195,185,271 |
Index ETFs
Negative confluence: average DOC% -2.87% from the open, DNC% -2.11% versus the prior close. All five index ETFs declined on both measures; IJH led from the open and QQQ lagged, while SPY was most resilient versus the prior close. All closed near session lows on above-average volume.
IJH · D:2026-11-19 NC% ▼ -2.02% OC% ▼ -2.38%
IJH – Mid Cap Technicals Summary
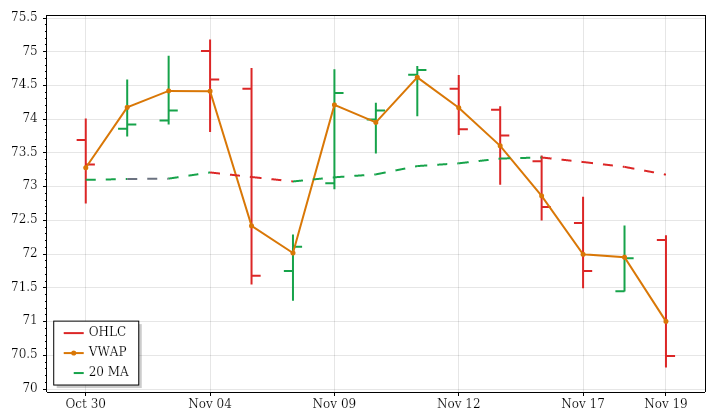
IJH’s completed daily session on November 19 closed at 70.49, declining 2.02% versus the prior close and 2.38% from the open. A small opening gap higher was filled before price finished near the day’s low and below the prior day’s low. The lower high and lower low, together with a close below session VWAP, describe a weak session rather than a simple loss of the opening premium.
Near-, intermediate- and far-term averages are all falling with price below them, aligning the latest decline with the broader structure. The downward 15-session trend has nevertheless been choppy, with little net progress relative to total movement. Range reached about 1.6 times average and volume exceeded average, contrasting with contraction and declining participation over the lookback. A next-session high above 74.1924 would conditionally trigger a PSAR long reversal.
IWM · D:2026-11-19 NC% ▼ -2.18% OC% ▼ -2.53%
IWM – Small Cap Technicals Summary
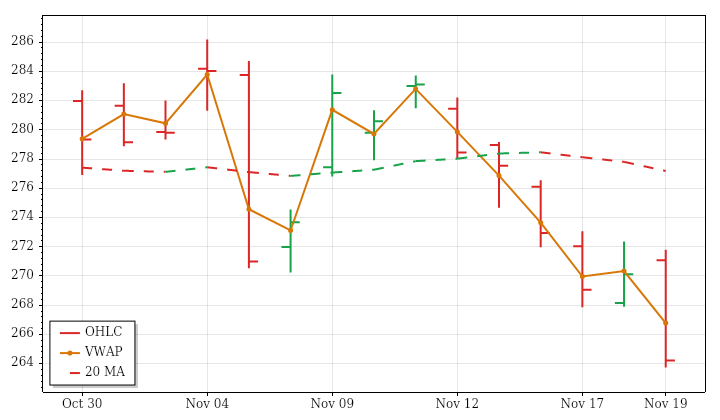
IWM’s completed November 19 daily session closed at 264.22, down 2.18% against the prior close and 2.53% from the open. The opening gap higher was erased, and price made a lower high and lower low before finishing near the session low. It also broke the prior inside-bar low and closed below the prior day’s low and session VWAP, reinforcing the session’s downside character.
The decline aligns with near-, intermediate- and far-term downtrends, with price beneath falling averages across all three horizons. The 15-session price trend is also downward, though not highly directional. Range was roughly 1.6 times average, while volume was above average; both departed from the lookback pattern of contracting ranges and declining volume. PSAR remains bearish. A next-session high above 275.8893 would conditionally trigger a long reversal.
DIA · D:2026-11-19 NC% ▼ -2.18% OC% ▼ -2.62%
DIA – Dow Jones Technicals Summary
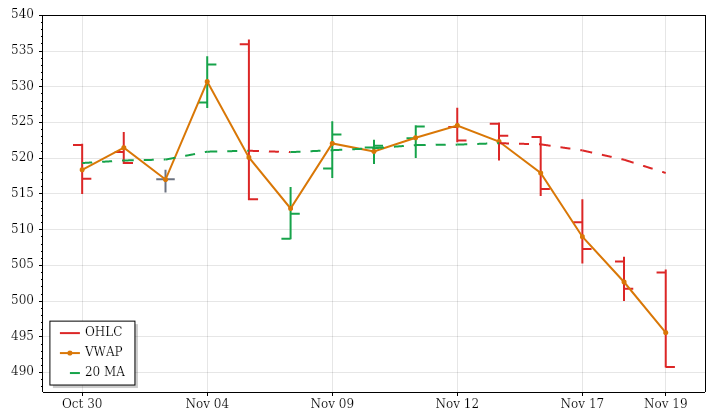
DIA’s completed daily session on November 19 closed at 490.79, losing 2.18% against the prior close and 2.62% from the open. An initial gap higher was filled, followed by a lower high and lower low. Price finished near the session low, below both the prior day’s low and session VWAP, giving the decline a consistently weak closing structure.
The latest action aligns with falling near- and intermediate-term averages and the downward 15-session price trend. The far-term picture is mixed rather than fully bearish: price is below that benchmark, but the average is still rising slightly. The session range was almost twice average, extending the lookback tendency toward expansion. Volume rose above average despite a declining lookback volume trend. PSAR remains bearish; only a next-session high above 513.9385 would trigger its conditional long reversal.
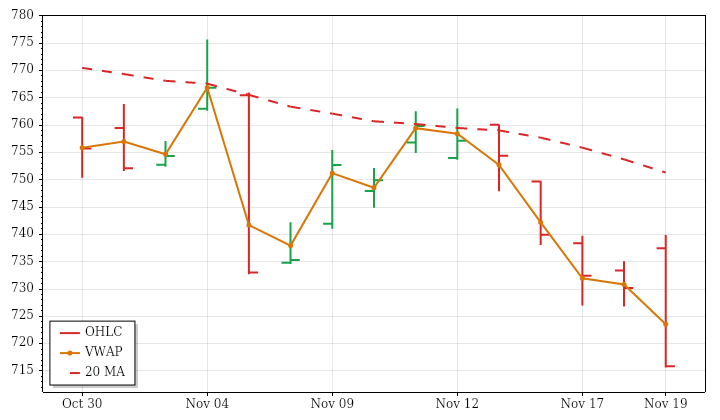
SPY · D:2026-11-19 NC% ▼ -1.96% OC% ▼ -2.93%
SPY – S&P 500 Technicals Summary
SPY’s completed daily session on November 19 closed at 715.87, down 1.96% from the prior close and 2.93% from the open. The opening gap higher was filled as an outside bar developed and finished near its low. The close fell below the prior day’s low and session VWAP, placing the latest action firmly on the weak side of the daily structure.
That decline agrees with falling near- and intermediate-term averages and the downward 15-session price trend. The far-term picture is mixed: price is below its benchmark, but that average still rises. Range exceeded twice average, extending the lookback tendency toward expansion. Volume was 36% above average despite a decreasing lookback volume trend. PSAR remains bearish, with a next-session high above 751.2175 required to trigger a conditional long reversal.
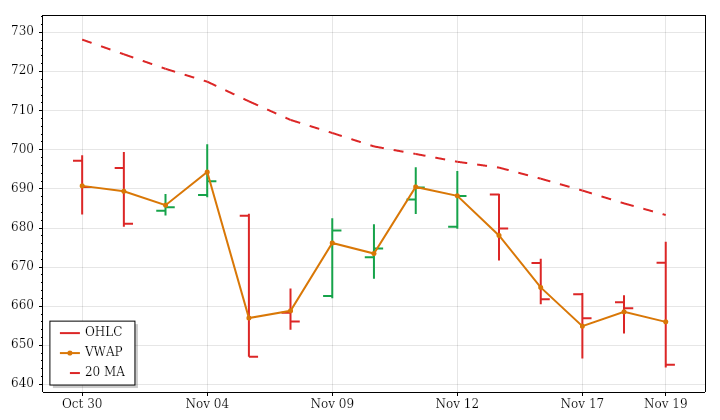
QQQ · D:2026-11-19 NC% ▼ -2.19% OC% ▼ -3.88%
QQQ – Nasdaq 100 Technicals Summary
QQQ’s completed November 19 daily session reversed a gap higher and closed at 645.04. It lost 2.19% versus the prior close and 3.88% from the open. The outside bar crossed both prior-pattern boundaries before ending near its low and below the prior day’s low. A close materially below session VWAP reinforced the reversal’s weak finish.
Near-, intermediate- and far-term averages are all falling with price below them, aligning the latest decline with the downward 15-session trend. The session’s range exceeded twice its recent average, a sharp departure from the nearly flat-to-contracting lookback range trend. Volume was also above average despite declining participation across that window, and average trade size was larger. PSAR remains in a bearish state; a next-session high above 690.6843 would conditionally trigger a long reversal.
| Instrument | Bias | Date | DNC% | DOC% | O | H | L | C | VWAP | Vol |
|---|---|---|---|---|---|---|---|---|---|---|
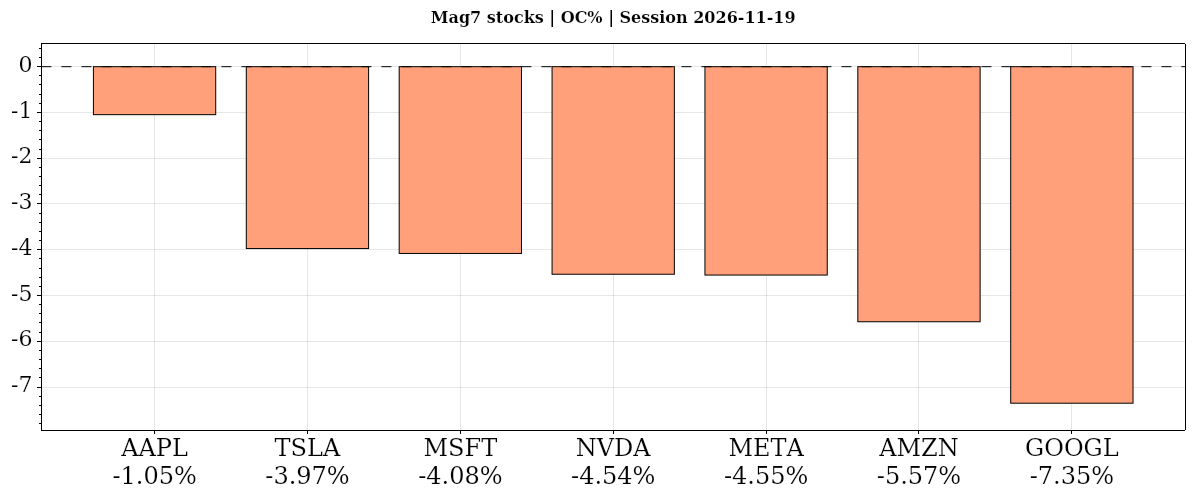
| ▼ AAPL | ▼ ▼ ▼ | 2026-11-19 | ▼ -0.92% | ▼ -1.05% | 352.91 | 355.28 | 346.47 | 349.21 | ▼ 349.39 | 41,059,303 |
| ▼ TSLA | ▼ ▼ ▼ | 2026-11-19 | ▼ -2.43% | ▼ -3.97% | 389.90 | 393.60 | 370.81 | 374.41 | ▼ 379.77 | 26,771,922 |
| ▼ MSFT | ▼ ▼ ▼ | 2026-11-19 | ▼ -1.97% | ▼ -4.08% | 519.50 | 526.49 | 498.16 | 498.30 | ▼ 508.11 | 29,430,809 |
| ▼ NVDA | ▼ ▼ ▼ | 2026-11-19 | ▼ -3.30% | ▼ -4.54% | 152.91 | 158.13 | 145.71 | 145.98 | ▼ 150.88 | 323,697,229 |
| ▼ META | ▼ ▼ ▼ | 2026-11-19 | ▼ -3.27% | ▼ -4.55% | 624.66 | 630.06 | 595.78 | 596.22 | ▼ 608.04 | 15,404,635 |
| ▼ AMZN | ▼ ▼ ▼ | 2026-11-19 | ▼ -3.87% | ▼ -5.57% | 272.56 | 274.00 | 256.75 | 257.37 | ▼ 263.40 | 53,169,159 |
| ▼ GOOGL | ▼ ▼ ▼ | 2026-11-19 | ▼ -3.46% | ▼ -7.35% | 294.30 | 295.43 | 272.36 | 272.66 | ▼ 281.30 | 49,875,070 |
| AVG/Sum | — | — | -2.75% | -4.45% | — | — | — | — | — | 539,408,127 |
Mag7 Stocks
Negative confluence: average DOC% -4.44% from the open, DNC% -2.75% versus the prior close. All seven declined on both measures: Apple led from the open, Alphabet lagged, and Amazon lost most versus the prior close. Alphabet and Nvidia had aligned moving-average downtrends, whereas Apple and Amazon retained rising longer-term structures.
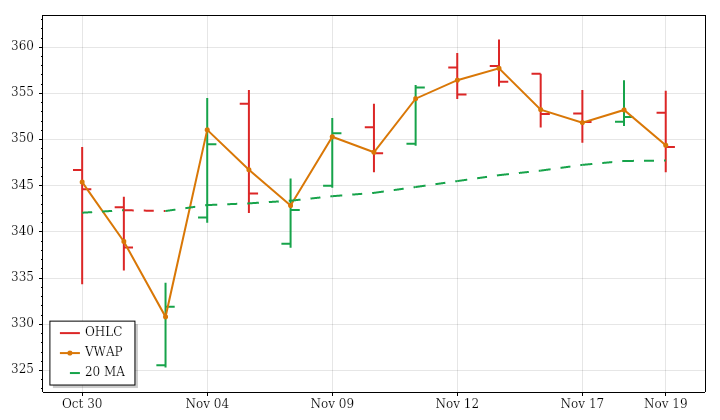
AAPL · D:2026-11-19 NC% ▼ -0.92% OC% ▼ -1.05%
AAPL – Apple Technicals Summary
AAPL’s completed daily session on November 19 closed at 349.21, down 0.92% from the prior close and 1.05% from the open. The small opening gain was erased, and price finished below the prior day’s low after making a lower high and lower low. The close was also just below session VWAP, placing the finish on the weaker side of the day’s trading without a large VWAP separation.
That decline conflicts with the rising intermediate- and far-term averages. Near-term conditions are mixed because price is below a still-rising average, while the broader 15-session price trend remains upward but choppy. The day’s above-average range interrupted a contraction in lookback ranges; below-average volume remained consistent with declining participation. PSAR is in a short state, but a next-session high above 360.83 would conditionally trigger a long reversal.
Apple News and Fundamentals
Apple disclosed work on an AI agent through a senior engineering-manager job listing describing software capable of using a computer like a person. Reports suggest it could operate apps, access websites and write code. Separately, the U.K. government was ordered to confirm that it had issued a secret demand requiring Apple to provide authorities with encrypted customer information, highlighting the company’s ongoing privacy and regulatory challenges.
TSLA · D:2026-11-19 NC% ▼ -2.43% OC% ▼ -3.97%
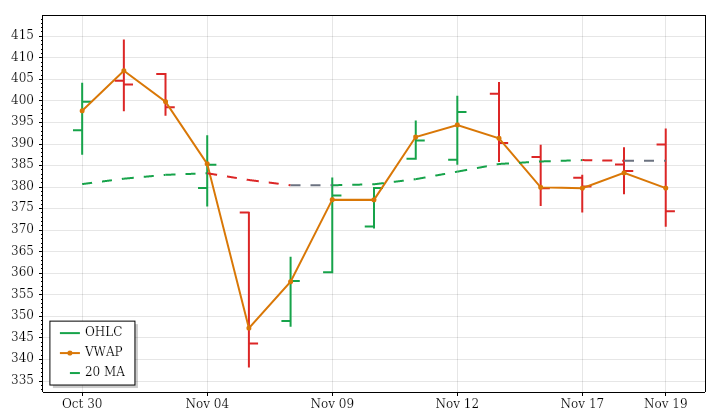
TSLA – Tesla Technicals Summary
TSLA’s completed daily session on November 19 closed at 374.41, falling 2.43% versus the prior close and 3.97% from the open. An opening gap higher was erased as an outside bar finished below the prior day’s low. The close beneath session VWAP adds to the weak daily picture, although the evidence does not place the finish near the session low.
Near-term averages and the 15-session price trend are falling. Intermediate conditions are mixed because price is below a rising average, while the far-term picture is also mixed, with price only slightly above a falling benchmark. Range was about one-and-a-half times average despite lookback contraction, but below-average volume remained consistent with declining participation. The ATR-median trend turned bearish while PSAR stayed long; a next-session low below 370.81 would conditionally trigger a PSAR short reversal.
Tesla News and Fundamentals
Tesla recently committed approximately $3.3 billion to expand its manufacturing facility near Berlin. The expansion comes as European Union small-series approval rules limit registrations of fully driverless vehicles to 1,500 units per model annually, a constraint relevant to its robotaxi plans. Tesla also aims to deliver its first consumer Cybercabs in December.
MSFT · D:2026-11-19 NC% ▼ -1.97% OC% ▼ -4.08%
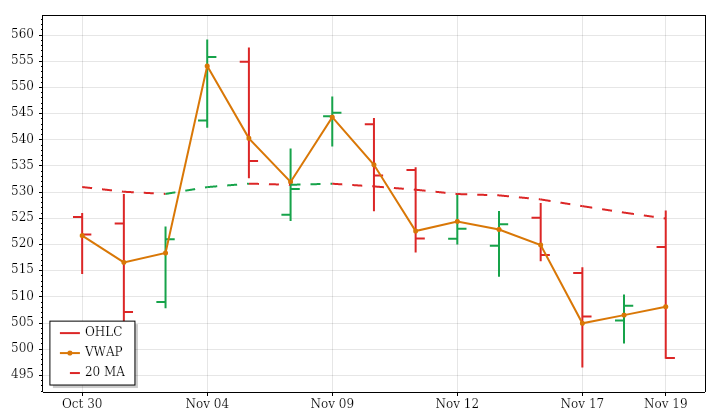
MSFT – Microsoft Technicals Summary
MSFT’s completed November 19 daily session closed at 498.30, losing 1.97% versus the prior close and 4.08% from the open. A gap higher gave way to an outside bar that breached both prior-pattern boundaries and ended near its low. The close was below the prior day’s low and session VWAP, showing a pronounced reversal from the strong opening position.
Near-term averages and the 15-session price trend are falling, but the intermediate-term picture is mixed because its average still rises above price. The far-term uptrend remains intact, with price above a rising benchmark. The latest weakness therefore conflicts with the longest horizon. Range was about 1.8 times average despite lookback contraction; volume was slightly below average alongside declining participation. A next-session high above 542.9674 would conditionally trigger a PSAR long reversal.
Microsoft News and Fundamentals
Microsoft CEO Satya Nadella apologized after a hidden bug disrupted Outlook, Teams and Copilot, acknowledging that the company should have built better safeguards. Separately, about 60,000 Microsoft employees have until early December to decide whether to accept a voluntary exit offer.
NVDA · D:2026-11-19 NC% ▼ -3.30% OC% ▼ -4.54%
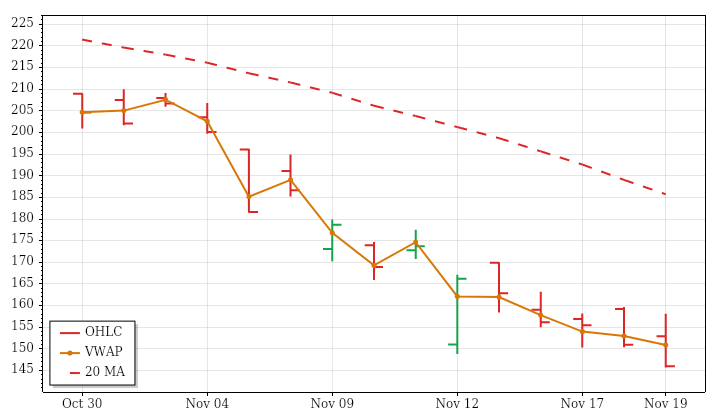
NVDA – Nvidia Technicals Summary
NVDA’s completed daily session on November 19 closed at 145.98, down 3.30% from the prior close and 4.54% from the open. The opening gain was erased, and another lower high and lower low left price near the session low and below the prior day’s low. The close was beneath session VWAP and very near the 52-week low.
This weakness aligns with falling near-, intermediate- and far-term averages, all above price. The 15-session decline has also been comparatively directional, so the latest session continues rather than contradicts the lookback story. A second consecutive large-range bar and above-average volume fit the established combination of expanding ranges and increasing participation; average trade size was also larger. PSAR remains bearish. A next-session high above 159.7 would conditionally trigger a long reversal, not confirm one beforehand.
Nvidia News and Fundamentals
California Attorney General Rob Bonta issued Nvidia an investigative subpoena over whether restricted chips reached China and whether investors were misled. The investigation follows Jensen Huang’s resignation a week earlier amid allegations involving a suspected Chinese spy linked to Megaspeed, which is being investigated for possible chip diversion. Separately, lawmakers released information showing Commerce Department approval of more than 800,000 AI-chip sales to Chinese companies, some with military ties. Nvidia will present at UBS’s technology conference December 1.
META · D:2026-11-19 NC% ▼ -3.27% OC% ▼ -4.55%
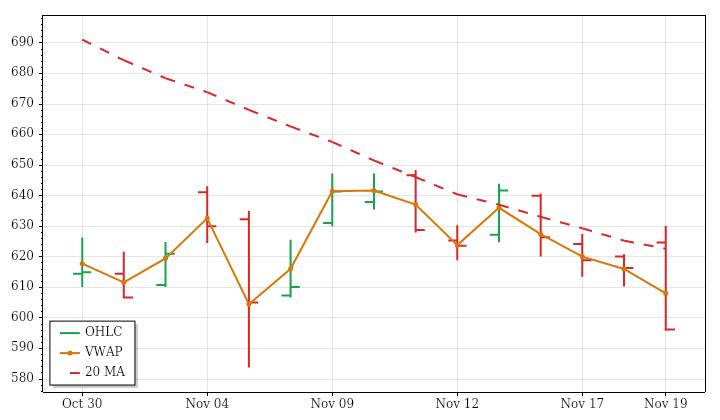
META – Meta Platforms Technicals Summary
META’s completed daily session on November 19 reversed an opening gap higher and closed at 596.22. The decline measured 3.27% from the prior close and 4.55% from the open. An outside bar finished near its low and below the prior day’s low, while the close beneath session VWAP confirmed a weak position within the day’s trading.
The session aligns with the intermediate-term downtrend, but the near- and far-term averages are still slightly rising despite price being below them. The upward 15-session price trend offers little directional conviction because net progress across that window was minimal. Range was substantially above average against a contracting lookback trend, while below-average volume continued the pattern of declining participation. The ATR-median measure crossed bearish, and PSAR remains bearish; a next-session high above 641.4662 would conditionally trigger its long reversal.
Meta News and Fundamentals
Meta plans to price its upcoming pocket-sized Muse Charm AI device at $300 and include free 5G service for up to 12 months, The Information reported November 19, citing an unnamed source. The device was previously teased at Meta’s Connect event. Separately, Reuters reported that employees had raised concerns in internal posts about Meta’s Muse AI agent mixing up conversations across accounts and exposing private user data.
AMZN · D:2026-11-19 NC% ▼ -3.87% OC% ▼ -5.57%
AMZN – Amazon Technicals Summary
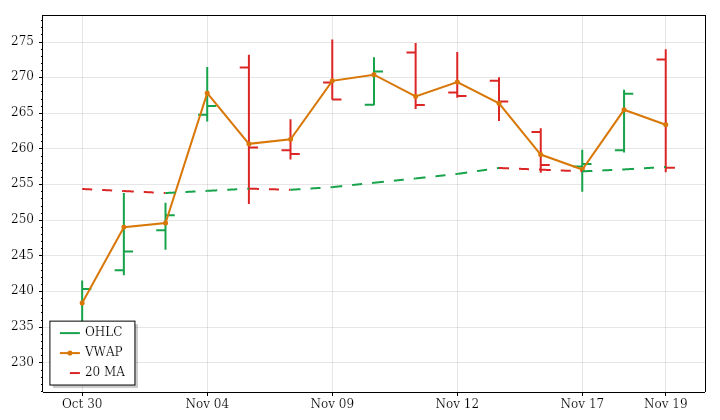
AMZN’s completed November 19 daily session reversed an opening gap higher and closed at 257.37. The loss was 3.87% versus the prior close, compared with a larger 5.57% decline from the open. An outside bar ending near its low and below the prior day’s low captures the reversal’s breadth. The close was materially below session VWAP, reinforcing the weak finish rather than merely reflecting the opening gap’s disappearance.
The damage left price below its rising near-term average but still slightly above its rising intermediate-term benchmark; the far-term structure also remains upward. Thus, the session challenged rather than fully aligned with the longer-term trend. Range nearly doubled its recent average despite contracting lookback ranges, while volume was slightly below average. PSAR remains long; a next-session low below 254 would conditionally trigger a short reversal.
Amazon News and Fundamentals
Amazon launched app and website notices opposing New York City’s proposed Delivery Protection Act, which would require it to directly employ delivery workers. The company warned on November 19 that passage could add up to $5 per order, slow deliveries and prompt it to move delivery infrastructure outside the city. Separately, union leaders from 19 countries urged governments to stop awarding Amazon public contracts, citing concerns about its worker-rights record.
GOOGL · D:2026-11-19 NC% ▼ -3.46% OC% ▼ -7.35%
GOOGL – Alphabet Technicals Summary
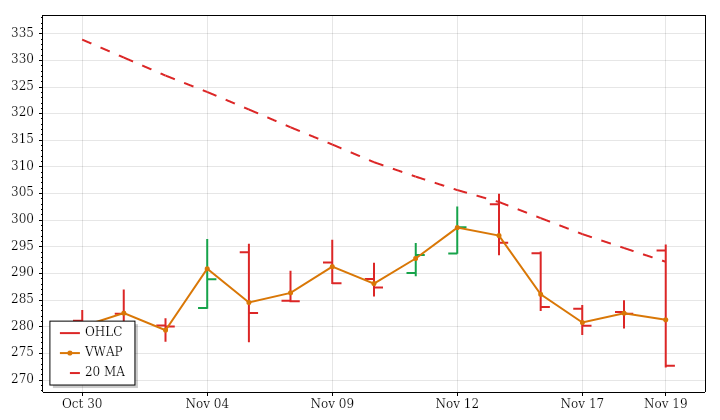
GOOGL’s completed daily session on November 19 erased a substantial opening gap higher and closed at 272.66. It fell 3.46% versus the prior close but 7.35% from the open, an important distinction given the elevated starting point. The outside bar finished near its low, below the prior day’s low and well below session VWAP, leaving price close to its 52-week low.
Near-, intermediate- and far-term averages are all falling with price below them, so the session aligns with that broader bearish structure. The upward 15-session price trend is a conflicting lookback feature, not evidence that those average-based downtrends have reversed. Range expanded to roughly 2.7 times average and volume exceeded average despite contracting ranges and declining volume over the lookback. A next-session high above 302.0802 would conditionally reverse PSAR to long.
| Instrument | Bias | Date | DNC% | DOC% | O | H | L | C | VWAP | Vol |
|---|---|---|---|---|---|---|---|---|---|---|
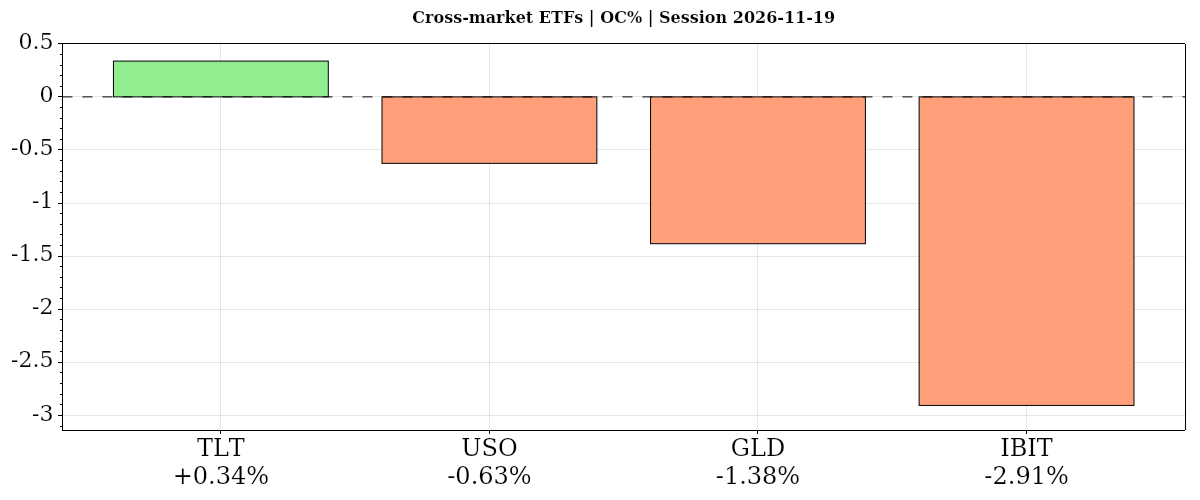
| ▲ TLT | ▲ ▲ ▲ | 2026-11-19 | ▲ +0.16% | ▲ +0.34% | 80.08 | 80.45 | 79.81 | 80.35 | ▲ 80.23 | 38,760,693 |
| ▼ USO | ▲ ▼ ▼ | 2026-11-19 | ▲ +1.45% | ▼ -0.63% | 138.96 | 139.45 | 136.80 | 138.09 | ▼ 138.20 | 2,517,581 |
| ▼ GLD | ▼ ▼ ▼ | 2026-11-19 | ▼ -1.76% | ▼ -1.38% | 339.88 | 340.52 | 335.05 | 335.18 | ▼ 337.13 | 11,265,419 |
| ▼ IBIT | ▼ ▼ ▼ | 2026-11-19 | ▼ -0.79% | ▼ -2.91% | 36.13 | 36.19 | 34.88 | 35.08 | ▼ 35.50 | 72,940,314 |
| AVG/Sum | — | — | -0.23% | -1.14% | — | — | — | — | — | 125,484,007 |
Cross-Market ETFs
Negative confluence: average DOC% -1.15% from the open, DNC% -0.24% versus the prior close. TLT alone advanced from the open; bitcoin lagged and gold fell. Oil diverged from equities versus the prior close, gaining 1.45% despite losing 0.63% from the open; TLT’s modest gain also contrasted with equities despite its longer-term downtrend.
TLT · D:2026-11-19 NC% ▲ +0.16% OC% ▲ +0.34%
TLT – Long-Term Treasury Bonds Technicals Summary
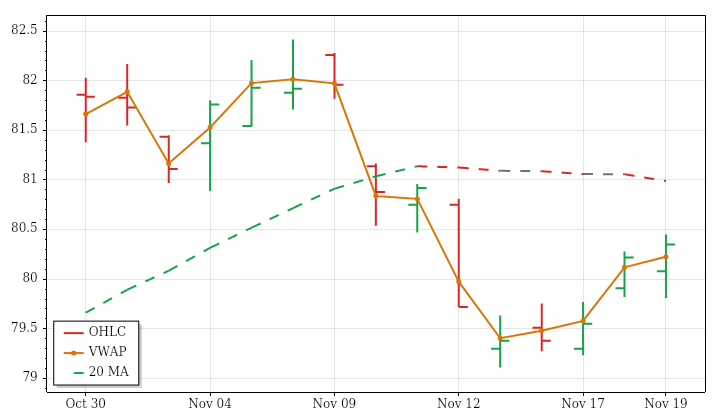
TLT’s completed November 19 daily session closed at 80.35, gaining 0.16% versus the prior close and 0.34% from the open. An opening gap lower was filled, and an outside bar finished near its high and above the prior day’s high. The close above session VWAP gives the modest advance a firmer intraday structure than the small prior-close return alone suggests.
The advance conflicts with the downward 15-session price trend and falling far-term average. Shorter horizons remain mixed: price is above a falling near-term average but slightly below a rising intermediate-term benchmark. Range was only marginally above average despite lookback contraction, while above-average volume matched a gently increasing participation trend. PSAR is long, although the ATR-median trend remains bearish. A next-session low below 79.1109 would conditionally trigger a PSAR short reversal.
Treasury Bonds News and Fundamentals
Minutes from the Federal Reserve’s October meeting revealed that more officials favored an interest-rate increase than the recorded vote suggested. Governor Christopher Waller also said the central bank might need to surprise markets, with a half-percentage-point increase under discussion—a policy development directly relevant to long-term Treasury bonds.
USO · D:2026-11-19 NC% ▲ +1.45% OC% ▼ -0.63%
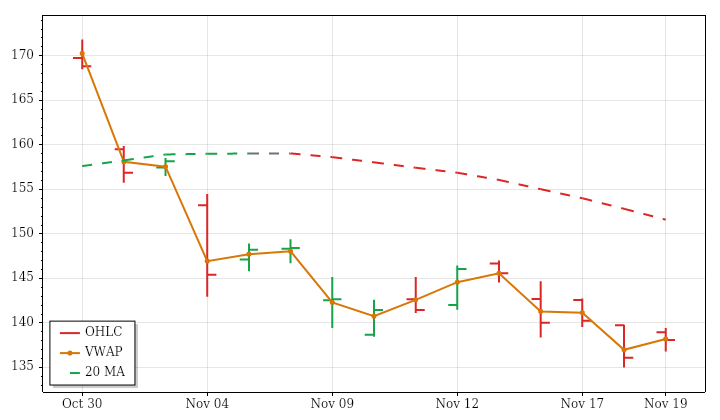
USO – Oil Technicals Summary
USO’s completed November 19 daily session closed at 138.09, up 1.45% versus the prior close but down 0.63% from the open. The opening gap higher remained unfilled, explaining how the session retained a prior-close gain despite intraday weakness. An inside bar stayed within the prior day’s range, and the close was slightly below session VWAP rather than showing a strong finish.
Near- and intermediate-term averages remain falling above price, consistent with the downward 15-session trend. The far-term average is rising beneath price, leaving shorter-horizon weakness in conflict with the longer-term structure. Range was well below average and volume was roughly half average, both consistent with contracting ranges and declining participation over the lookback. PSAR remains bearish; a next-session high above 141.5879 would conditionally trigger a long reversal.
Oil News and Fundamentals
Oil rose amid renewed Middle East tensions after a projectile launched by Yemen’s Houthi rebels struck the tallest tower in Riyadh on November 19. Earlier reports described mixed or steady crude prices as traders weighed a larger U.S. inventory build and a growing supply outlook against shipping risks in the Strait of Hormuz. Rising U.S. inventories and weaker export economics were also reported as pressures on WTI.
GLD · D:2026-11-19 NC% ▼ -1.76% OC% ▼ -1.38%
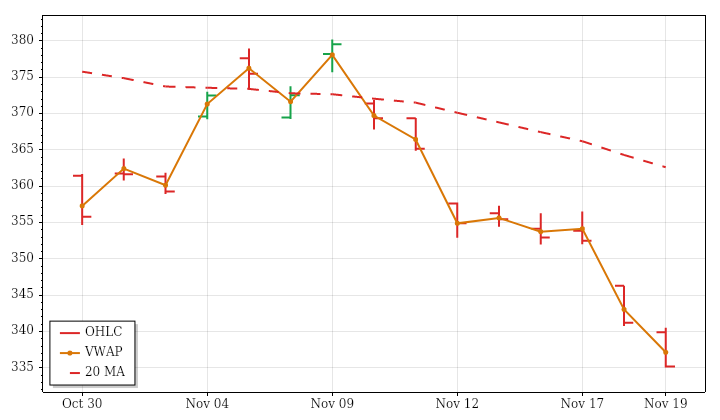
GLD – Gold Technicals Summary
GLD’s completed November 19 daily session closed at 335.18, down 1.76% from the prior close and 1.38% from the open. The opening gap lower remained unfilled, and the session produced another lower high and lower low. Price ended near the day’s low, below the prior day’s low and session VWAP, with the close almost at its 52-week low.
The weakness is aligned across near-, intermediate- and far-term averages, all of which are falling with price beneath them. It also extends the downward 15-session price trend rather than contradicting a broader recovery. A fourth consecutive large-range bar accompanied above-average volume; both observations fit the lookback pattern of expanding ranges and increasing participation. PSAR remains in a downtrend. A next-session high above 366.0377 would trigger a conditional long reversal, not establish one in advance.
Gold News and Fundamentals
SPDR Gold shares fell November 19 as gold dropped below $3,700 an ounce. Gold also declined in Asian trading, with Critical Metals attributing pressure to elevated Treasury yields and a stronger dollar, which increase the cost of holding the nonyielding metal. Weaker-than-expected U.S. labor and manufacturing releases provided little relief: weekly jobless claims reached 203,000, while the Philadelphia Fed manufacturing survey fell to a six-month low, amid persistent expectations of further Federal Reserve rate increases.
IBIT · D:2026-11-19 NC% ▼ -0.79% OC% ▼ -2.91%
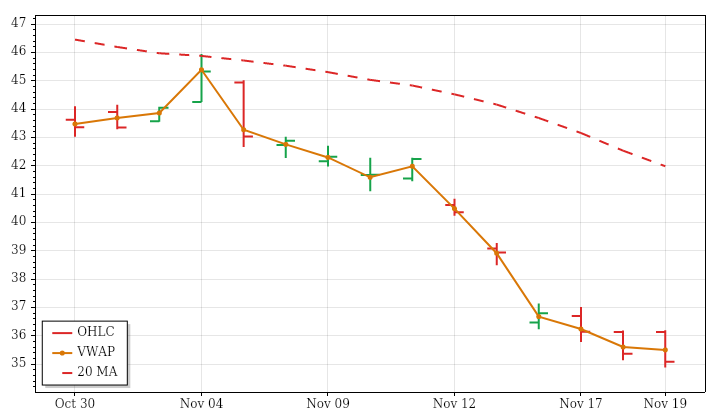
IBIT – Bitcoin Technicals Summary
IBIT’s completed November 19 daily session closed at 35.08, down 0.79% from the prior close and 2.91% from the open. The opening gain disappeared as an outside bar finished near its low and below the prior day’s low. Price also closed beneath session VWAP, showing that the modest prior-close loss understates the retreat from the day’s opening level.
The action reinforces falling near- and intermediate-term averages and a comparatively directional 15-session decline. Far-term conditions remain mixed because price is below a slightly rising average, rather than below a falling one. The third consecutive large-range session ran against contracting lookback ranges. Volume was 41% above average despite a declining lookback trend, and average trade size was larger. PSAR remains bearish; a next-session high above 38.056 would conditionally trigger a long reversal.
Glossary: Instrument — ticker symbol; hover for the instrument or company name; Date — session date. DNC% — prior-session close to this session’s close; DOC% — daily session open-to-close percentage change. O — open; H — high; L — low; C — close, all for the table’s daily or weekly session; VWAP — volume-weighted average price; its arrow shows whether the close is above or below VWAP. Vol — period trading volume.
Bias — three directional readings, in order: DNC%, DOC%, then VWAP. ▲ positive/above; ▼ negative/below; — neutral or unavailable. Matching arrows show alignment; opposing arrows show mixed conditions. AVG/Sum — simple average of percentage changes and sum of reported volumes.
Futures Session Fib Grid Analysis – Snapshot
Session Fib Grids normalise market positioning as percentages, making direction and alignment comparable across different asset types.
Latest available snapshot for each instrument; Time(CT) shows the individual update date and time.
| Instrument | Bias | Time(CT) | YSFG | MSFG | WSFG | RSFG | SFG | TSI |
|---|---|---|---|---|---|---|---|---|
| ▼ ES | ▼ ▼ ▼ ▼ ▲ ▼ | 2026-11-20 07:17:55 | ▼ -3 | ▼ -176 | ▼ -154 | ▼ -262 | ▲ +1 | ▼ -120 |
| ▼ NQ | ▼ ▼ ▼ ▼ ▲ ▼ | 2026-11-20 07:17:53 | ▼ -12 | ▼ -105 | ▼ -101 | ▼ -258 | ▲ +2 | ▼ -142 |
| ▼ YM | ▼ ▼ ▼ ▼ ▼ ▼ | 2026-11-20 07:17:54 | ▼ -16 | ▼ -134 | ▼ -191 | ▼ -236 | ▼ -4 | ▼ -145 |
| ▼ EMD | ▲ ▼ ▼ ▼ ▼ ▼ | 2026-11-20 07:17:15 | ▲ +5 | ▼ -102 | ▼ -144 | ▼ -215 | ▼ -6 | ▼ -143 |
| ▼ RTY | ▲ ▼ ▼ ▼ ▼ ▼ | 2026-11-20 07:17:55 | ▲ +7 | ▼ -124 | ▼ -138 | ▼ -212 | ▼ -6 | ▼ -93 |
| ▼ FDAX | ▼ ▼ ▼ ▼ ▼ ▼ | 2026-11-20 07:17:54 | ▼ -4 | ▼ -91 | ▼ -192 | ▼ -68 | ▼ -10 | ▼ -209 |
| ▼ NKD | ▲ ▼ ▼ ▼ ― ▼ | 2026-11-20 07:17:35 | ▲ +67 | ▼ -84 | ▼ -98 | ▼ -87 | — 0 | ▼ -103 |
| Instrument | Bias | Time(CT) | YSFG | MSFG | WSFG | RSFG | SFG | TSI |
|---|---|---|---|---|---|---|---|---|
| ▼ BTC | ▼ ▼ ▼ ▼ ― ▼ | 2026-11-20 07:16:46 | ▼ -104 | ▼ -113 | ▼ -42 | ▼ -97 | — 0 | ▼ -84 |
| ▼ GC | ▼ ▼ ▼ ▼ ▼ ▼ | 2026-11-20 07:17:55 | ▼ -233 | ▼ -79 | ▼ -124 | ▼ -181 | ▼ -3 | ▼ -60 |
| ▼ CL | ▲ ▼ ▼ ▼ ▲ ▲ | 2026-11-20 07:17:53 | ▲ +136 | ▼ -107 | ▼ -54 | ▼ -31 | ▲ +2 | ▲ +38 |
| ▼ 6E | ▼ ▼ ▼ ▼ ▲ ▲ | 2026-11-20 07:17:44 | ▼ -74 | ▼ -70 | ▼ -25 | ▼ -2 | ▲ +21 | ▲ +131 |
| ▲ ZB | ▼ ▼ ▲ ▲ ▼ ▲ | 2026-11-20 07:17:31 | ▼ -34 | ▼ -11 | ▲ +71 | ▲ +148 | ▼ -17 | ▲ +62 |
Glossary: YSFG — yearly; MSFG — monthly; WSFG — weekly; RSFG — regular trading hours (RTH); SFG — the current session, including pre-market or other sessions. TSI indicates trend strength and power.
Bias shows trend alignment across these six readings. The arrows follow the column order: YSFG, MSFG, WSFG, RSFG, SFG and TSI. Matching arrows show alignment; opposing arrows show mixed conditions.
Futures Higher Time Frame Analysis
Summary of the current state of US Indices Futures based on higher time-frame (HTF) technical analysis as of: 2026-11-20 07:15 -06:00 CT.
US Indices Futures
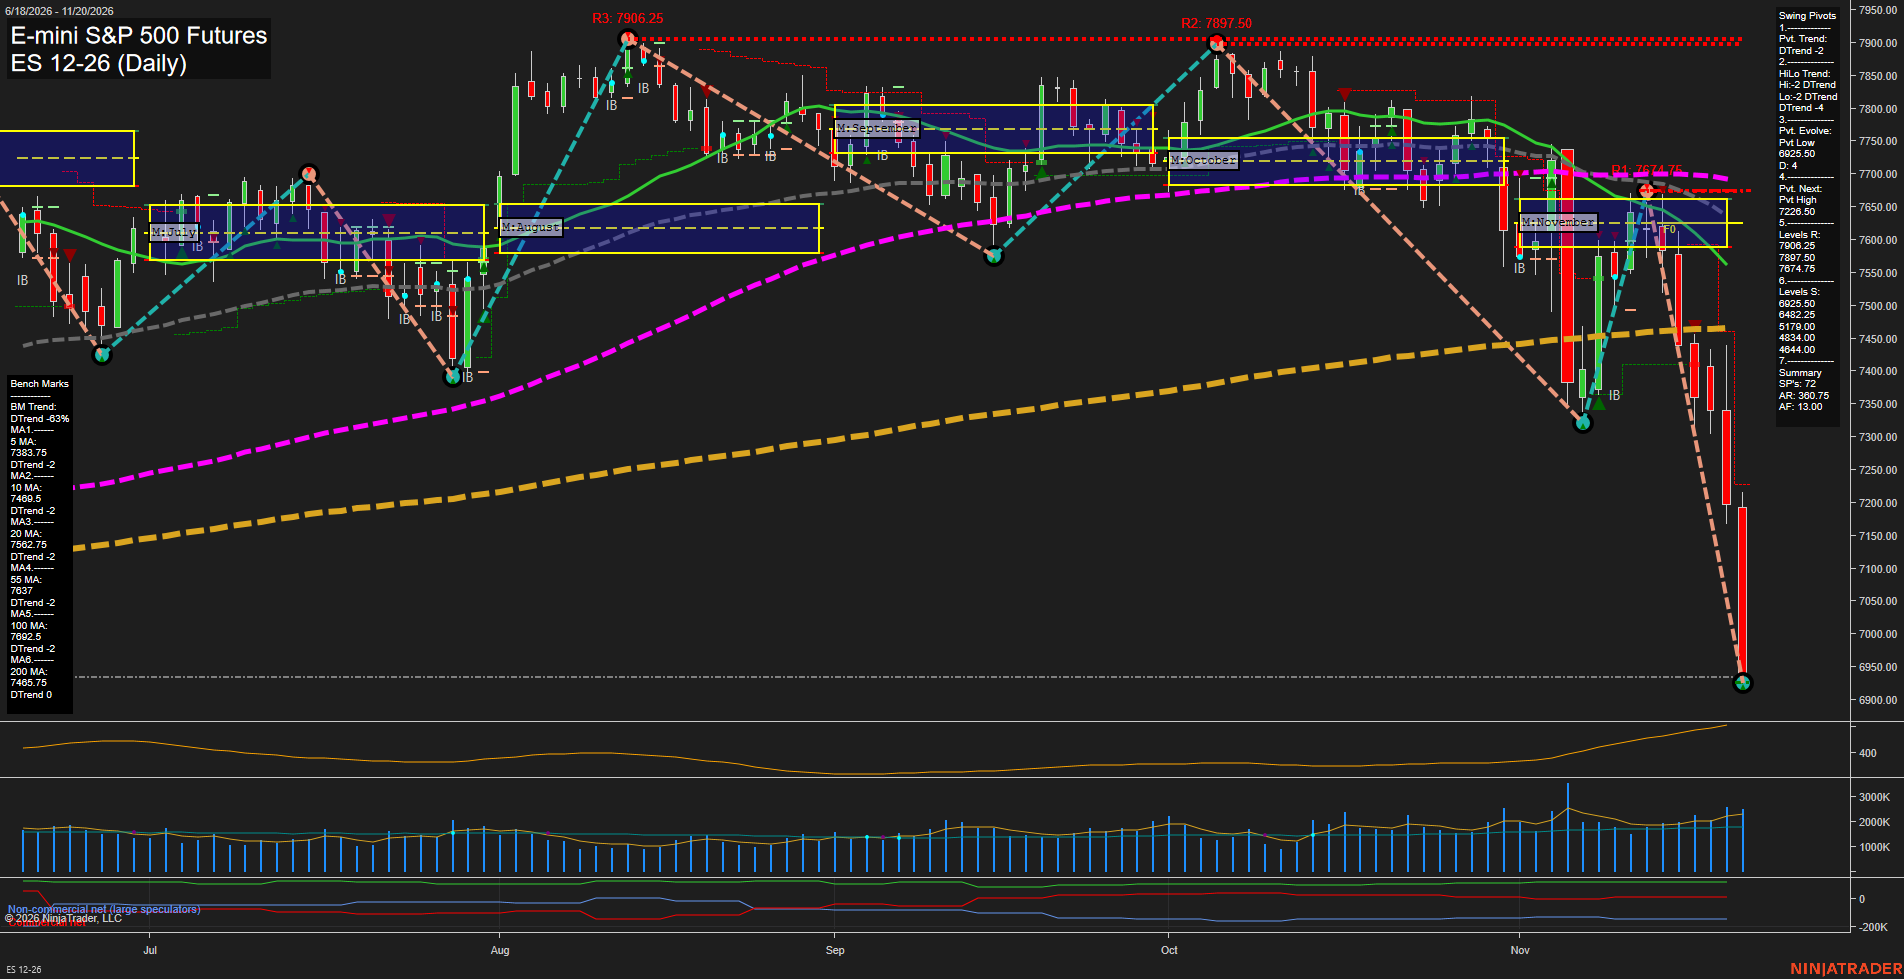
- ES YSFG bearish, MSFG/WSFG bearish, below daily and 5–55-week benchmarks, evolving daily pivot support 7124.25, daily reversal threshold 7417.25, weekly resistance 7906.25.
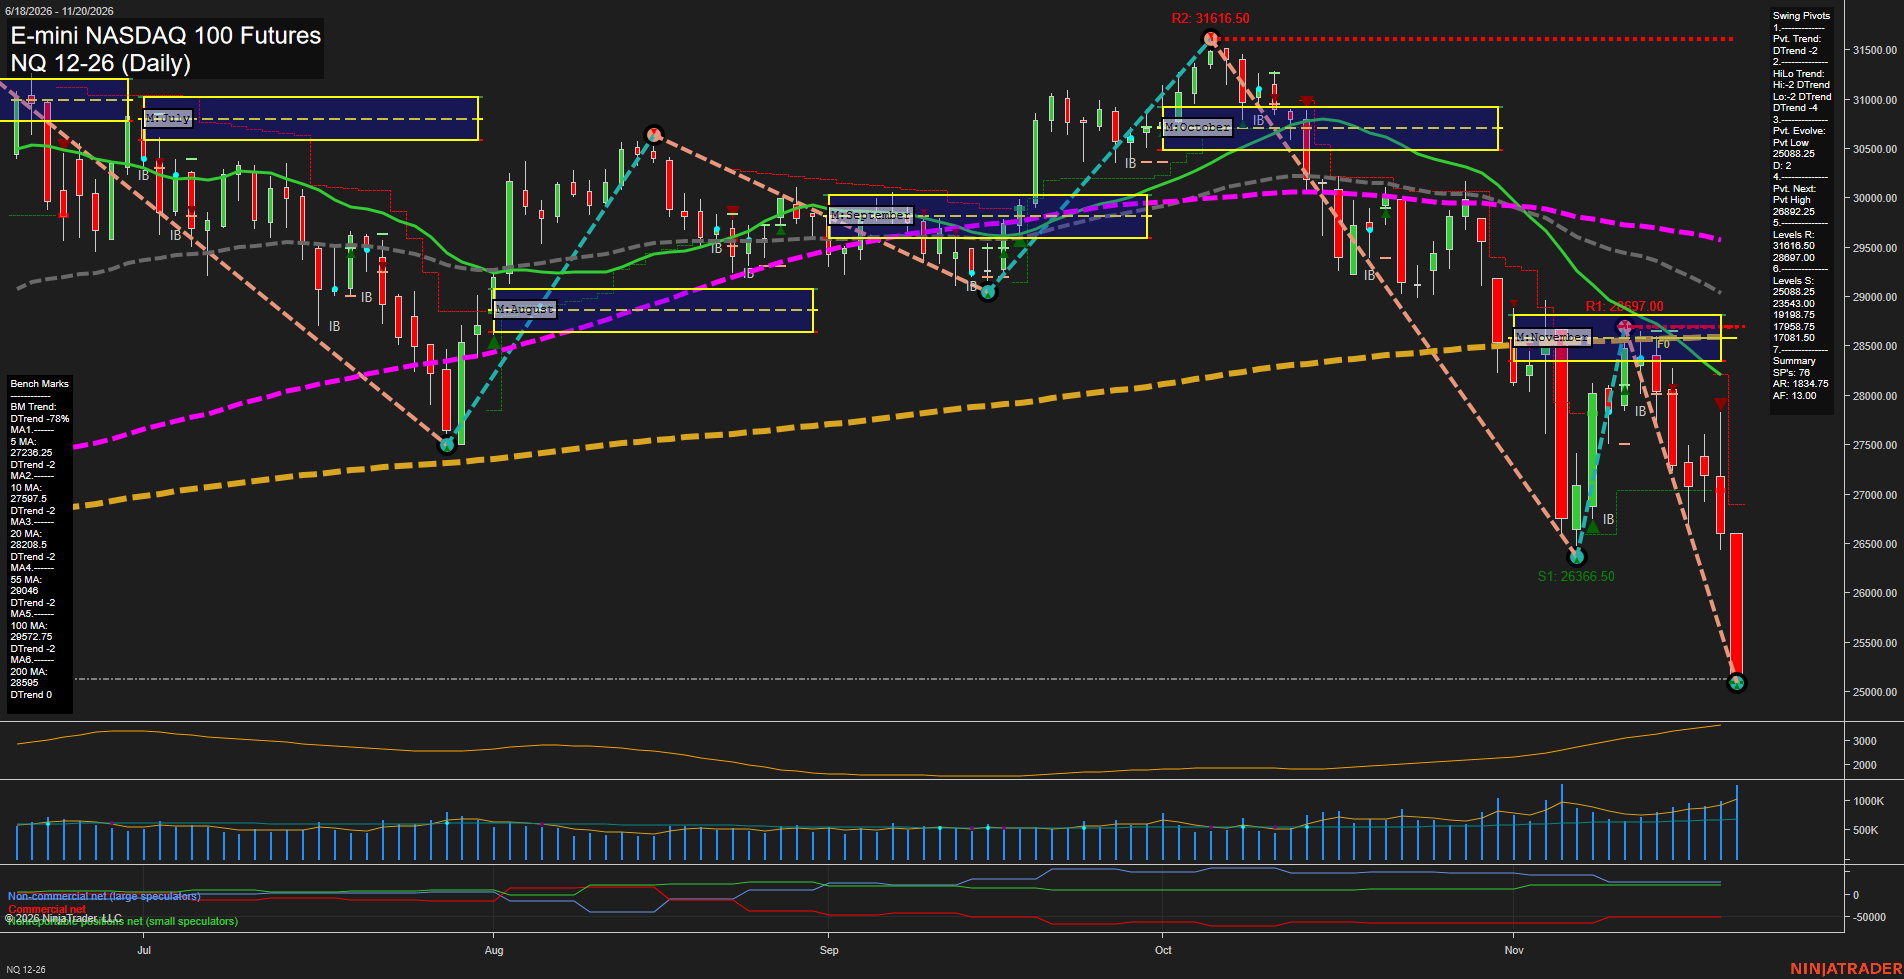
- NQ YSFG/MSFG/WSFG bearish, below daily and 5–55-week benchmarks, evolving pivot support 26076.75, 100-week support 25944.25, weekly reversal threshold 28705.75, resistance 31616.50.
- YM YSFG/MSFG/WSFG bearish, below daily and 5–55-week benchmarks, evolving pivot support 48979, 100-week support 48610, daily reversal threshold 50821, weekly resistance 55316.
- EMD YSFG above F0%, MSFG/WSFG bearish, below daily and 5–55-week benchmarks, evolving daily pivot 3508.9, 100-week support 3465.8, daily reversal threshold 3649.5.
- RTY YSFG above F0%, MSFG/WSFG bearish, below declining daily benchmarks and 55-week average, evolving pivot support 2649.4, lower support 2451.7, daily reversal threshold 2771.8.
- FDAX YSFG/MSFG/WSFG bearish, below daily and 5–55-week benchmarks, evolving daily pivot 24942, support 24925–24897, 100-week support 24656, daily reversal threshold 25888.
Overall State
- Short-Term: Bearish
- Intermediate-Term: Bearish
- Long-Term: Bullish
Conclusion
Downside directional alignment spans all six contracts: MSFG/WSFG weakness, price beneath daily and 5–55-week benchmarks, and recent short signals accompany developing pivot lows. Intermediate weekly structure differs, with RTY neutral and FDAX bullish against bearish ES, NQ, YM and EMD assessments. Long-term weekly ratings remain bullish above rising 100- and 200-week benchmarks, contrasting with uniformly bearish daily far-term ratings. EMD and RTY retain YSFG readings above F0%, while the other contracts show bearish yearly grids. Nearby support tests and opposite-pivot thresholds remain structural references, not confirmed reversals.
Note: Intra-day counter-trend pullbacks or retracements may occur, HTF is context for informational usage and market structure. Glossary: Session Fib Grids periods of YSFG:’Yearly’, MSFG:’Monthly’, WSFG:’Weekly’
For full details visit: AlphaWebTrader Technicals
SPY Daily View
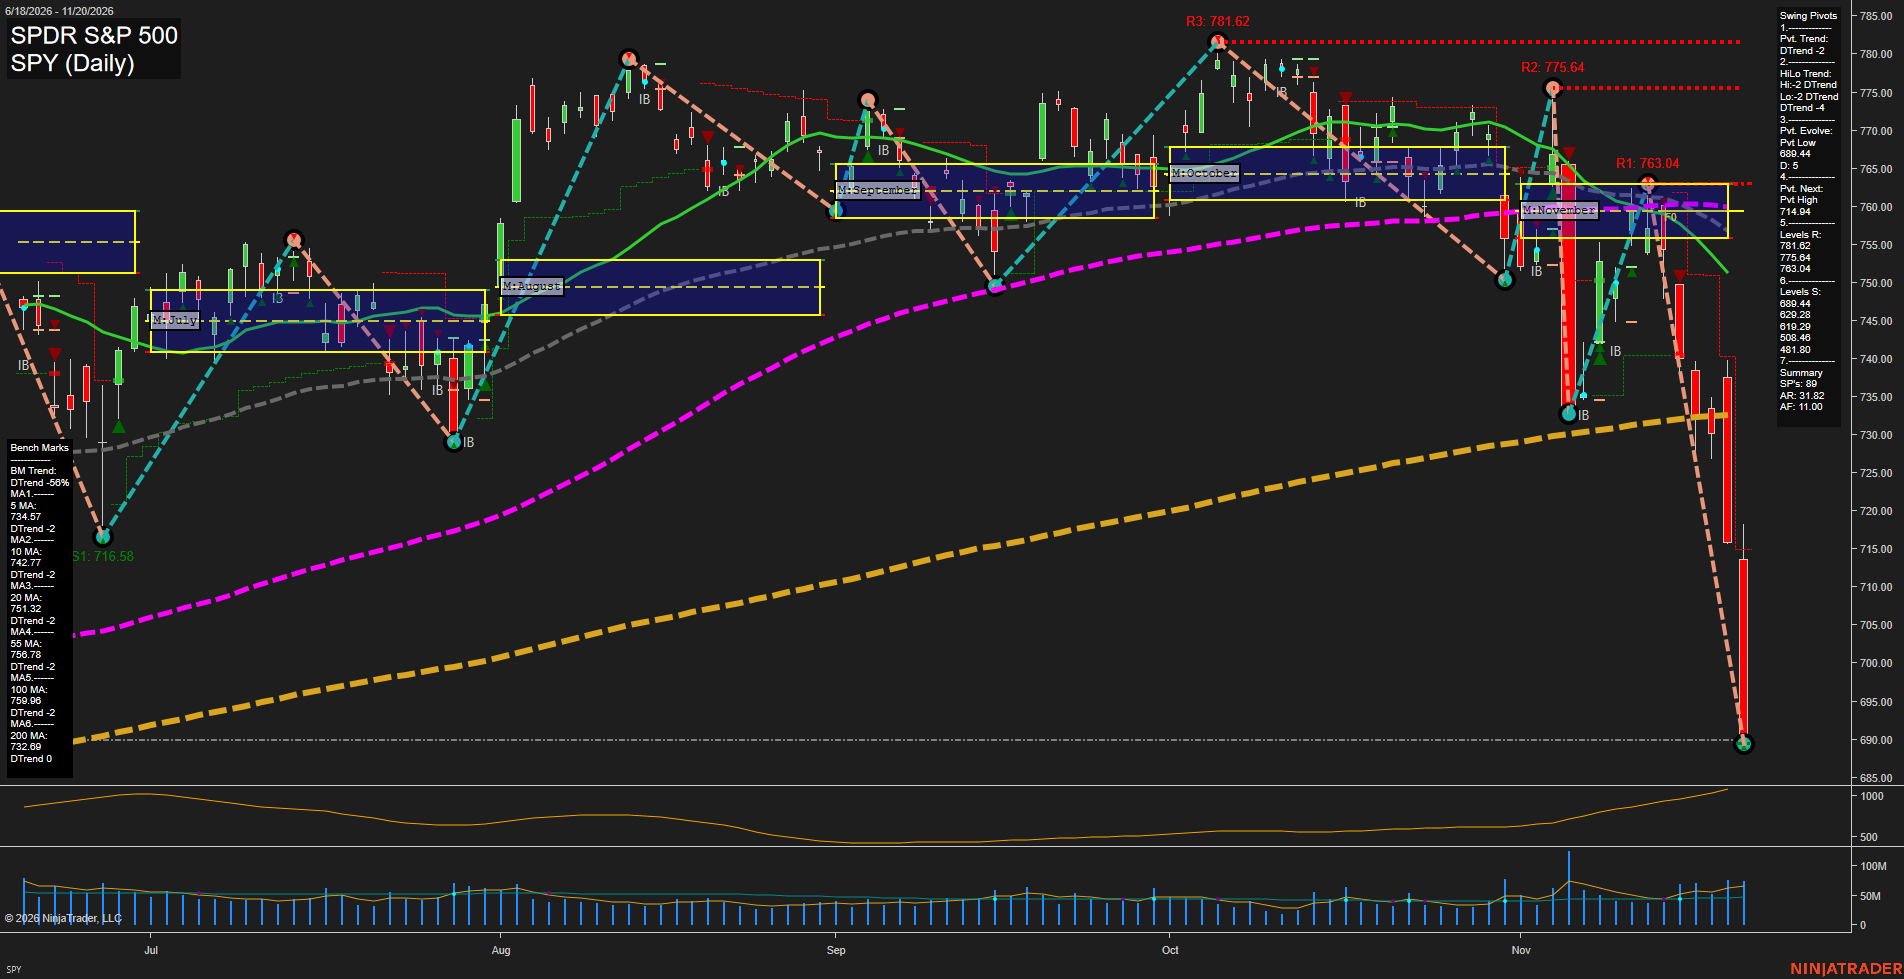
Overall Rating
- Near-Term: Bearish
- Medium-Term: Bearish
- Far-Term: Bearish.
Key Insights Summary
From a futures swing trader’s perspective, SPY indicates broad equity-index downside momentum, not an actual futures-contract price level. The rebound into 763.04 failed below earlier highs, followed by an accelerating decline to the evolving 715.65 pivot low. Price has broken below the November neutral zone, every benchmark average, and the earlier 716.58 swing low. Large bearish bars closing near their lows, rising ATR, and stronger recent volume characterize an expanding-volatility selloff rather than orderly consolidation. The 732.55 benchmark and 740.21 next-pivot threshold provide overhead reference points; 715.65 is an evolving low rather than confirmed support. Weekly and yearly grids are not displayed, so their neutral entries represent unavailable evidence, not confirmed balance. Named trade-signal readings and news catalysts are not supplied; neither news nor seasonal effects can be established from this chart.
View charts on: AlphaWebTrader HTF Charts
ES Daily View
Overall Rating
- Near-Term: Bearish
- Medium-Term: Bearish
- Far-Term: Bearish.
Key Insights Summary
From a futures swing-trading perspective, the chart shows an accelerating downside continuation rather than an orderly pullback. November’s rebound failed at the lower swing high of 7674.75, followed by a break beneath the earlier November low and the 200-day benchmark. Price is now below every listed daily benchmark, with weekly, monthly and yearly grids aligned lower. The evolving 7124.25 pivot low marks the immediate structural reference; 7417.25 is the summary’s next opposite-pivot reversal threshold, not a confirmed reversal. Large bearish bars and rising ATR indicate expanding volatility, while both supplied November 16 short signals align with the subsequent decline. The longer-term deterioration is significant despite the still-rising visual slope of the 200-day average. The image alone does not establish a news catalyst or a seasonal explanation.
View charts on: AlphaWebTrader HTF Charts
QQQ Daily View
Overall Rating
- Near-Term: Bearish
- Medium-Term: Bearish
- Far-Term: Bearish.
Key Insights Summary
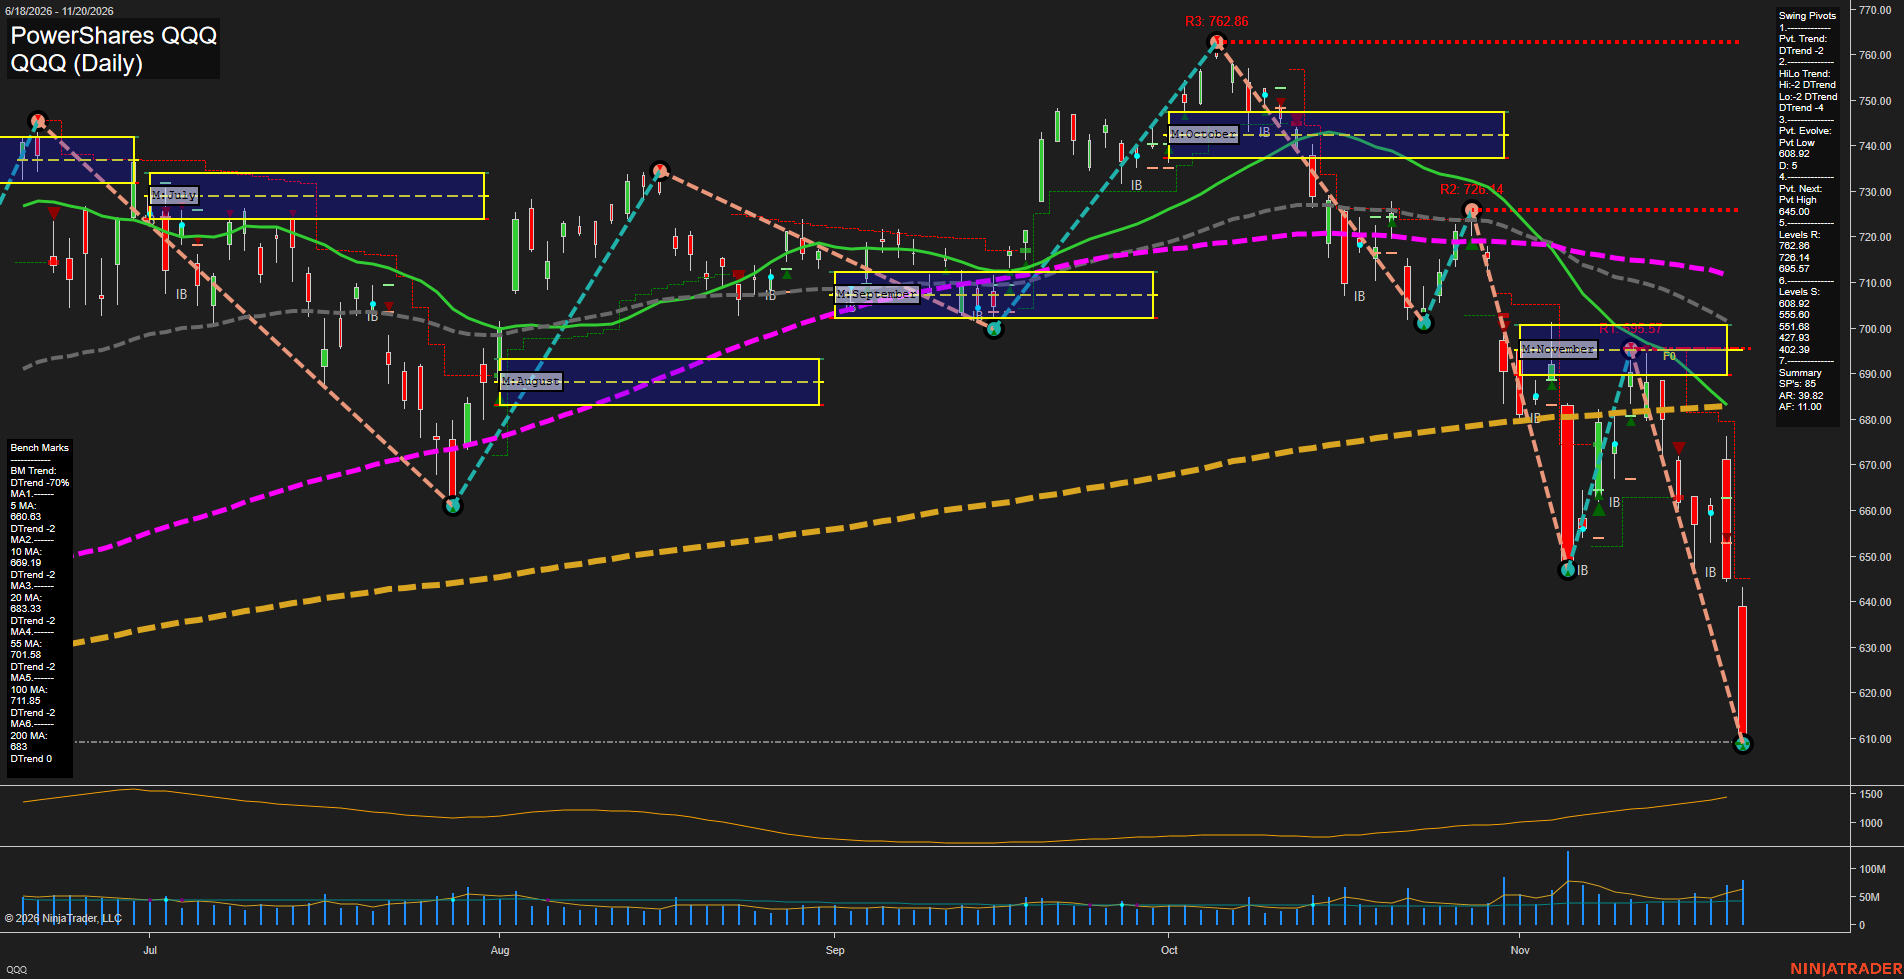
From a futures swing trader’s perspective, QQQ depicts an accelerating Nasdaq downside swing rather than a routine consolidation. The rebound to 695.57 failed below the preceding 726.14 high, followed by renewed selling into the evolving 644.34 pivot low. Large bearish bars, expanding visible ATR and heavier recent volume indicate elevated volatility and forceful downside momentum. Price is below all six benchmarks and beneath November’s approximately 690–701 neutral zone, reinforcing bearish near- and medium-term structure. The 100-day benchmark is falling, while the 200-day benchmark is flat with price substantially below it, weakening the broader technical regime. The 679.48 next-pivot threshold is distinct from established resistance at 695.57. Weekly and yearly grids and named strategy signals are not visible, so their direction cannot be independently verified. QQQ levels are ETF reference prices, not Nasdaq futures contract levels; news catalysts and seasonal effects cannot be established from this chart alone.
View charts on: AlphaWebTrader HTF Charts
NQ Daily View
Overall Rating
- Near-Term: Bearish
- Medium-Term: Bearish
- Far-Term: Bearish.
Key Insights Summary
From a futures swing trader’s perspective, the dominant structure is a bearish continuation following a failed countertrend rebound. The November bounce stalled at 28697.00 near the monthly NTZ and 200-day benchmark, establishing a lower high beneath October’s 31616.50 peak. Renewed selling has broken the earlier 26366.50 swing low and extended the evolving low to 26076.75. Price remains below every tracked daily benchmark, while weekly, monthly and yearly grids reinforce downside alignment. Large recent ranges and elevated volatility indicate forceful selling rather than orderly consolidation, although the latest pre-open bar is incomplete. The two reported November 16 short signals align with the near-term decline; no medium- or far-term signal entries are supplied. Despite the seasonally favorable late-November backdrop, the displayed technical structure remains bearish, with no confirmed bullish pivot reversal. The chart alone does not establish a news catalyst.
View charts on: AlphaWebTrader HTF Charts
USO Daily View
Overall Rating
- Near-Term: Bearish
- Medium-Term: Bearish
- Far-Term: Neutral.
Key Insights Summary
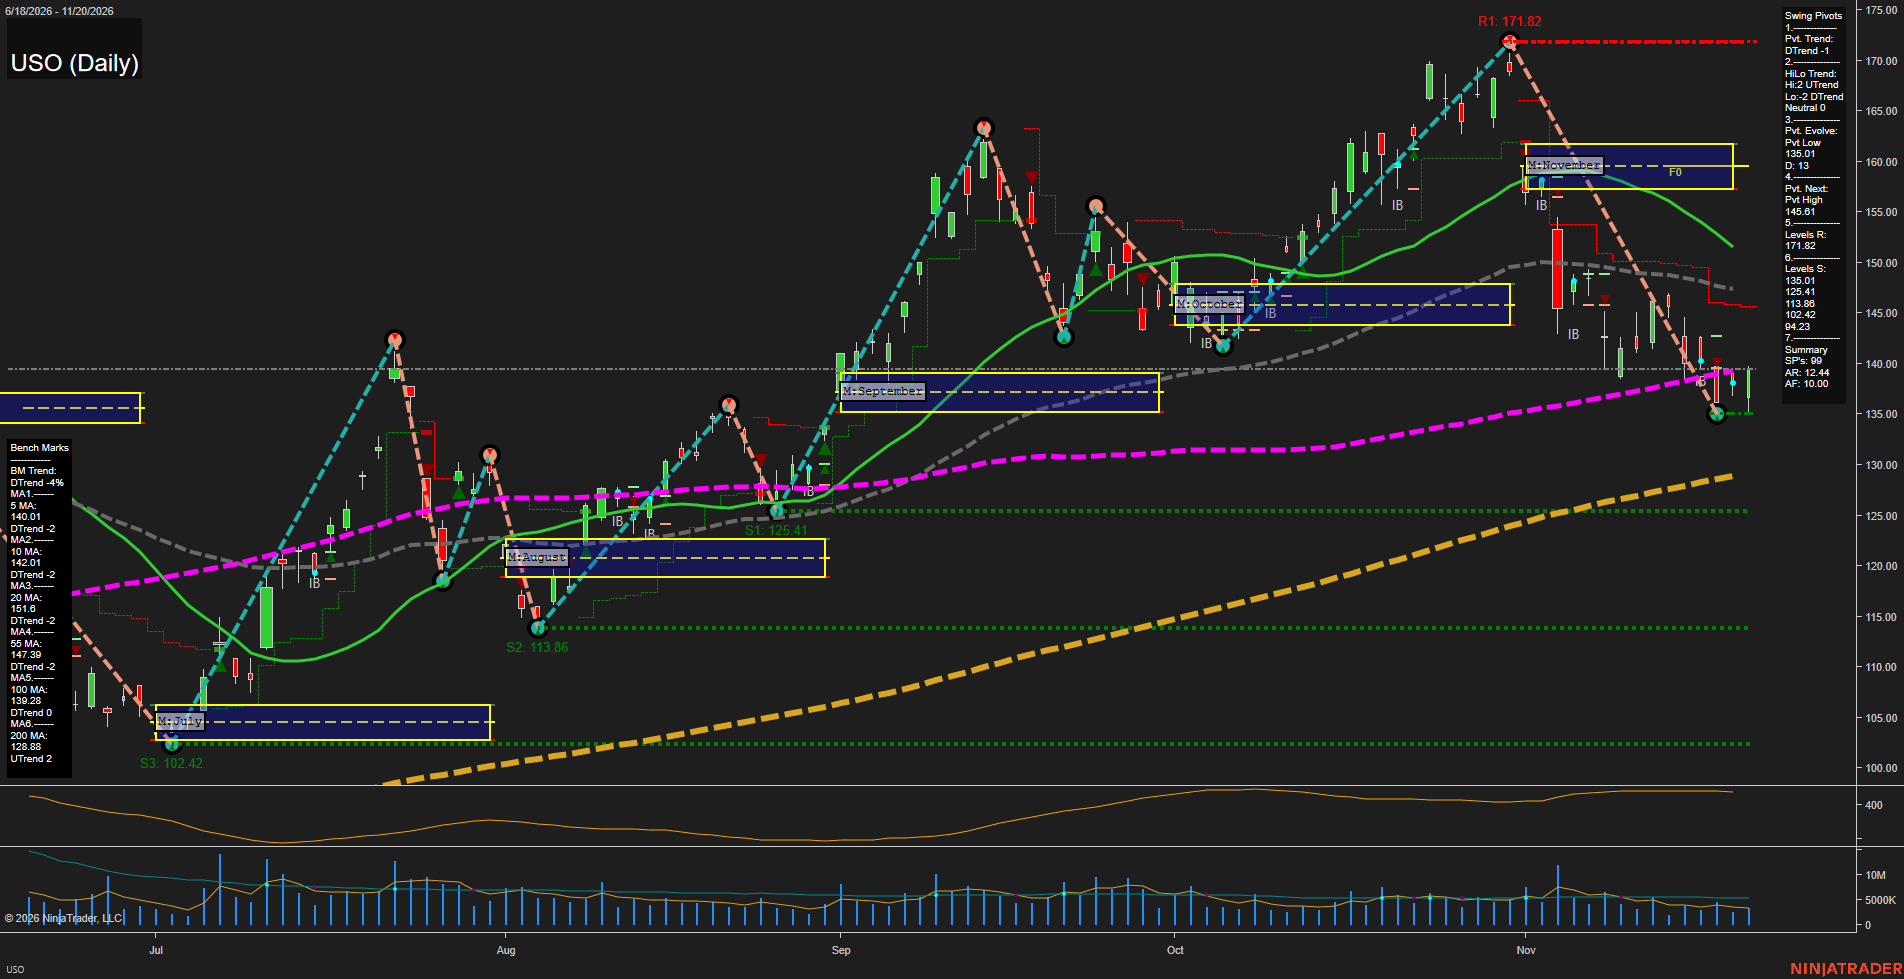
From a futures swing trader’s perspective, the dominant feature is November’s sharp reversal from 171.82 into an evolving 135.01 pivot low, followed by a modest, small-bar rebound. Price remains below the declining 5-, 10-, 20- and 55-day benchmarks and November’s approximately 157–162 neutral zone, characterizing the bounce as countertrend rather than a confirmed upside reversal. The pivot summary shows a near-term downtrend but mixed medium-term structure, with higher highs offset by lower lows. The 145.79 opposite-pivot threshold distinguishes the current downswing from a potential structural transition. Longer-term conditions are mixed as price tests the 100-day benchmark while remaining above the rising 200-day average. Weekly and yearly grids and the named strategy signals are not displayed, so their directional confirmation is unavailable. No news or seasonal catalyst can be established from this chart alone.
View charts on: AlphaWebTrader HTF Charts
CL Daily View
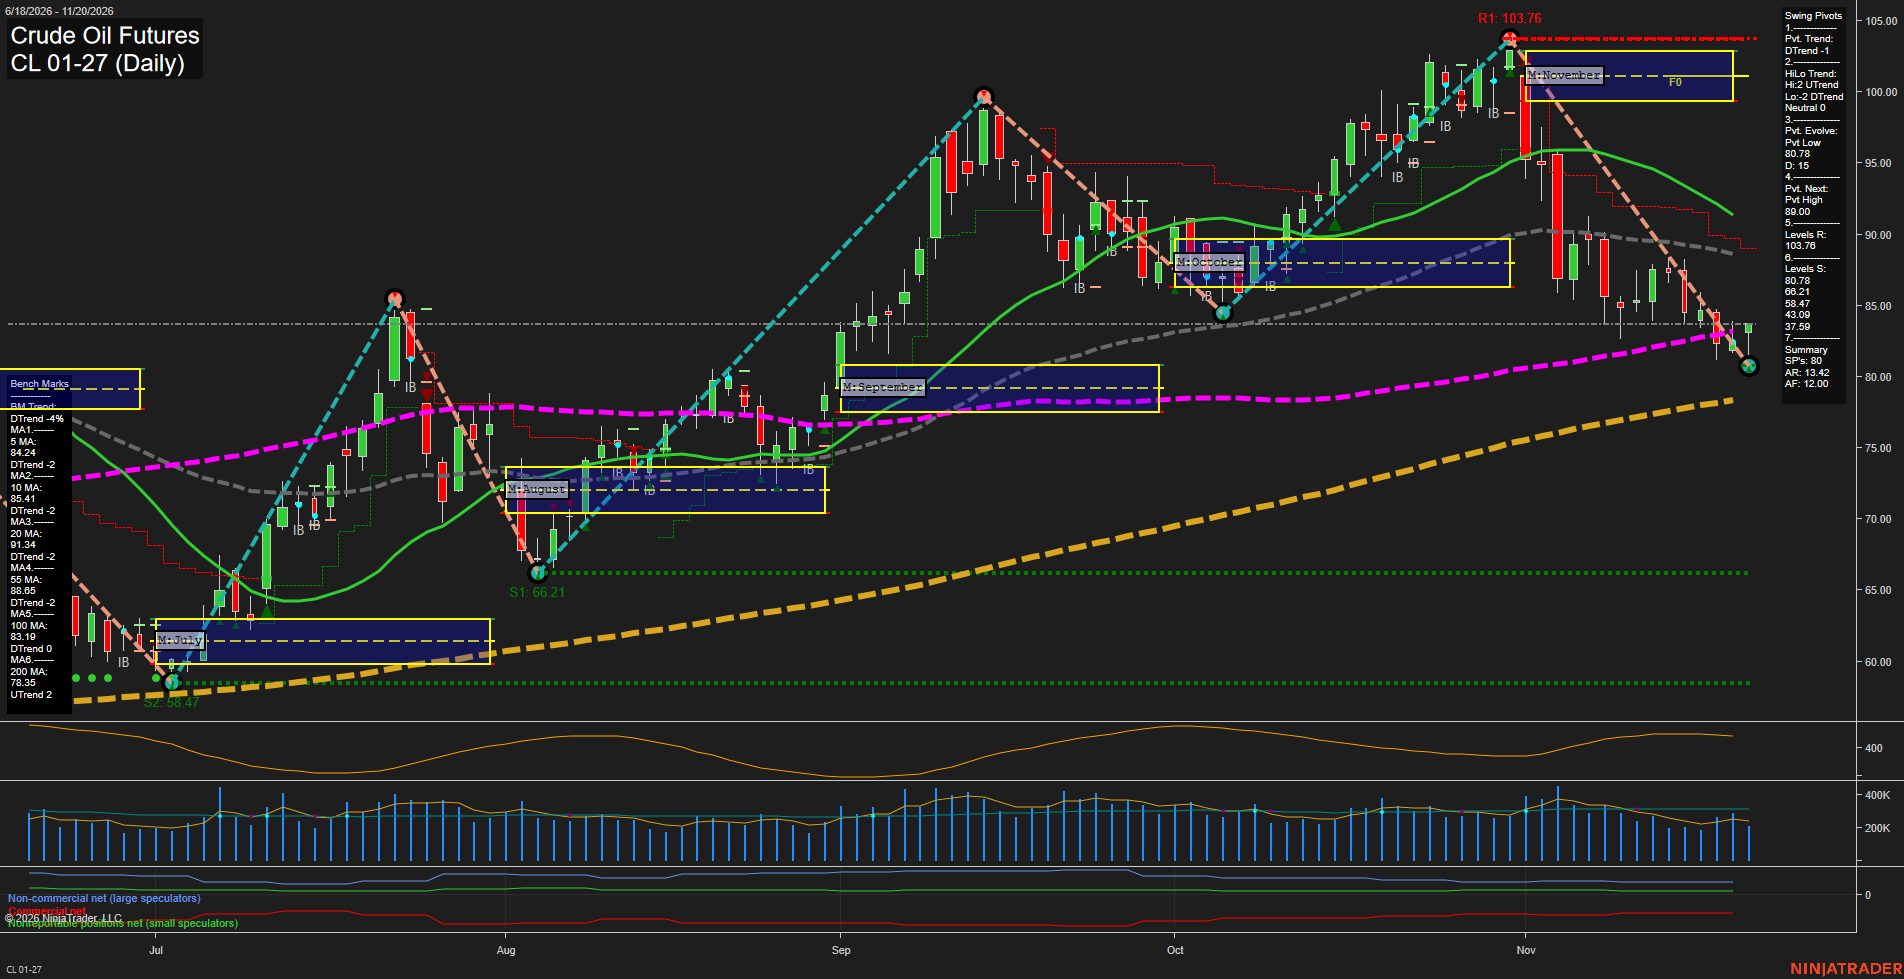
Overall Rating
- Near-Term: Bearish
- Medium-Term: Bearish
- Far-Term: Bullish.
Key Insights Summary
November’s sharp reversal from 103.76 has developed into a sustained downswing, with price below the weekly and monthly grids and all benchmarks through the 100-day average. The evolving 80.78 pivot low marks immediate structural support; the rebound toward approximately 82.50 has not reversed the near-term pivot downtrend. The 83.19–85.41 benchmark cluster represents nearby overhead resistance, while 88.98 is the next opposite-pivot threshold. Medium-term pressure remains bearish despite the neutral high/low pivot classification. The far-term bullish rating reflects the positive yearly grid and rising 200-day average at 78.35, although the 100-day benchmark is weakening. ATR of 415 indicates substantial daily volatility. The supplied short signals align with the downswing but reference December contracts, whereas the displayed chart is January 2027. News catalysts and seasonal drivers cannot be established from this chart alone.
View charts on: AlphaWebTrader HTF Charts
GLD Daily View
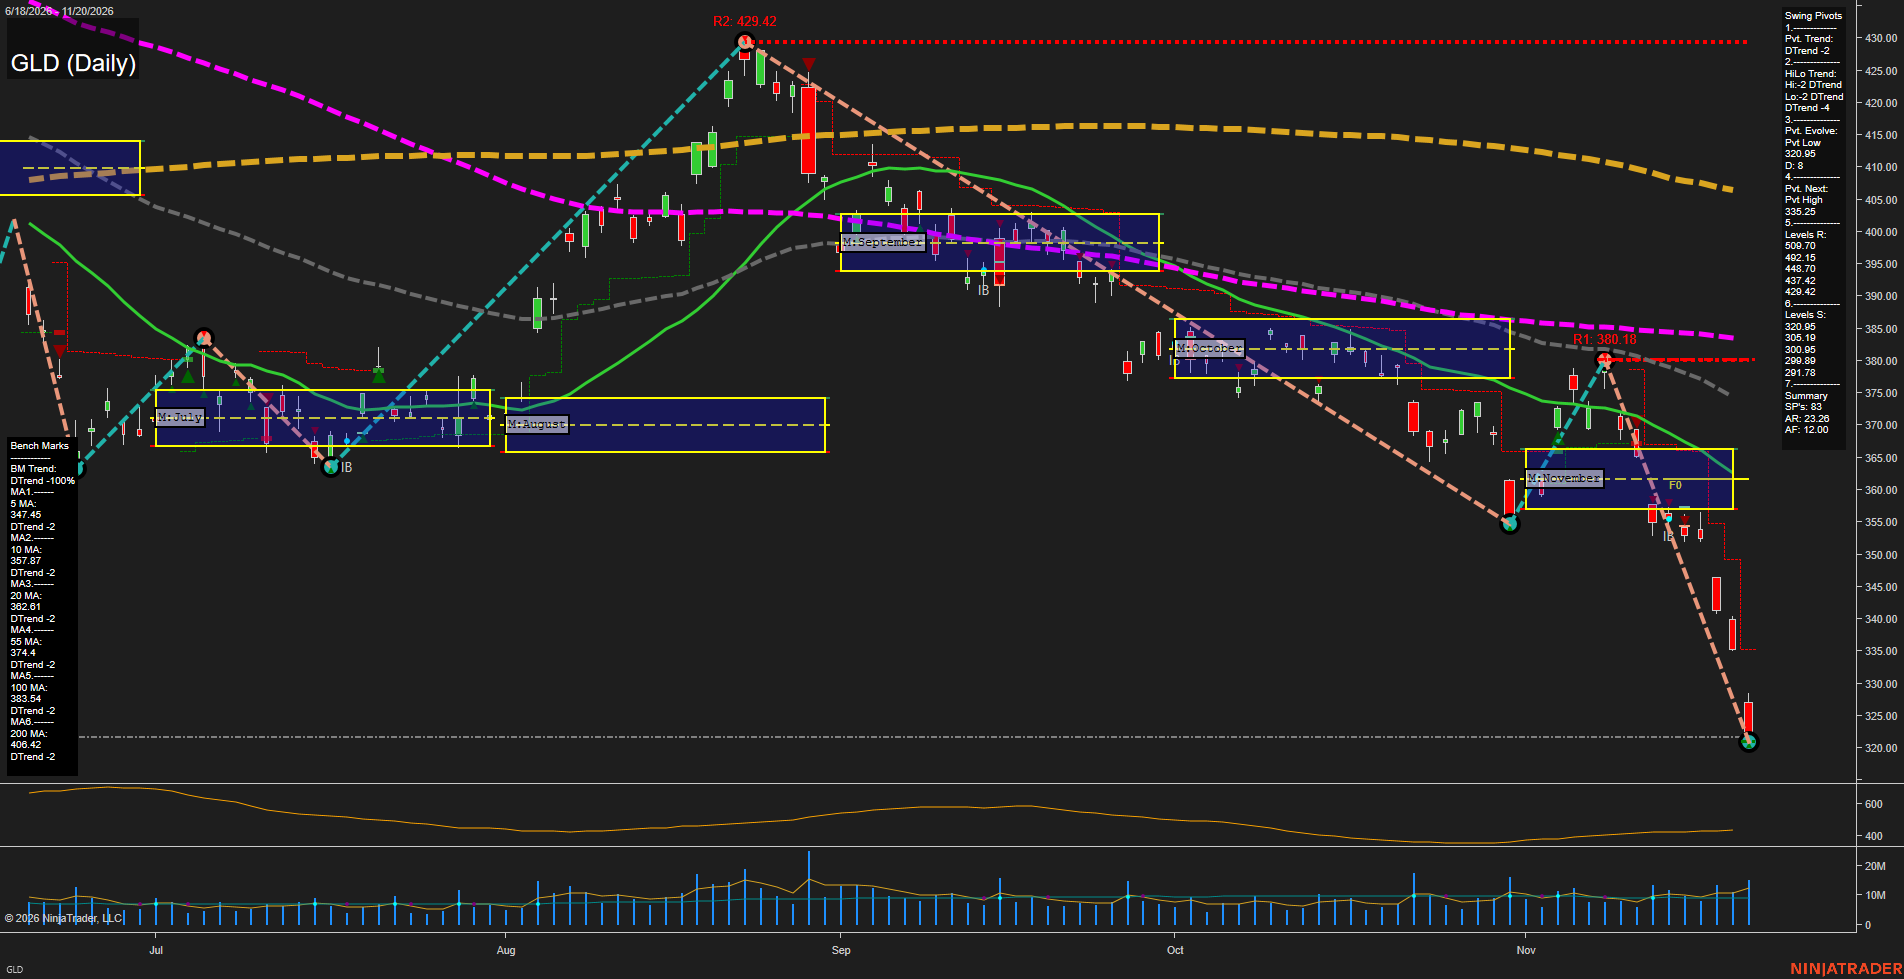
Overall Rating
- Near-Term: Bearish
- Medium-Term: Bearish
- Far-Term: Bearish.
Key Insights Summary
From a futures swing trader’s perspective, GLD shows an accelerating downside continuation rather than an established reversal. The rebound into the visible 380.18 swing high failed, followed by a break beneath November’s roughly 357–367 neutral zone and the preceding low near 355. Large bearish candles now extend toward the evolving 335.05 pivot low. Both pivot trends are down, and price sits beneath all six declining benchmarks, aligning near-, medium-, and far-term bearish structure. The summary lists 349.09 as the next opposite-pivot threshold; this is a structural reference, not a confirmed reversal. The visible 380.18 resistance is closer than the historical resistance levels retained in the pivot summary. Weekly and yearly grids are not displayed, so their neutral entries indicate unavailable confirmation. Named trade-signal readings, news catalysts, and seasonal evidence are not supplied. GLD prices are ETF levels rather than executable gold-futures levels; the supplied ATR and VOLMA figures are reproduced as requested, not independently verified from panel labels.
View charts on: AlphaWebTrader HTF Charts
GC Daily View
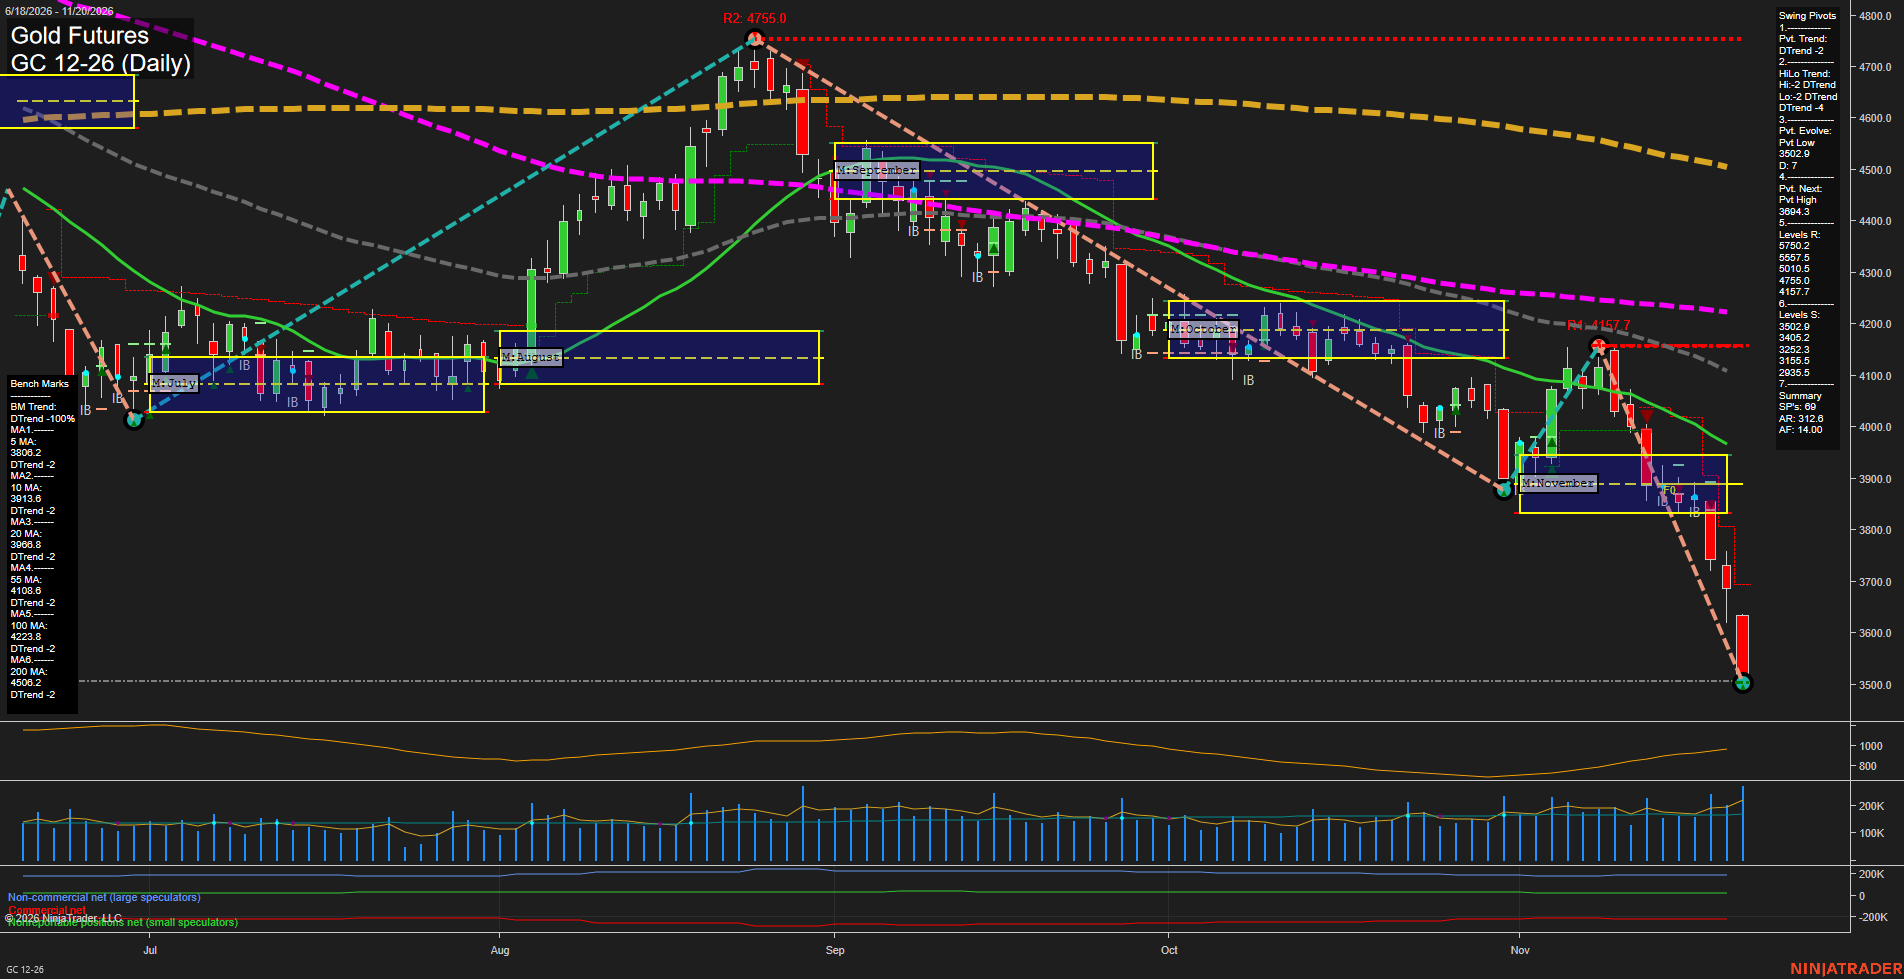
Overall Rating
- Near-Term: Bearish
- Medium-Term: Bearish
- Far-Term: Bearish.
Key Insights Summary
From a futures swing-trading perspective, the chart shows an accelerating downtrend rather than a routine pullback. The November rebound ended at a lower swing high of 4157.7, followed by a breakdown beneath the monthly NTZ and an evolving low at 3514.9. Large bearish candles and expanding recent ranges indicate strong downside momentum. Price is below all six declining benchmarks, while weekly, monthly and yearly grid readings reinforce bearish alignment across time horizons. The nearest listed support cluster is 3514.9–3504.7; 3705.9 is the next opposite-pivot reversal threshold, not a confirmed reversal. Substantial separation below the short-term averages leaves room for a countertrend rebound without changing the broader bearish structure. The supplied short signals agree with that structure; news and seasonal explanations cannot be established from this chart alone.
View charts on: AlphaWebTrader HTF Charts
ZB Daily View
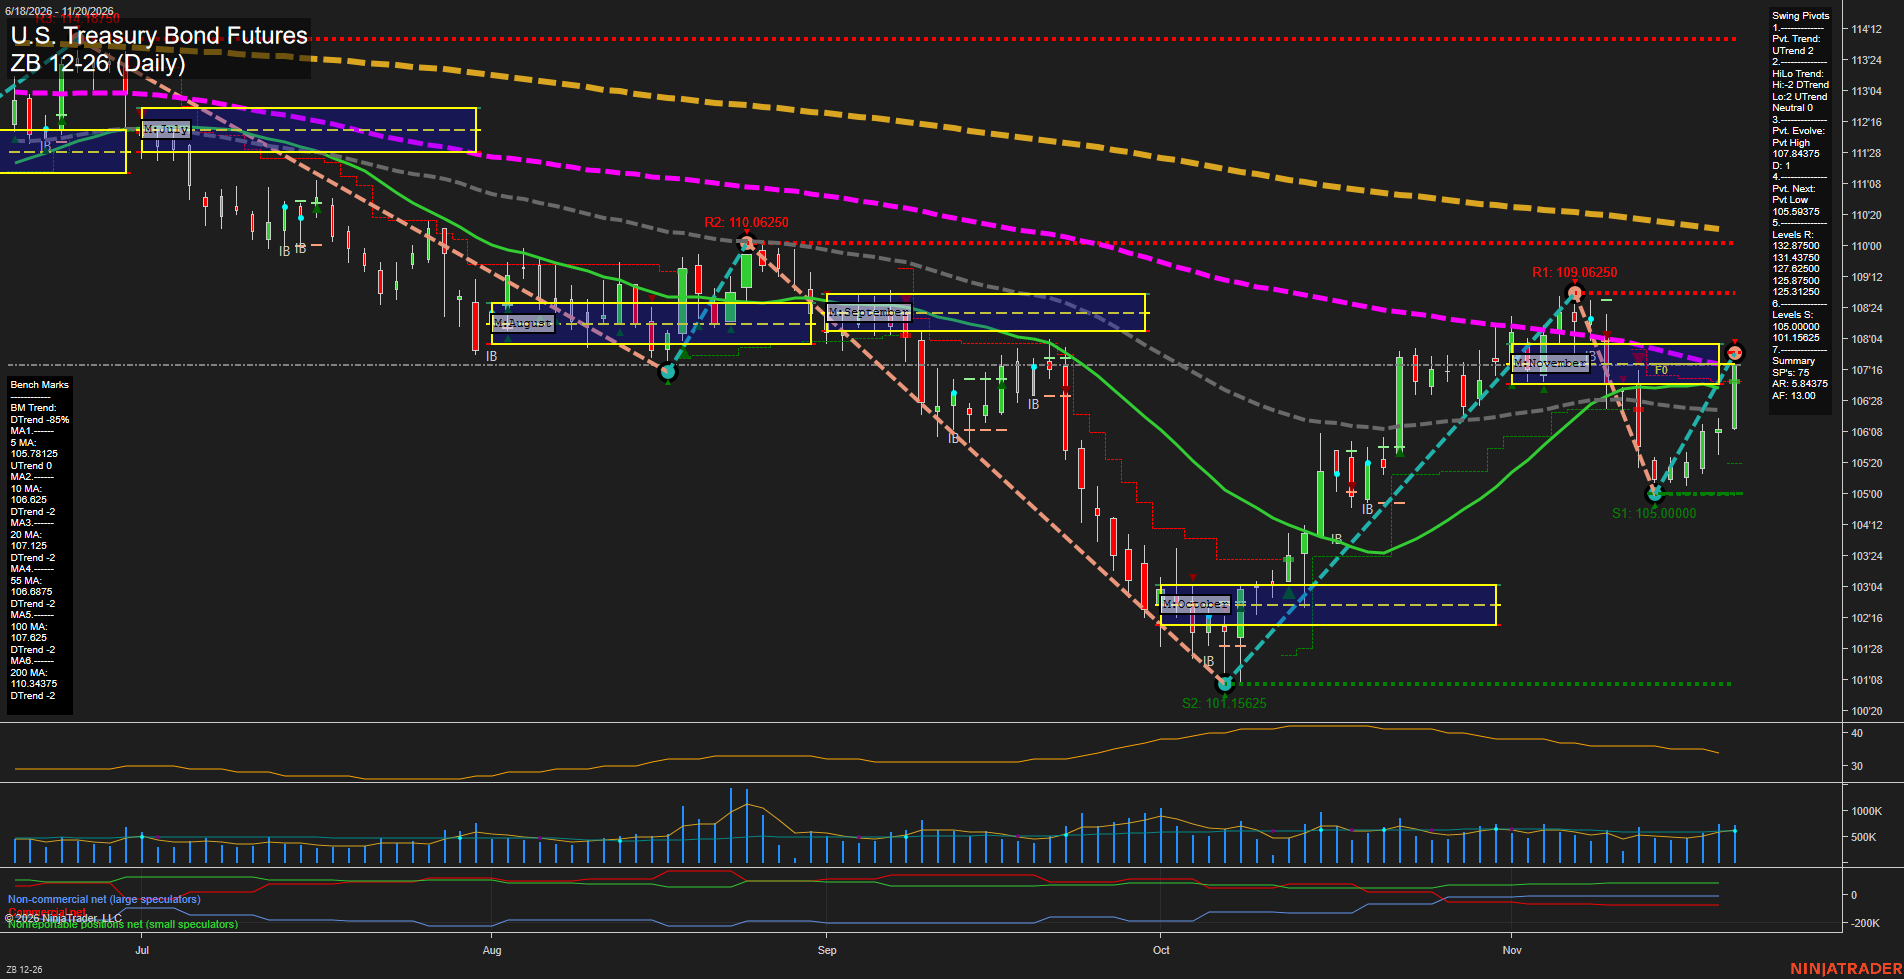
Overall Rating
- Near-Term: Bullish
- Medium-Term: Bearish
- Far-Term: Bearish.
Key Insights Summary
The near-term upswing from 105.00000 is a countertrend recovery within a broader bearish structure. Price has recovered above the 5-, 10-, 20- and 55-day benchmarks, but all except the 5-day remain downward-sloping. The weekly grid and rising pivot trend support the near-term bullish reading, while the negative monthly grid and declining medium-term benchmarks retain a bearish medium-term bias. Mixed swing structure reflects a higher low at 105.00000 versus October's 101.15625, but a lower November high at 109.06250 versus August's 110.06250. Price is testing the lower boundary of November's NTZ, with the declining 100-day benchmark at 107.625 overhead. The summary's listed resistance levels are remote; visible local swing resistance is 109.06250 and 110.06250. ATR has eased from its October peak, suggesting moderating volatility rather than an accelerating breakout. The declining 100- and 200-day benchmarks and negative yearly grid keep the far-term backdrop bearish. News catalysts, seasonal effects and named trade-signal readings are not established by this chart.
View charts on: AlphaWebTrader HTF Charts
Sentiment Summary: Negative coverage outweighed positive 33% to 20%, while 48% was neutral, as Nvidia’s leadership and chip-export investigations dominated AI concerns despite strong quarterly results. Anthropic’s November 19 IPO failed to sustain early gains: all 11 S&P 500 sectors closed lower, followed by Asian chip losses and weaker U.S. futures on November 20, with the volatility gauge reaching a seven-month high. Strong corporate earnings and Apple’s premarket rise on AI-agent hiring provided counterweights, while November 19 Fed comments highlighted inflation pressures from AI investment.
Conclusion: The reported weakness extended beyond technology, placing broad market participation alongside AI exposure at the center of the session’s risk context.