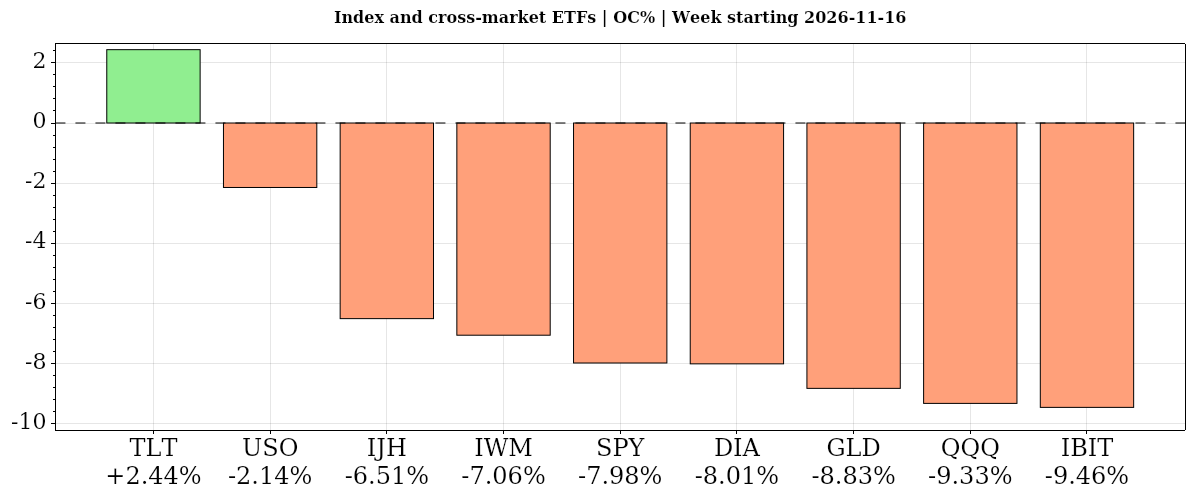
Markets suffered broad weekly losses as concerns over AI leadership, financing and chip exports collided with expectations for further Federal Reserve tightening. SPY fell 8.56%, QQQ lost 10.51% and Nvidia plunged 22.92%. Long-duration Treasuries diverged, with TLT gaining 2.61%, while gold fell 9.17% and oil declined 4.09% despite a late-week rebound.
Fundamentals: Stocks and tech fell over the completed week as leadership, export and financing concerns overshadowed Nvidia's strong Tuesday evening results. Anthropic gained 17% in its Thursday debut without lifting broader AI shares. Retail sales rose 0.2%, industrial output fell 0.4%, and Wednesday's Fed minutes signaled further rate increases. Oil declined despite Middle East shipping risks, gold weakened and Treasuries advanced.
Technicals: S&P 500 and Nasdaq-100 funds finished the week bearish, falling 8.56% and 10.51%, respectively. Nvidia led listed stock declines with a 22.92% loss, while Apple outperformed with a smaller 3.85% decline. Bearish oil and gold funds lost 4.09% and 9.17%. far-term Treasury bonds stood apart with a bullish rating and a 2.61% gain, while the bitcoin fund fell 15.20%.
Weekly Market Recap: weekly ETF and stock performance, daily session commentary, economic releases, earnings and market news, with a whole-week summary.
As of: November 21, 2026 11:30 CT
Earnings Radar Week Recap
Monitoring for earnings releases by the Magnificent 7, AI-tech-related firms, and major financial institutions.
| Date/Day | Impact | Company / Symbol | Time | EPS | Revenue | ||||||||
|---|---|---|---|---|---|---|---|---|---|---|---|---|---|
| 2026-11-17 – Tuesday | High | Nvidia (NVDA) | After close |
|
|
For full details visit: Yahoo Earnings Calendar
EcoNews Radar U.S. Events Week Recap
| Date | Impact | Event, Prev, Forecast, Actual | Info |
|---|---|---|---|
| 2026-11-16 Monday 12:00 | High | Fed Chairman Warsh Speaks Prev: — Forecast: — Actual: — | Remarks can clarify the central bank’s economic outlook and policy priorities; index futures traders monitor implications for interest rates and equity valuations. |
| 2026-11-17 Tuesday 08:30 | High | Core Retail Sales m/m Prev: 0.9% Forecast: 0.4% Actual: 0.6 | Measures monthly retail spending excluding vehicles, helping traders assess underlying goods demand and its implications for growth, earnings and interest rates. |
| 2026-11-17 Tuesday 08:30 | High | Retail Sales m/m Prev: 0.8% Forecast: 0.1% Actual: 0.2 | Tracks monthly receipts at retailers and food services establishments, offering a timely gauge of consumer demand relevant to corporate earnings and economic growth. |
| 2026-11-18 Wednesday 07:30 | Medium | Fed's Waller speech Prev: — Forecast: — Actual: — | Policy remarks may reveal views on inflation, employment and the rate outlook, helping traders assess potential changes in financial conditions. |
| 2026-11-18 Wednesday 08:30 | Medium | Building Permits (MoM) Prev: 1.40M Forecast: 1.38M Actual: 1.29M | Tracks authorizations for residential construction, providing a forward-looking gauge of housing activity and demand across construction-related industries. |
| 2026-11-18 Wednesday 08:30 | Medium | Housing Starts (MoM) Prev: 1.22M Forecast: 1.27M Actual: 1.31M | Measures the pace of new residential construction, helping traders assess housing investment, economic momentum and demand for building materials. |
| 2026-11-18 Wednesday 10:00 | Medium | Pending Home Sales (MoM) Prev: -7.3 Forecast: -2 Actual: -4.7 | Tracks contracts signed for existing homes, offering an early signal of completed transactions and housing demand sensitive to borrowing costs. |
| 2026-11-18 Wednesday 10:30 | Low | EIA Crude Oil Stocks Change Prev: 4.66M Forecast: 0.40M Actual: 3.38M | Measures weekly changes in commercial crude inventories, informing oil supply-demand assessments that matter for energy shares and inflation expectations. |
| 2026-11-18 Wednesday 12:15 | Medium | Fed's Daly speech Prev: — Forecast: — Actual: — | Comments may clarify the economic outlook and policy preferences, informing interest-rate expectations that influence equity valuations. |
| 2026-11-18 Wednesday 13:35 | Medium | Fed's Barr speech Prev: — Forecast: — Actual: — | Remarks may address monetary policy or financial stability; traders monitor relevant signals for borrowing conditions, bank shares and broader risk sentiment. |
| 2026-11-18 Wednesday 14:00 | High | FOMC Minutes Prev: — Forecast: — Actual: — | Details policymakers’ deliberations, highlighting agreement, disagreements and economic risks that help traders assess the potential direction of interest rates. |
| 2026-11-18 Wednesday 14:30 | Medium | Fed's Williams speech Prev: — Forecast: — Actual: — | Comments can offer insight into the economic outlook and policy stance, with implications for bond yields and rate-sensitive equities. |
| 2026-11-18 Wednesday 16:15 | Medium | Fed's Kashkari speech Prev: — Forecast: — Actual: — | Remarks may reveal assessments of inflation and labor-market conditions, helping traders interpret the potential policy path and valuation backdrop. |
| 2026-11-19 Thursday 08:30 | Medium | Philadelphia Fed Manufacturing Survey Prev: 20.9 Forecast: 20 Actual: 6.3 | Surveys regional manufacturers on business conditions, providing an early indication of factory activity, orders, employment and price pressures. |
| 2026-11-19 Thursday 08:30 | Medium | Initial Jobless Claims Prev: 200K Forecast: 197K Actual: 203K | Counts new applications for unemployment benefits, offering a timely gauge of layoffs and labor-market conditions relevant to growth and monetary policy. |
| 2026-11-19 Thursday 11:30 | Medium | 4-Week Bill Auction · $115B Prev: 3.955% Forecast: — Actual: 4.05% | Reveals short-term government funding costs and investor demand for cash-like securities, providing context for money-market conditions and front-end yields. |
| 2026-11-19 Thursday 11:30 | Medium | 8-Week Bill Auction · $110B Prev: — Forecast: — Actual: — | Shows demand and clearing yields for short-term government debt, helping traders assess money-market pricing and near-term funding conditions. |
| 2026-11-19 Thursday 12:30 | Medium | Fed's Goolsbee speech Prev: — Forecast: — Actual: — | Comments may illuminate views on growth, inflation and policy trade-offs, informing rate expectations relevant to index futures. |
| 2026-11-19 Thursday 13:00 | High | 10-Year TIPS Auction · $19B Prev: 2.653% Forecast: — Actual: 2.903% | Reveals demand and real borrowing costs for inflation-protected government debt; real yields are an important input into equity discount rates. |
| 2026-11-19 Thursday 13:00 | Medium | 9-Day Bill Auction · $15B Prev: — Forecast: — Actual: — | Shows pricing and demand for very short-term government financing, providing a narrow snapshot of cash-market liquidity and funding conditions. |
| 2026-11-19 Thursday 14:15 | Medium | Fed's Barr speech Prev: — Forecast: — Actual: — | Comments may provide insight into financial-system risks or monetary policy, with potential relevance for banking shares and broader financial conditions. |
| 2026-11-19 Thursday 18:30 | Medium | Fed's Paulson speech Prev: — Forecast: — Actual: — | Remarks may clarify the speaker’s economic assessment and policy preferences, helping traders evaluate the range of views within the central bank. |
| 2026-11-20 Friday 08:25 | Medium | Fed's Waller speech Prev: — Forecast: — Actual: — | Comments may update views on inflation, employment and monetary policy, informing expectations for borrowing costs and equity discount rates. |
| 2026-11-20 Friday 10:00 | Medium | Michigan Consumer Sentiment Index Prev: 51 Forecast: 51.5 Actual: 51.5 | Surveys households’ assessments of personal finances and economic conditions, helping traders gauge confidence and potential consumer spending momentum. |
| 2026-11-20 Friday 10:00 | Medium | UoM 1-year Consumer Inflation Expectations Prev: 4.3 Forecast: 4.3 Actual: 3.7 | Measures households’ near-term expectations for price increases, informing assessments of inflation psychology and potential monetary-policy constraints. |
| 2026-11-20 Friday 10:00 | Medium | Michigan Consumer Expectations Index Prev: 50.9 Forecast: 50.9 Actual: 52.9 | Captures households’ outlook for personal finances and business conditions, offering context for future spending demand and economic momentum. |
| 2026-11-20 Friday 10:00 | Medium | UoM 5-year Consumer Inflation Expectation Prev: 3.4 Forecast: 3.4 Actual: 3.3 | Measures households’ longer-term price expectations, helping traders assess inflation anchoring and the outlook for monetary policy and bond yields. |
| 2026-11-20 Friday 12:00 | Medium | President Trump Speaks Prev: — Forecast: — Actual: — | Presidential remarks may outline fiscal, trade or regulatory priorities; traders monitor potential implications for corporate earnings, inflation and sector performance. |
| 2026-11-20 Friday 12:15 | Medium | Fed's Cook speech Prev: — Forecast: — Actual: — | Remarks may offer views on the economy, inflation and financial conditions, helping traders assess the policy outlook and its relevance for equity valuations. |
Summary: The calendar centered on U.S. monetary-policy communication alongside indicators of household demand, housing activity and inflation expectations.
Conclusion: The densest cluster of scheduled releases and appearances fell midweek.
Market Technical Analysis
Analysis of completed-week VIX volatility, major ETFs and mega-cap tech stocks, futures snapshots, higher-time-frame analysis and weekly charts.
VIX — Market Fear Gauge Weekly
| Level | Open | High | MaxVix | Low | MinVix | WNC% | WOC% | VR | MaxVR | MinVR |
|---|---|---|---|---|---|---|---|---|---|---|
| 35.89 | 20.00 | 40.03 | 28.36 | 19.84 | 13.80 | +85.96% | +79.45% | 10.04 | 17.64 | -19.11 |
VIX rose 85.96% versus the previous weekly close. Open-to-close change: 79.45%. VIX is above the recent 12-week range (13.80–28.36).
VR: Weekly VR: Stocks fell while expected volatility rose. VR is in the upper part of its preceding 12-week VR range (-19.11 to 17.64), in the 70–80% band. VR rose 3.57 points from the previous week, a small shift relative to that range.
Range lookback: preceding 12 completed weeks.
Major ETFs and Mega Cap Tech Stocks Weekly
ETF, Mag7, and Cross-Market ETF Weekly Insights
Overall Tone
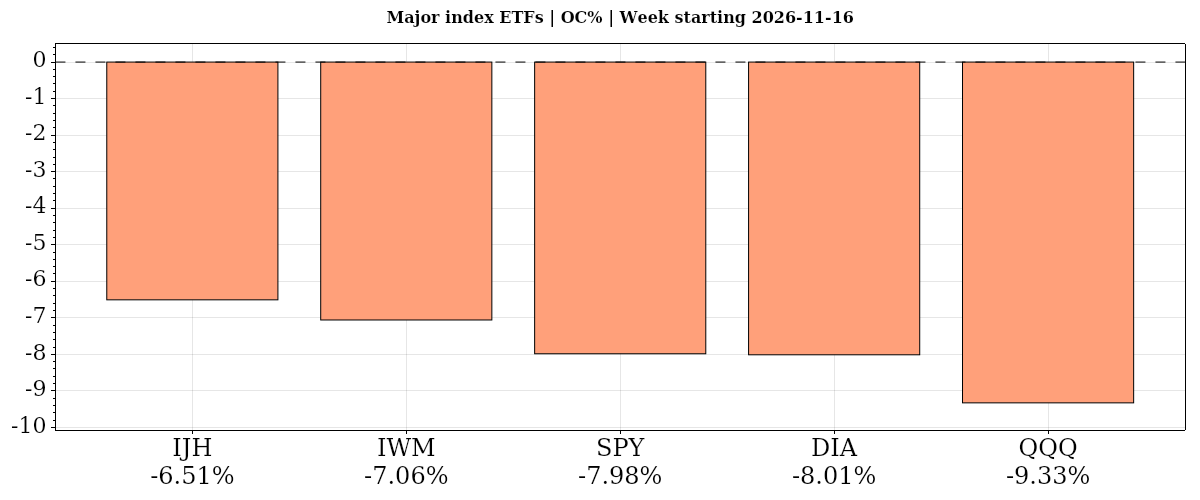
For the week beginning 2026-11-16, widespread losses from the week open and versus the prior weekly close marked a risk-off tone.
| Instrument | Bias | Date | WNC% | WOC% | O | H | L | C | VWAP | Vol | Mon | Tue | Wed | Thu | Fri |
|---|---|---|---|---|---|---|---|---|---|---|---|---|---|---|---|
| ▼ IJH | ▼ ▼ ▼ | 2026-11-16 | ▼ -7.00% | ▼ -6.51% | 73.38 | 73.46 | 68.45 | 68.60 | ▼ 71.04 | 52,142,306 | -1.44% | -1.31% | +0.26% | -2.02% | -2.68% |
| ▼ IWM | ▼ ▼ ▼ | 2026-11-16 | ▼ -7.54% | ▼ -7.06% | 276.10 | 276.54 | 256.32 | 256.61 | ▼ 266.66 | 164,954,246 | -1.66% | -1.43% | +0.40% | -2.18% | -2.88% |
| ▼ DIA | ▼ ▼ ▼ | 2026-11-16 | ▼ -8.04% | ▼ -8.01% | 522.98 | 523.09 | 479.40 | 481.08 | ▼ 500.87 | 22,636,737 | -1.43% | -1.62% | -1.10% | -2.18% | -1.98% |
| ▼ SPY | ▼ ▼ ▼ | 2026-11-16 | ▼ -8.56% | ▼ -7.98% | 749.66 | 749.82 | 686.75 | 689.81 | ▼ 720.54 | 418,626,013 | -1.91% | -1.01% | -0.31% | -1.96% | -3.64% |
| ▼ QQQ | ▼ ▼ ▼ | 2026-11-16 | ▼ -10.51% | ▼ -9.33% | 671.04 | 676.49 | 606.23 | 608.45 | ▼ 644.29 | 350,095,387 | -2.67% | -0.73% | +0.39% | -2.19% | -5.67% |
| AVG/Sum | — | — | -8.33% | -7.78% | — | — | — | — | — | 1,008,454,689 | -1.82% | -1.22% | -0.07% | -2.11% | -3.37% |
IJH · W:2026-11-16 NC% ▼ -7.00% OC% ▼ -6.51%
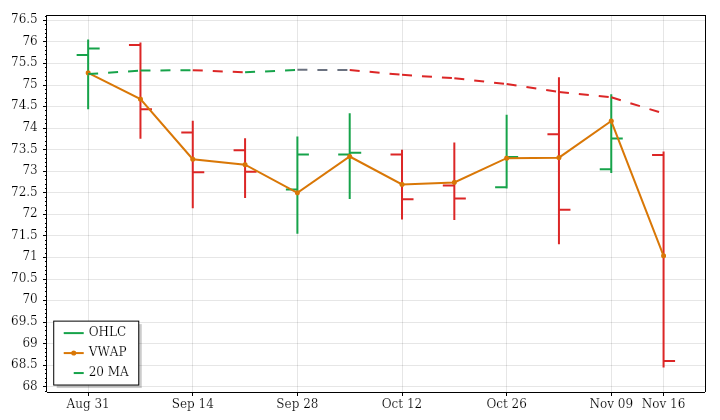
IJH – Mid Cap Technicals Summary
IJH's completed week beginning November 16, 2026 closed at 68.60, down 7.00% from the prior weekly close and 6.51% from the open. Its opening gap down remained unfilled. Price breached the prior inside week's low and finished below the previous week's low, near the week's bottom. The close below weekly VWAP reinforced the weak price structure.
Near- and far-term trends were both downward, aligning with the declining 12-week price trend. Intermediate conditions provided the exception: price was below an average that remained slightly rising, leaving that horizon mixed rather than fully bearish. The week's range exceeded two and a half times its prior 12-week average, accompanied by elevated volume and larger average trade size. Those readings extended broader range-expansion and volume-growth trends. PSAR and ATR-median remained bearish; a next-week high above 74.8435 would trigger a bullish PSAR reversal.
IWM · W:2026-11-16 NC% ▼ -7.54% OC% ▼ -7.06%
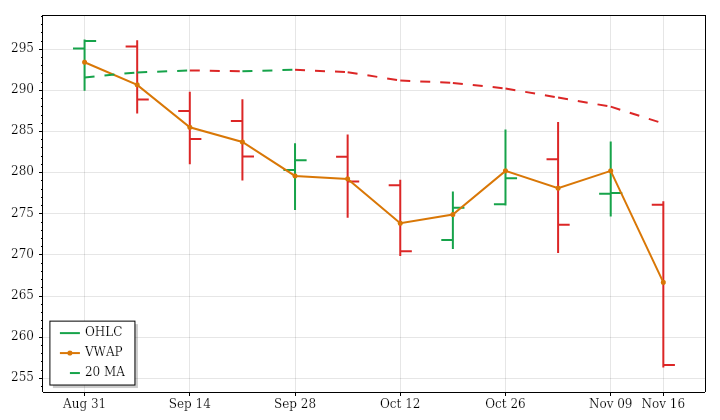
IWM – Small Cap Technicals Summary
IWM's completed week beginning November 16, 2026 ended at 256.61, down 7.54% from the prior weekly close and 7.06% from the open. The opening gap down was not filled. Price breached the prior inside week's low and closed below the previous week's low, near its own bottom and below weekly VWAP, leaving a distinctly weak completed-period structure.
That action aligned with the near-term downtrend and declining 12-week price trend. Intermediate conditions remained mixed because the average still rose above price, while the far-term uptrend persisted. The fourth consecutive large-range week had a range more than twice its prior 12-week average, alongside substantially elevated volume. Both extended the lookback trends toward wider ranges and greater participation. PSAR was bearish, consistent with ATR-median weakness. A next-week high above 286.17 would trigger a bullish PSAR reversal rather than confirm one already underway.
DIA · W:2026-11-16 NC% ▼ -8.04% OC% ▼ -8.01%
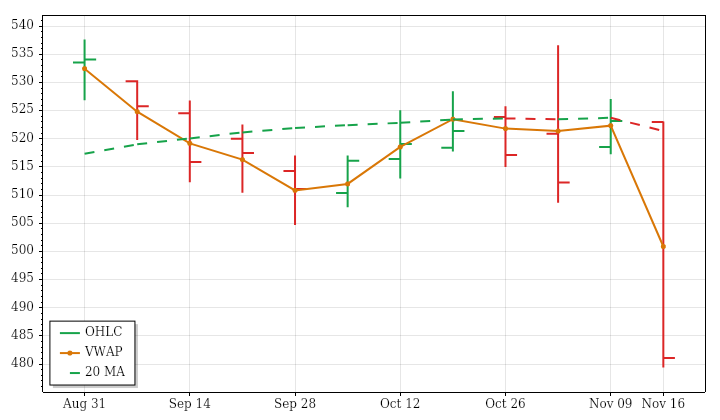
DIA – Dow Jones Technicals Summary
DIA's completed week beginning November 16, 2026 closed at 481.08, down 8.04% from the prior weekly close and 8.01% from the open. The almost unchanged opening left most of the loss attributable to trading during the week. Price broke the prior inside week's low, made a lower high and lower low, and finished near its low, below both the previous week's low and weekly VWAP.
This reinforced the near-term downtrend, but the intermediate average was still rising despite price sitting below it. The far-term structure remained upward, creating a clear conflict across horizons. The week's range was roughly three and a half times its prior 12-week average, with elevated volume, extending broader expansion trends. PSAR was bearish and ATR-median also pointed down. A next-week high above 536.6 would trigger a bullish PSAR reversal; that condition had not occurred.
SPY · W:2026-11-16 NC% ▼ -8.56% OC% ▼ -7.98%
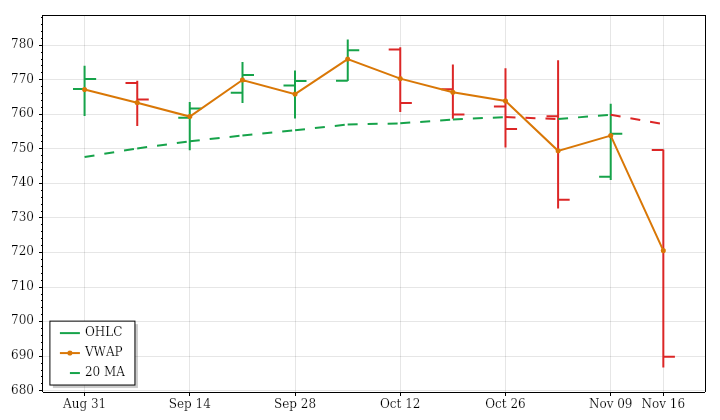
SPY – S&P 500 Technicals Summary
SPY's completed week beginning November 16, 2026 closed at 689.81, down 8.56% from the prior weekly close and 7.98% from the open. Its opening gap down remained unfilled. The week broke the prior inside week's low and finished below the previous week's low, near its own bottom. Closing below weekly VWAP added to the weak completed-week picture.
Near-term weakness aligned with the declining 12-week price trend, but intermediate conditions remained mixed because the average still rose above price. The far-term trend remained upward. This sixth consecutive large-range week had a range about three and a half times its prior 12-week average, with volume nearly double average. That extended broader trends toward expanding ranges and increasing participation. PSAR and ATR-median were bearish. A next-week high above 766.751 would trigger a bullish PSAR reversal rather than confirm an existing reversal.
S&P 500 News and Fundamentals
The S&P 500 fell 3.7% on November 20, closing in correction territory more than 10% below its record. Reporting linked the decline to selling in AI stocks following Nvidia’s leadership crisis. The index had also endured a six-session losing streak during the week. Goldman Sachs forecast that the S&P 500 could reach 8,700 over the next 12 months, approximately 26% above Friday’s close, citing more attractive technology and AI-hyperscaler valuations after the selloff.
QQQ · W:2026-11-16 NC% ▼ -10.51% OC% ▼ -9.33%
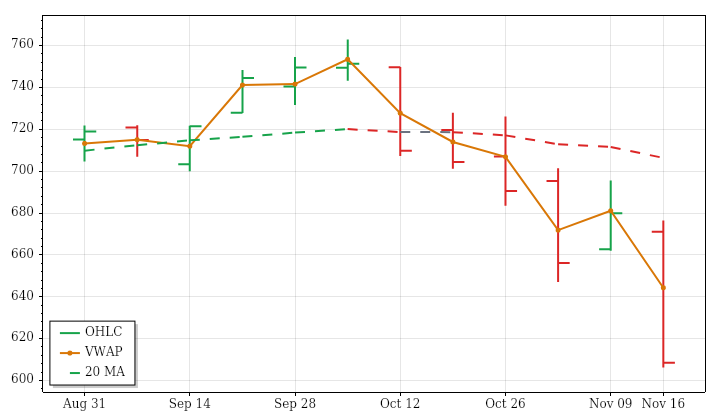
QQQ – Nasdaq 100 Technicals Summary
QQQ's completed week beginning November 16, 2026 ended at 608.45, losing 10.51% against the prior weekly close and 9.33% from the open. The opening gap down remained unfilled. Price breached the prior inside week's low and finished below the previous week's low, near its own bottom and below weekly VWAP.
The latest decline reinforced the near-term downtrend and falling 12-week price trend. Intermediate conditions remained mixed, with price below a rising average, while the far-term uptrend survived. This sixth consecutive large-range week had a range roughly two and a half times its prior 12-week average and sharply elevated volume. Both were consistent with wider ranges and growing participation across the lookback, rather than an isolated weekly expansion. PSAR and ATR-median remained bearish; a next-week high above 696.0562 would trigger a bullish PSAR reversal.
Nasdaq 100 News and Fundamentals
The Nasdaq-100’s total earnings increased approximately 50% over the past year, according to a November 18 report. Invesco QQQ had closed at a record $759.66 on October 6.
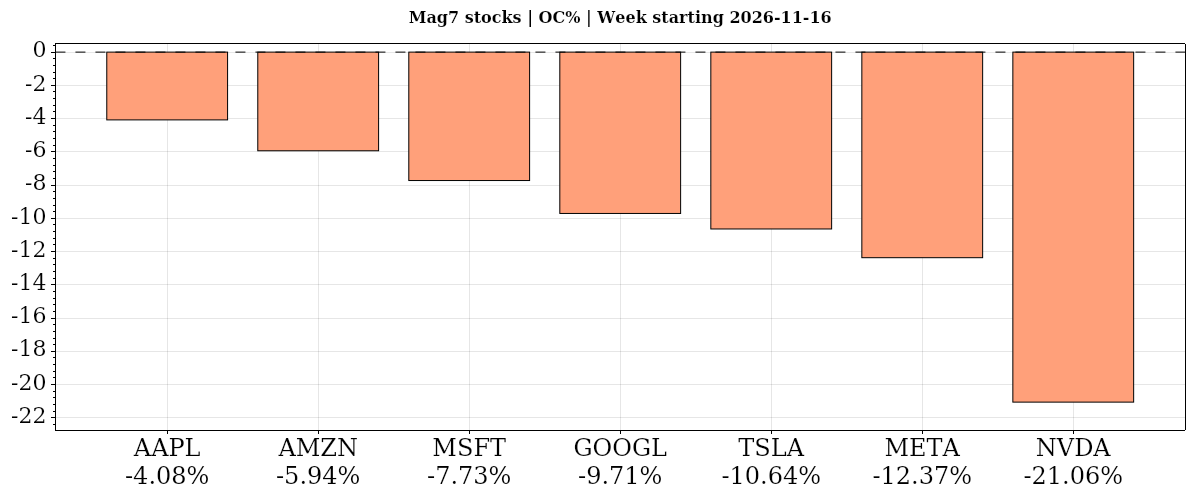
| Instrument | Bias | Date | WNC% | WOC% | O | H | L | C | VWAP | Vol | Mon | Tue | Wed | Thu | Fri |
|---|---|---|---|---|---|---|---|---|---|---|---|---|---|---|---|
| ▼ AAPL | ▼ ▼ ▼ | 2026-11-16 | ▼ -3.85% | ▼ -4.08% | 357.12 | 357.12 | 340.56 | 342.56 | ▼ 349.75 | 243,990,702 | -0.98% | -0.25% | +0.15% | -0.92% | -1.90% |
| ▼ AMZN | ▼ ▼ ▼ | 2026-11-16 | ▼ -7.44% | ▼ -5.94% | 262.39 | 274.00 | 245.31 | 246.82 | ▼ 258.24 | 254,308,168 | -3.34% | +0.05% | +3.82% | -3.87% | -4.10% |
| ▼ MSFT | ▼ ▼ ▼ | 2026-11-16 | ▼ -7.51% | ▼ -7.73% | 525.09 | 527.95 | 481.03 | 484.52 | ▼ 503.82 | 156,580,471 | -1.12% | -2.27% | +0.40% | -1.97% | -2.77% |
| ▼ GOOGL | ▼ ▼ ▼ | 2026-11-16 | ▼ -10.31% | ▼ -9.71% | 293.81 | 295.43 | 264.22 | 265.29 | ▼ 279.55 | 202,081,375 | -4.07% | -1.24% | +0.80% | -3.46% | -2.70% |
| ▼ TSLA | ▼ ▼ ▼ | 2026-11-16 | ▼ -11.38% | ▼ -10.64% | 387.00 | 393.60 | 344.33 | 345.82 | ▼ 372.82 | 152,285,572 | -2.69% | +0.10% | +0.95% | -2.43% | -7.64% |
| ▼ META | ▼ ▼ ▼ | 2026-11-16 | ▼ -12.60% | ▼ -12.37% | 640.00 | 640.70 | 558.68 | 560.84 | ▼ 601.33 | 76,184,179 | -2.38% | -1.20% | -0.40% | -3.27% | -5.93% |
| ▼ NVDA | ▼ ▼ ▼ | 2026-11-16 | ▼ -22.92% | ▼ -21.06% | 159.01 | 163.20 | 124.50 | 125.53 | ▼ 147.53 | 2,038,450,946 | -4.12% | -0.44% | -2.89% | -3.30% | -14.01% |
| AVG/Sum | — | — | -10.86% | -10.22% | — | — | — | — | — | 3,123,881,413 | -2.67% | -0.75% | +0.40% | -2.75% | -5.58% |
Mag7 Stocks
Negative confluence: average WOC% -10.22% from the week open and WNC% -10.86% versus the prior weekly close. Apple led relatively and Nvidia lagged on both comparisons, with all seven declining and closing below weekly VWAP. Nvidia’s volume exceeded twice its average, while Apple and Microsoft retained rising intermediate- and longer-term structures.
AAPL · W:2026-11-16 NC% ▼ -3.85% OC% ▼ -4.08%
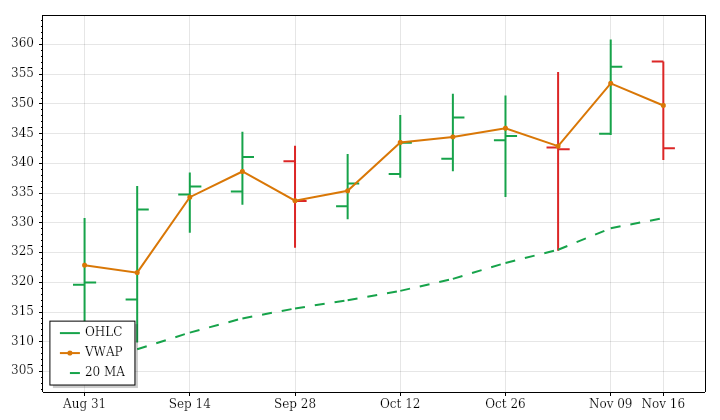
AAPL – Apple Technicals Summary
AAPL's completed week beginning November 16, 2026 closed at 342.56, down 3.85% from the prior weekly close and 4.08% from the open. A small opening gain was erased, and the week formed a lower high and lower low before closing below the previous week's low, near its own low. Finishing below weekly VWAP reinforced the weak closing position.
This decline conflicted with the rising 12-week price trend and intact intermediate- and far-term uptrends. The near-term picture was mixed because price sat below a still-rising average. The week's range was only slightly above its prior 12-week average, while volume was moderately higher, consistent with the broader expansion in ranges and participation. PSAR remained in an uptrend despite the decline; a next-week low below 328.88 would trigger a bearish reversal, rather than representing one already confirmed.
Apple News and Fundamentals
Apple is developing an autonomous AI agent capable of controlling apps, browsing websites and writing code, Bloomberg reported November 19, citing company job listings seeking leadership for a proactive assistant. A U.S.-based startup sued Apple in India, alleging its NameDrop contact-sharing feature infringes patented technology. Separately, the U.K. government was ordered to confirm that it issued a secret order demanding Apple provide authorities with encrypted customer information.
AMZN · W:2026-11-16 NC% ▼ -7.44% OC% ▼ -5.94%
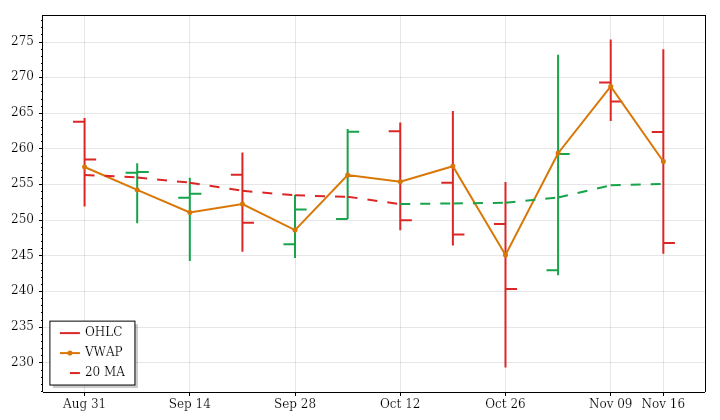
AMZN – Amazon Technicals Summary
AMZN's completed week beginning November 16, 2026 ended at 246.82, losing 7.44% against the prior weekly close and 5.94% from the open. The opening gap down was filled, but that recovery did not hold. A lower high and lower low culminated in a finish below the prior week's low and near the week's bottom, with price also below weekly VWAP.
The move aligned with the near-term downtrend and the modestly declining 12-week price trend. Intermediate conditions remained mixed: price was below an average that was still rising, while the far-term uptrend remained intact. Range approached twice its prior 12-week average and volume was elevated, extending broader expansion trends. A bullish ATR-median crossover conflicted with weak price action and bearish PSAR. A next-week high above 275.34 would be required to trigger a PSAR bullish reversal.
Amazon News and Fundamentals
Amazon warned New York City shoppers on November 19 that a proposed Delivery Protection Act could add $5 per order. The proposal would require Amazon to directly employ delivery workers; the company warned of slower deliveries, potential delivery-partner job losses and relocation of delivery infrastructure outside the city. Amazon urged customers to oppose the legislation. Separately, AWS’s upcoming re:Invent conference is scheduled for November 30–December 4 in Las Vegas.
MSFT · W:2026-11-16 NC% ▼ -7.51% OC% ▼ -7.73%
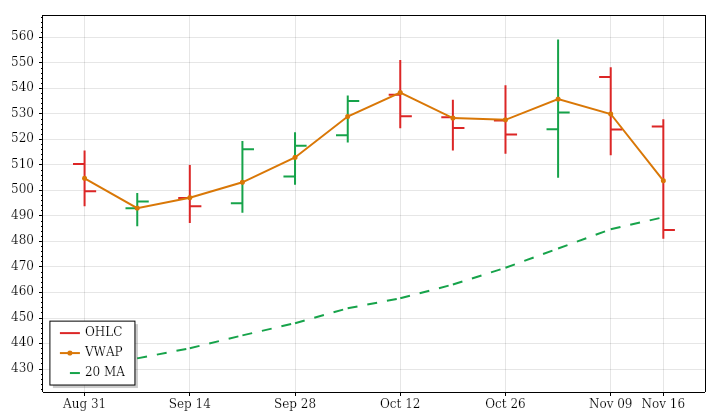
MSFT – Microsoft Technicals Summary
MSFT's completed week beginning November 16, 2026 ended at 484.52, down 7.51% from the prior weekly close and 7.73% from the open. A modest opening gain was erased. Price broke the prior inside week's low and closed below the previous week's low, near its own bottom and below weekly VWAP.
The decline left the near-term picture mixed, with price below a still-rising average. Intermediate- and far-term uptrends remained intact, as did the rising 12-week price trend, so the latest weakness conflicted with the broader structure. This fourth consecutive large-range week brought a substantially above-average range and elevated volume, consistent with expanding ranges and increasing participation over the lookback. PSAR was bearish, while ATR-median retained its uptrend, adding another signal conflict. A next-week high above 559.15 would trigger a bullish PSAR reversal; it was not a confirmed outcome.
Microsoft News and Fundamentals
Microsoft will retire To Do on June 30, 2027, directing work and school users to Planner while personal-account users must choose another app. CEO Satya Nadella apologized after a hidden bug disrupted Outlook, Teams and Copilot, acknowledging inadequate safeguards. He also warned that AI’s rapid discovery of cybersecurity bugs requires immediate fixes. Approximately 60,000 employees offered voluntary buyouts in October have until early December to decide whether to accept.
GOOGL · W:2026-11-16 NC% ▼ -10.31% OC% ▼ -9.71%
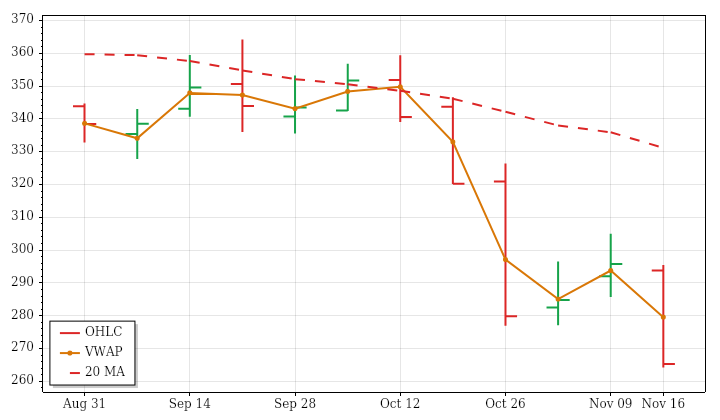
GOOGL – Alphabet Technicals Summary
GOOGL's completed week beginning November 16, 2026 closed at 265.29, losing 10.31% against the prior weekly close and 9.71% from the open. The opening gap down remained unfilled. A lower high and lower low led to a finish below the prior week's low, near the week's bottom and just above the 52-week low. Price also ended below weekly VWAP.
The decline aligned with both near- and intermediate-term downtrends and the falling 12-week price trend. The far-term average was still rising beneath price, so weakness had not aligned across every horizon. Range and volume were materially above their prior 12-week averages, consistent with expanding ranges and increasing participation over that window. PSAR and ATR-median both remained bearish. A next-week high above 325.9481 would trigger a bullish PSAR reversal; the latest close did not establish such a change.
TSLA · W:2026-11-16 NC% ▼ -11.38% OC% ▼ -10.64%
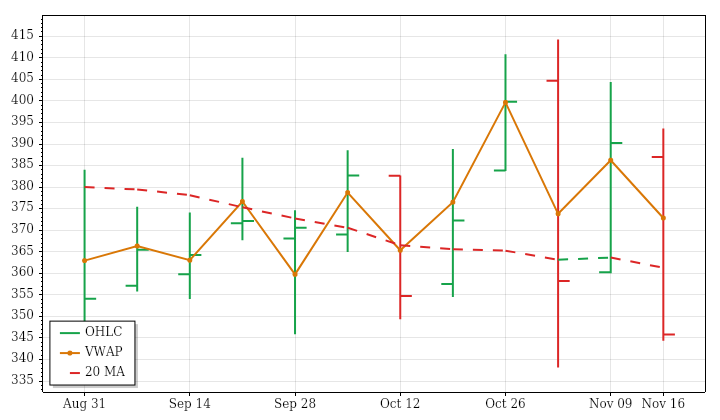
TSLA – Tesla Technicals Summary
TSLA's completed week beginning November 16, 2026 closed at 345.82, down 11.38% from the prior weekly close and 10.64% from the open. The opening gap down was filled, but price subsequently broke the prior inside week's low. It finished below the previous week's low, near its own bottom and below weekly VWAP.
The near-term picture was mixed because price had fallen below a rising average. Intermediate conditions were downward, while the far-term uptrend persisted with price still above its rising average. The latest decline also contrasted with an upward but choppy 12-week price trend. This sixth consecutive large-range week had a substantially above-average range, yet volume was below average despite a slightly increasing lookback trend. Bearish PSAR conflicted with an ongoing ATR-median uptrend. A next-week high above 410.426 would trigger a bullish PSAR reversal.
Tesla News and Fundamentals
Tesla plans to increase Shanghai production despite a 66.1% decline in October mainland China deliveries, with exports rising as Chinese EV demand weakened. The company recently committed approximately $3.3 billion to expand its factory near Berlin; EU small-series rules currently cap fully driverless registrations at 1,500 vehicles per model annually. Tesla aims to deliver its first consumer Cybercabs in December. Reports also described speculation about a possible SpaceX combination, rather than an announced transaction.
META · W:2026-11-16 NC% ▼ -12.60% OC% ▼ -12.37%
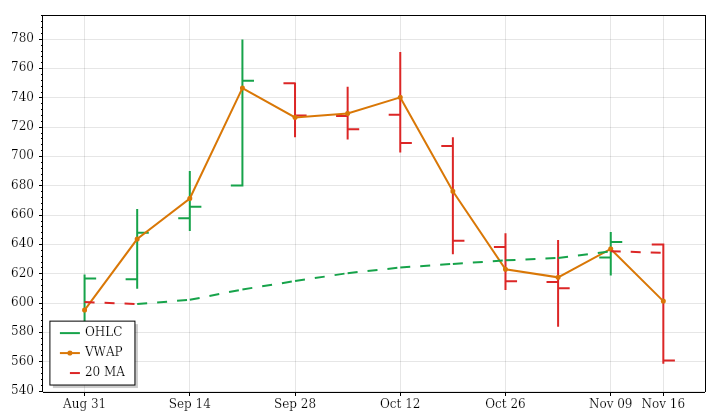
META – Meta Platforms Technicals Summary
META's completed week beginning November 16, 2026 closed at 560.84, losing 12.60% against the prior weekly close and 12.37% from the open. A small opening gap down remained unfilled. The week formed a lower high and lower low, then finished below the previous week's low, near its own low and beneath weekly VWAP.
Price was below rising averages across near-, intermediate- and far-term horizons, leaving all three mixed rather than aligned downtrends. The sharp weekly drop also contrasted with the slight upward 12-week price trend, whose progress had been choppy. Range was about one and a half times its prior 12-week average despite a contracting lookback range trend. Volume was below average despite its broader upward trend, limiting participation confirmation. PSAR and a fresh ATR-median downtrend were bearish; a next-week high above 701.9397 would trigger a bullish PSAR reversal.
Meta News and Fundamentals
Reuters reported November 19 that Meta employees raised concerns about AI agent Muse mixing conversations across accounts and exposing private user data, citing internal posts. The Information separately reported that Meta plans to price its upcoming pocket-sized Muse Charm AI device at $300, including free 5G data for up to 12 months. Meta also said November 19 that it was reconsidering its 2030 net-zero emissions deadline because of its AI buildout.
NVDA · W:2026-11-16 NC% ▼ -22.92% OC% ▼ -21.06%
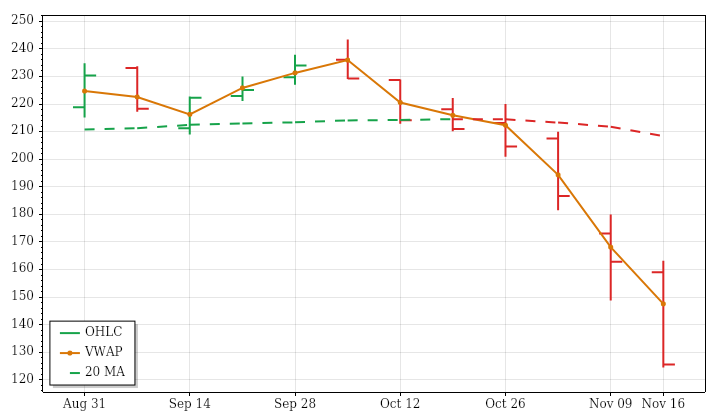
NVDA – Nvidia Technicals Summary
NVDA's completed week beginning November 16, 2026 closed at 125.53, down 22.92% from the prior weekly close and 21.06% from the open. The opening gap down was filled, but the recovery failed to hold. Price finished below the previous week's low, near its own low and below weekly VWAP, only slightly above the 52-week low.
The near-term downtrend aligned with the declining 12-week price trend. Intermediate- and far-term conditions remained mixed because their averages were still rising even as price stood well below them. This fourth consecutive large-range week had more than twice the prior 12-week average range, while volume reached roughly 2.7 times average. Those extremes extended existing expansion trends and were accompanied by larger trades. PSAR and ATR-median remained bearish. A next-week high above 202.7389 would trigger a bullish PSAR reversal, not establish a present recovery.
Nvidia News and Fundamentals
Nvidia shares fell 14% on November 20 and 23% for the week, erasing approximately $900 billion in weekly market value. Reuters reported that the SEC was examining Nvidia’s accounting. The regulatory scrutiny followed Jensen Huang’s departure as CEO amid reported scandals. Methuselah Advisors issued an open letter on November 20 criticizing the board’s decision to separate Huang from the company and questioning its handling of shareholder interests and due process.
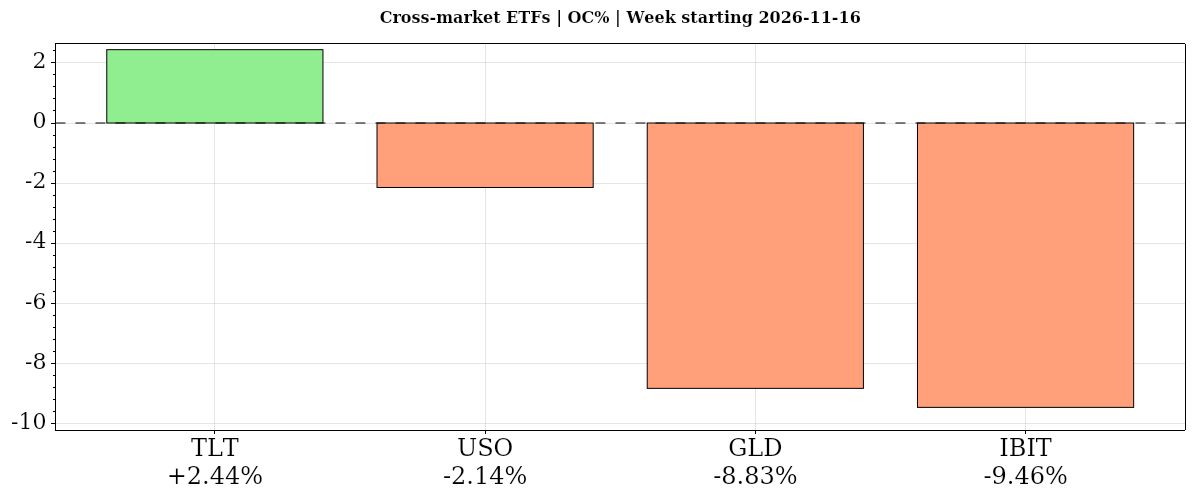
| Instrument | Bias | Date | WNC% | WOC% | O | H | L | C | VWAP | Vol | Mon | Tue | Wed | Thu | Fri |
|---|---|---|---|---|---|---|---|---|---|---|---|---|---|---|---|
| ▲ TLT | ▲ ▲ ▲ | 2026-11-16 | ▲ +2.61% | ▲ +2.44% | 79.51 | 81.71 | 79.23 | 81.45 | ▲ 80.31 | 211,721,448 | 0.00% | +0.21% | +0.84% | +0.16% | +1.37% |
| ▼ USO | ▼ ▼ ▲ | 2026-11-16 | ▼ -4.09% | ▼ -2.14% | 142.69 | 144.68 | 135.01 | 139.63 | ▲ 138.80 | 18,259,286 | -3.81% | +0.15% | -2.94% | +1.45% | +1.12% |
| ▼ GLD | ▼ ▼ ▼ | 2026-11-16 | ▼ -9.17% | ▼ -8.83% | 354.13 | 356.53 | 320.95 | 322.87 | ▼ 338.37 | 65,617,615 | -0.71% | -0.13% | -3.20% | -1.76% | -3.67% |
| ▼ IBIT | ▼ ▼ ▼ | 2026-11-16 | ▼ -15.20% | ▼ -9.46% | 36.47 | 37.14 | 32.62 | 33.02 | ▼ 35.23 | 347,295,447 | -5.52% | -1.77% | -2.16% | -0.79% | -5.87% |
| AVG/Sum | — | — | -6.46% | -4.50% | — | — | — | — | — | 642,893,796 | -2.51% | -0.38% | -1.87% | -0.23% | -1.77% |
Cross-Market ETFs
Negative confluence: average WOC% -4.50% from the week open and WNC% -6.46% versus the prior weekly close. TLT gained against equity weakness despite falling longer-term averages; bitcoin lagged and gold fell sharply on both comparisons. Oil declined on both but closed above weekly VWAP.
TLT · W:2026-11-16 NC% ▲ +2.61% OC% ▲ +2.44%
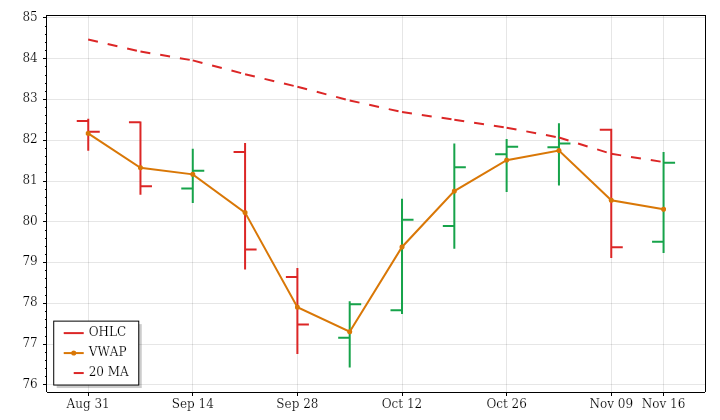
TLT – Long-Term Treasury Bonds Technicals Summary
TLT's completed week beginning November 16, 2026 ended at 81.45, up 2.61% from the prior weekly close and 2.44% from the open. The small opening gap up was filled before price finished near the week's high and above weekly VWAP. However, the entire week remained inside the previous week's range, distinguishing a strong weekly finish from a breakout beyond that range.
Price stood above a falling near-term average, leaving that horizon mixed. Intermediate- and far-term downtrends remained intact, and the 12-week price trend was also lower, so the advance ran against the broader structure. Range was moderately above its prior 12-week average and volume slightly elevated, consistent with expanding ranges and increasing participation. PSAR remained bullish and ATR-median had recently turned upward. A next-week low below 78.7053 would trigger a bearish PSAR reversal, not confirm one already present.
Treasury Bonds News and Fundamentals
Federal Reserve minutes released during the week revealed broader support for an October rate increase than the vote indicated. Governor Christopher Waller said the central bank might need to shock markets. The 10-year Treasury yield had spent four consecutive sessions above 5% as of November 18, while traders assigned a 95% probability to a December rate increase. A Treasury auction and the Fed minutes were identified as near-term catalysts for long-term bonds.
USO · W:2026-11-16 NC% ▼ -4.09% OC% ▼ -2.14%
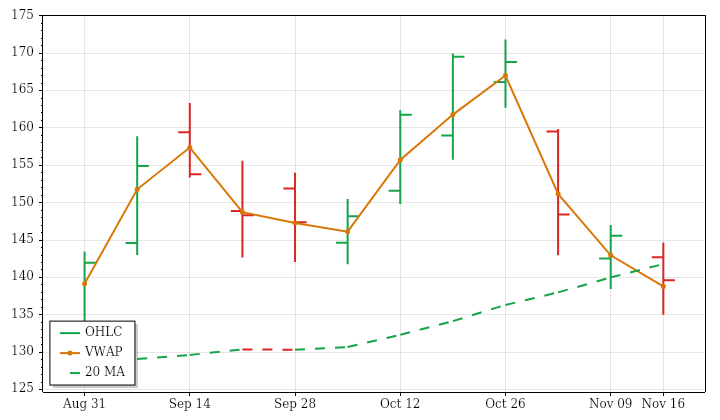
USO – Oil Technicals Summary
USO's completed week beginning November 16, 2026 ended at 139.63, down 4.09% from the prior weekly close and 2.14% from the open. An unfilled opening gap down accounted for part of the loss. Although the week made a lower high and lower low, its close remained inside the previous week's range and slightly above weekly VWAP, moderating the otherwise negative price action.
Near-term conditions were mixed because price stood below a rising average, while intermediate- and far-term uptrends remained intact. The 12-week price trend was upward but choppy. Unlike the broader tendency toward expanding ranges and increasing volume, this week had a below-average range and subdued participation, with volume about 31% below average. PSAR remained bearish while ATR-median retained an uptrend. A next-week high above 166.6383 would trigger a bullish PSAR reversal, not represent a confirmed change now.
Oil News and Fundamentals
WTI and Brent futures fell November 20 as steady Middle Eastern exports and recovering global supply outweighed concerns about attacks on tankers and energy infrastructure. Rising U.S. crude inventories also pressured prices ahead of an upcoming OPEC+ meeting. Oil had risen November 19 amid Middle East tensions after a Houthi projectile struck a tower in Riyadh. Reporting also highlighted continuing shipping risks in the Strait of Hormuz and higher interest-rate expectations.
GLD · W:2026-11-16 NC% ▼ -9.17% OC% ▼ -8.83%
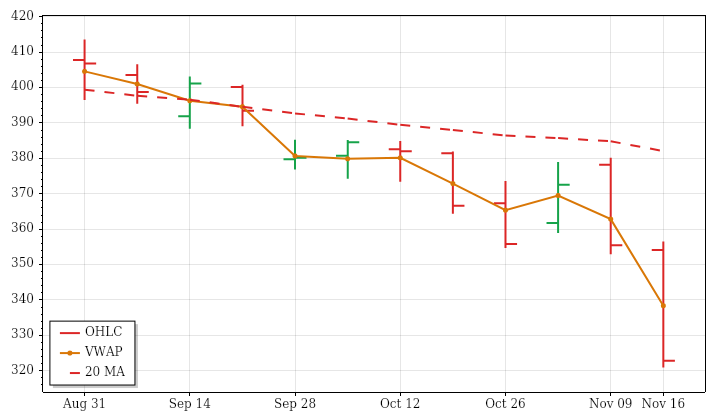
GLD – Gold Technicals Summary
GLD's completed week beginning November 16, 2026 ended at 322.87, down 9.17% from the prior weekly close and 8.83% from the open. Its opening gap down was filled, but price subsequently finished below the previous week's low and near its own low. The close below weekly VWAP and close proximity to the 52-week low underscored the weak finish.
Near- and intermediate-term downtrends aligned with the declining 12-week price trend. The remaining conflict was far term, where price still stood slightly above a rising average. This was the fifth consecutive large-range week, with the latest range more than twice its prior 12-week average. Volume rose sharply above average despite a declining lookback volume trend. Both PSAR and ATR-median remained bearish. A next-week high above 380.18 would trigger a bullish PSAR reversal, not confirm an existing recovery.
Gold News and Fundamentals
Gold’s selloff accelerated toward $3,500 on November 20, with Kitco’s weekly survey showing persistent bearish Wall Street sentiment and weakening retail optimism. Earlier that day, gold traded near $3,568 an ounce after November’s final University of Michigan consumer sentiment reading came in at 51.5, matching expectations, while inflation expectations declined. Reported pressures included dollar strength and restrictive Federal Reserve expectations despite gold ETF inflows. Real Macro’s Jeff Currie attributed metals selling to investors raising cash.
IBIT · W:2026-11-16 NC% ▼ -15.20% OC% ▼ -9.46%
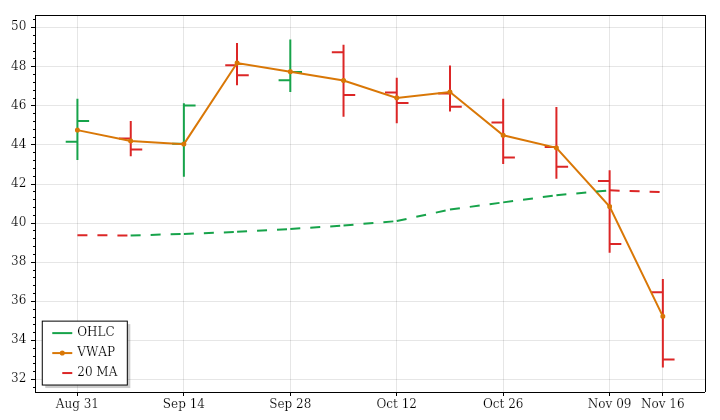
IBIT – Bitcoin Technicals Summary
IBIT's completed week beginning November 16, 2026 ended at 33.02, down 15.20% from the prior weekly close and 9.46% from the open. The difference reflects a substantial opening gap down that remained unfilled. Although price traded on both sides of the open, it finished below the previous week's low, near its own low and below weekly VWAP.
The 12-week price trend was downward, while near- and intermediate-term averages still rose beneath their earlier trajectories but stood well above the latest close, leaving both classifications mixed. No far-term trend was supplied. This fourth consecutive large-range week brought range and volume to roughly one and a half times their prior 12-week averages. Higher weekly volume contrasted with declining lookback participation. PSAR and the fresh ATR-median downtrend were bearish; a next-week high above 45.6757 would trigger a bullish PSAR reversal.
Glossary: Instrument — ticker symbol; hover for the instrument or company name; Date — week-start date. WNC% — prior-week close to this week’s close; WOC% — weekly session open-to-close percentage change. O — open; H — high; L — low; C — close, all for the table’s daily or weekly session; VWAP — volume-weighted average price; its arrow shows whether the close is above or below VWAP. Vol — period trading volume. Mon–Fri — each day’s prior-close-to-close percentage change.
Bias — three directional readings, in order: WNC%, WOC%, then VWAP. ▲ positive/above; ▼ negative/below; — neutral or unavailable. Matching arrows show alignment; opposing arrows show mixed conditions. AVG/Sum — simple average of percentage changes and sum of reported volumes.
Futures Session Fib Grid Analysis – Snapshot
Session Fib Grids normalise market positioning as percentages, making direction and alignment comparable across different asset types.
Latest available snapshot for each instrument; Time(CT) shows the individual update date and time.
| Instrument | Bias | Time(CT) | YSFG | MSFG | WSFG | RSFG | SFG | TSI |
|---|---|---|---|---|---|---|---|---|
| ▼ ES | ▼ ▼ ▼ ▼ ▼ ▼ | 2026-11-20 15:59:58 | ▼ -19 | ▼ -234 | ▼ -211 | ▼ -154 | ▼ -154 | ▼ -34 |
| ▼ NQ | ▼ ▼ ▼ ▼ ▼ ▼ | 2026-11-20 15:59:58 | ▼ -31 | ▼ -140 | ▼ -146 | ▼ -141 | ▼ -141 | ▼ -53 |
| ▼ YM | ▼ ▼ ▼ ▼ ▼ ▼ | 2026-11-20 15:59:56 | ▼ -25 | ▼ -162 | ▼ -226 | ▼ -105 | ▼ -105 | ▼ -34 |
| ▼ EMD | ▼ ▼ ▼ ▼ ▼ ▼ | 2026-11-20 15:58:53 | ▼ -5 | ▼ -139 | ▼ -188 | ▼ -107 | ▼ -107 | ▼ -23 |
| ▼ RTY | ▼ ▼ ▼ ▼ ▼ ▼ | 2026-11-20 15:59:57 | ▼ -2 | ▼ -160 | ▼ -187 | ▼ -119 | ▼ -119 | ▼ -63 |
| ▼ FDAX | ▼ ▼ ▼ ▼ ▼ ▼ | 2026-11-20 14:59:50 | ▼ -13 | ▼ -118 | ▼ -222 | ▼ -150 | ▼ -114 | ▼ -185 |
| ▼ NKD | ▲ ▼ ▼ ▼ ▼ ▼ | 2026-11-20 15:58:17 | ▲ +49 | ▼ -105 | ▼ -130 | ▼ -184 | ▼ -105 | ▼ -41 |
| Instrument | Bias | Time(CT) | YSFG | MSFG | WSFG | RSFG | SFG | TSI |
|---|---|---|---|---|---|---|---|---|
| ▼ BTC | ▼ ▼ ▼ ▼ ▼ ▼ | 2026-11-21 00:41:08 | ▼ -121 | ▼ -146 | ▼ -103 | ▼ -311 | ▼ -331 | ▼ -150 |
| ▼ GC | ▼ ▼ ▼ ▼ ▼ ▲ | 2026-11-20 15:59:57 | ▼ -240 | ▼ -87 | ▼ -138 | ▼ -33 | ▼ -32 | ▲ +62 |
| ▲ CL | ▲ ▼ ▼ ▲ ▲ ▲ | 2026-11-20 15:59:56 | ▲ +140 | ▼ -100 | ▼ -41 | ▲ +45 | ▲ +53 | ▲ +50 |
| ▼ 6E | ▼ ▼ ▼ ▼ ▼ ▼ | 2026-11-20 15:59:49 | ▼ -76 | ▼ -80 | ▼ -43 | ▼ -59 | ▼ -34 | ▼ -25 |
| ▲ ZB | ▼ ▼ ▲ ▲ ▲ ▼ | 2026-11-20 15:59:04 | ▼ -33 | ▼ -7 | ▲ +79 | ▲ +24 | ▲ +42 | ▼ -44 |
Glossary: YSFG — yearly; MSFG — monthly; WSFG — weekly; RSFG — regular trading hours (RTH); SFG — the current session, including pre-market or other sessions. TSI indicates trend strength and power.
Bias shows trend alignment across these six readings. The arrows follow the column order: YSFG, MSFG, WSFG, RSFG, SFG and TSI. Matching arrows show alignment; opposing arrows show mixed conditions.
Data, Market and System
Market Weekly Recap Summary
The AI trade remained the central equity pressure throughout the week. Monday’s technology-led decline reflected Nvidia leadership concerns and expanded chip-export licensing requirements; Tuesday brought defensive positioning ahead of its earnings amid investigations and uncertainty over AI growth. Strong results and above-expectations guidance then failed to reverse Nvidia’s slide as Jensen Huang’s departure, a delayed filing and questions about customer financing overshadowed demand growth. Wednesday nevertheless offered a brief divergence: QQQ and small caps rose, while Amazon rallied ahead of Anthropic’s IPO. Anthropic’s successful Thursday debut could not sustain enthusiasm for its corporate backers or the wider sector. Broad selling resumed, then intensified Friday amid a reported Nvidia accounting investigation, further regulatory scrutiny and Broadcom’s reported reduction in AI chip orders.
Inflation and restrictive monetary policy supplied a persistent second headwind. Early-week Fed commentary favored continued tightening, and Wednesday’s meeting minutes showed nearly all officials expected further rate increases. Those concerns persisted Thursday despite softer manufacturing data and higher-than-expected jobless claims. Friday’s decline in consumer inflation expectations did not displace the tightening narrative. Equity weakness also broadened beyond technology: financials faced banking outages early in the week, all 11 S&P 500 sectors declined Thursday, and small- and mid-cap stocks finished the week down 7.54% and 7.00%, respectively.
Cross-market moves showed that defensive assets did not move together. TLT advanced across successive sessions despite the hawkish policy backdrop, while dollar strength and rising-rate concerns repeatedly pressured gold. Oil weakened earlier in the week as inventory growth reinforced surplus concerns, then recovered Thursday and Friday amid Middle East shipping risks and energy-supply tensions, without erasing its weekly loss. Bitcoin exposure was also hit hard, with IBIT down 15.20% for the week.
Daily Session Recap
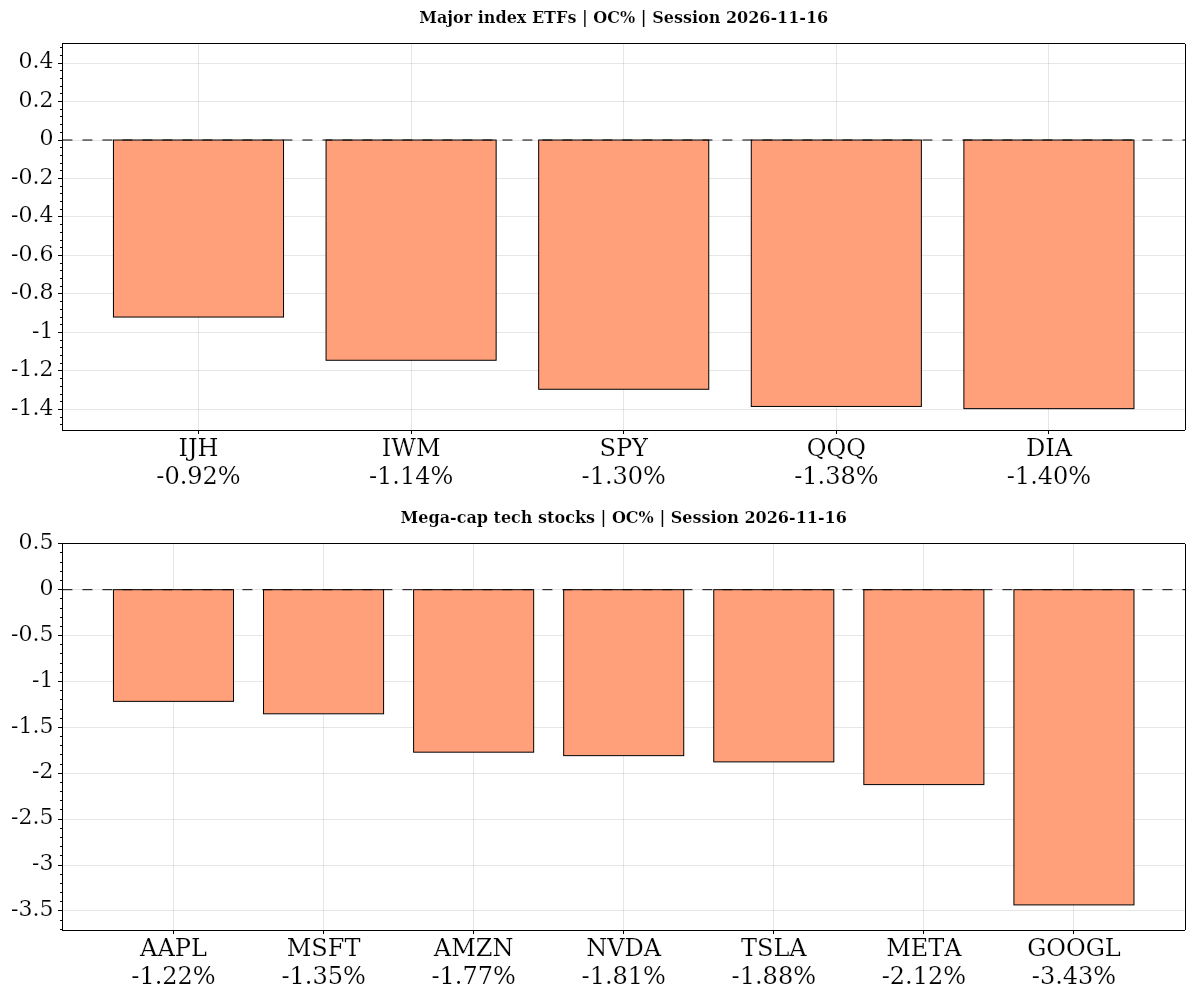
Monday 2026-11-16 — Session Summary
- Fed Chairman Warsh Speaks — 12:00 ET · High
Stocks finished lower Monday as a technology-led selloff and weakness in financial shares weighed on the broader market. Technology fell 2.9%, with Nvidia’s leadership uncertainty and expanded restrictions on AI chip exports at the center of the decline. The S&P 500 and Nasdaq-100 ETFs lost 1.30% and 1.38%, respectively, from their opens. Both closed below their prior-day lows, leaving near- and medium-term technical trends bearish. Technology’s substantial large-cap weighting amplified its influence on the broader indexes.
Nvidia faced a combination of governance concerns and tighter access to overseas markets. Inquiries into Jensen Huang’s relationship with a woman suspected of working with Chinese intelligence added to uncertainty surrounding the company’s leadership. Meanwhile, the Commerce Department issued an interim rule requiring U.S. licenses for advanced AI chip exports to data centers in Singapore, Malaysia, Thailand, Indonesia and Brazil, citing the risk of diversion to restricted buyers. The restrictions sharpened attention on Nvidia’s international exposure: China accounted for more than 20% of its revenue last year, with $12.4 billion attributed to the country in the six months through July 26. Supportive commentary on the long-term AI investment story offered a contrast to the immediate pressure on technology shares.
Financial stocks also declined as online banking outages were reported at Chase, Bank of America, Wells Fargo and Capital One. JPMorgan Chase shares fell more than 2.4%. In the rates market, coverage highlighted sharply higher bond volatility and a surge in Treasury yields, even as the far-term Treasury ETF finished unchanged from its prior close after slipping 0.16% from its open. Cleveland Fed President Beth Hammack reiterated support for slow, steady rate hikes and reaffirmed the 2% inflation target, keeping monetary policy and inflation in focus.
Higher Treasury yields and technology-led liquidations pressured gold, whose ETF declined 0.34% from its open. The oil ETF fell a steeper 1.86% from its open. Elsewhere in metals-related equities, USA Rare Earth dropped 10% as analysts pushed back sales estimates, adding another pocket of weakness beyond the technology and financial sectors.
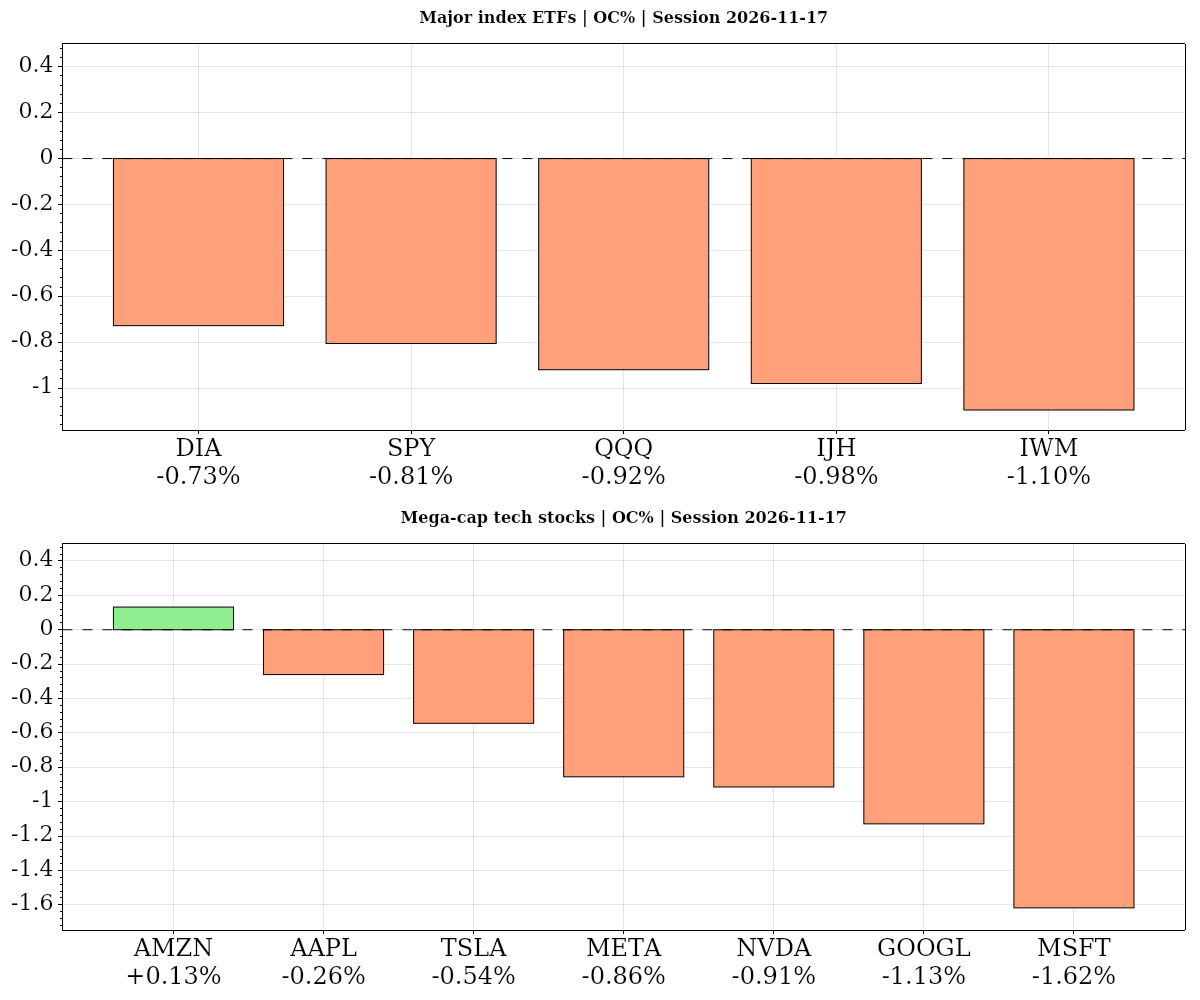
Tuesday 2026-11-17 — Session Summary
- Core Retail Sales m/m — 08:30 ET · High
- Retail Sales m/m — 08:30 ET · High
- NVDA — Earnings · AMC
Stocks closed lower Tuesday as investors positioned ahead of Nvidia’s after-close earnings, with uncertainty surrounding the AI trade weighing on technology shares and volatility rising for a fourth consecutive session. The S&P 500 and Nasdaq-100 ETFs fell 0.81% and 0.92%, respectively, from their opening levels. Major U.S. indexes remained below their 200-day moving averages, while bearish near- and medium-term trends reinforced the risk-averse technical backdrop.
Nvidia’s pending results were the central earnings catalyst, alongside leadership uncertainty, a disclosure investigation and chip-export restrictions. Tighter U.S. controls and mixed export-policy signals raised concerns about technology revenues and the durability of AI-sector growth. Regulatory scrutiny also extended to a Justice and Commerce department criminal investigation into Singapore-based Megaspeed over suspected chip diversion, allegations the company denies. Beyond semiconductor sales, restrictions on data-center construction by local governments were identified as another risk to AI expansion.
Economic data offered a mixed picture: retail sales rose 0.2%, while industrial production declined 0.4%. Policy commentary remained a restraint on sentiment, with Fed official Williams continuing to favor tighter monetary policy while saying the present moment did not require dramatic action. Inflation and interest-rate concerns remained relevant to precious metals after October’s gold decline amid Fed rate-hike expectations, dollar strength and investor liquidations. The U.S. dollar consolidated recent gains, while the Canadian dollar held near a 19-month low.
Treasury bonds advanced despite the cautious policy backdrop, with the far-term Treasury ETF gaining 0.32% even as its longer-term trend remained downward. Energy and precious metals weakened from their opening levels: the oil ETF fell 1.64% from the open but still finished 0.15% above its prior close, while gold slipped 0.39% from the open and remained near its 52-week low. Widespread service outages affecting technology platforms, travel and financial transactions added an operational cross-current, while crypto-market weakness was linked to dollar strength, volatile equities and concern following a Binance hack.
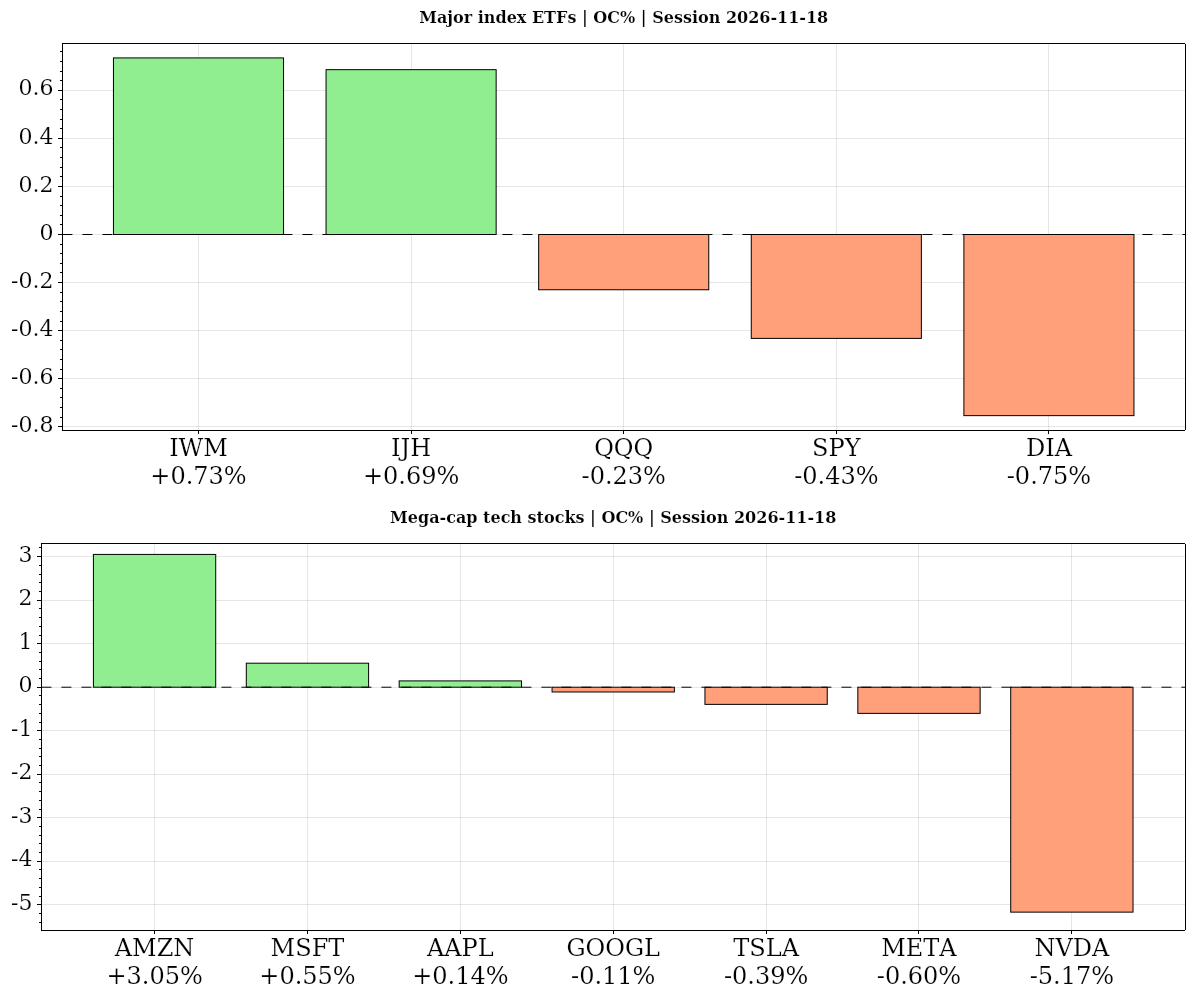
Wednesday 2026-11-18 — Session Summary
- Fed's Waller speech — 07:30 ET · Medium
- Building Permits (MoM) — 08:30 ET · Medium
- Housing Starts (MoM) — 08:30 ET · Medium
- Pending Home Sales (MoM) — 10:00 ET · Medium
- EIA Crude Oil Stocks Change — 10:30 ET · Low
- Fed's Daly speech — 12:15 ET · Medium
- Fed's Barr speech — 13:35 ET · Medium
- FOMC Minutes — 14:00 ET · High
- Fed's Williams speech — 14:30 ET · Medium
- Fed's Kashkari speech — 16:15 ET · Medium
U.S. stocks finished mixed as Nvidia’s strong earnings failed to overcome concerns about its leadership transition and the prospect of further Federal Reserve tightening. The S&P 500-tracking SPY fell 0.31% and Dow proxy DIA lost 1.10%, while Nasdaq-100 tracker QQQ gained 0.39%. Small caps also edged higher. Amazon stood out with a 3.82% advance ahead of Anthropic’s closely watched initial public offering, while Nvidia dropped 2.89%, extending its losing streak to five sessions. Technical conditions remained fragile after the S&P 500’s Tuesday break below its 200-day moving average; a Russell 2000 “death cross” added to concerns about market breadth.
Nvidia’s Tuesday evening results offered substantial reassurance about AI demand. Quarterly revenue rose 103% to $115.84 billion, and its $130 billion fourth-quarter revenue outlook exceeded expectations. Yet succession uncertainty following Jensen Huang’s resignation, a delayed quarterly SEC filing and scrutiny of China-related business overshadowed those figures. The board’s insistence that Huang would not return did little to settle investors’ concerns. Questions also persisted about financing for Nvidia’s neocloud customers and the cost of the AI infrastructure buildout. Anthropic’s impending debut provided another focus for AI positioning, including the substantial stakes held by Amazon and Alphabet. After the close, Anthropic priced its offering at $83 a share, above its proposed $70–$78 range, ahead of Thursday’s scheduled trading debut.
Monetary policy remained a headwind. Minutes released Wednesday from the Fed’s October meeting showed nearly all officials expected further rate increases, despite holding the benchmark range at 3.75%–4%. Officials worried inflation could persist even as energy and tariff effects faded. Governor Christopher Waller advocated either a half-point December increase or communication of a faster pace of tightening next year. Elevated Treasury yields remained part of the backdrop, although long-duration Treasury fund TLT gained 0.84%. Housing reports were mixed: starts improved, but permits disappointed and pending home sales fell 4.7% in October.
A stronger dollar and expectations for additional rate increases weighed heavily on metals, with GLD falling 3.20% as gold reached more than one-year lows. Oil also declined, with USO down 2.94%, as a larger-than-expected U.S. inventory build reinforced supply-surplus concerns. Those pressures outweighed renewed Middle East attacks and threats to Strait of Hormuz shipping, while conflict-related supply-chain disruption remained an inflation risk.
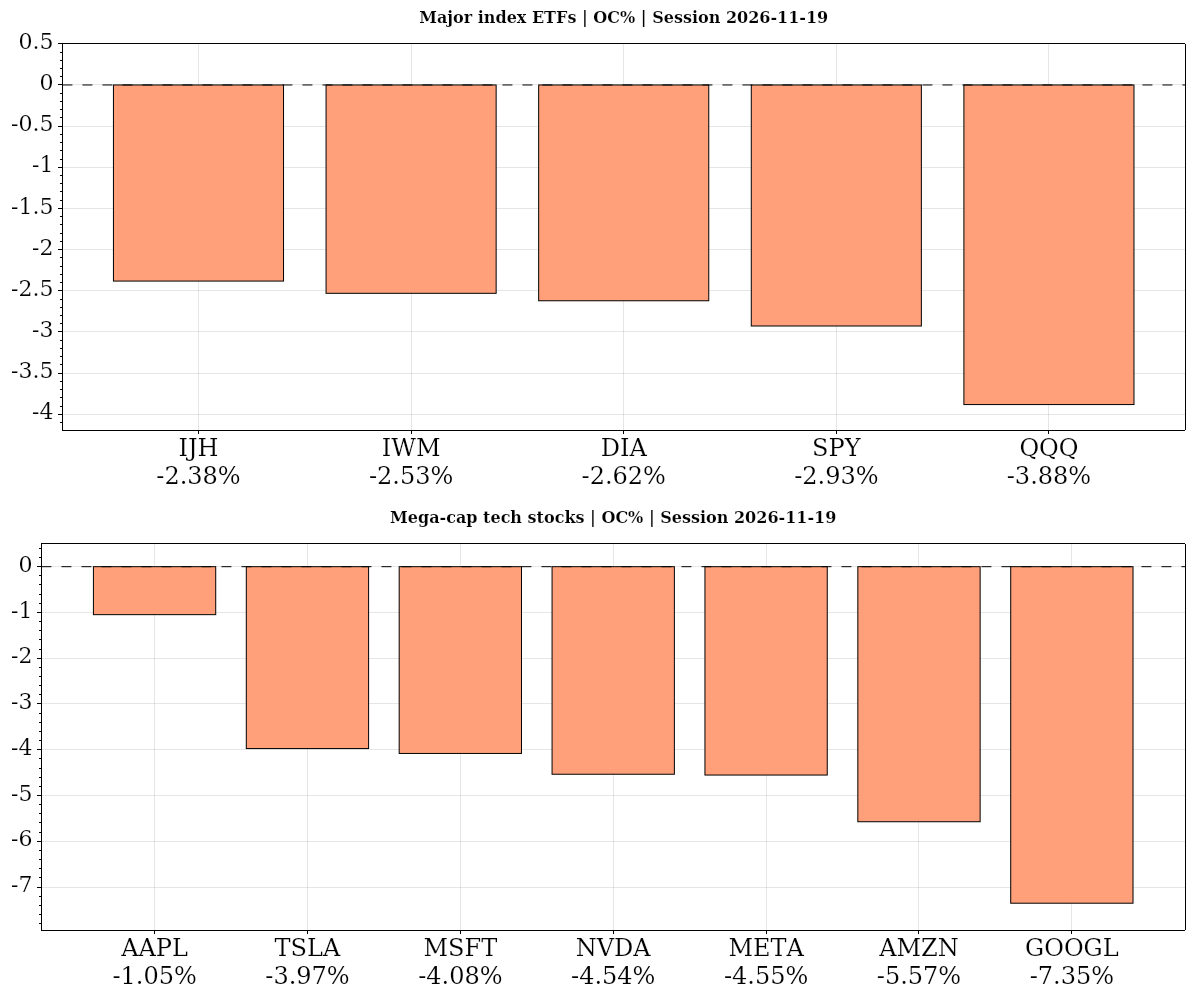
Thursday 2026-11-19 — Session Summary
- Philadelphia Fed Manufacturing Survey — 08:30 ET · Medium
- Initial Jobless Claims — 08:30 ET · Medium
- 4-Week Bill Auction · $115B — 11:30 ET · Medium
- 8-Week Bill Auction · $110B — 11:30 ET · Medium
- Fed's Goolsbee speech — 12:30 ET · Medium
- 10-Year TIPS Auction · $19B — 13:00 ET · High
- 9-Day Bill Auction · $15B — 13:00 ET · Medium
- Fed's Barr speech — 14:15 ET · Medium
- Fed's Paulson speech — 18:30 ET · Medium
U.S. stocks closed sharply lower as Anthropic’s landmark debut failed to dispel concerns about artificial-intelligence valuations, financing and higher interest rates. SPY fell 1.96%, while QQQ lost 2.19% and the Dow-tracking DIA declined 2.18%. Small- and mid-cap shares also suffered broad losses. All 11 S&P 500 sectors finished lower, with 10 falling more than 1%, although cybersecurity stocks bucked the weakness. Strong corporate earnings and enthusiasm for a major new listing proved insufficient to restore confidence in the technology trade.
Anthropic raised about $81.3 billion at $83 a share, above its marketed range, and finished its first session at $97.17, up 17% from the offer price. That success did not translate into gains for its major corporate backers: Amazon dropped 3.87% and Alphabet fell 3.46%. Nvidia lost 3.30%, extending its losing streak to six sessions despite recently reporting record quarterly revenue of $115.8 billion and issuing $130 billion in fourth-quarter guidance. Jensen Huang’s departure, leadership uncertainty and export-control investigations continued to overshadow those results. Across AI-related shares, concerns about debt, circular financing arrangements and the sustainability of enormous spending commitments remained central. Technical conditions were also fragile, with extreme short-dated bearish options sentiment contrasting with longer-term indicators that did not confirm an end to the correction.
Inflation and monetary policy added to the pressure. Previously released Fed minutes continued to reinforce expectations for further tightening, while J.P. Morgan called for rate increases at the next three meetings. Fed officials Philip Jefferson and Austan Goolsbee highlighted the near-term inflationary pressures from AI investment before potential productivity benefits materialize. Softer economic releases offered little reassurance: the Philadelphia Fed manufacturing survey fell to 6.3 against expectations of 20, and initial jobless claims rose to 203,000 versus a 197,000 forecast. The 10-year TIPS auction yielded 2.903%, up from 2.653% previously, underscoring the elevated yield backdrop.
Cross-market performance reflected those competing pressures. Long-duration Treasury ETF TLT edged up 0.16%, but gold failed to provide shelter: GLD fell 1.76% as dollar strength and rate-hike expectations weighed on bullion. USO gained 1.45% amid persistent Middle East shipping risks, despite a 3.4 million-barrel U.S. crude inventory build and concerns about ample supply. After the close, Gap cut its annual outlook, adding a fresh warning about apparel demand ahead of the holidays.
Friday 2026-11-20 — Session Summary
- Fed's Waller speech — 08:25 ET · Medium
- Michigan Consumer Sentiment Index — 10:00 ET · Medium
- UoM 1-year Consumer Inflation Expectations — 10:00 ET · Medium
- Michigan Consumer Expectations Index — 10:00 ET · Medium
- UoM 5-year Consumer Inflation Expectation — 10:00 ET · Medium
- President Trump Speaks — 12:00 ET · Medium
- Fed's Cook speech — 12:15 ET · Medium
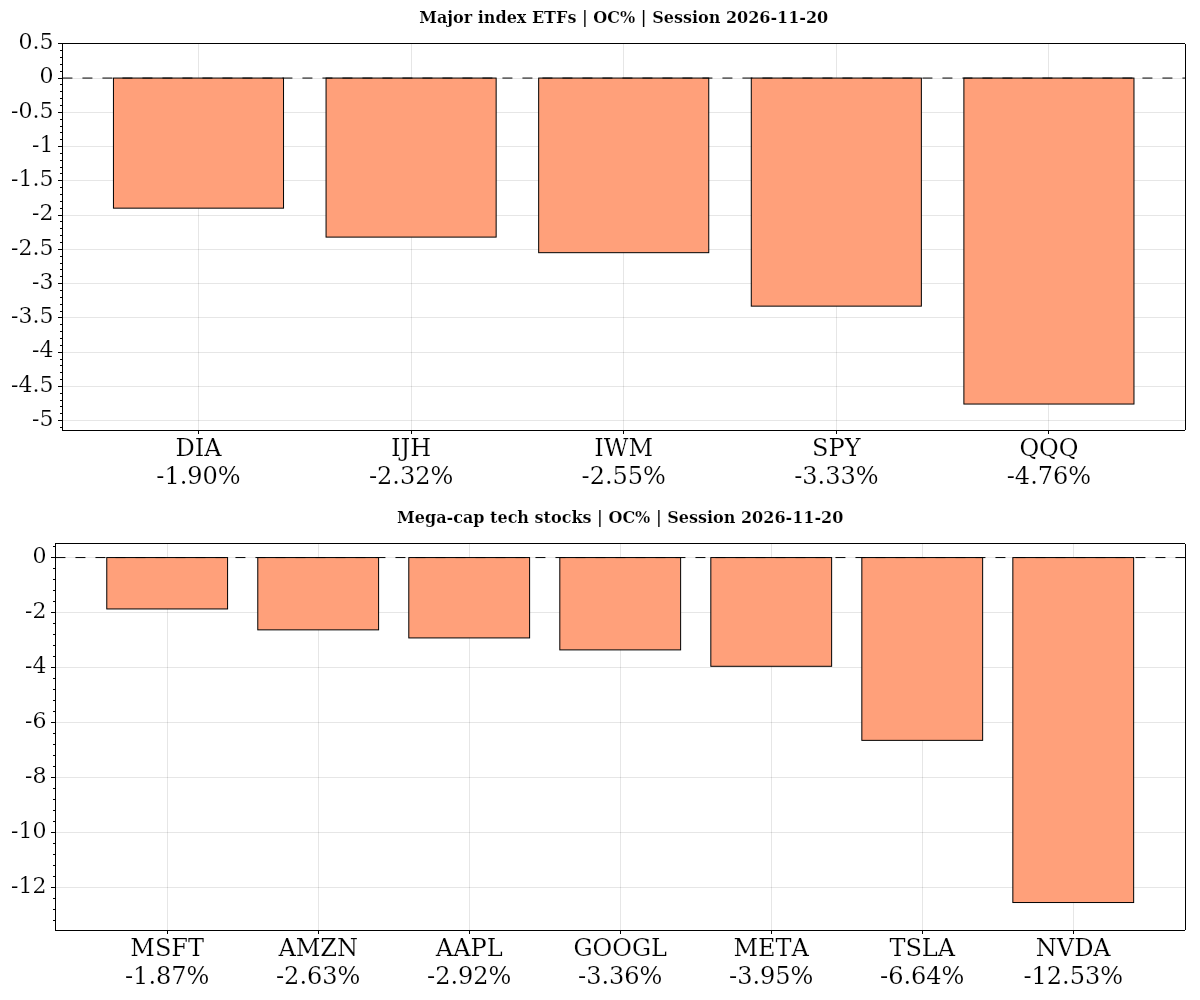
Stocks ended Friday sharply lower, led by a semiconductor rout as scrutiny of Nvidia and concerns over AI chip demand hit technology shares. Measured from their opens, the S&P 500 ETF fell 3.33%, the Nasdaq-100 ETF lost 4.76% and Nvidia dropped 12.53%. The VIX topped 31, underscoring the risk-off tone, while rotation into value and defensive shares cushioned the broader market. Equity selling came on above-average volume, and futures charts showed accelerating daily downtrends, although longer-term weekly structures remained mixed.
Nvidia’s reported accounting investigation and Broadcom’s reported reduction in AI chip orders dominated the equity news. Both stocks were down about 12% in afternoon trading. Renewed scrutiny of Nvidia’s circular financing arrangements and the debt supporting AI investment added to concerns surrounding the sector. Nvidia also faced a subpoena from California’s attorney general over whether its chips or confidential information had reached China. Together, these developments put pressure on AI-linked shares and technology-heavy index exposure.
Inflation and monetary policy remained important cross-currents. Michigan consumer sentiment matched forecasts at 51.5, while one-year inflation expectations fell to 3.7%. Even so, economists described the Federal Reserve as focused on fighting inflation and continuing interest-rate increases despite the equity selloff. Energy costs reinforced that tension: jet fuel prices were double year-earlier levels amid the Iran war, contributing to the highest holiday airfares in a decade. Oil rose, with the oil ETF gaining 2.21% from its open. Discussions among Donald Trump, Xi Jinping and Vladimir Putin covered nuclear security, energy supplies and global stability, alongside a reported pledge to increase gas and diesel supplies.
Treasuries also advanced, with the far-term Treasury ETF rising 0.88% from its open, but gold did not share in the gains. The gold ETF fell 1.26%, and junior gold miners also sold off as commentary highlighted rising real yields and a stronger dollar as pressures on precious metals. During gold’s deepening decline, market commentary identified support at $3,500 for spot gold and $3,573 for gold futures.
Futures Higher Time Frame Analysis
Summary of the current state of US Indices Futures based on higher time-frame (HTF) technical analysis as of: 2026-11-21 11:30 -06:00 CT.
US Indices Futures
- ES bearish YSFG/MSFG/WSFG alignment, below all daily benchmarks, weekly higher-high/higher-low structure intact, support 6898.00/6482.25, daily reversal threshold 7200.00.
- NQ bearish YSFG/MSFG/WSFG alignment, below weekly 55/100 benchmarks, expanding weekly pivots, support 24976.50/23543.00, daily reversal threshold 26784.50, resistance 28697.00.
- YM bearish YSFG/MSFG/WSFG alignment, below all daily benchmarks, weekly higher-high/higher-low structure intact, support 48054/45862, daily reversal threshold 49940, resistance 52850.
- EMD bearish YSFG/MSFG/WSFG alignment, below all daily benchmarks, weekly higher-high/higher-low structure intact, support 3422.6/3332.6, daily reversal threshold 3566.8, resistance 3750.3/3770.1.
- RTY bearish YSFG/MSFG/WSFG readings, testing weekly 100 benchmark, weekly higher-high/higher-low structure intact, support 2578.9/2451.7, daily reversal threshold 2704.1, resistance 2862.2/2888.7.
- FDAX bearish YSFG/MSFG/WSFG readings, below all daily benchmarks, weekly higher-high/higher-low structure intact, support 24590/22392, daily reversal threshold 25548, resistance 27084.
Overall State
- Short-Term: Bearish
- Intermediate-Term: Bearish
- Long-Term: Neutral
Conclusion
US indices show correlated downside direction across daily pivots, YSFG/MSFG/WSFG readings and benchmark positioning; supplied short signals align with the declines. Developing pivot lows remain unconfirmed, and reversal thresholds are not established resistance pivots. Weekly structures diverge: NQ is below its rising 100-week benchmark, while ES, RTY and FDAX are testing that area. FDAX retains bullish weekly intermediate-term structure; RTY remains neutral. Rising long-duration weekly benchmarks contrast with uniformly bearish daily far-term ratings, leaving the aggregate long-term picture mixed.
Note: Intra-day counter-trend pullbacks or retracements may occur, HTF is context for informational usage and market structure. Glossary: Session Fib Grids periods of YSFG:’Yearly’, MSFG:’Monthly’, WSFG:’Weekly’
For full details visit: AlphaWebTrader Technicals
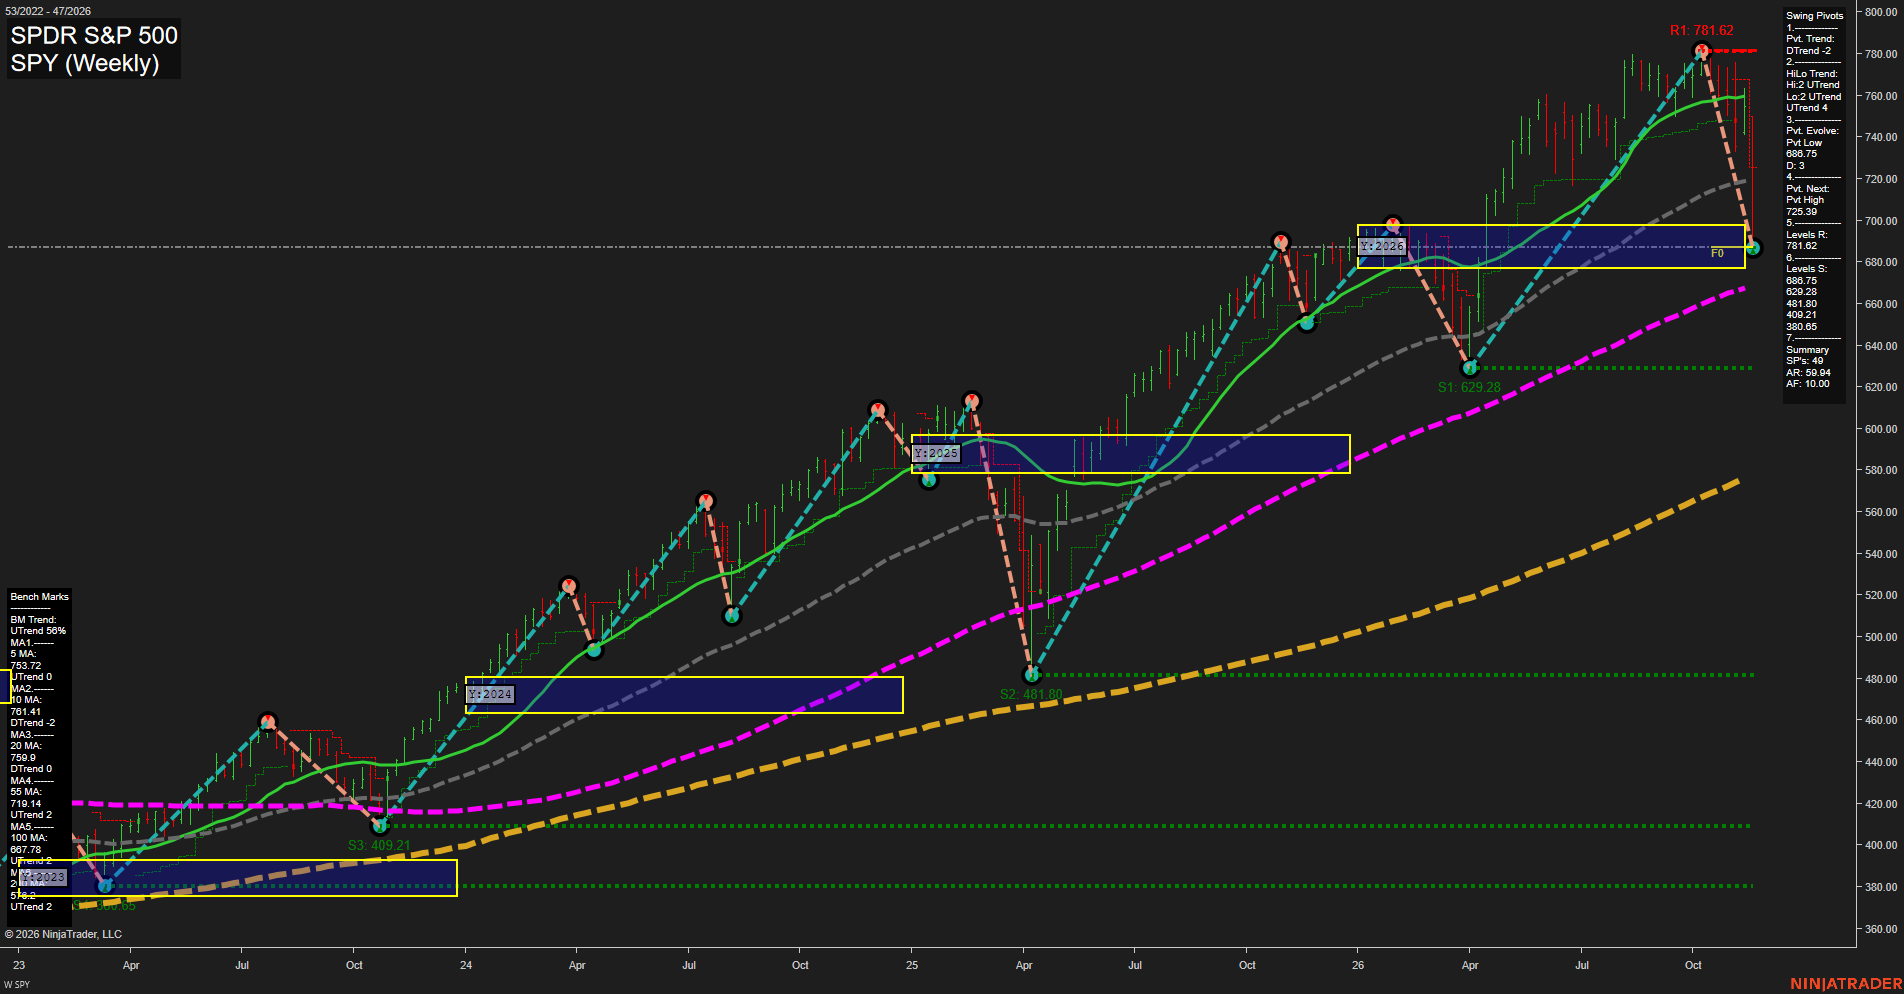
SPY Weekly View
Overall Rating
- Near-Term: Bearish
- Medium-Term: Neutral
- Far-Term: Bullish.
Key Insights Summary
From a futures swing trader’s perspective, SPY shows a fast downside swing within a still-rising longer-term structure. The decline from 781.62 to approximately 686.75 is about 12%, with price below the 5-, 10-, 20- and 55-week benchmarks. This is substantial corrective pressure rather than a shallow pullback. The developing pivot low coincides with the 2026 yearly neutral zone near F0%, making this a significant structural test. The next opposite-pivot threshold is 725.39; the broader high/low pivot trend remains upward despite the near-term downtrend. Beneath current price, the rising 100-week benchmark near 667.78 precedes established swing support at 629.28. Far-term strength persists through rising 100- and 200-week averages, but medium-term evidence is mixed. Weekly and monthly grid readings and the named recent trade signals are not visible, so their neutral entries are placeholders rather than confirmed signal readings. These are SPY reference prices, not executable ES or MES futures levels; the image does not establish news or seasonal drivers.
View charts on: AlphaWebTrader HTF Charts
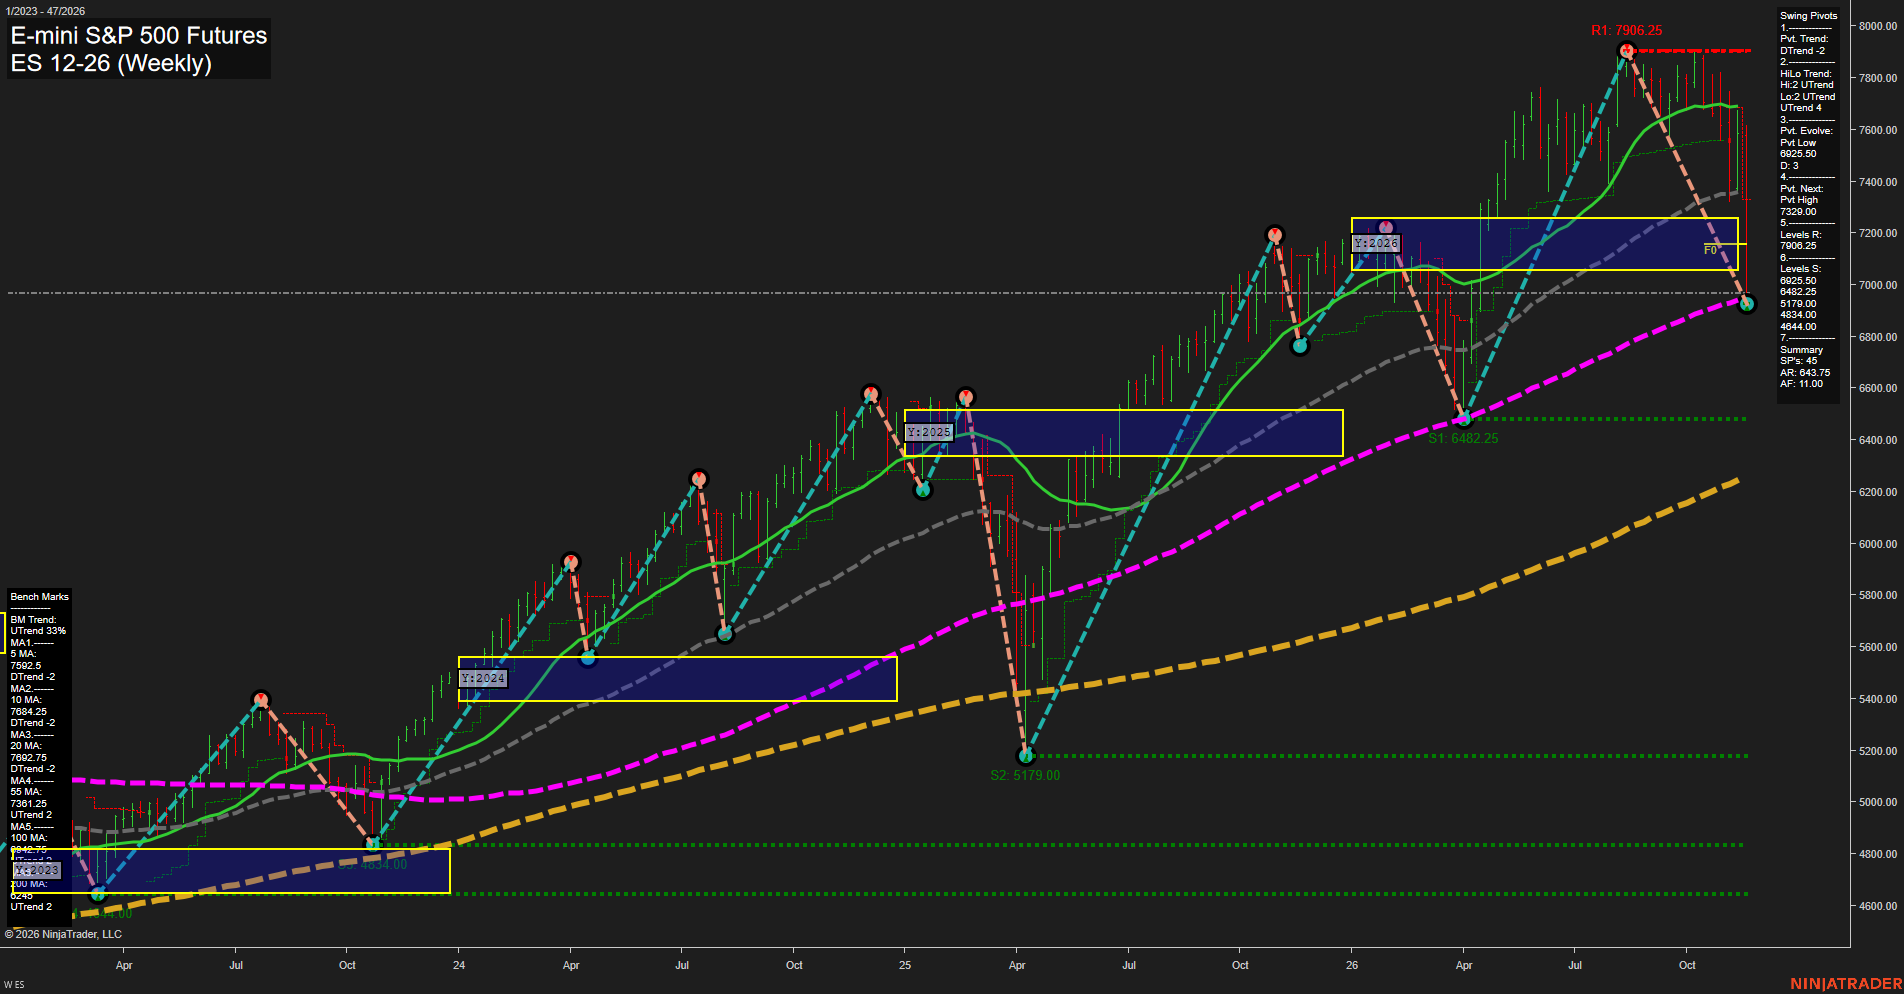
ES Weekly View
Overall Rating
- Near-Term: Bearish
- Medium-Term: Bearish
- Far-Term: Neutral.
Key Insights Summary
The weekly chart shows an accelerating downswing from 7906.25, with large bearish bars carrying price beneath the yearly neutral zone and the 5-, 10-, 20- and 55-week benchmarks. Negative weekly and monthly grid readings align with the recent short signals, reinforcing near- and medium-term bearish conditions. The evolving 6925.50 pivot low is approximately 12.4% below the peak and sits near the rising 100-week benchmark, making this a significant long-term trend test. Medium-term higher-high/higher-low pivot structure remains intact, but current downside momentum contrasts sharply with that earlier advance. A 7329.00 reversal threshold defines the next potential pivot-high transition; 7906.25 remains overhead pivot resistance. Below the evolving low, established support is 6482.25. Rising 100- and 200-week benchmarks leave the far-term picture mixed rather than uniformly bearish. The image provides no verified news catalyst or seasonal confirmation.
View charts on: AlphaWebTrader HTF Charts
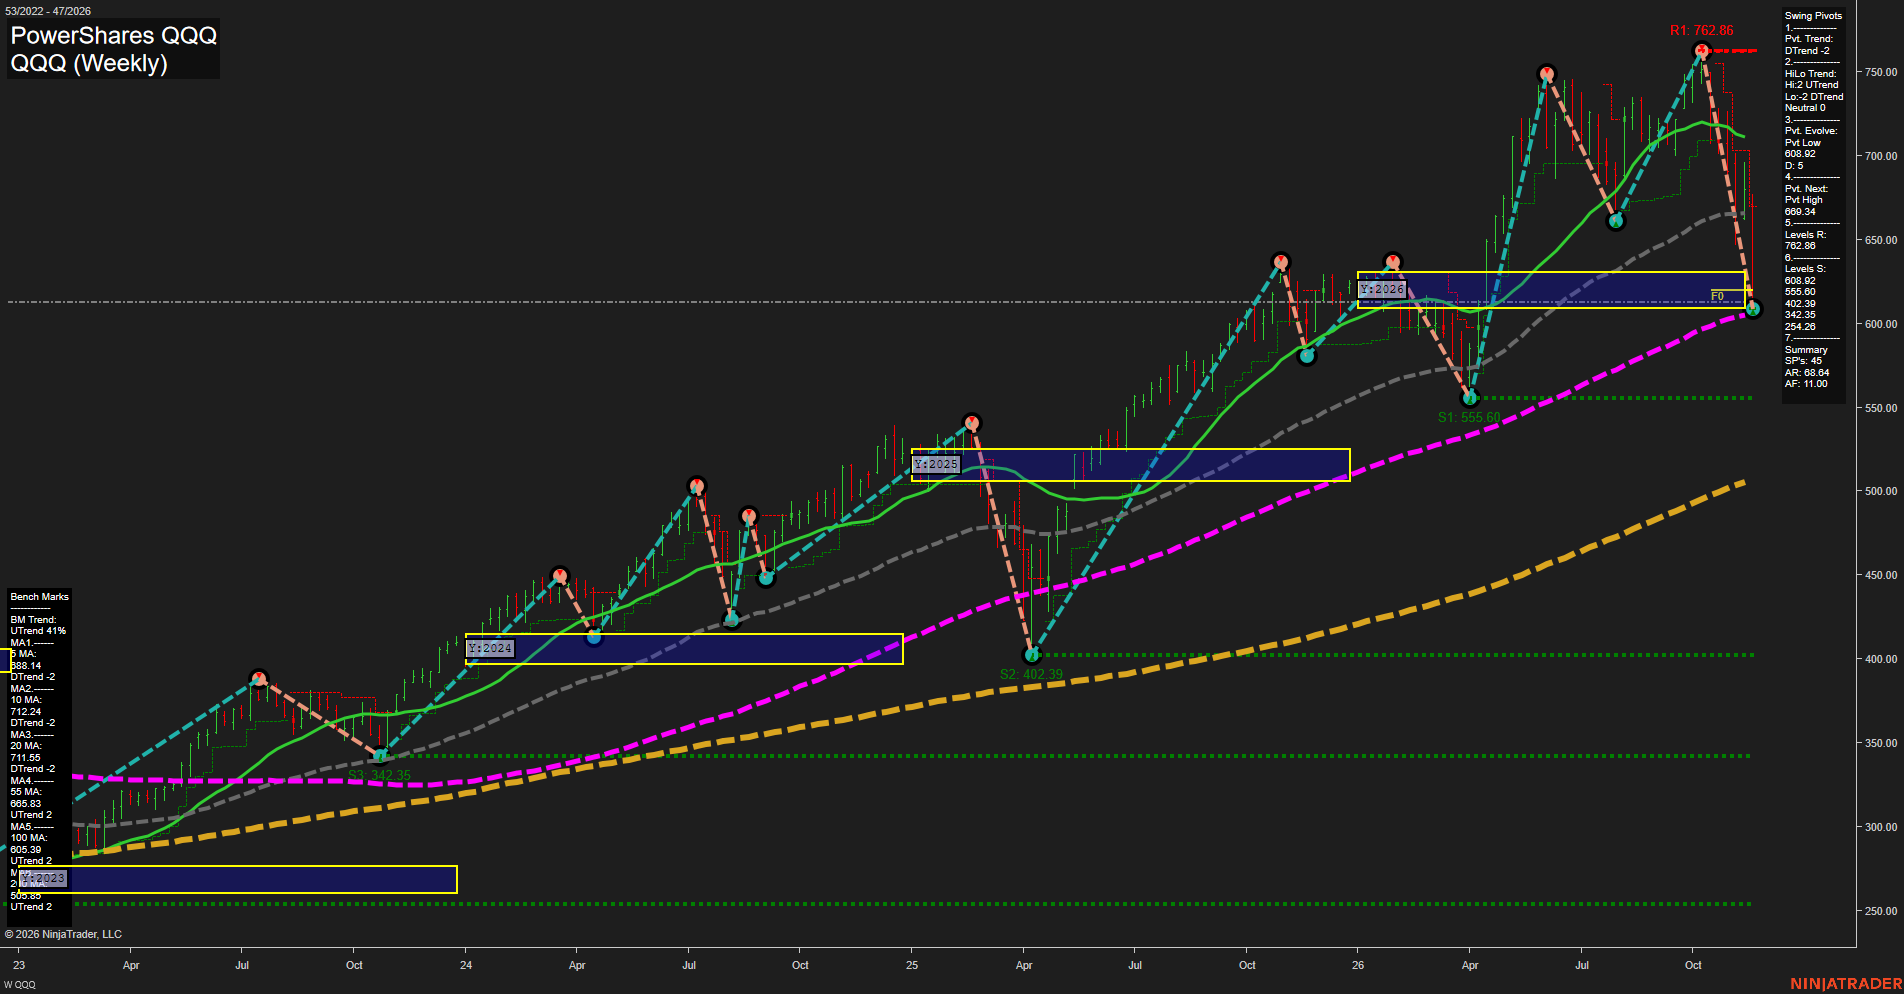
QQQ Weekly View
Overall Rating
- Near-Term: Bearish
- Medium-Term: Bearish
- Far-Term: Bullish.
Key Insights Summary
From a futures swing trader's perspective, QQQ shows a fast downside swing within a still-rising long-term structure, rather than a confirmed broad trend reversal. The decline from 762.86 has broken beneath the 5-, 10-, 20- and 55-week benchmarks, leaving price near the lower boundary of the 2026 yearly neutral zone and the rising 100-week average. The 608.92 evolving pivot and 605.39 benchmark form a concentrated support area; 555.60 is the next listed support below it. The pivot summary identifies 669.34 as the reversal threshold for an opposite pivot, not an established resistance level. Mixed higher highs and lower lows indicate expanding medium-term volatility rather than an orderly trend. The far-term bullish rating reflects rising 100- and 200-week benchmarks, while near- and medium-term conditions remain bearish. Weekly and monthly grids and the requested USAR signals are not visible, so their neutral entries are placeholders rather than verified signals. QQQ levels describe the ETF and are not directly transferable to Nasdaq futures prices; no news or seasonal catalyst is established by this chart.
View charts on: AlphaWebTrader HTF Charts
NQ Weekly View
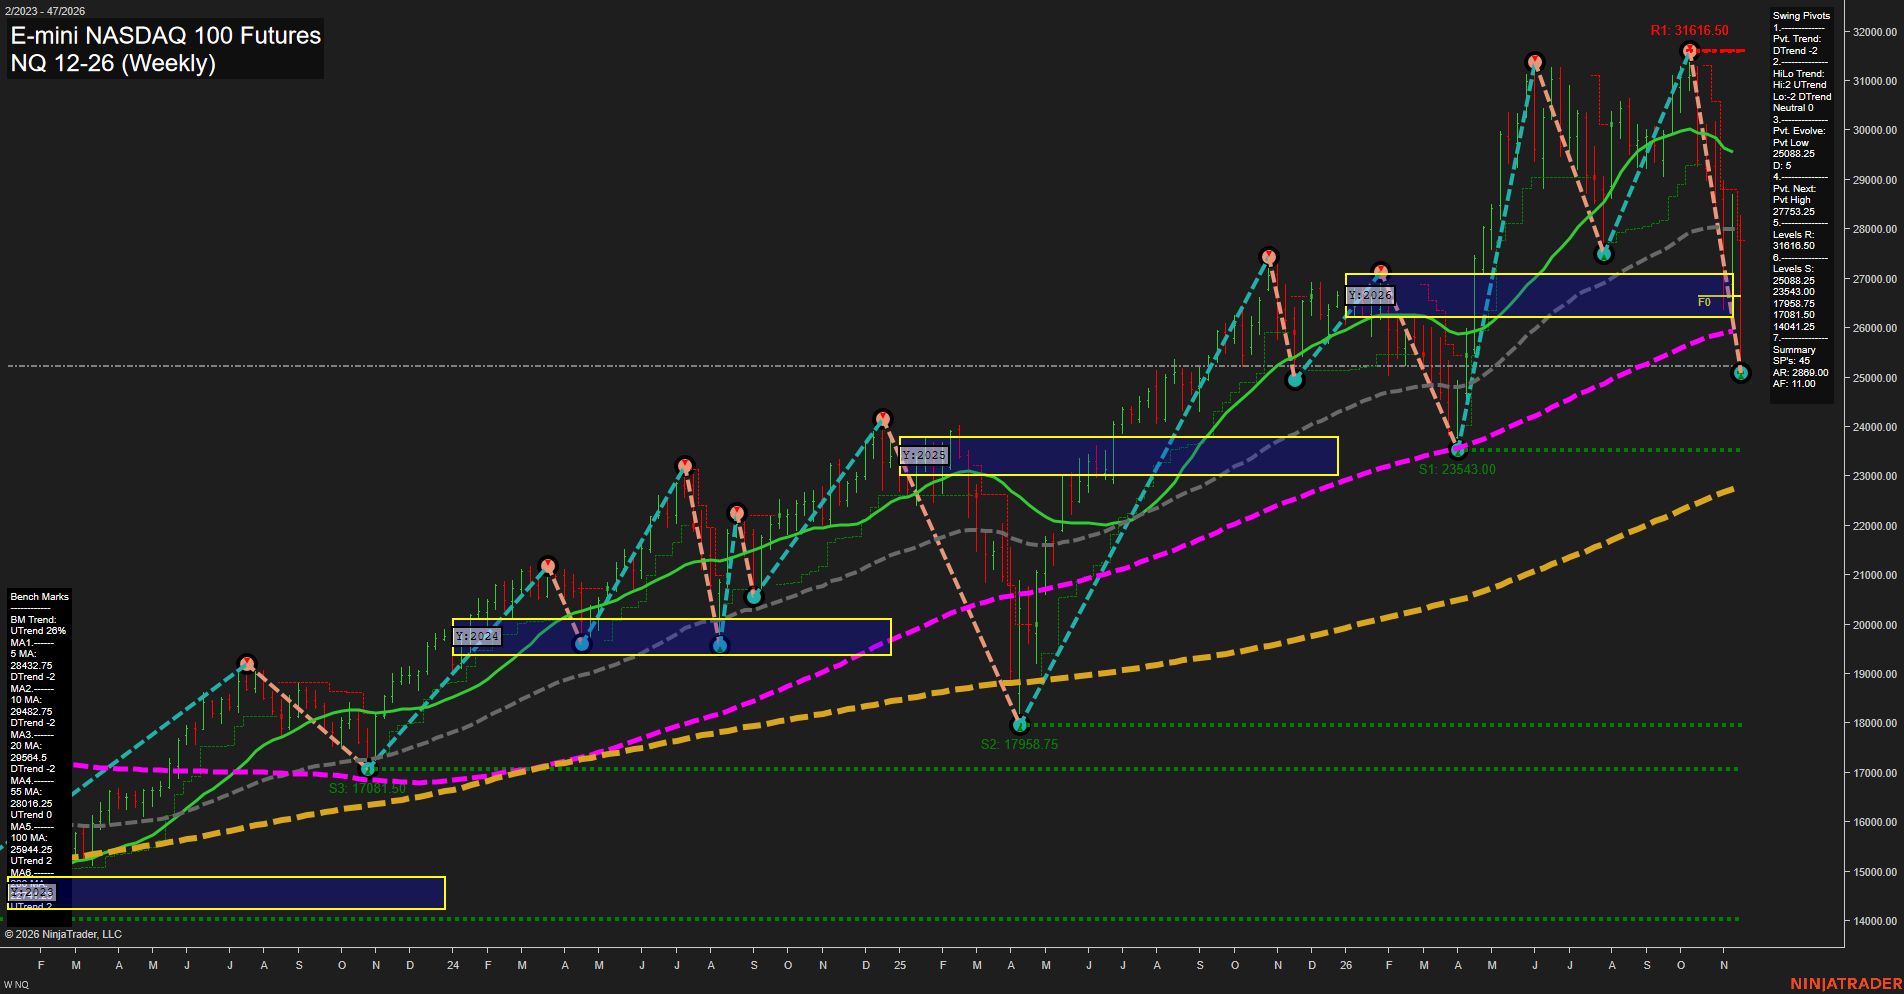
Overall Rating
- Near-Term: Bearish
- Medium-Term: Bearish
- Far-Term: Neutral.
Key Insights Summary
The weekly structure shows a fast, large-bar selloff from 31,616.50 into the evolving 25,088.25 pivot low, a roughly 20.7% peak-to-trough decline. The reversal beneath the prior summer pivot low creates mixed medium-term structure: higher highs but lower lows, rather than a confirmed orderly uptrend. Price is below the yearly no-trade zone and the 5-, 10-, 20-, 55- and 100-week benchmarks, confirming substantial downside displacement. Falling short-term averages, negative weekly and monthly grids, and both reported short signals reinforce near-term bearish alignment. The 25,088.25 pivot and 23,543.00 support define the nearest downside reference levels; 27,753.25 is the summary's opposite-pivot reversal threshold, not a confirmed resistance pivot. Rising 100- and 200-week benchmarks preserve a longer-term bullish underpinning, but the negative yearly grid and loss of the 100-week average leave the far-term assessment neutral. No monthly or far-term trade signals, news catalysts, or seasonal evidence are supplied.
View charts on: AlphaWebTrader HTF Charts
USO Weekly View
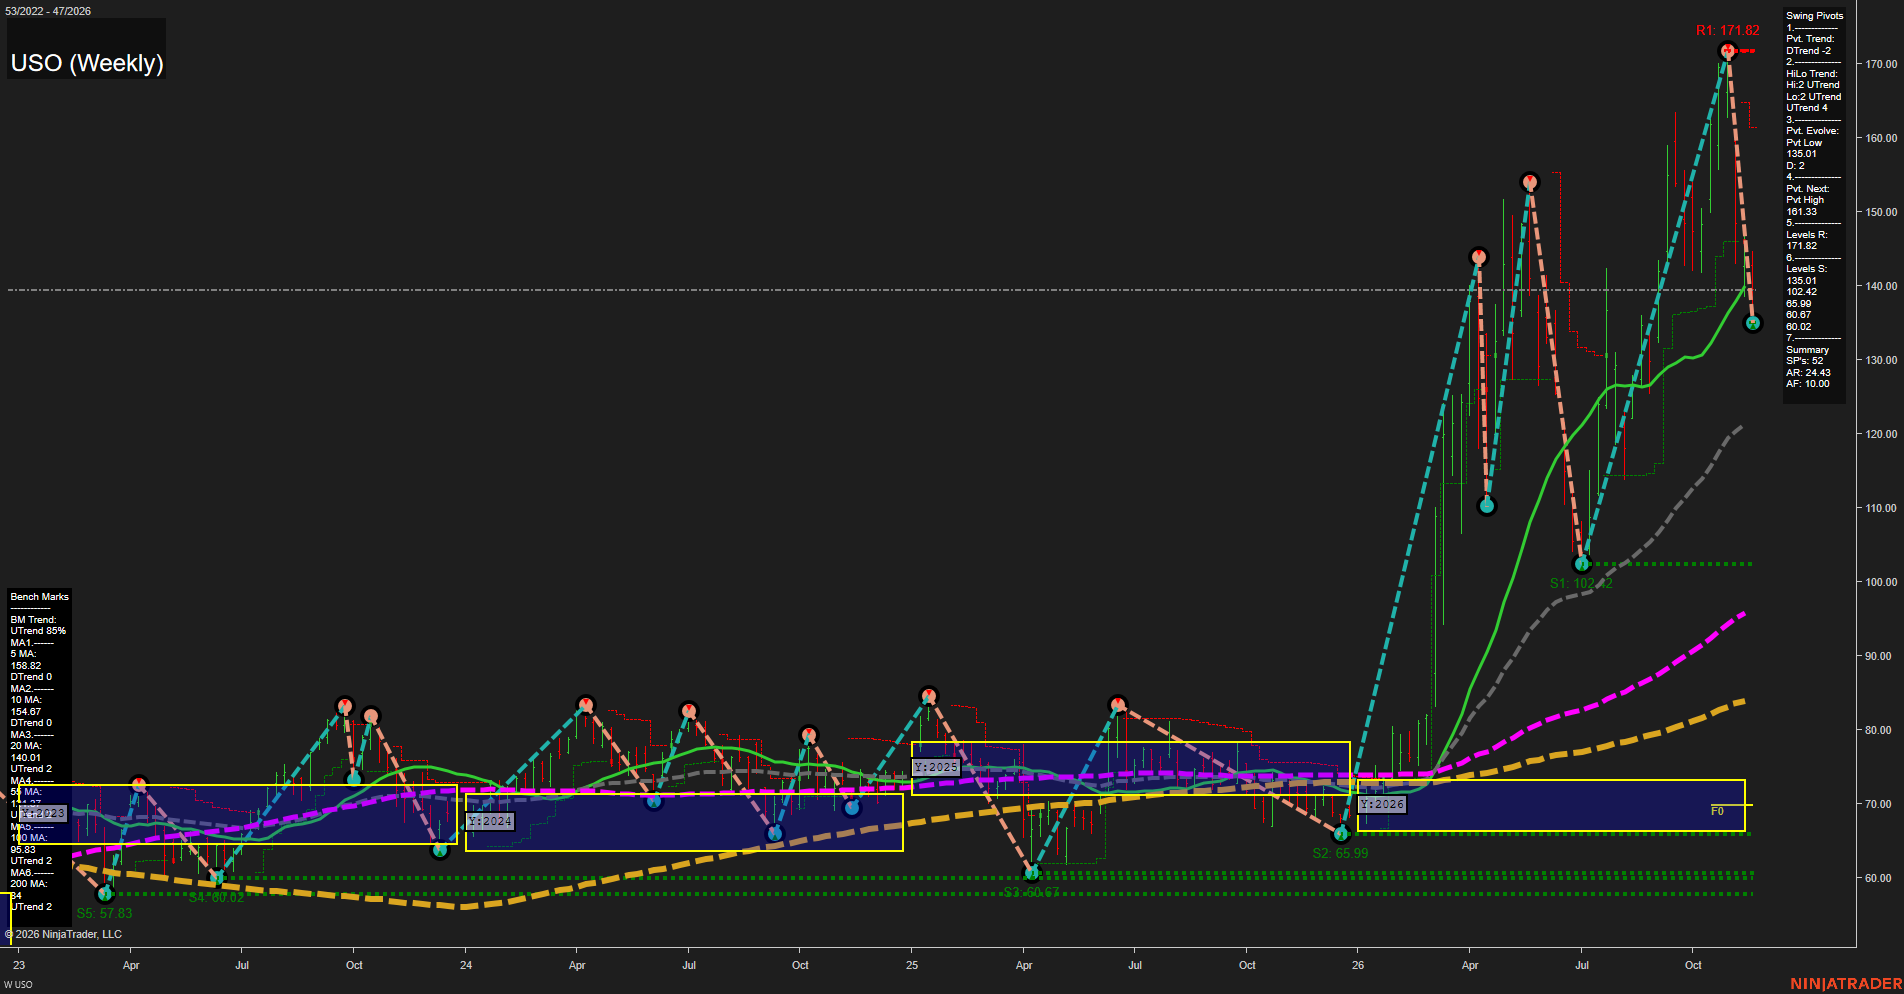
Overall Rating
- Near-Term: Bearish
- Medium-Term: Bullish
- Far-Term: Bullish.
Key Insights Summary
From a futures swing trader’s perspective, this is a fast countertrend correction within an established larger uptrend. The decline from 171.82 to the evolving 135.01 pivot low represents approximately 21% peak-to-trough, with price now testing the rising 20-week benchmark near 140. Near-term momentum and both short-term benchmarks have turned down, while the medium-term higher-high/higher-low structure remains intact. Support is concentrated at 135.01, followed by 102.42; 161.33 is the summary’s next pivot-high reversal threshold, distinct from confirmed resistance at 171.82. Rising 55-, 100-, and 200-week benchmarks and price well above the yearly neutral zone support the broader bullish classification. Weekly and monthly grids and the four requested recent-signal series are not visible; their neutral entries are placeholders rather than confirmed readings. News and seasonal drivers cannot be established from this chart. USO is a futures-linked fund, so these levels describe the fund rather than a specific crude-oil futures contract.
View charts on: AlphaWebTrader HTF Charts
CL Weekly View
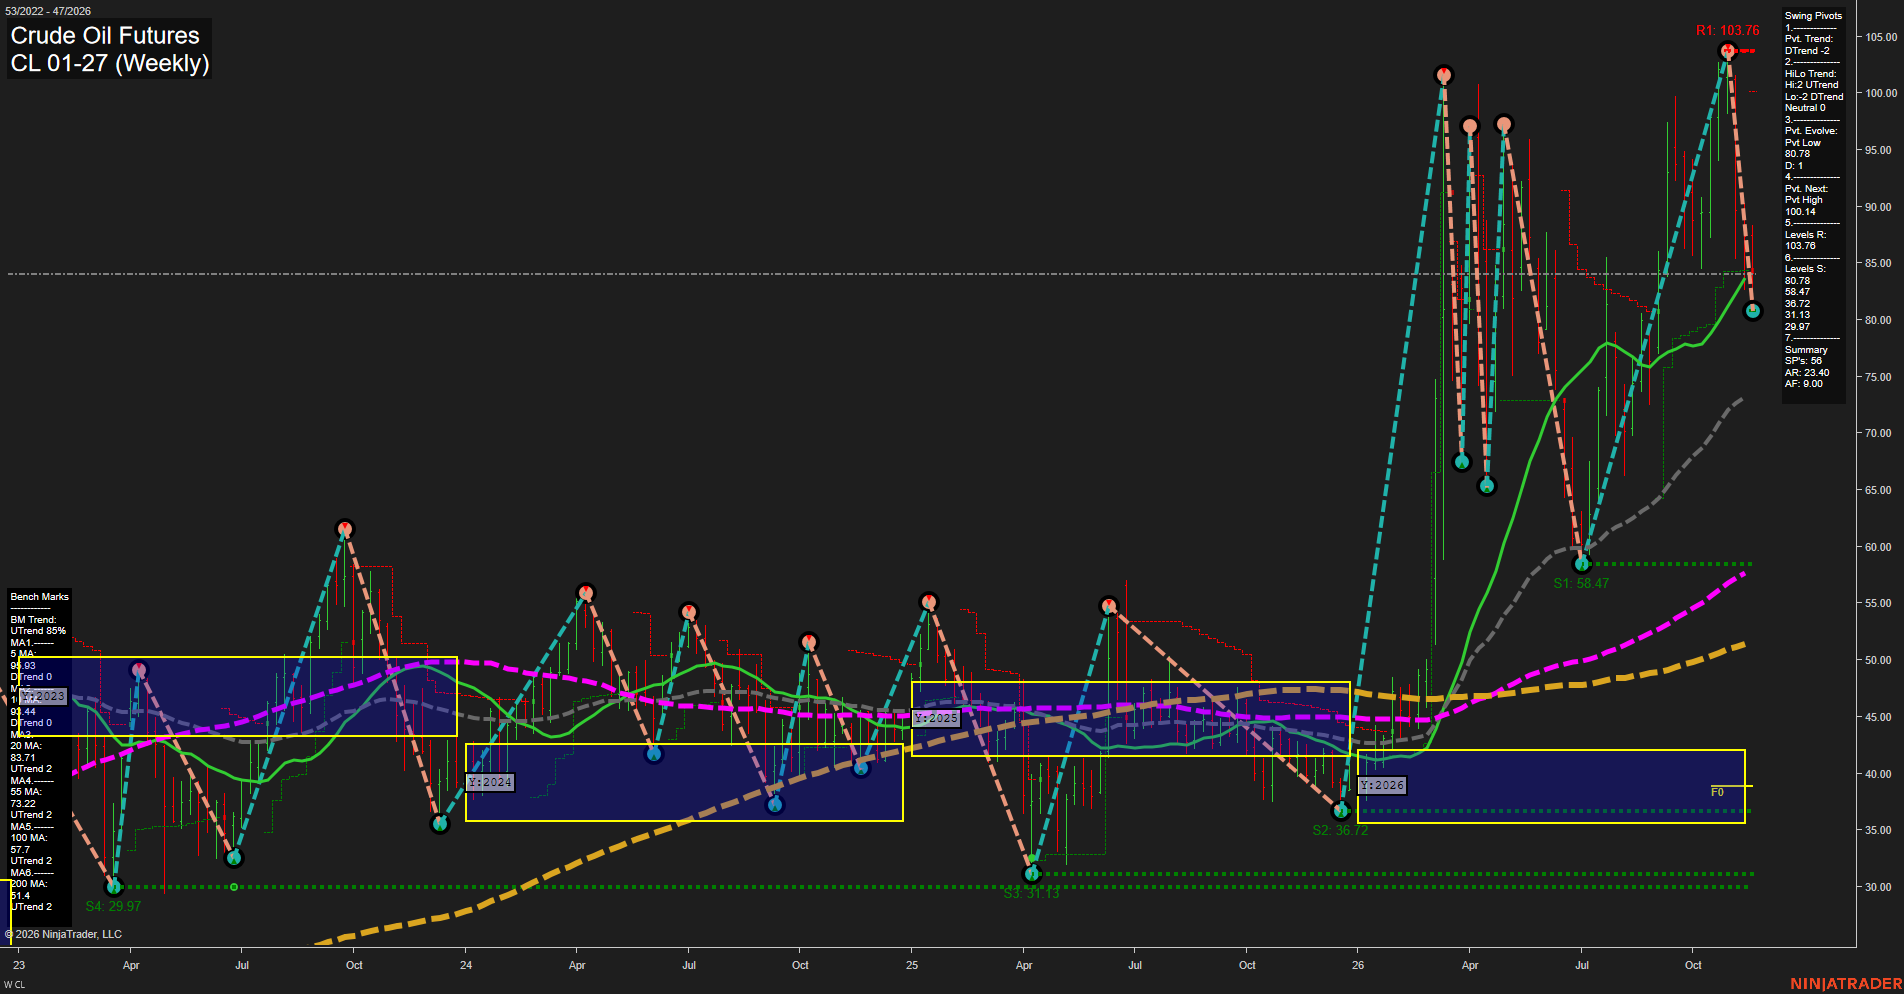
Overall Rating
- Near-Term: Bearish
- Medium-Term: Neutral
- Far-Term: Bullish.
Key Insights Summary
The weekly structure shows a sharp countertrend selloff from 103.76, with an evolving pivot low at 80.78 and price now approximately at the rising 20-week benchmark of 83.71. Large weekly ranges, declining 5- and 10-week benchmarks, negative weekly and monthly grids, and both recent short signals establish bearish near-term alignment. Medium-term conditions remain mixed: the pivot summary pairs rising highs with declining lows, while the 20- and 55-week benchmarks still rise. The far-term backdrop remains bullish, supported by the positive yearly grid and rising 100- and 200-week benchmarks. Overall, this is a volatile retracement within a broader advancing structure rather than a uniformly bearish trend across all horizons. No dated medium- or far-term trade signals, or news and seasonal evidence, are supplied to independently confirm those influences.
View charts on: AlphaWebTrader HTF Charts
GLD Weekly View
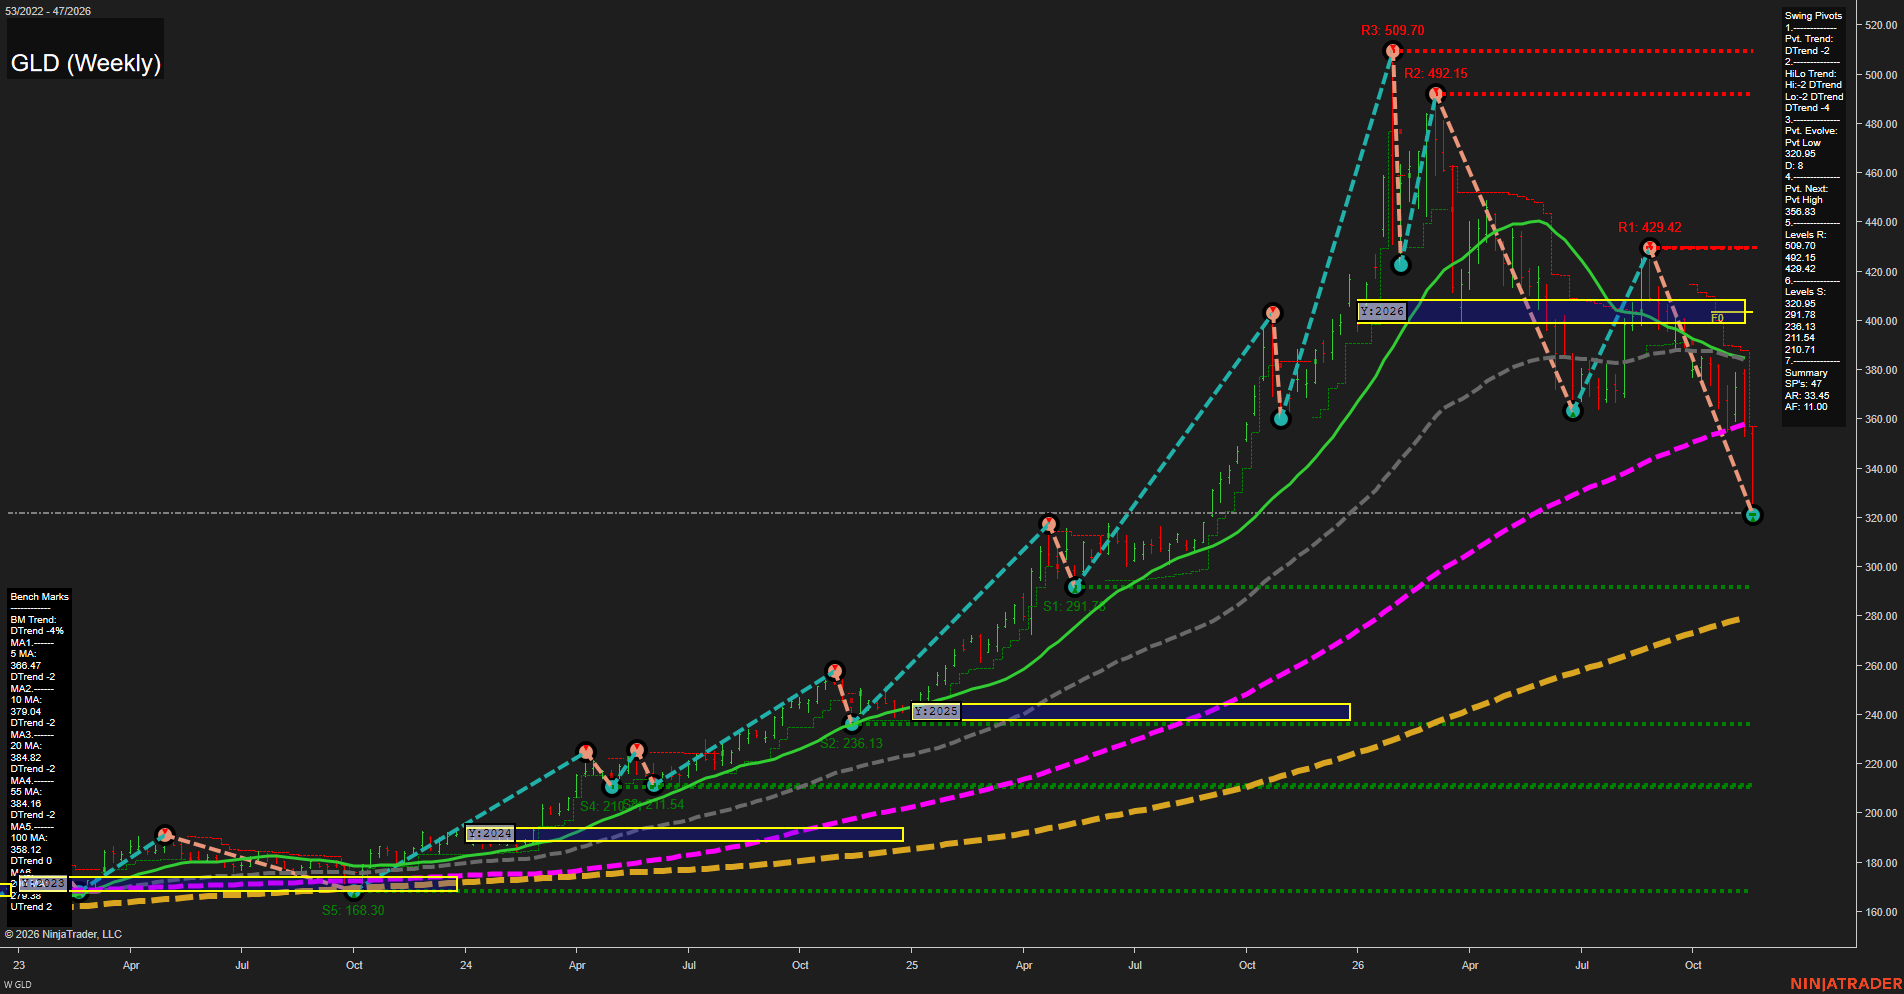
Overall Rating
- Near-Term: Bearish
- Medium-Term: Bearish
- Far-Term: Bearish.
Key Insights Summary
From a futures swing trader’s perspective, GLD shows an accelerating weekly downswing rather than an orderly pullback. Lower pivot highs at 509.70, 492.15 and 429.42 accompany a new evolving low at 320.95, confirming deterioration across near- and medium-term structure. Price is below the 5-, 10-, 20-, 55- and 100-week benchmarks and the yearly neutral zone around 400–409. The latest low is approximately 37% below the 509.70 peak. The next listed support is 291.78, while the rising 200-week benchmark near 278.6 remains a longer-cycle counterweight to the bearish structure. The 356.83 next-pivot threshold is distinct from the listed swing-high resistance levels. Weekly and monthly grids and the named recent signal studies are not visible, so ratings reflect the available price, pivot and benchmark evidence. GLD provides a gold-market proxy here; these prices are ETF levels, not gold futures contract levels. News and seasonal explanations cannot be established from this chart alone.
View charts on: AlphaWebTrader HTF Charts
GC Weekly View
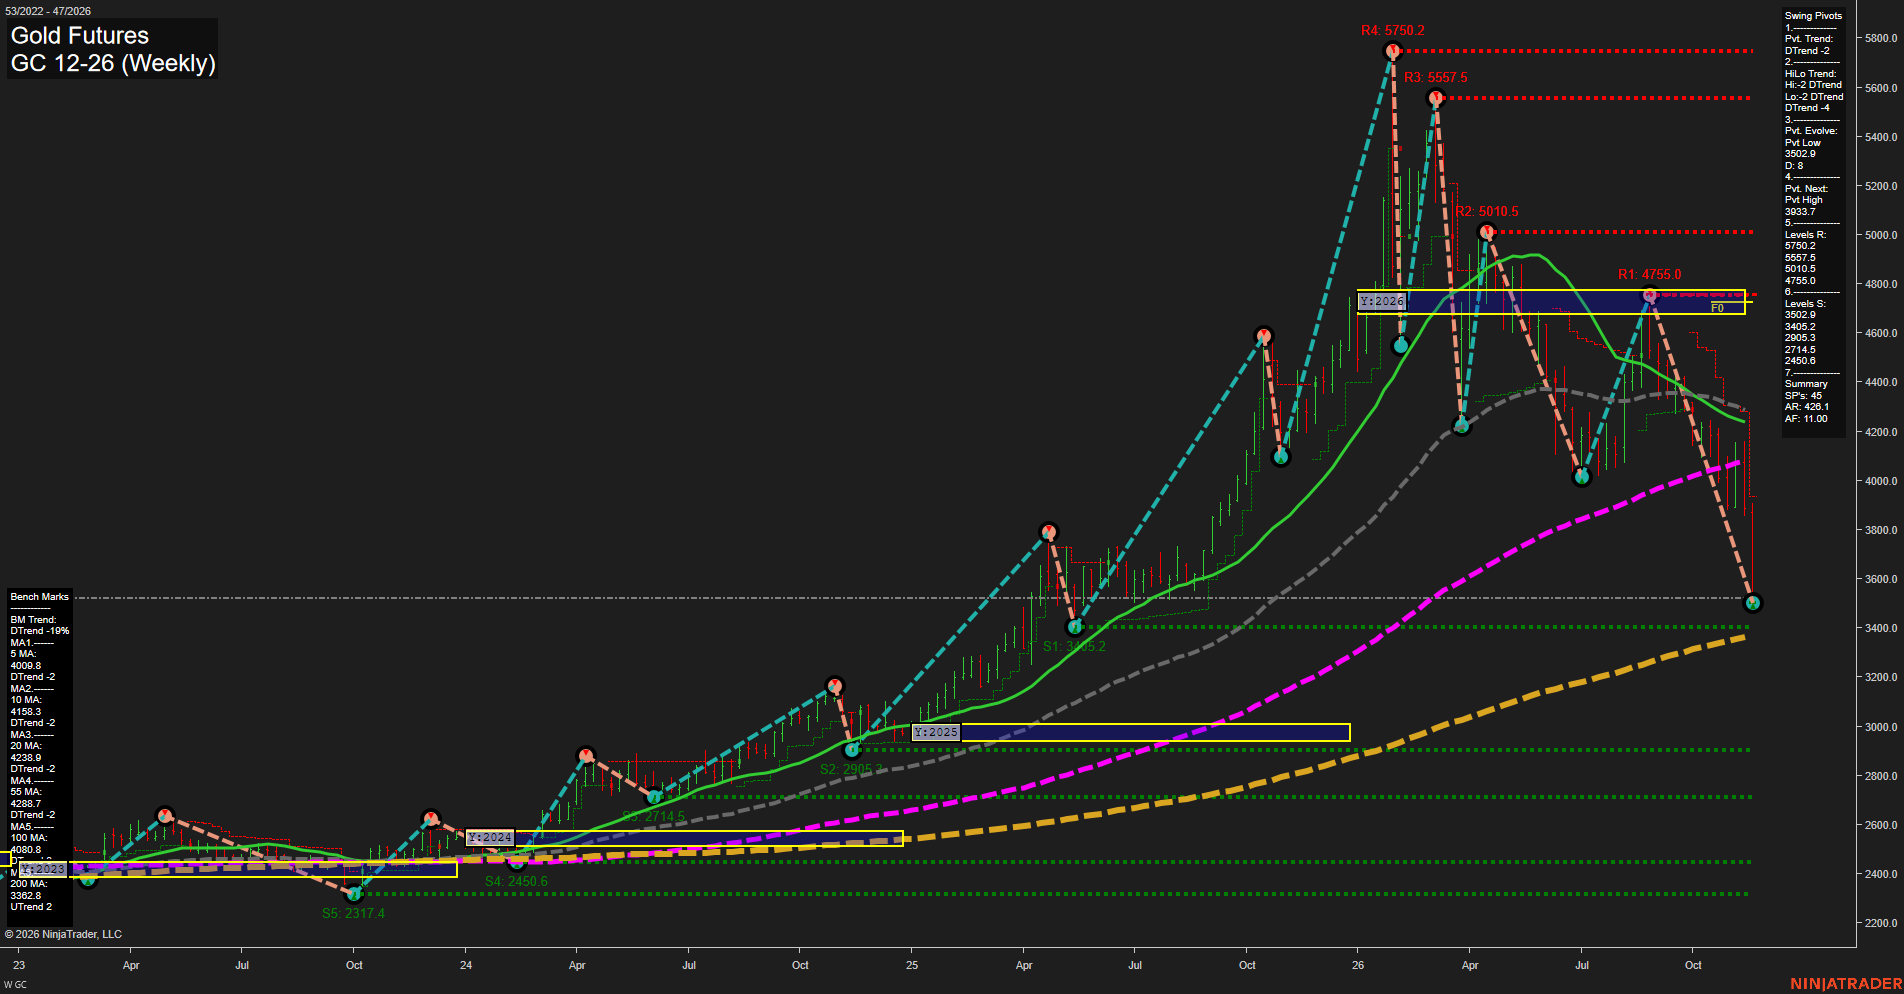
Overall Rating
- Near-Term: Bearish
- Medium-Term: Bearish
- Far-Term: Bearish.
Key Insights Summary
From a futures swing-trading perspective, gold is in an accelerating downswing within a broader correction from the 5750.2 peak. Lower swing highs and lower lows confirm deterioration, while the latest large weekly decline extends the rejection from 4755.0 toward the evolving 3502.9 pivot low. Price is below the falling 5-, 10-, 20- and 55-week benchmarks and below the rising 100-week average, confirming that selling extends beyond a routine near-term pullback. Support is concentrated at 3502.9 and 3405.2, followed by the rising 200-week benchmark at 3362.8. The 3933.7 opposite-pivot threshold is the nearest structural reference for a potential recovery, rather than a confirmed reversal. Downward session-grid readings and the supplied short signals reinforce bearish alignment across horizons, although rising 100- and 200-week averages show residual strength in the longer-term trend. News catalysts and seasonal effects cannot be established from this chart alone.
View charts on: AlphaWebTrader HTF Charts
TLT Weekly View
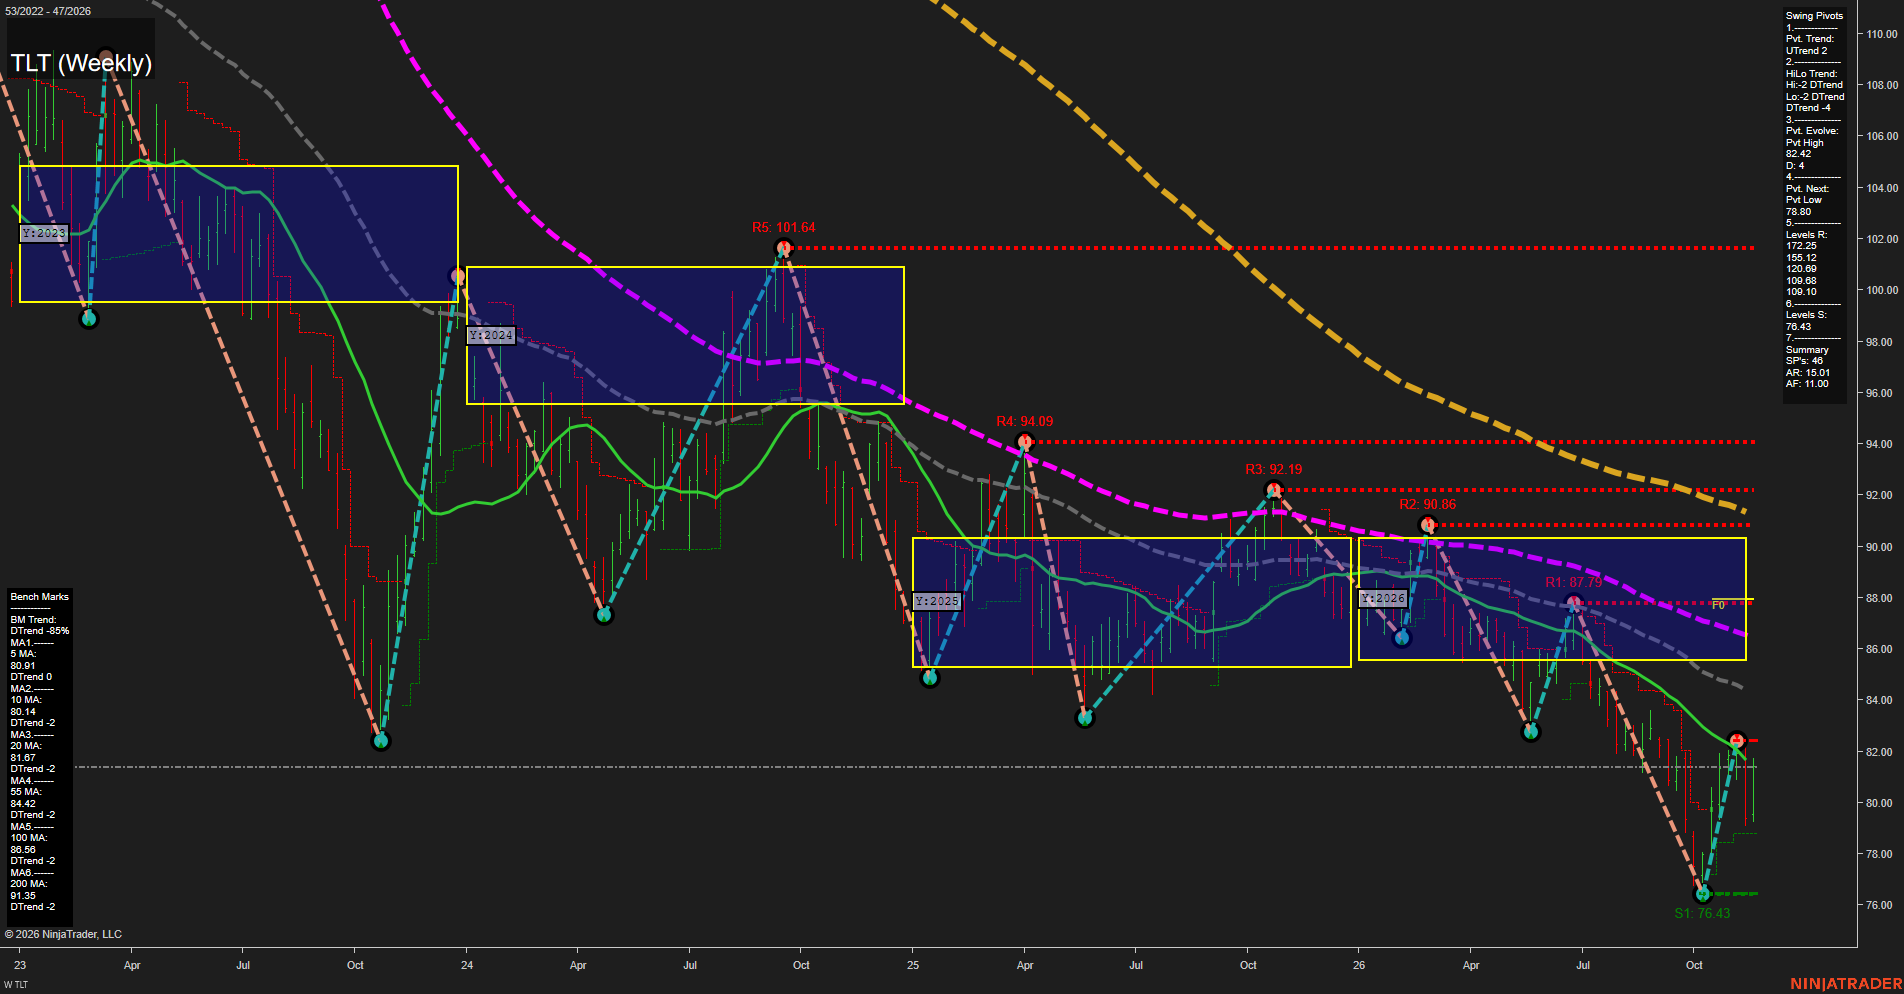
Overall Rating
- Near-Term: Neutral
- Medium-Term: Bearish
- Far-Term: Bearish.
Key Insights Summary
From a futures swing trader’s perspective, TLT shows a countertrend Treasury-duration rebound within a broader downtrend, rather than a confirmed trend reversal. Price has recovered from 76.43 and stands above the 5- and 10-week benchmarks, but remains below the declining 20-week benchmark at 81.67. The evolving 82.42 pivot high defines the immediate rebound extreme; 78.80 is the summary’s next downside pivot-reversal threshold. The medium-term lower-high/lower-low structure remains bearish, reinforced by price trading below the 55-, 100-, and 200-week benchmarks. The 5-week benchmark’s displayed trend score is zero, indicating flattening despite its DTrend label. Resistance values listed above reproduce the summary, although they differ from the visible chart annotations at 101.64, 94.09, 92.19, 90.86, and 87.79. Weekly and monthly grids and the requested recent signal studies are not visible, so their direction cannot be independently confirmed; the neutral grid entries are placeholders. The visible yearly grid places price below its approximately 85.6–90.3 neutral zone and its approximately 87.8 centerline, supporting a bearish far-term interpretation. TLT provides a duration-market proxy, not a Treasury futures price chart; no news or seasonal catalyst is established by this image.
View charts on: AlphaWebTrader HTF Charts
ZB Weekly View
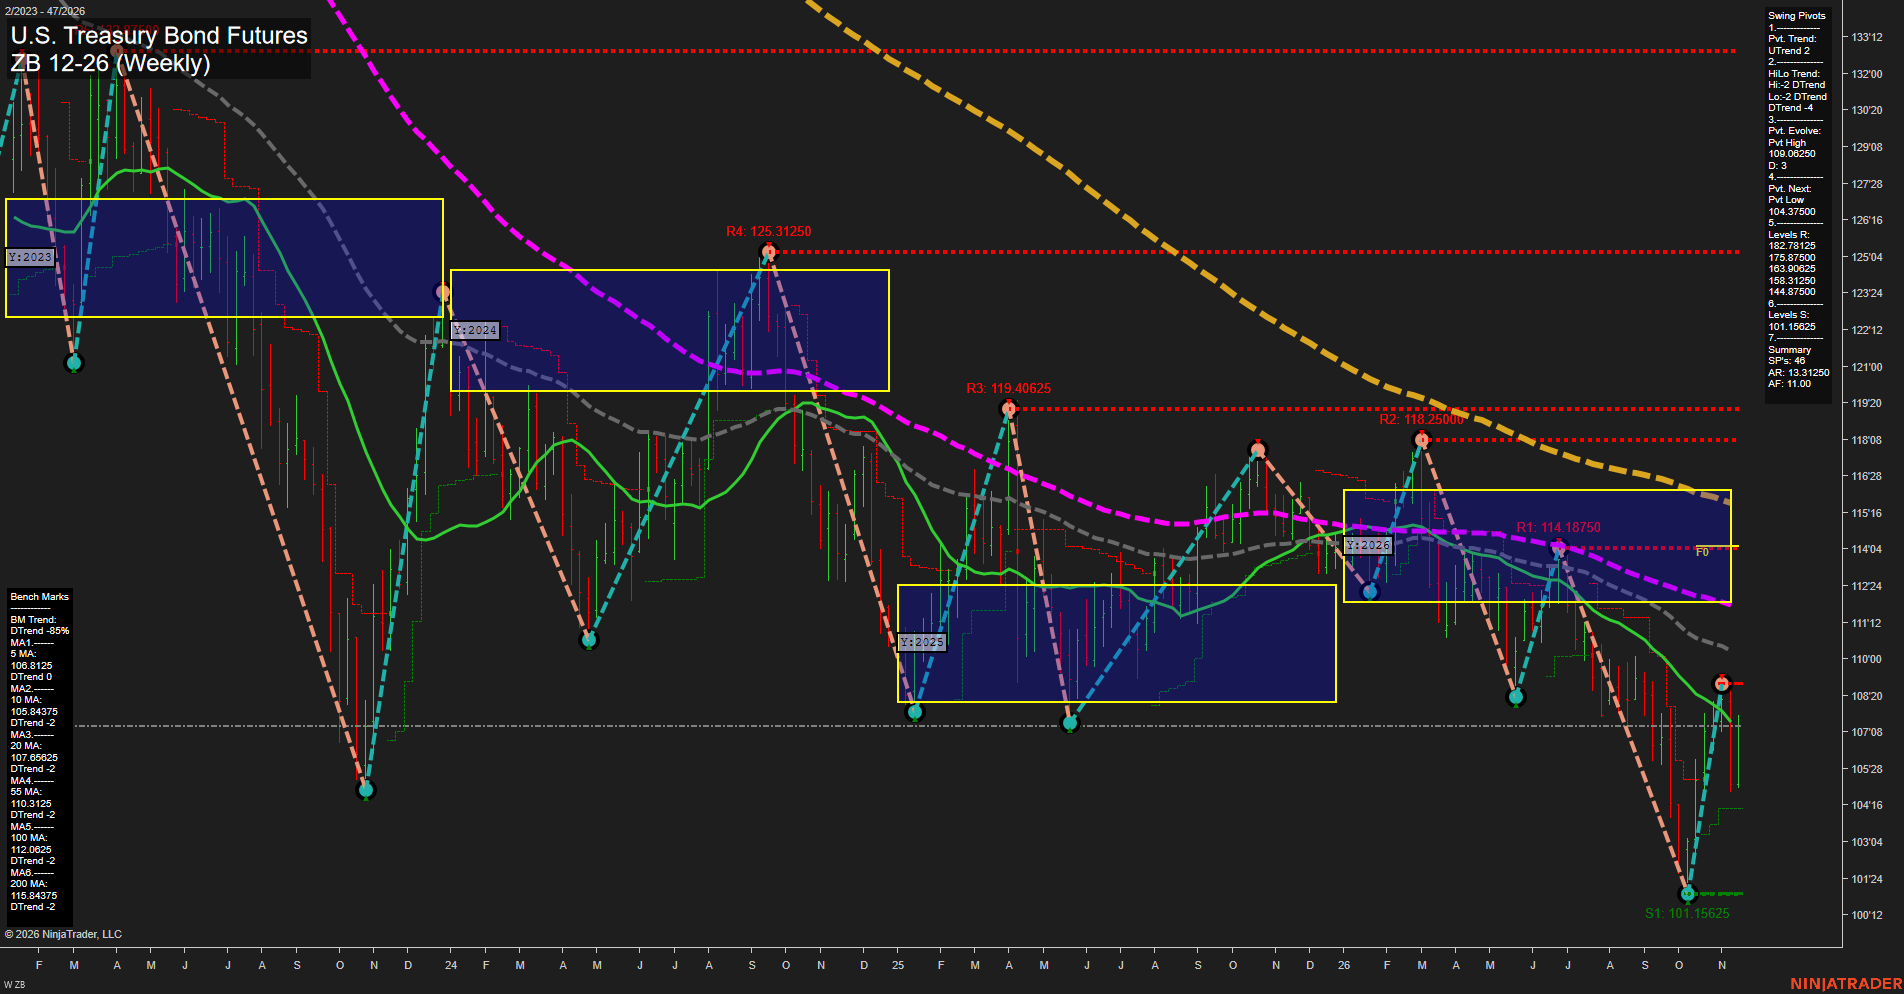
Overall Rating
- Near-Term: Bullish
- Medium-Term: Bearish
- Far-Term: Bearish.
Key Insights Summary
The swing-trading picture is a near-term recovery within a broader downtrend. The rebound from 101.15625 has produced an evolving pivot high at 109.06250, while price is above the 5- and 10-week benchmarks but approximately at, and slightly below, the declining 20-week benchmark. Weekly grid strength and the upward pivot trend support the near-term bullish classification, although all six benchmark trends remain down. The medium-term pivot structure and monthly and yearly grid readings remain bearish. Visible overhead pivot resistance is 114.18750, 118.25000, 119.40625 and 125.31250; these plotted levels differ from the distant resistance values reported in the Swing Pivots summary. The 104.37500 reading is the next-pivot reversal threshold, rather than an established support pivot. Overall, the evidence describes a countertrend rebound, not a confirmed broader trend reversal. The named recent trade signals are not visible, and the chart does not establish news or seasonal drivers.
View charts on: AlphaWebTrader HTF Charts
Index ETFs
Negative confluence: average WOC% -7.78% from the week open and WNC% -8.33% versus the prior weekly close. All five index ETFs declined on both comparisons; IJH was most resilient and QQQ weakest on each, with IWM also outperforming SPY and DIA. All closed below weekly VWAP on above-average volume, while most retained rising longer-term moving-average structures.