Trading 360° view: Market SPY Weekly view, holidays, earnings, eco-news, market-news summary, news sentiment, and major ETFs, MAG7, Higher Time Frame Analysis Indices Futures Summary, and QQQ Weekly view.
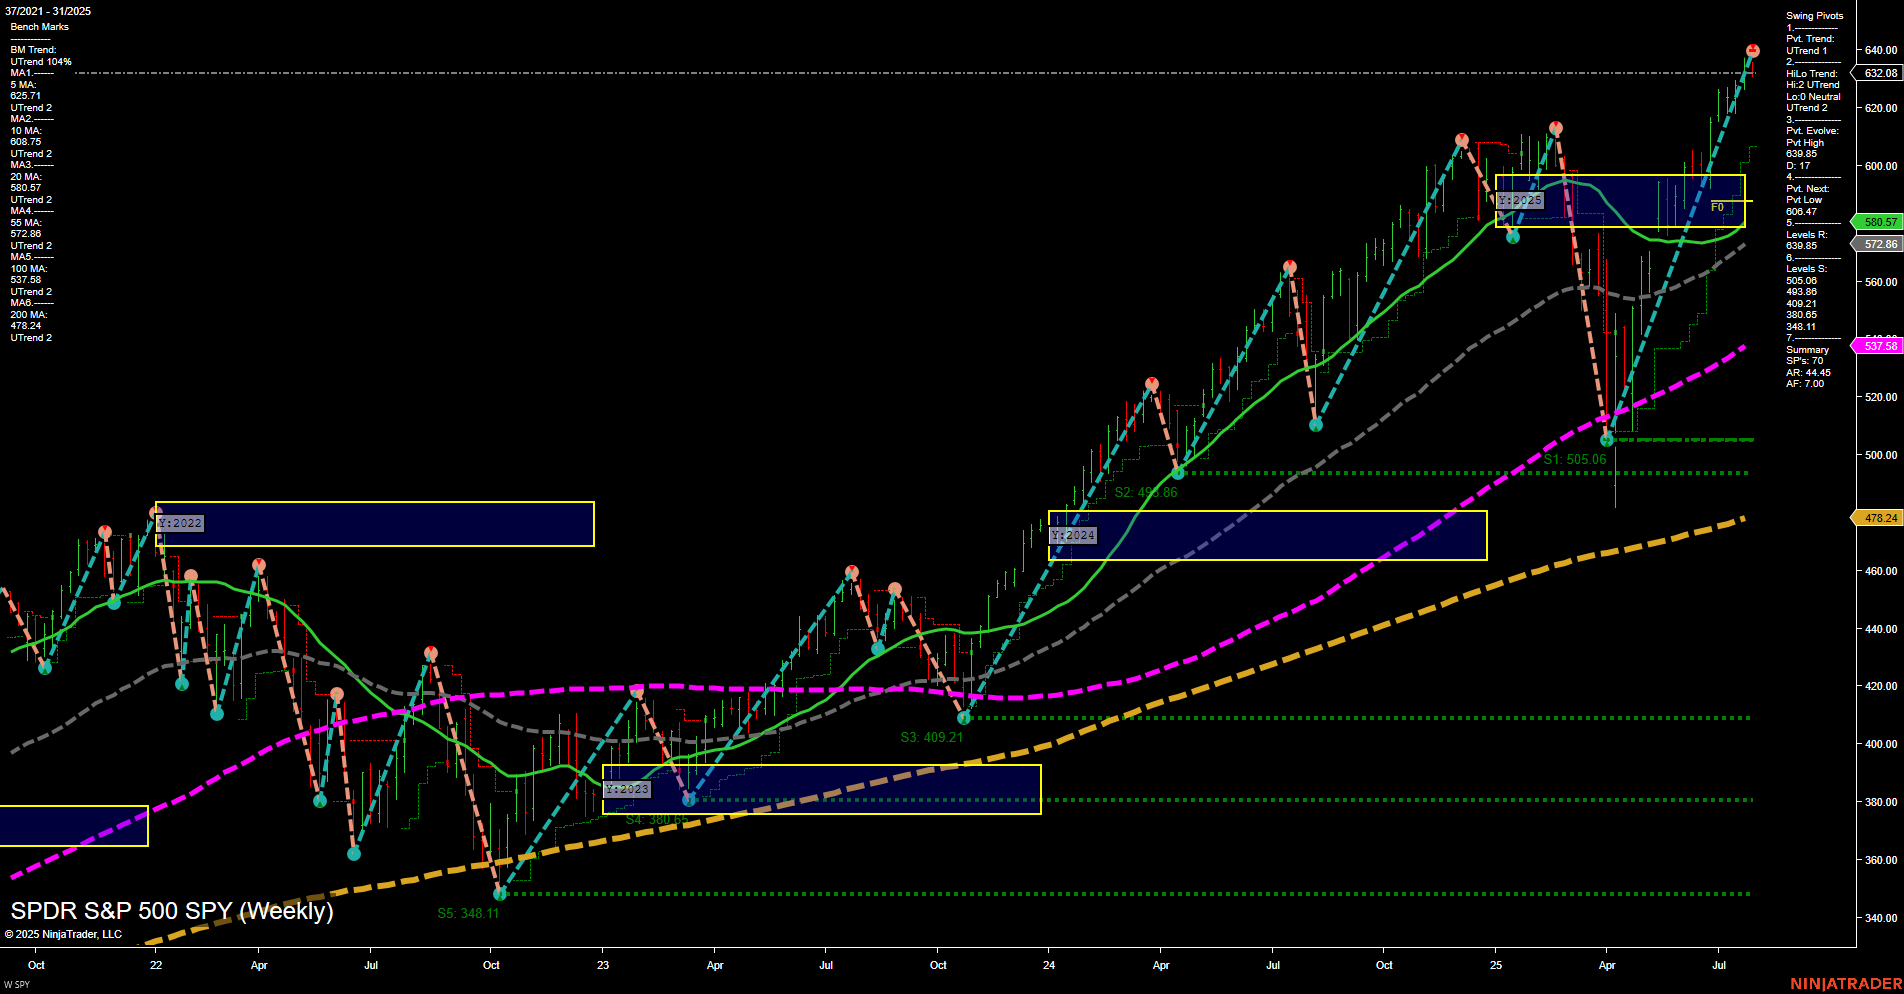
SPY Weekly View

View weekly charts on: AlphaWebTrader HTF Charts
Holiday Radar
No U.S. market holidays pending in the next 7 days.
Earnings Radar
Monitoring for earnings releases by the Magnificent 7, AI-tech-related firms, and major financial institutions.
- MCHP Release: 2025-08-07 T:AMC
- AMD Release: 2025-08-05 T:AMC
- SMCI Release: 2025-08-05 T:AMC
Earnings Summary and Market Conclusion:
Looking ahead to the first week of August 2025, key earnings releases from AMD (August 5, after market close), SMCI (August 5, after market close), and MCHP (August 7, after market close) are set to draw significant attention from index futures traders. These companies are critical components of the AI and semiconductor sectors, which have been major drivers of recent index performance. In the days leading up to these reports, market momentum and trading volumes may decelerate as participants await clarity on sector earnings and guidance, especially with anticipation building for subsequent releases from NVDA and other MAG7 tech giants. This period is typically characterized by cautious positioning and potential range-bound action, as traders digest prior results and prepare for possible volatility spikes tied to the upcoming tech and AI-related earnings news.
For full details visit: Yahoo Earnings Calendar
EcoNews Radar U.S. Events
EcoNews Summary
- 08:30 – USD Average Hourly Earnings m/m (High Impact): Wage growth data will provide insight into inflationary pressures. Stronger-than-expected numbers could raise expectations for tighter Fed policy, potentially pressuring equity indices.
- 08:30 – USD Non-Farm Employment Change (High Impact): The headline jobs report is a key market mover. Significant deviations from forecasts can trigger sharp index futures volatility due to implications for economic growth and Fed policy direction.
- 08:30 – USD Unemployment Rate (High Impact): A lower unemployment rate may reinforce a strong labor market narrative, while an uptick could stoke growth concerns, impacting market sentiment and index futures direction.
- 10:00 – USD ISM Manufacturing PMI (High Impact): This forward-looking gauge of manufacturing health can influence expectations for economic momentum. A strong print may boost risk appetite, while a miss could weigh on indices.
EcoNews Conclusion
- The 08:30 NFP jobs data cluster is the primary catalyst for pre-market volatility and directional moves in index futures.
- News events around the 10 AM time cycle, such as the ISM Manufacturing PMI, often act as a catalyst for reversals or continuations in market momentum.
For full details visit: Forex Factory EcoNews
Market News Summary
- Tariffs and Economic Concerns: Multiple headlines detail President Trump’s escalation of tariffs on dozens of countries, including a 40% rate on transshipped goods and a 35% rate for Canada. These sweeping measures, set to start August 7, are cited as weighing on global equities and fueling economic uncertainty.
- Stock Market Reaction: The S&P 500 declined for a third consecutive session despite strong earnings from Meta and Microsoft. Futures pointed to a lower open as traders processed the tariff news, earnings, and upcoming U.S. jobs data. However, big tech rallies helped keep stocks near record highs during parts of the session.
- Federal Reserve Developments: The Fed’s decision to hold rates steady featured a rare double dissent, raising questions about future policy moves and contributing to market volatility.
- Commodities: Gold broke below key technical support, with further downside risk highlighted by a strong U.S. dollar and hawkish Fed. Oil prices steadied after recent declines, with traders weighing tariff impacts against ongoing supply threats. Exxon reported earnings that beat estimates, while Chevron’s profits were hit by lower oil prices and acquisition losses.
- International Markets: The Hang Seng Index slipped on weak China PMI and strong U.S. inflation data, with stimulus hopes now in focus. The DAX faces a bearish outlook amid hot inflation and doubts over Fed rate cuts.
- Other Notable Headlines: ETF flows, moving average updates for the Ivy Portfolio and S&P 500, and commentary on the similarities between the current environment and the lead-up to the 1987 crash were also reported.
News Conclusion
- Markets are contending with significant headwinds from new U.S. tariffs, which are adding to economic and policy uncertainty. Despite strong earnings in some sectors, major indices have shown weakness, and futures suggest cautious sentiment ahead of key employment data.
- Commodities are mixed: gold faces technical and macroeconomic pressure, while oil’s outlook remains supported by supply-side risks even as demand concerns persist.
- Central bank policy and inflation remain central to market direction, with international indices also reflecting these global macroeconomic themes.
Market News Sentiment:
Market News Articles: 46
- Negative: 39.13%
- Neutral: 34.78%
- Positive: 26.09%
GLD,Gold Articles: 12
- Negative: 41.67%
- Neutral: 41.67%
- Positive: 16.67%
USO,Oil Articles: 9
- Negative: 44.44%
- Positive: 33.33%
- Neutral: 22.22%
Market Data Snapshot
ETF Snapshot of major stock market ETFs, Mag7, and others as of: August 1, 2025 07:02
- META 773.44 Bullish 11.25%
- MSFT 533.50 Bullish 3.95%
- AMZN 234.11 Bullish 1.70%
- GLD 302.96 Bullish 0.66%
- TLT 86.92 Bullish 0.06%
- IBIT 66.32 Bearish -0.08%
- SPY 632.08 Bearish -0.38%
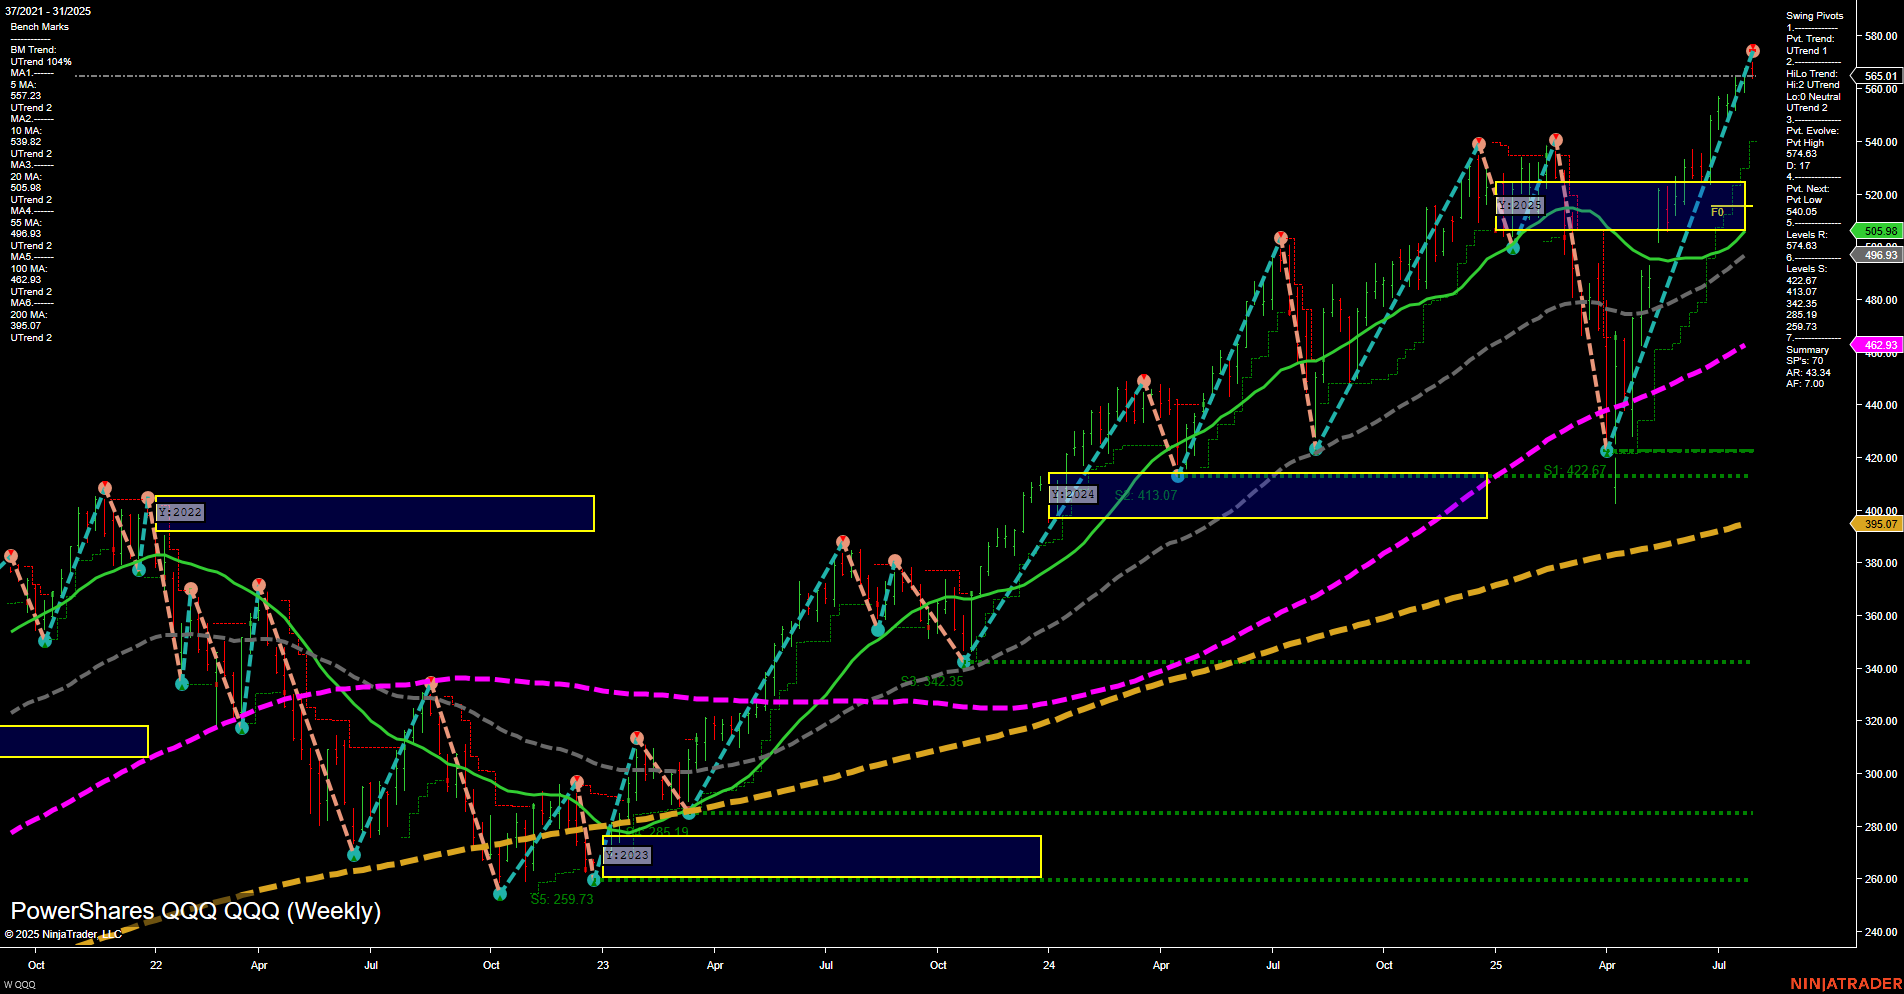
- QQQ 565.01 Bearish -0.53%
- AAPL 207.57 Bearish -0.71%
- DIA 441.33 Bearish -0.77%
- NVDA 177.87 Bearish -0.78%
- IWM 219.39 Bearish -0.98%
- IJH 63.03 Bearish -1.13%
- USO 79.59 Bearish -1.79%
- GOOG 192.86 Bearish -2.32%
- TSLA 308.27 Bearish -3.38%
Higher Time Frame Analysis
Summary of the current state of US Indices Futures based on higher time-frame (HTF) technical analysis as of: 2025-08-01: 07:02 CT.
US Indices Futures
- ES Neutral short-term WSFG down, MSFG and YSFG bullish, price near highs, higher highs/lows, support well below, primary trend up, resistance at swing highs.
- NQ Neutral short-term WSFG down, MSFG and YSFG bullish, large bars, swing pivots up, all benchmarks rising, resistance overhead, support well below current price.
- YM Bearish short-term WSFG/MSFG down, HiLo and YSFG up, structure bullish long-term, support below, resistance near highs, corrective pullback underway.
- EMD Neutral short-term, MSFG bearish, YSFG neutral, price below key grids, mixed pivots, all major MAs up, consolidation within defined range, support at 3071.6, resistance at 3235.6.
- RTY Bearish short-term, MSFG neutral, YSFG bearish, WSFG and swing pivots down, price below grids, resistance at 2249.6/2537.1, support at 2085.5/1725.3, corrective phase.
- FDAX Neutral WSFG/MSFG, bullish YSFG, all major MAs up, price above long-term support, swing high 24478, support at 23128, near-term consolidation after recent rally.
Overall State
- Short-Term: Mixed to Bearish
- Intermediate-Term: Neutral to Bullish
- Long-Term: Bullish (except EMD, RTY bear-neutral lagging)
Conclusion
US Indices Futures broadly maintain intermediate and long-term bullish structure as reflected by MSFG/YSFG and rising major benchmarks, while short-term WSFG trends for ES, NQ, YM, RTY, and EMD are showing signs of pullback or consolidation below key session grids. Recent large range bars, mixed pivot signals, and elevated volatility indicate short-term corrective or consolidative phases within larger uptrends for ES, NQ, FDAX, and YM. RTY and EMD lag with relative long-term and short-term weakness, remaining below yearly session levels and key long-duration averages. FDAX retains bullish long-term structure but is in near-term pullback. Current context signals a phase of broader trend digestion with ongoing support well below spot, and resistance at or near swing highs, and directional correlations reflecting potential for further consolidation, rotation, or support tests before any major trend shifts.
Note: Intra-day counter-trend pullbacks or retracements may occur, HTF is context for informational usage and market structure. Glossary: Session Fib Grids periods of YSFG:’Yearly’, MSFG:’Monthly’, WSFG:’Weekly’
For full details visit: AlphaWebTrader Technicals
Tech Weekly View

View weekly charts on: AlphaWebTrader HTF Charts