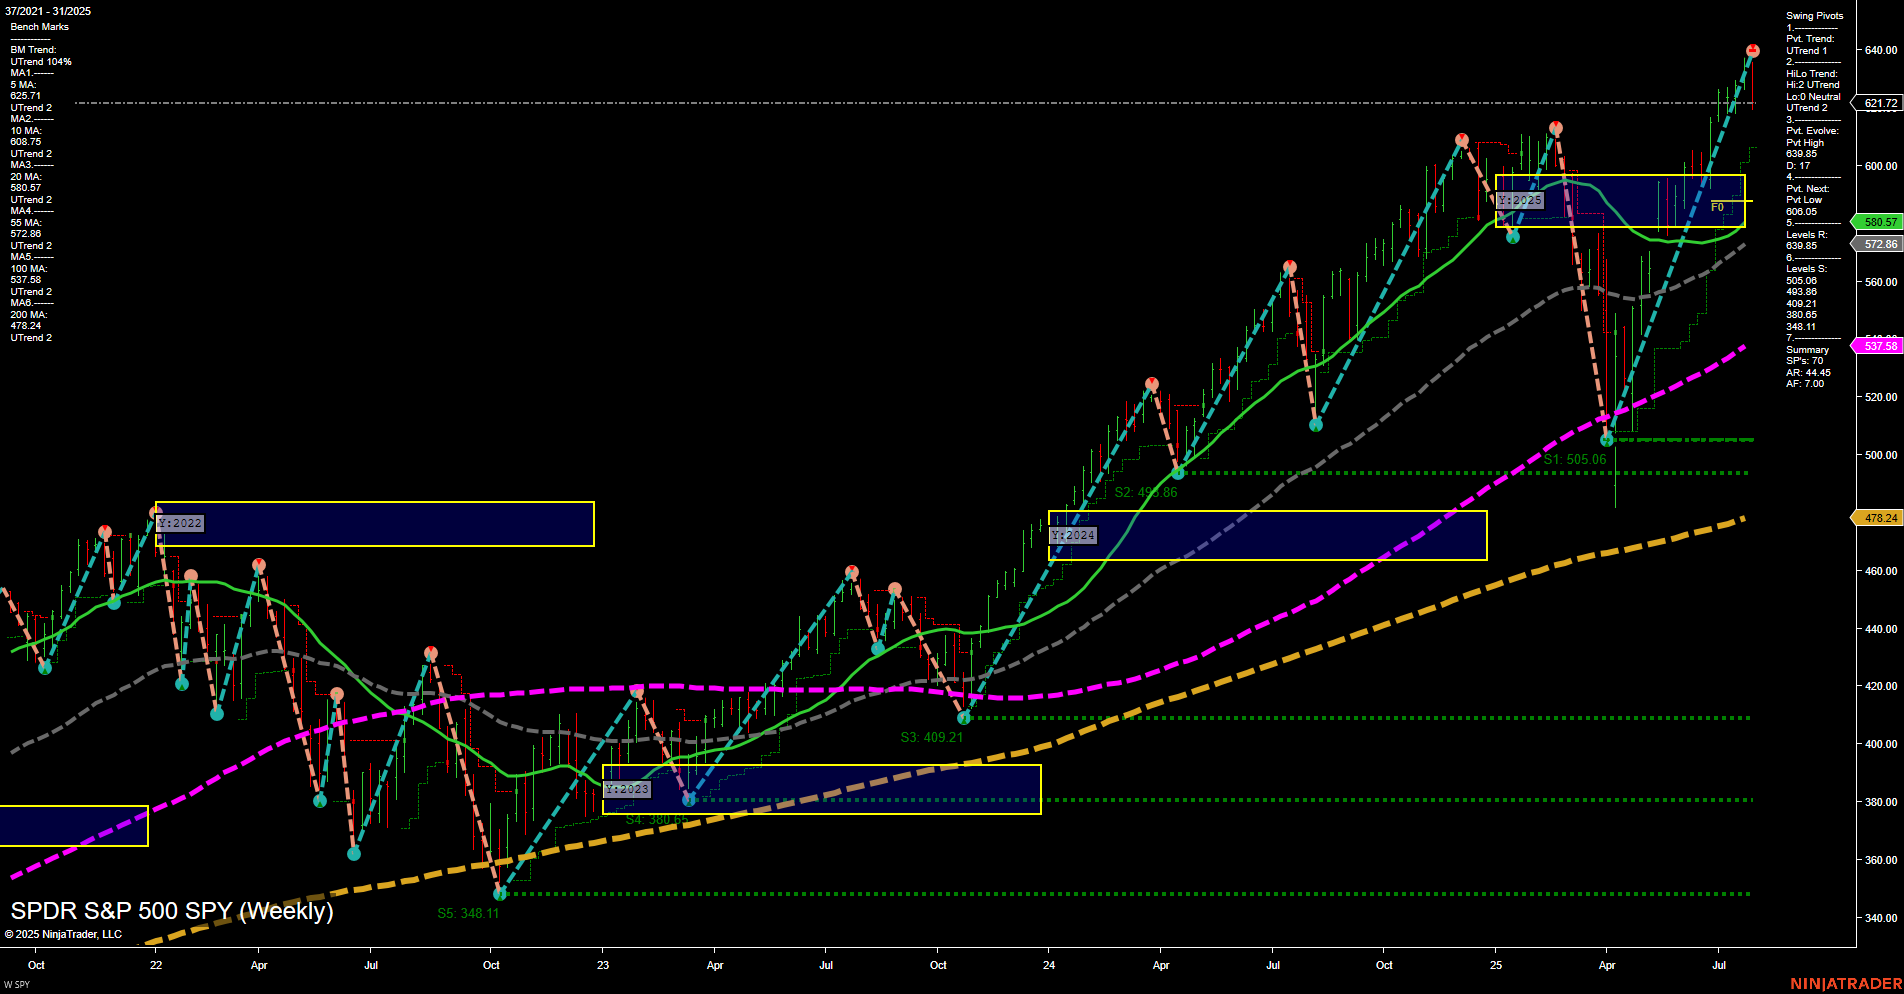
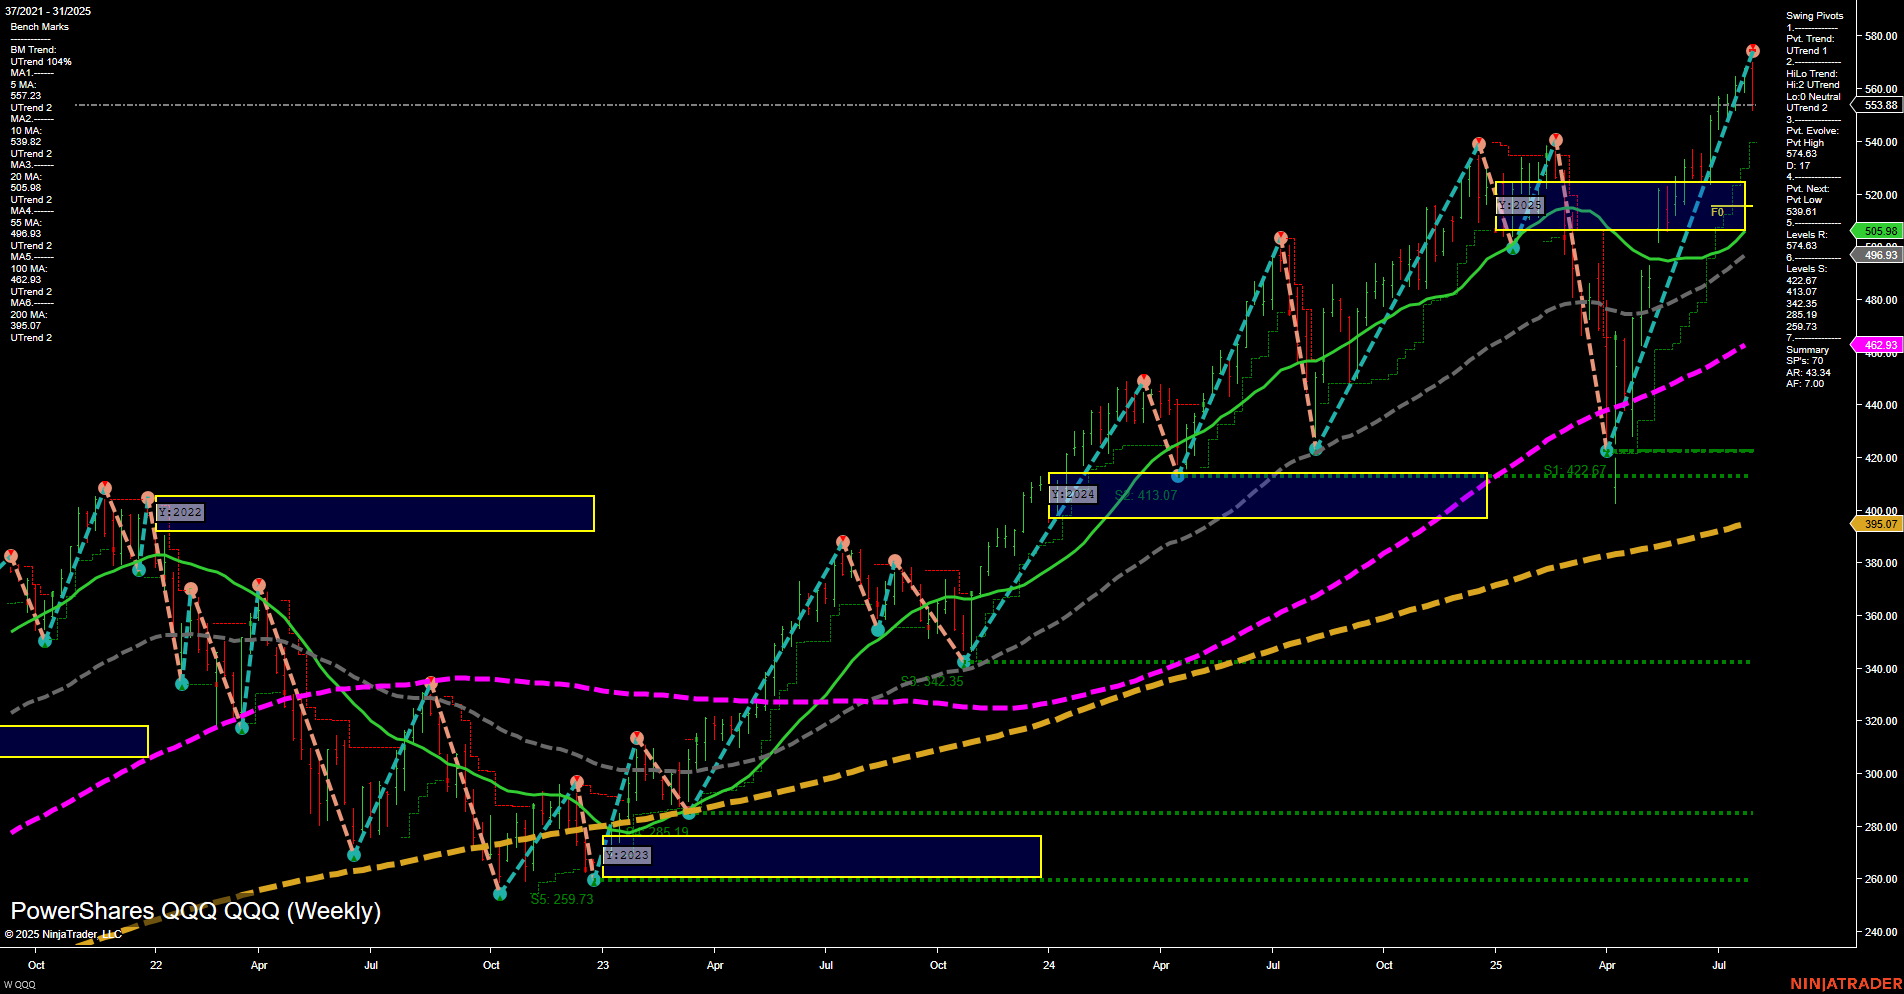
Trading 360° view: Market SPY Weekly view, holidays, earnings, eco-news, market-news summary, news sentiment, and major ETFs, MAG7, Higher Time Frame Analysis Indices Futures Summary, and QQQ Weekly view.
SPY Weekly View

View weekly charts on: AlphaWebTrader HTF Charts
Holiday Radar
No U.S. market holidays pending in the next 7 days.
Earnings Radar
Monitoring for earnings releases by the Magnificent 7, AI-tech-related firms, and major financial institutions.
- MCHP Release: 2025-08-07 T:AMC
- AMD Release: 2025-08-05 T:AMC
- SMCI Release: 2025-08-05 T:AMC
Looking ahead to the next round of earnings, indices futures traders should note that AMD and SMCI both report after market close on August 5th, followed by MCHP on August 7th. These releases are clustered within the high-impact semiconductor and AI hardware sector and could drive significant after-hours and next-day volatility, especially given the sector’s outsized influence on major indices. However, in the days leading up to these reports, traders may observe reduced momentum and lighter volume as participants await clarity from these key results, especially with broader market attention focused on the upcoming NVDA and MAG7 earnings. This typical pre-earnings “wait-and-see” dynamic often leads to tighter ranges and muted index moves until the earnings data is released and digested.
For full details visit: Yahoo Earnings Calendar
EcoNews Radar U.S. Events
EcoNews Summary
- Tuesday 10:00 – USD ISM Services PMI (High Impact): The ISM Services PMI is a significant gauge of US economic health, particularly in the services sector. A strong or weak reading can quickly shift sentiment in major indices, often resulting in sharp intraday moves around the 10:00 AM time cycle, as traders react to signals about growth and inflation.
- Wednesday 10:30 – USD Crude Oil Inventories (Low Impact): The weekly Crude Oil Inventories report can influence energy sector stocks and broader indices, especially if there are unexpected changes in supply. Any notable inventory drawdowns or builds may affect oil prices, with potential ripple effects on inflation expectations and market sentiment.
- Thursday 08:30 – USD Unemployment Claims (High Impact): Weekly jobless claims serve as a real-time indicator of labor market conditions. Surprises in this data can drive pre-market volatility and set the tone for the trading day, impacting index futures as traders reassess the outlook for economic growth and Fed policy.
EcoNews Conclusion
- High-impact data releases on Tuesday and Thursday are likely to drive sharp directional moves and increased volatility in index futures during and shortly after their release times.
- Wednesday’s oil inventory data may influence market sentiment if there are outsized surprises, especially if oil prices react strongly due to inflation or geopolitical concerns.
- News events clustered around the 10:00 AM time cycle (notably ISM Services PMI) often act as catalysts for intraday reversals or continuations in market momentum.
For full details visit: Forex Factory EcoNews
Market News Summary
- OPEC+ Oil Output Increase: OPEC+ agreed to raise oil output by 548,000 barrels per day in September. This decision comes as traders monitor the impact of Russian sanctions and potential supply increases. Oil prices slipped in early Asian trading following the news.
- U.S. Labor Market and BLS Developments: U.S. equity markets fell sharply after revised employment data revealed weaker job growth than previously reported, prompting concerns about the Federal Reserve’s stance on interest rates. The firing of the Bureau of Labor Statistics (BLS) commissioner by President Trump has raised questions about the reliability and independence of economic data, with political fallout and calls for investigation.
- Federal Reserve Policy Outlook: Despite a poor July jobs report, top Fed officials described the labor market as “solid” and signaled no urgency to cut rates. Debate continues over Fed policy and the validity of traditional economic models.
- Stock Market Performance: The S&P 500 reached a new all-time high in July, up roughly 25% from April lows, though some commentary warns of potential corrections and fading price action. The Nasdaq and S&P remain close to record highs, with strong Big Tech earnings supporting sentiment.
- Futures and Tariffs: U.S. stock futures dipped following last week’s decline, with little change at the start of the new month. The White House confirmed that new tariff deadlines are firm and set to take effect soon.
- Gold Market: Gold prices rebounded as weak jobs data revived expectations for rate cuts. Traders are watching the upcoming CPI report for further direction.
- Consumer Spending: Consumers are cutting back on discretionary purchases, focusing on essentials amid inflation concerns and personal financial pressures.
- Nasdaq-100 Investment Sentiment: Positive sentiment persists regarding investment in the Nasdaq-100, reflecting ongoing confidence in top growth stocks.
News Conclusion
- The week saw significant developments in oil markets, with OPEC+ output hikes pressuring prices downward and uncertainty lingering over Russian sanctions.
- U.S. equities and futures experienced volatility amid disappointing labor data and political controversy surrounding the BLS, raising concerns about data integrity and future Fed policy moves.
- Despite recent highs in major indices, underlying caution is evident due to macroeconomic risks, political developments, and shifting consumer behavior.
- Gold and other safe-haven assets gained on renewed rate cut hopes, while the investment case for growth stocks, particularly in the Nasdaq-100, remains a focal point.
Market News Sentiment:
Market News Articles: 14
- Negative: 50.00%
- Neutral: 35.71%
- Positive: 14.29%
GLD,Gold Articles: 1
- Positive: 100.00%
USO,Oil Articles: 5
- Negative: 60.00%
- Neutral: 20.00%
- Positive: 20.00%
Market Data Snapshot
ETF Snapshot of major stock market ETFs, Mag7, and others as of: August 3, 2025 10:14
- GLD 309.11 Bullish 2.03%
- TLT 87.82 Bullish 1.04%
- DIA 435.72 Bearish -1.27%
- IJH 62.09 Bearish -1.49%
- GOOG 189.95 Bearish -1.51%
- SPY 621.72 Bearish -1.64%
- MSFT 524.11 Bearish -1.76%
- TSLA 302.63 Bearish -1.83%
- QQQ 553.88 Bearish -1.97%
- IWM 214.92 Bearish -2.04%
- NVDA 173.72 Bearish -2.33%
- AAPL 202.38 Bearish -2.50%
- USO 77.46 Bearish -2.68%
- META 750.01 Bearish -3.03%
- IBIT 64.22 Bearish -3.17%
- AMZN 214.75 Bearish -8.27%
Higher Time Frame Analysis
Summary of the current state of US Indices Futures based on higher time-frame (HTF) technical analysis as of: 2025-08-03: 22:15 CT.
US Indices Futures
- ES WSFG up, MSFG down, YSFG up, benchmarks up, swing pivot DTrend, resistance: 6341/6457, support: 6178, corrective within LT uptrend
- NQ WSFG up, MSFG down, YSFG up, benchmarks up, swing pivot mixed, resistance: 23243/23845, support: 22710, corrective pullback within HTF bullish trend
- YM WSFG down, MSFG down, YSFG up, benchmarks up, swing pivot down, resistance: 46300–46312, support: 42704/41549, testing range support in broader uptrend
- EMD WSFG down, MSFG down, YSFG down, all benchmarks down, swing pivot down, resistance: 3236.9, support: 2900/2722.1/2503.7, sustained downtrend phase
- RTY WSFG down, MSFG down, YSFG down, benchmarks down, swing pivot down, resistance: 2182.3/2257.1, support: 2106/1725.3, corrective structure with continued selling
- FDAX WSFG down, MSFG down, YSFG up, benchmarks mixed, swing pivot down, resistance: 24478/24122, support: 19131/17968, corrective pullback within long-term uptrend
Overall State
- Short-Term: Bearish to Neutral across most indices
- Intermediate-Term: Predominantly Bearish or Neutral
- Long-Term: Bullish for ES, NQ, YM, FDAX; Bearish for EMD, RTY
Conclusion
US Indices Futures exhibit increased volatility and divergent HTF signals. Most indices (ES, NQ, YM, FDAX) remain in corrective or consolidation phases within long-term uptrends, as confirmed by YSFG/benchmarks ascending and price above key yearly levels. Intermediate and short-term trends are bearish or neutral, with MSFG/WSFG showing pullbacks, declining moving averages, and recent DTrend pivots. EMD and RTY remain structurally bearish across all timeframes, with persistent downtrends supported by YSFG, MSFG, WSFG, and swing pivots. Key support and resistance zones are defined by recent swing pivots and session fib grid levels. Overall, the market is undergoing corrections or consolidations with possible further downside or volatility until stabilization or reversal emerges on higher timeframe reference levels.
Note: Intra-day counter-trend pullbacks or retracements may occur, HTF is context for informational usage and market structure. Glossary: Session Fib Grids periods of YSFG:’Yearly’, MSFG:’Monthly’, WSFG:’Weekly’
For full details visit: AlphaWebTrader Technicals
Tech Weekly View

View weekly charts on: AlphaWebTrader HTF Charts