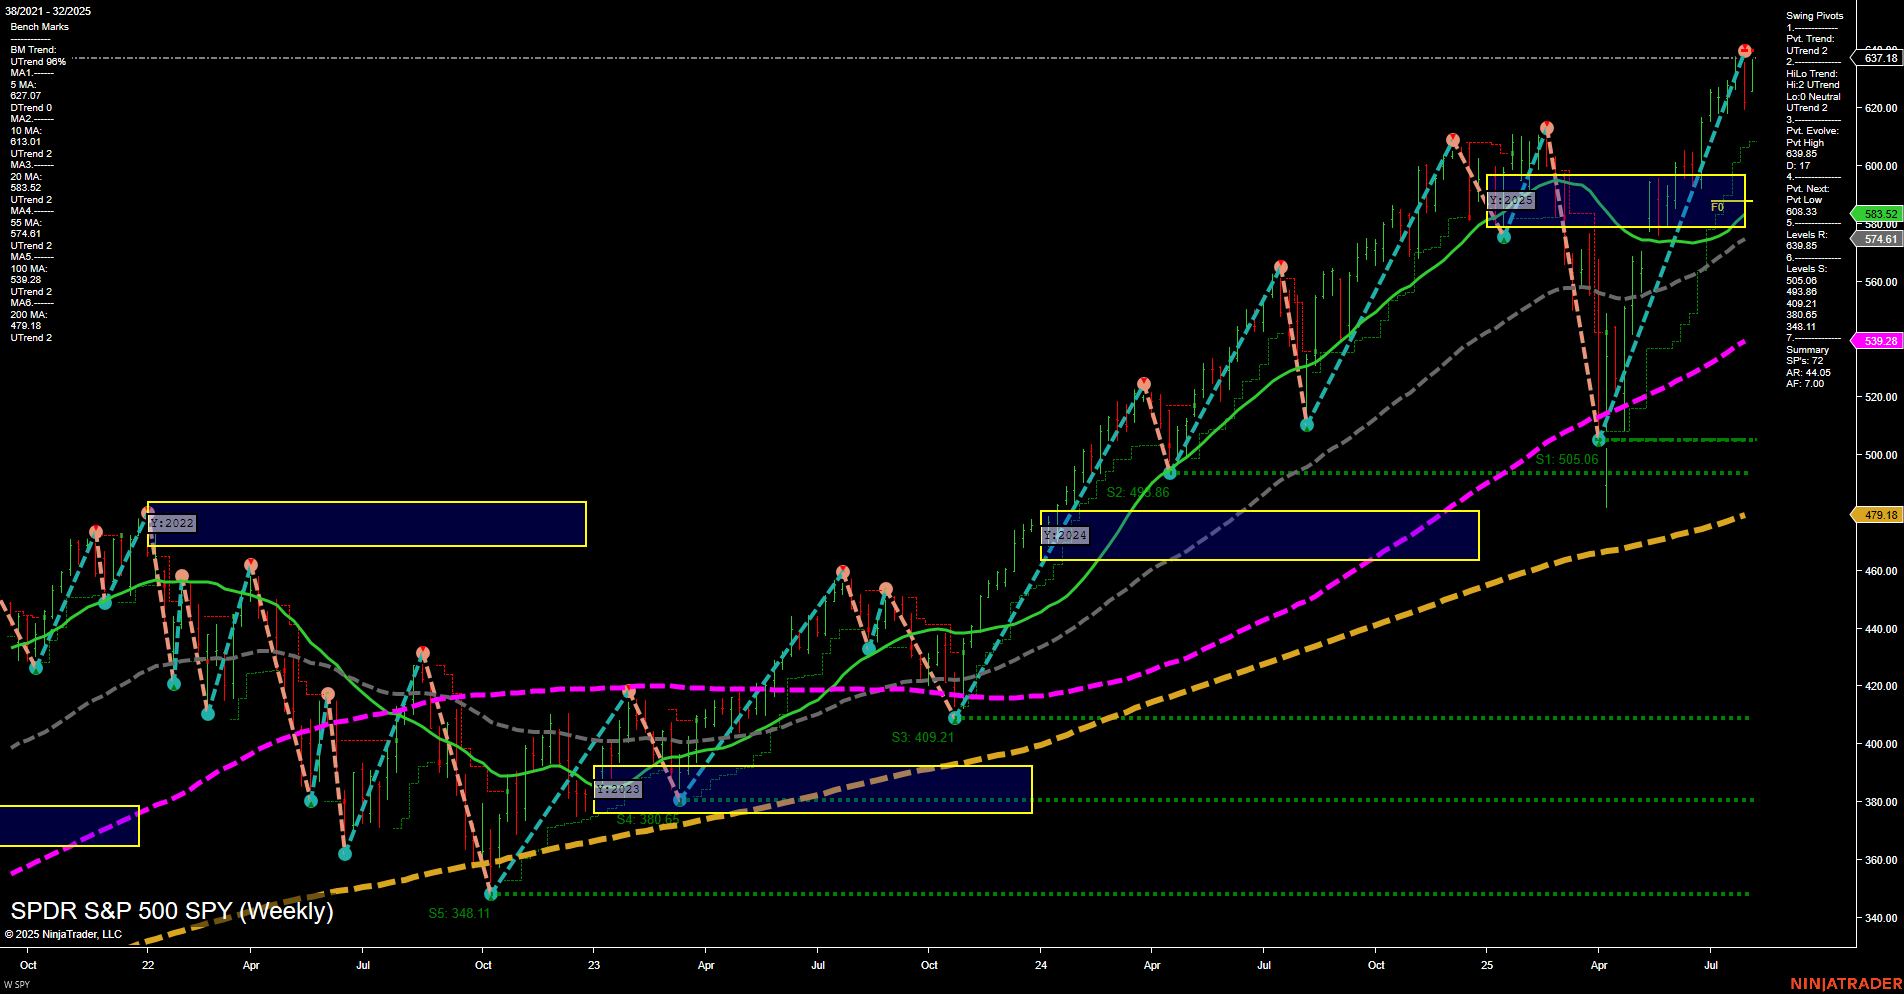
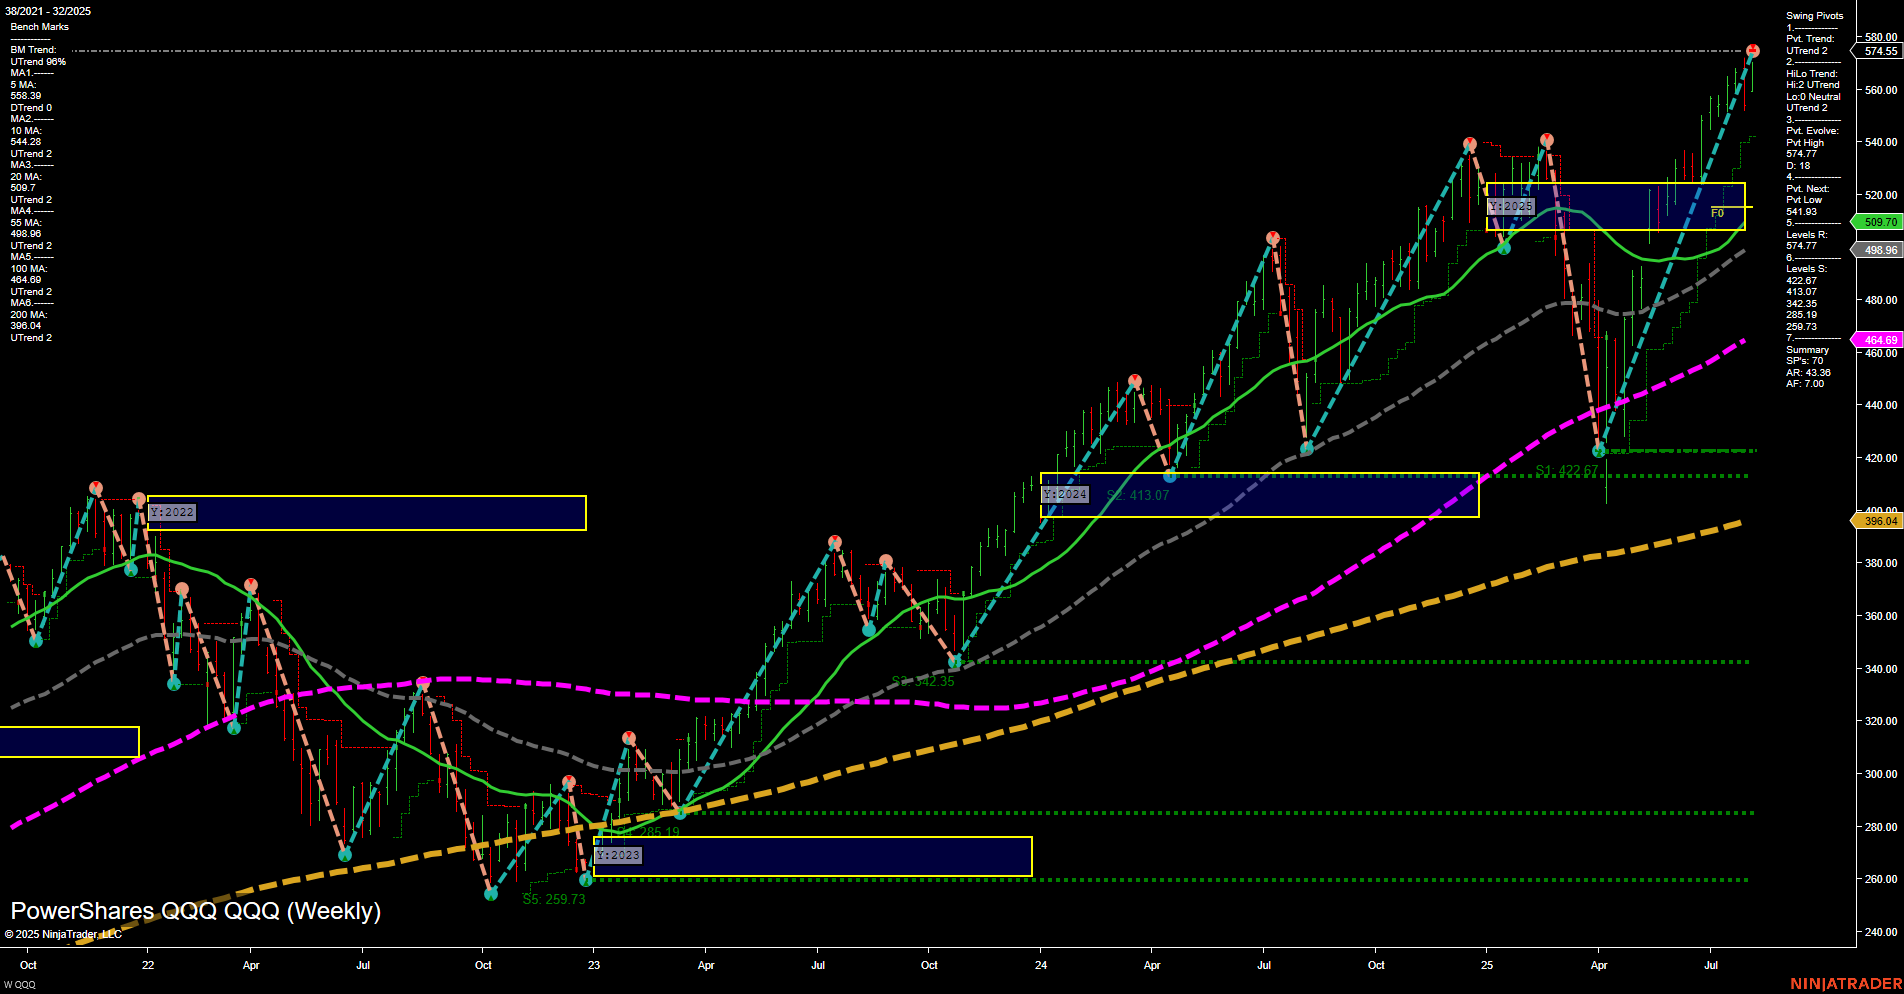
Trading 360° view: Market SPY Weekly view, holidays, earnings, eco-news, market-news summary, news sentiment, and major ETFs, MAG7, Higher Time Frame Analysis Indices Futures Summary, and QQQ Weekly view.
SPY Weekly View

View weekly charts on: AlphaWebTrader HTF Charts
Holiday Radar
No U.S. market holidays pending in the next 7 days.
Earnings Radar
Monitoring for earnings releases by the Magnificent 7, AI-tech-related firms, and major financial institutions.
No monitored earnings reports are pending in the next 7 days.
For full details visit: Yahoo Earnings Calendar
EcoNews Radar U.S. Events
EcoNews Summary
- Tuesday 08:30 – High USD Core CPI m/m, CPI m/m, CPI y/y: Back-to-back CPI releases will set the inflation narrative and are likely to cause significant volatility at the US open. Elevated CPI figures renew concerns over Fed tightening, while softer data may spark a risk-on rally across indices.
- Thursday 08:30 – High USD Core PPI m/m, PPI m/m, Unemployment Claims: Producer inflation and jobless data release simultaneously, increasing the probability of large moves and whipsaw price action at the open. Hot PPI numbers may reinforce inflation fears. Unexpected unemployment trends may further impact sentiment on growth vs. inflation.
- Friday 08:30 – High USD Core Retail Sales m/m, Retail Sales m/m: Retail data acts as a direct consumer activity gauge. Surprises can trigger fast moves in indices as traders reassess growth resilience or weakness.
- Friday 10:00 – High USD Prelim UoM Consumer Sentiment, Prelim UoM Inflation Expectations: These surveys influence intraday direction, especially when released near major option expiries or after earlier shocks. Inflation expectations are keenly watched by markets for their read-through to Fed policy.
EcoNews Conclusion
- This week brings several high-impact US inflation and consumer data releases concentrated around the 08:30 ET open, which may drive notable intraday volatility and directional moves in index futures.
- The 10:00 ET news events on Friday could serve as catalysts for sharp reversals or accelerations in prevailing market trends.
- Traders should monitor for potential slowing momentum and reduced volume in the sessions preceding these key data points, particularly Tuesday and Thursday mornings.
For full details visit: Forex Factory EcoNews
Market News Summary
- Oil Markets: WTI crude closed below its 52-week average, pressured by OPEC+ supply increases and the anticipation of outcomes from Trump–Putin discussions, which could prompt a decisive move in oil prices.
- Equity Indices: The Nasdaq 100 and QQQ ETF reached new record highs as earnings momentum continued and trade war fears eased. However, the broader tech sector has seen high volatility, with the Nasdaq Composite experiencing a sharp drop earlier in the year before the current rebound.
- Market Breadth: The rebound in equities has been led mainly by a handful of mega-cap tech names, raising concerns over narrow market leadership and the potential for corrections due to elevated valuations.
- Economic Signals: The US housing market is reversing post-pandemic gains, with home affordability near historic lows due to aggressive Fed policy since 2022. Broader economic risk is highlighted by debate over Fed strategies to contain inflation and mixed macro signals, including recent weak employment data.
- Inflation & Rate Outlook: Markets are awaiting new inflation data, with stagflation risks being closely monitored after a period of volatility. Meanwhile, investors are re-evaluating risk amid shifting inflation and rate dynamics.
- Gold: Safe-haven demand is evident with gold prices supported ahead of key CPI data, with a potential for further gains if inflation trends dovish.
- S&P 500 Seasonality: August tends to be a weak month for the S&P 500 in post-election years, particularly with an incumbent president, and current technical signals for the index are mixed.
News Conclusion
- Markets are exhibiting mixed signals amid leadership from a few large-cap tech stocks, ongoing volatility in commodities, and heightened sensitivity to upcoming economic data releases.
- Structural concerns, such as rising rates impacting the housing sector and inflation not fully contained by central bank policy, continue to create uncertainty in economic outlooks.
- The near-term market direction is poised for volatility with focus on critical data releases, technical seasonality, and the evolving macro backdrop.
Market News Sentiment:
Market News Articles: 8
- Negative: 62.50%
- Neutral: 25.00%
- Positive: 12.50%
GLD,Gold Articles: 1
- Neutral: 100.00%
USO,Oil Articles: 1
- Negative: 100.00%
Market Data Snapshot
ETF Snapshot of major stock market ETFs, Mag7, and others as of: August 10, 2025 06:15
- AAPL 229.35 Bullish 4.24%
- GOOG 202.09 Bullish 2.44%
- TSLA 329.65 Bullish 2.29%
- NVDA 182.70 Bullish 1.07%
- META 769.30 Bullish 0.98%
- QQQ 574.55 Bullish 0.93%
- SPY 637.18 Bullish 0.78%
- DIA 441.92 Bullish 0.50%
- MSFT 522.04 Bullish 0.23%
- IWM 220.32 Bullish 0.22%
- IJH 62.53 Bearish -0.02%
- GLD 313.05 Bearish -0.02%
- USO 73.30 Bearish -0.16%
- AMZN 222.69 Bearish -0.20%
- TLT 87.29 Bearish -0.43%
- IBIT 66.13 Bearish -1.05%
Higher Time Frame Analysis
Summary of the current state of US Indices Futures based on higher time-frame (HTF) technical analysis as of: 2025-08-10: 18:15 CT.
US Indices Futures
- ES Strong LT/IT uptrend, YSFG/MSFG up, WSFG down, above major MAs, swing high 6468.50, S at 6130.50, mixed ST signals, consolidation below NTZ.
- NQ Strong all-timeframe uptrend, YSFG/MSFG up, WSFG down, above all benchmarks, swing high 23943.00, S at 22586.00, V-shaped tech recovery, trend continuation with no exhaustion.
- YM IT/LT bullish, ST neutral/weak pullback, above YSFG/MSFG NTZ, WSFG down, recent pivot high 44918, S at 42164, consolidating after rally, choppy ST, HTF bias up.
- EMD ST bullish rally, IT/LT bearish, YSFG/MSFG down, WSFG up, swing up to 3258.6, S at 3044.4/2881.1, above key ST MAs, in countertrend rebound amid larger downtrend.
- RTY Mixed, ST neutral/bearish, IT bullish, LT bearish, YSFG/WSFG down, MSFG up, swing test of 2249 resistance, S at 2103, moving averages diverge, corrective within HTF downtrend.
- FDAX Persistent uptrend all timeframes, YSFG/MSFG/WSFG all up, above all MAs, recent pivot high 24749, S at 21819, trend continuation, no major reversal signals present.
Overall State
- Short-Term: Mixed/neutral-to-bullish (NQ/FDAX strong, EMD/RTY bearish, YM/ES consolidating)
- Intermediate-Term: Bullish for ES, NQ, YM, FDAX; Bearish EMD; Neutral RTY
- Long-Term: Bullish ES, NQ, YM, FDAX; Bearish EMD, RTY
Conclusion
US Indices Futures show persistent bullish conditions on higher timeframes (YSFG/MSFG trends up) for ES, NQ, YM, and FDAX, supported by moving average benchmarks and swing pivot progressions. Short-term trends are more mixed, with ES, YM, EMD, and RTY exhibiting consolidation, pullbacks, or countertrend rallies as prices interact with weekly session fib grid (WSFG) levels or NTZs. NQ and FDAX display stronger short- and long-term alignment. EMD and RTY maintain underlying long-term bearish outlines, reflective of prevailing YSFG and moving average trends. Support and resistance levels from recent swing pivots and fib grids set well-defined zones for potential continuation or reversal. Correlations between major indices remain strong on higher timeframes, with technical leadership in NQ and FDAX. Overall, the HTF structure favors ongoing trend continuation for most US indices, contingent on holding established support levels and overcoming current short-term consolidation phases.
Note: Intra-day counter-trend pullbacks or retracements may occur, HTF is context for informational usage and market structure. Glossary: Session Fib Grids periods of YSFG:’Yearly’, MSFG:’Monthly’, WSFG:’Weekly’
For full details visit: AlphaWebTrader Technicals
Tech Weekly View

View weekly charts on: AlphaWebTrader HTF Charts