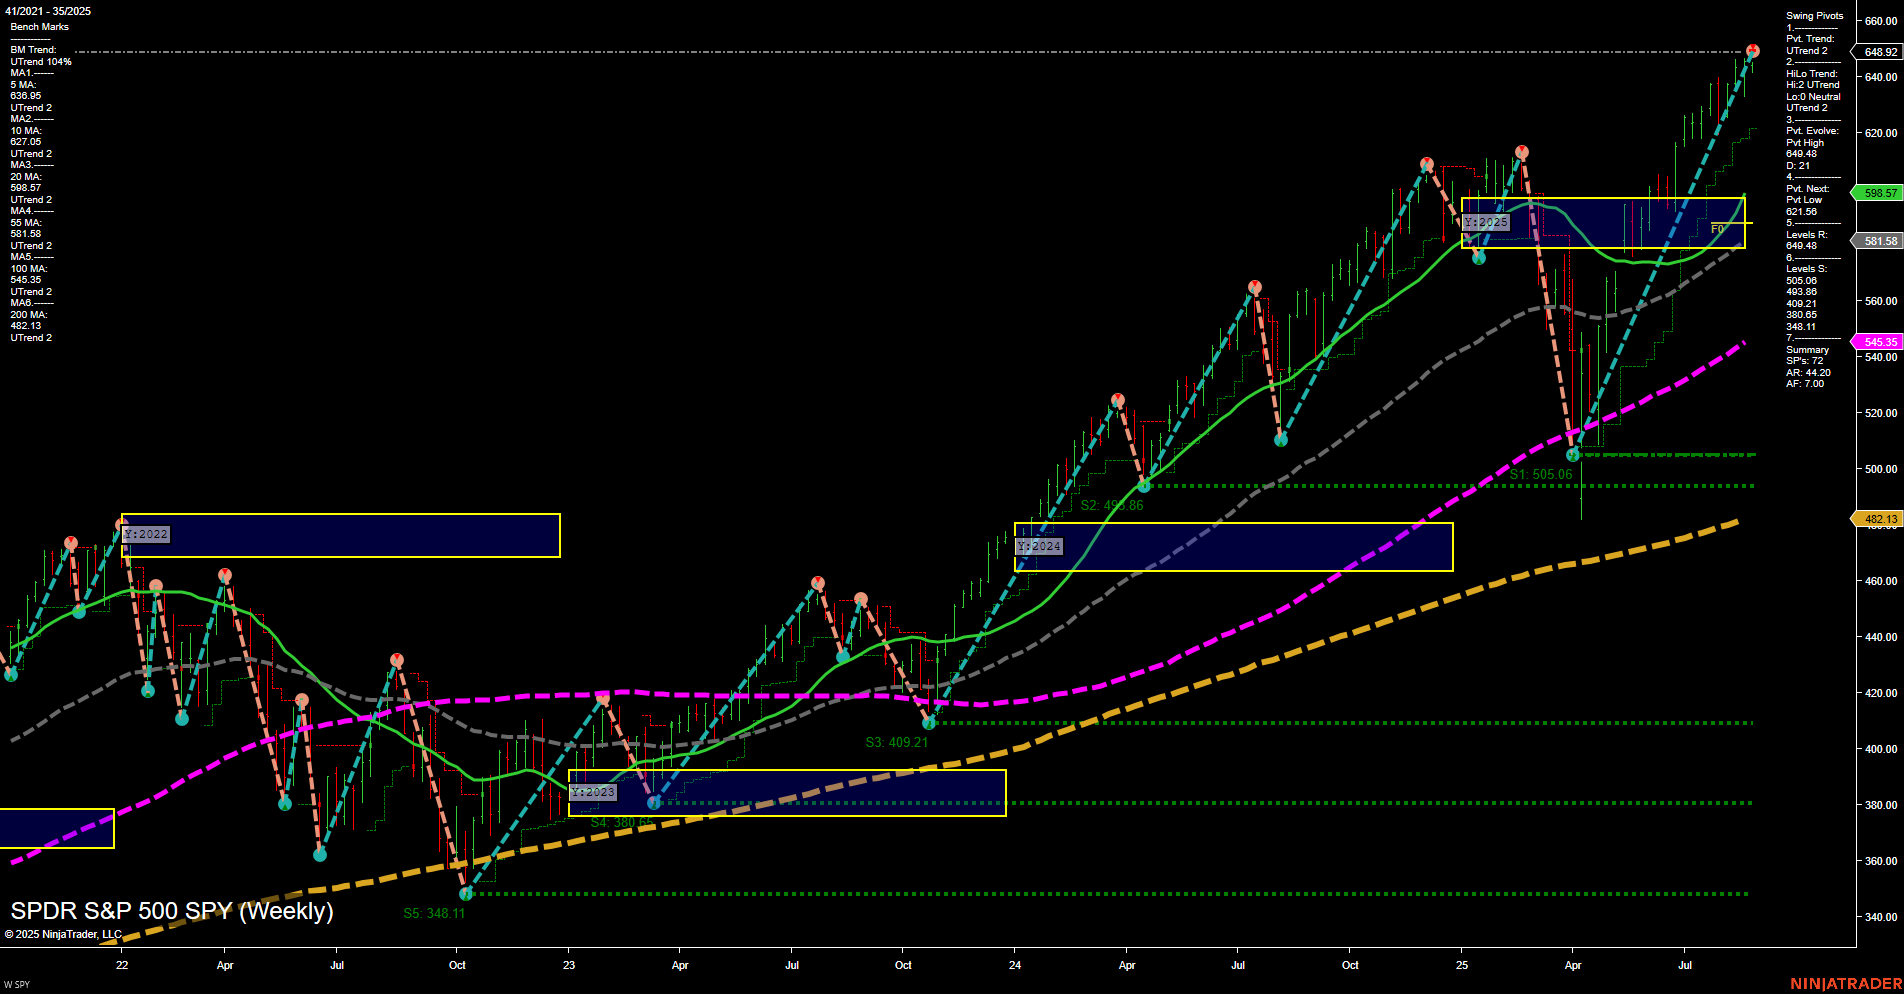
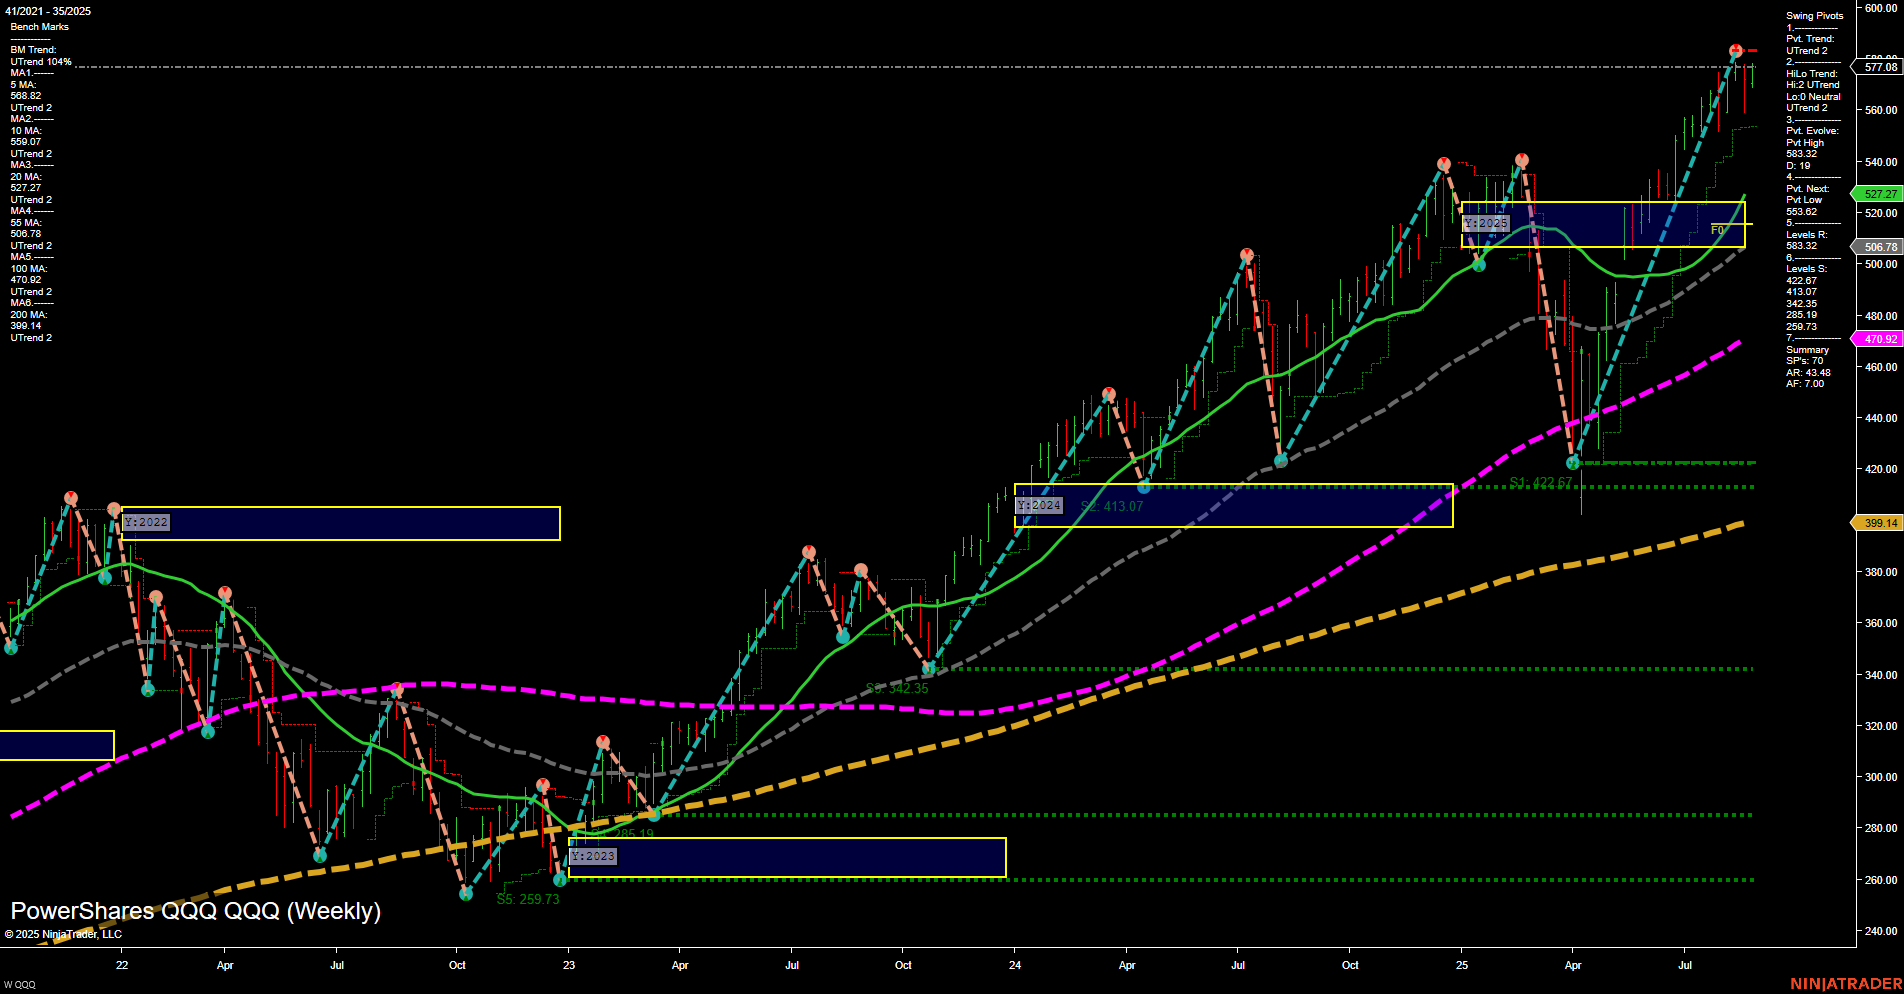
Trading 360° view: Market SPY Weekly view, holidays, earnings, eco-news, market-news summary, news sentiment, and major ETFs, MAG7, Higher Time Frame Analysis Indices Futures Summary, and QQQ Weekly view.
SPY Weekly View

View weekly charts on: AlphaWebTrader HTF Charts
Holiday Radar
- 2025-09-01 Labor Day
Earnings Radar
Monitoring for earnings releases by the Magnificent 7, AI-tech-related firms, and major financial institutions.
No monitored earnings reports are pending in the next 7 days.
For full details visit: Yahoo Earnings Calendar
EcoNews Radar U.S. Events
EcoNews Summary
- Friday 08:30 – USD Core PCE Price Index m/m (High Impact): The Core Personal Consumption Expenditures Price Index is a key gauge of underlying US inflation favored by the Federal Reserve. A higher-than-expected reading would strengthen expectations for continued tightening or delay in rate cuts, potentially pressuring equity index futures lower. A softer figure could support risk assets on hopes for easing policy.
EcoNews Conclusion
- The Core PCE report is a primary market focus and could trigger significant initial volatility in S&P 500, Nasdaq, and Dow futures at the Friday US cash open.
- Market momentum and volume may slow in the days leading up to high-impact releases such as PCE.
- Traders should be alert to the 10 AM time cycle, which often acts as a catalyst for reversals or continuations following major releases.
For full details visit: Forex Factory EcoNews
Market News Summary
- Indices Action: S&P 500 closed above 6,500 for the first time. Market leadership has been supported by strong performance in small-cap stocks and continued institutional interest. However, index futures retreated in premarket trading, giving back Thursday’s gains as the market awaits the PCE inflation data.
- Federal Reserve: Multiple comments from Fed Governor Waller and other sources indicate a growing expectation for policy rate cuts starting as soon as September, with additional cuts likely in the following months. The pace and timing remain data-dependent, specifically hinging on inflation and labor market signals.
- Stocks & Sectors: Increased attention toward healthcare, financials, industrials, and small-caps for the upcoming fall period. The “Magnificent Seven” mega-caps are currently not favored among value-hunters.
- Commodities: Oil pulled back on renewed demand concerns and looming supply surpluses, while holding steady above key moving averages. Gold and silver gained as the dollar weakened on recession fears, though a stronger dollar following U.S. economic data has since capped metals’ advances.
- Tariffs & Trade: Expanded tariffs now extend beyond steel and aluminum to sectors like semiconductors and heavy trucks. The possible removal of the “de minimis” exemption is set to impact Chinese e-commerce players and may support domestic U.S. retailers.
- Europe: German retail sales data disappointed, while French political instability adds to regional uncertainty. These factors continue to weigh on European market sentiment.
- ETF Flows & Themes: Rotations observed from large-cap ETFs towards smaller-cap funds amid shifting rate expectations. ETF strategists highlight opportunities outside the S&P 500 for potential diversification.
- Corporate Highlights: Focus remains on major upcoming earnings, including Dell, Marvell, and Alibaba. Meanwhile, Nike’s retailer popularity slides, adding pressure in consumer discretionary space.
News Conclusion
- Markets are at a key juncture with historic highs, but premarket weakness in futures points to near-term caution ahead of pivotal U.S. inflation data. Rate cut speculation remains a key supportive factor, particularly for sectors sensitive to monetary policy shifts such as small-caps, industrials, and technology.
- Commodity markets are caught between macro headwinds and evolving geopolitical risks, with oil and metals responding dynamically to changes in demand forecasts and currency strength.
- Trade policy developments and political uncertainties—both domestic and abroad—have introduced fresh drivers of volatility, influencing global equity and commodity market flows.
- Investors continue to monitor sector rotation, ETF inflows, and earnings results for signals on sustained leadership as the post-summer trading season approaches.
Market News Sentiment:
Market News Articles: 49
- Positive: 53.06%
- Neutral: 28.57%
- Negative: 18.37%
Sentiment Summary:
Out of 49 market news articles, 53.06% reflect positive sentiment, 28.57% are neutral, and 18.37% are negative.
This indicates a predominantly positive tone in recent market news coverage, with a moderate portion of neutral analysis and a smaller share of negative perspectives.
GLD,Gold Articles: 13
- Positive: 53.85%
- Neutral: 30.77%
- Negative: 15.38%
Sentiment Summary: Recent news coverage on GLD and gold shows a majority positive sentiment, with 53.85% of articles classified as positive, 30.77% as neutral, and 15.38% as negative.
This suggests that the overall tone in the news has been favorable toward GLD and gold, with a significant portion of neutral perspectives and fewer negative reports.
USO,Oil Articles: 8
- Positive: 37.50%
- Negative: 37.50%
- Neutral: 25.00%
Sentiment Summary: Coverage of USO and oil is evenly split between positive (37.5%) and negative (37.5%) sentiment, with the remaining 25% of articles presenting a neutral tone.
This distribution suggests a mixed outlook in the news, indicating both optimism and caution are present in recent oil market reporting.
Market Data Snapshot
ETF Snapshot of major stock market ETFs, Mag7, and others as of: August 29, 2025 07:16
- GOOG 212.37 Bullish 2.00%
- AMZN 231.60 Bullish 1.08%
- AAPL 232.56 Bullish 0.90%
- USO 75.24 Bullish 0.75%
- GLD 315.03 Bullish 0.74%
- TLT 87.22 Bullish 0.66%
- QQQ 577.08 Bullish 0.63%
- MSFT 509.64 Bullish 0.57%
- META 751.11 Bullish 0.50%
- SPY 648.92 Bullish 0.35%
- DIA 456.79 Bullish 0.17%
- IJH 65.51 Bullish 0.12%
- IWM 236.22 Bullish 0.12%
- IBIT 63.58 Bearish -0.11%
- NVDA 180.17 Bearish -0.79%
- TSLA 345.98 Bearish -1.04%
ETF Stocks: Market Summary
- SPY 648.92 Bullish +0.35% – S&P 500 ETF is trading higher, joining a positive day across large caps.
- QQQ 577.08 Bullish +0.63% – Tech-heavy NASDAQ ETF also advancing strongly.
- IWM 236.22 Bullish +0.12% – Small cap ETF posting modest gains, reflecting cautious optimism.
- IJH 65.51 Bullish +0.12% – Mid-caps ETF showing a steady, positive move.
- DIA 456.79 Bullish +0.17% – Dow Jones ETF participating in the broad market strength.
Mag7: Mega Cap Tech Stocks
- GOOG 212.37 Bullish +2.00% – Google leads gains, exhibiting notable relative strength.
- AMZN 231.60 Bullish +1.08% – Amazon rises over 1% in a bullish session.
- AAPL 232.56 Bullish +0.90% – Apple continues higher, contributing to tech outperformance.
- MSFT 509.64 Bullish +0.57% – Microsoft holding gains in line with broader tech momentum.
- META 751.11 Bullish +0.50% – Meta platforms participating in Mag7 gains.
- NVDA 180.17 Bearish -0.79% – Nvidia takes a breather, underperforming its peers.
- TSLA 345.98 Bearish -1.04% – Tesla extends a pullback, standing out as the weakest in the group.
Other Key ETFs
- TLT 87.22 Bullish +0.66% – Long-term Treasury ETF moving up as bond market stabilizes.
- GLD 315.03 Bullish +0.74% – Gold ETF gains on renewed safe-haven demand.
- USO 75.24 Bullish +0.75% – Oil ETF climbs amid energy sector strength.
- IBIT 63.58 Bearish -0.11% – Bitcoin ETF slightly lower, diverging from broader bullish sentiment.
State of Play: Summary
- Bullish Momentum: The majority of major ETFs and Mag7 stocks are positive, signaling broad market strength led by technology and large caps.
- Bears Stand Out: NVDA and TSLA are bucking the trend with notable pullbacks.
- Mixed in Alternatives: Gold, Oil and Treasuries are showing gains, indicating some risk hedging. Bitcoin ETF (IBIT) is the only major ETF lagging today.
For informational/summary usage only. No trading advice provided.
Higher Time Frame Analysis
Summary of the current state of US Indices Futures based on higher time-frame (HTF) technical analysis as of: 2025-08-29: 07:16 CT.
US Indices Futures
- ES Strong bullish across YSFG, MSFG, WSFG; price above all benchmarks; swing pivots in uptrend; support at 6243, resistance at recent high, rally continuation with no major reversal signs.
- NQ Bullish on all session fib grids; price above all MAs and NTZs; swing pivots up, support at 21,050, resistance at 24,003; trend continuation, no reversal signals, recent long signals active.
- YM Short-term neutral, intermediate/long-term bullish; YSFG/MSFG bullish, WSFG down; price above MAs, swing pivots up, support 38,111, resistance 45,878/46,300; consolidating near highs.
- EMD YSFG, MSFG, WSFG bullish; above all benchmarks; pivots up, recent high 3271.5, support 3071.4, resistance 3501.9; trend continuation with higher highs/lows, no immediate reversal/pullback signs.
- RTY Bullish on all session fib grids; above all MAs & NTZs; swing pivots up, resistance 2537.1, support 2204.2; persistent uptrend phase, higher highs/lows, no reversal or consolidation.
- FDAX Short-term bearish/neutral (WSFG down, daily MAs < 20-day), intermediate/long-term bullish (MSFG, YSFG up); price just below key resistance, support 24106, correcting within broader uptrend.
Overall State
- Short-Term: Bullish (ES, NQ, EMD, RTY), Neutral (YM, FDAX), Bearish (FDAX daily)
- Intermediate-Term: Bullish (ES, NQ, YM, EMD, RTY, FDAX)
- Long-Term: Bullish (ES, NQ, YM, EMD, RTY, FDAX)
Conclusion
US Indices Futures broadly remain in sustained uptrends across higher timeframes, supported by bullish YSFG, MSFG, and WSFG patterns, rising benchmark moving averages, and uptrending swing pivots. Key benchmarks (ES, NQ, RTY, EMD) exhibit trend continuation phase with higher highs/lows, most resistance levels recently surpassed or thin, and supports well below. YM consolidates near highs with neutral short-term and bullish medium/long-term readings. FDAX is experiencing a short-term corrective phase within an otherwise intact long-term uptrend. Technicals indicate a prevailing upward market structure with moderate volatility and volume, and current price action remains above most session Fib center levels, providing ongoing support on higher timeframes. Instrument correlations confirm persistent risk-on momentum, with FDAX lagging short term but maintaining supportive structure overall.
Note: Intra-day counter-trend pullbacks or retracements may occur, HTF is context for informational usage and market structure. Glossary: Session Fib Grids periods of YSFG:’Yearly’, MSFG:’Monthly’, WSFG:’Weekly’
For full details visit: AlphaWebTrader Technicals
Tech Weekly View

View weekly charts on: AlphaWebTrader HTF Charts