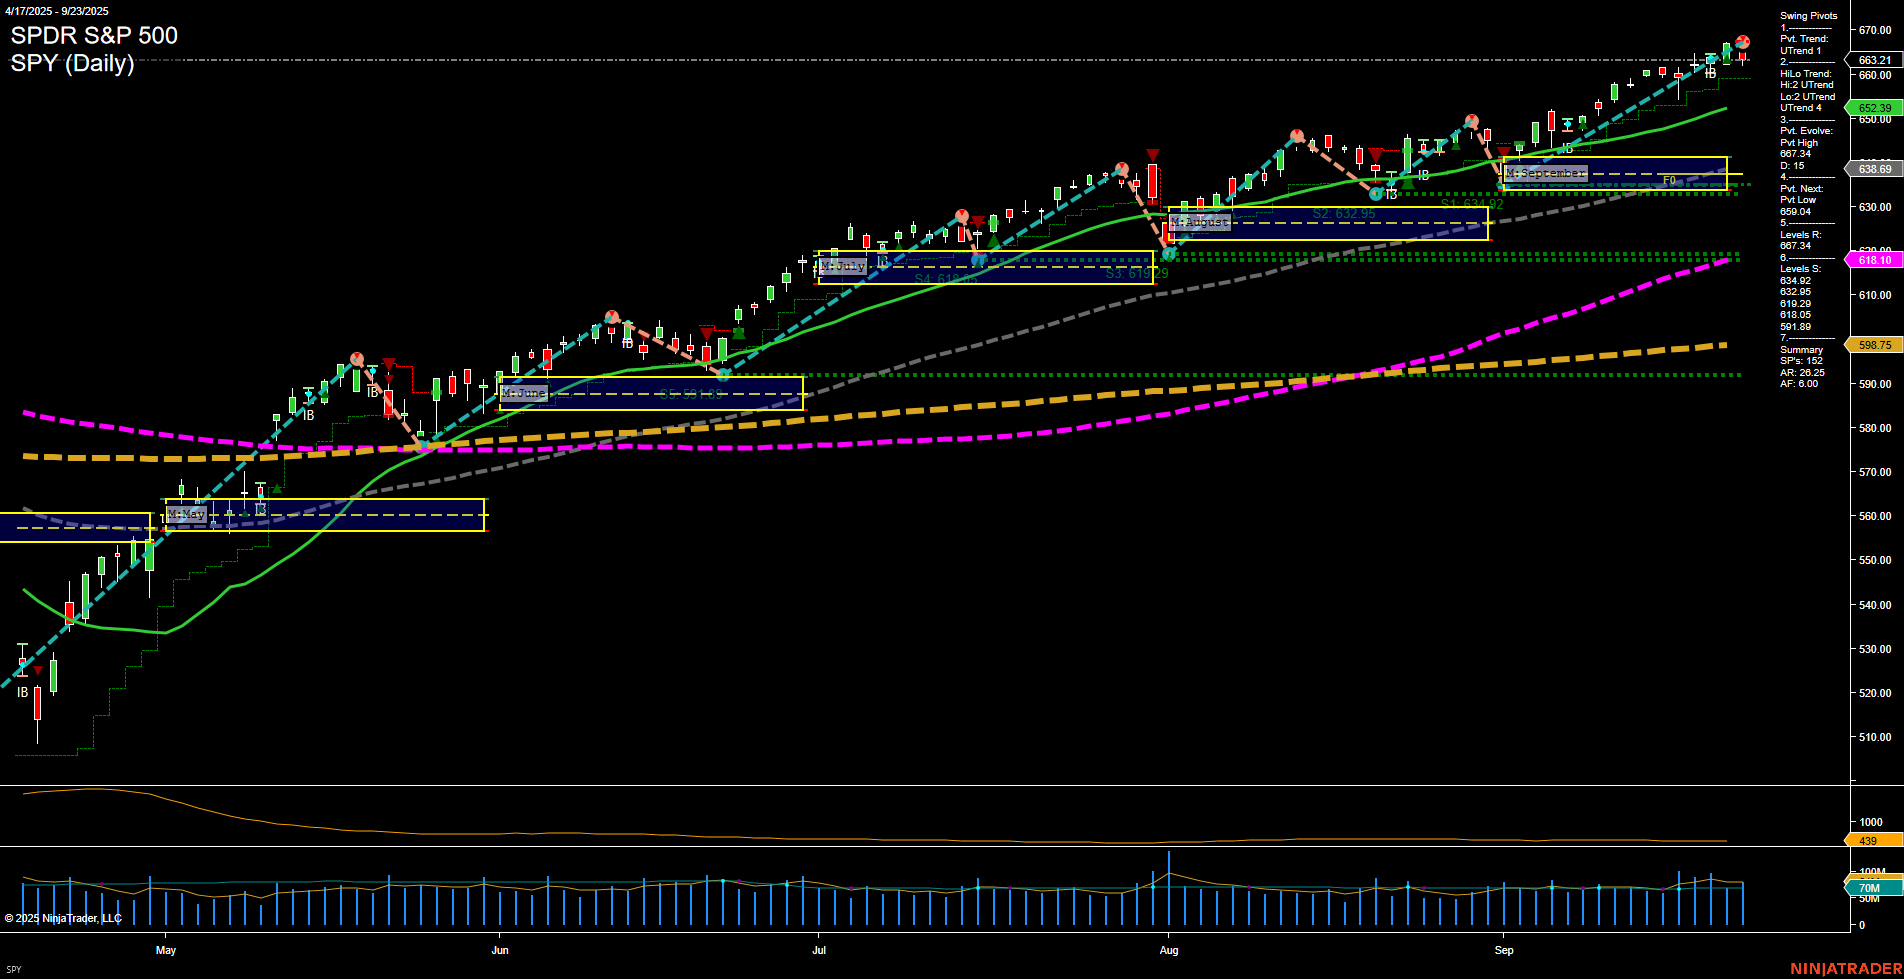
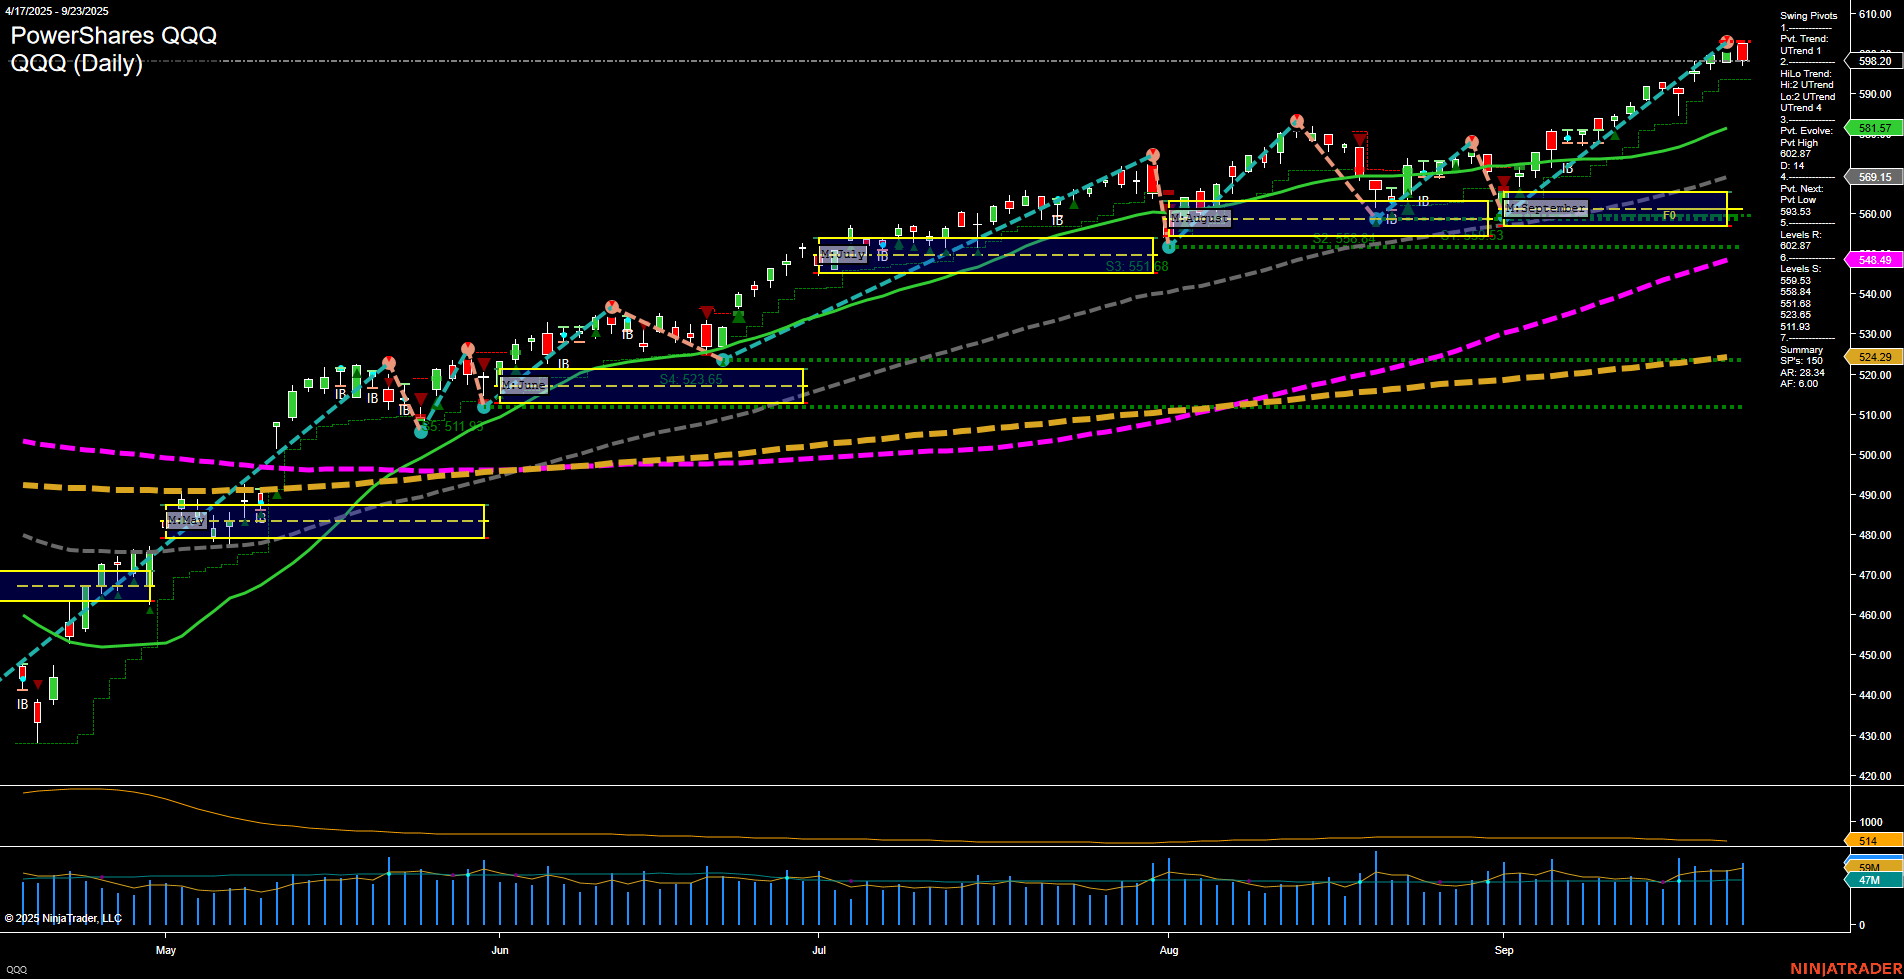
After Market Close S&P 500 daily snapshot: news summary & sentiment, major ETFs, Magnificent 7 analysis, and QQQ daily view.
SPY Daily View

View weekly charts on: AlphaWebTrader HTF Charts
Market News Summary
- Gold and Commodities: Gold remains in a volatile uptrend, with bullish forecasts citing ongoing central bank demand and operational leverage in gold mining companies. Some analysts project $4,000 gold as a real possibility, but profit-taking and weakening jewelry demand could slow momentum. Bearish divergences and technical pullbacks are emerging as gold tests key support zones.
- Federal Reserve & Policy Outlook: Fed Chair Powell’s remarks that stocks are “fairly highly valued” have fueled market caution. Calls for deep Fed rate cuts are seen as unlikely given the FOMC’s data dependence. Historical patterns suggest that markets trading near record highs after Fed rate cuts generally fare well, but current valuation concerns are front and center.
- Equities & Indices: Despite S&P 500 and Nasdaq 100 rebounding sharply in recent sessions, greed and unsustainable valuations, particularly in momentum and meme stocks, are raising red flags. Major financial institutions—Deutsche Bank among them—have raised S&P 500 targets, expressing continued bullishness. However, multiple negative signals point to increased correction risk, with institutional “smart money” reported to be scaling back and seasonal research indicating a strong chance of a 5%+ pullback in the weeks ahead.
- AI and Technology: Tech stocks have posted back-to-back declines, partly due to growing concerns about the costs associated with artificial intelligence. Enthusiasm remains regarding the sector’s longer-term growth, with some voices advocating for continued engagement, especially in AI-driven names. However, concentration risk in mega-cap AI stocks is creating underlying market fragility.
- Sector Rotation & Thematic Trends: Flows are favoring banks, industrials, semiconductors, high-yield credit, and income assets like real estate and dividend growth vehicles, while caution persists around consumer discretionary. ETF strategies and growth-focused funds remain popular, especially with expectations for a potentially explosive Q4.
- Market Sentiment: The market rally, powered by AI and growth themes, is showing signs of cooling. All three major indexes have fallen together for two consecutive days—the first time this has occurred in September—prompting debates on whether “froth” and “irrational exuberance” are returning to Wall Street. Historic analogies to the Dotcom Bubble are resurfacing in investor discussions.
News Conclusion
- Signals of a maturing rally and elevated valuations are growing, with both technical and institutional activity supporting a potential period of consolidation or correction.
- Gold is in focus as a hedge and potential outperformer, but faces near-term technical resistance and profit-taking pressure, even as the case for longer-term accumulation persists.
- Policy outlook is mixed; while some strategists point to reflation rather than inflation, rate cut expectations are creating tailwinds for select equity and credit segments.
- Overall, the prevailing environment is defined by sector rotation, decelerating momentum in big tech, and increasing caution from both seasonal and valuation perspectives.
Market News Sentiment:
Market News Articles: 41
- Positive: 39.02%
- Negative: 36.59%
- Neutral: 24.39%
GLD,Gold Articles: 18
- Neutral: 50.00%
- Positive: 38.89%
- Negative: 11.11%
USO,Oil Articles: 6
- Positive: 50.00%
- Neutral: 33.33%
- Negative: 16.67%
Market Data Snapshot
ETF Snapshot of major stock market ETFs, Mag7, and others as of: September 24, 2025 05:00
- TSLA 442.79 Bullish 3.98%
- USO 76.39 Bullish 1.79%
- IBIT 64.42 Bullish 1.59%
- META 760.66 Bullish 0.70%
- MSFT 510.15 Bullish 0.18%
- AMZN 220.21 Bearish -0.23%
- SPY 661.10 Bearish -0.32%
- QQQ 596.10 Bearish -0.35%
- TLT 88.98 Bearish -0.38%
- DIA 461.02 Bearish -0.40%
- IJH 65.04 Bearish -0.75%
- NVDA 176.97 Bearish -0.82%
- AAPL 252.31 Bearish -0.83%
- GLD 343.32 Bearish -0.91%
- IWM 241.60 Bearish -0.92%
- GOOG 247.83 Bearish -1.79%
Market Summary: ETFs, Mag7, and Key Asset Flows (as of 09/24/2025)
ETF Stocks Overview
- SPY 661.10 Bears in control (-0.32%) – S&P 500 ETF shows mild selling pressure.
- QQQ 596.10 Bears in control (-0.35%) – Mega-cap tech tracker slips further.
- IWM 241.60 Bears in control (-0.92%) – Small caps lag, signaling risk-off sentiment.
- IJH 65.04 Bears in control (-0.75%) – Midcap ETF declines, underscoring broader market weakness.
- DIA 461.02 Bears in control (-0.40%) – Dow proxy trends down with blue chips.
Mag7 Stocks Snapshot
- TSLA 442.79 Bullish (+3.98%) – Strong upward momentum, notable outperformer among peers.
- META 760.66 Bullish (+0.70%) – Minor gain, holding up in a soft market.
- MSFT 510.15 Bullish (+0.18%) – Firm, defying the broader softness.
- AMZN 220.21 Bearish (-0.23%) – Slightly negative, underperforming versus key peers.
- NVDA 176.97 Bearish (-0.82%) – Pullback continues, weighing on sentiment.
- AAPL 252.31 Bearish (-0.83%) – Selling pressure persists.
- GOOG 247.83 Bearish (-1.79%) – Largest Mag7 decliner in the current session.
Other Major ETFs and Assets
- TLT 88.98 Bearish (-0.38%) – Long-dated Treasuries slip, yields higher.
- GLD 343.32 Bearish (-0.91%) – Gold ETF weakens, further retreat from recent highs.
- USO 76.39 Bullish (+1.79%) – Oil ETF continues higher, bucking the broader trend.
- IBIT 64.42 Bullish (+1.59%) – Bitcoin ETF finds renewed strength amid volatility.
Market State of Play
Overall, the market snapshot tilts bearish across broad equity indexes and most Mag7 names, with only a handful of tech giants (notably TSLA, META, MSFT) showing relative strength. Small- and mid-cap ETFs are under the most pressure. Energy and digital asset ETFs (USO, IBIT) diverge positively from the overall negative tone, while safe-haven plays like TLT and GLD are also under pressure. Profit-taking or risk-off dynamics are apparent, with select growth stocks and alternative assets as the session’s outperformers.
Tech Daily View

View weekly charts on: AlphaWebTrader HTF Charts