
Review the NYSE close and bearish technical signals in the September 07, 2026 market roundup, focusing on index price action and trend conditions.
Fundamentals: This market roundup reviews the NYSE close through a technical lens, highlighting bearish chart conditions, broader price action and trend signals associated with the session. It offers a concise overview of the closing market backdrop and the technical indicators used to frame the discussion, without making assumptions about future market direction.
Technicals: ETF performance was mixed, with gains in Meta, Nvidia and small caps offset by declines in Tesla, Apple and IBIT. Futures analysis showed bullish intermediate- and long-term structures across several major indexes, while near-term trading remained uneven. Dow, DAX and emerging-market contracts reflected corrective pressure, while Nasdaq and Russell 2000 held firmer short-term trends.
After Market Close daily snapshot: market news summary and sentiment, major ETFs, Magnificent 7 analysis, Indices Futures Higher Time Frame Analysis, and E-mini S&P500, Nasdaq 100, NYMEX Crude, Gold Futures Daily Chart analysis.
As of: September 7, 2026 07:00 CT
Market News Sentiment
Sentiment Summary: No sentiment-scored market news items were recorded in the last 24 hours, leaving no measurable news-driven tone for index futures.
Conclusion: Index futures day traders have no current sentiment dataset from this snapshot to assess.
No news items with sentiment found in the last 24 hours.
Sentiment Summary: No news items with measurable sentiment were identified in the last 24 hours, leaving no aggregate sentiment reading for indices futures.
Conclusion: The available snapshot provides no news-based sentiment signal for indices futures day traders.
No news items with sentiment found in the last 24 hours.
Sentiment Summary: No sentiment-scored market news items were identified in the last 24 hours, leaving no measurable news-based tone for index futures.
Conclusion: News sentiment data is unavailable for the current period; no positive, negative, or neutral distribution can be reported.
Market Data Snapshot
ETF Snapshot of major stock market ETFs, Mag7, and others as of: September 7, 2026 07:00
Top Movers & Losers
- META 616.77 Bullish 1.00% ▲
- NVDA 230.36 Bullish 0.84% ▲
- IWM 296.01 Bullish 0.28% ▲
- IBIT 45.23 Bearish -2.42% ▼
- AAPL 319.97 Bearish -2.51% ▼
- TSLA 354.08 Bearish -5.92% ▼
Major Index ETFs: SPY, QQQ, DIA, IWM, IJH
- IWM 296.01 Bullish 0.28% ▲
- QQQ 718.96 Bullish 0.18% ▲
- IJH 75.85 Bullish 0.13% ▲
- SPY 770.19 Bearish -0.39% ▼
- DIA 534.08 Bearish -0.53% ▼
Mixed index ETF snapshot: IWM is the most bullish mover at +0.28%, followed by QQQ at +0.18% and IJH at +0.13%. SPY is Bearish at -0.39%, while DIA is the most bearish mover at -0.53%, highlighting divergence between smaller-cap strength and large-cap index pressure.
Mag 7 Stocks: AAPL, MSFT, GOOG, AMZN, META, NVDA, TSLA
- META 616.77 Bullish 1.00% ▲
- NVDA 230.36 Bullish 0.84% ▲
- AMZN 258.51 Bearish -0.15% ▼
- GOOG 335.31 Bearish -1.11% ▼
- MSFT 499.70 Bearish -2.04% ▼
- AAPL 319.97 Bearish -2.51% ▼
- TSLA 354.08 Bearish -5.92% ▼
Mixed: META is the most bullish mover at +1.00%, followed by NVDA at +0.84%. TSLA is the most bearish mover at -5.92%, with AAPL -2.51% and MSFT -2.04% also bearish; AMZN is marginally bearish at -0.15% and GOOG is bearish at -1.11%.
Cross-Market ETFs: TLT, GLD, USO, IBIT
- TLT 82.21 Bullish 0.17% ▲
- USO 141.96 Bearish -0.09% ▼
- GLD 406.77 Bearish -0.84% ▼
- IBIT 45.23 Bearish -2.42% ▼
Other ETFs were Mixed: TLT was the most bullish mover at +0.17%, while IBIT was the most bearish mover at -2.42%. GLD declined -0.84%, and USO was marginally Bearish at -0.09%.
ETF, Mag7, and Cross-Market ETF Insights
Overall Tone
Mixed, with selective Bullish participation in growth and smaller-cap ETFs offset by Bearish weakness in several major equity leaders and cross-market hedges.
Equity ETFs and Mag7:
Major Index ETFs were Mixed: IWM led at +0.28%, followed by QQQ at +0.18% and IJH at +0.13%, while SPY fell -0.39% and DIA declined -0.53%. Mag7 performance was selective, led by META at +1.00%, the most bullish mover, and NVDA at +0.84%; TSLA was the most bearish mover at -5.92%, with AAPL down -2.51% and MSFT down -2.04%. Equity participation was therefore Mixed rather than broadly aligned.
Cross-Market ETFs:
Cross-market ETFs were Mixed, with TLT marginally Bullish at +0.17%, the most bullish mover in the group. USO was near-flat and Bearish at -0.09%, while GLD declined -0.84% and IBIT was the most bearish mover at -2.42%. The weakness in GLD and IBIT diverged from the limited Bullish movement in TLT.
Futures Indices – Higher Time Frame Analysis
Summary of the current state of US Indices Futures based on higher time-frame (HTF) technical analysis as of: 2026-09-07: 19:00 CT.
US Indices Futures
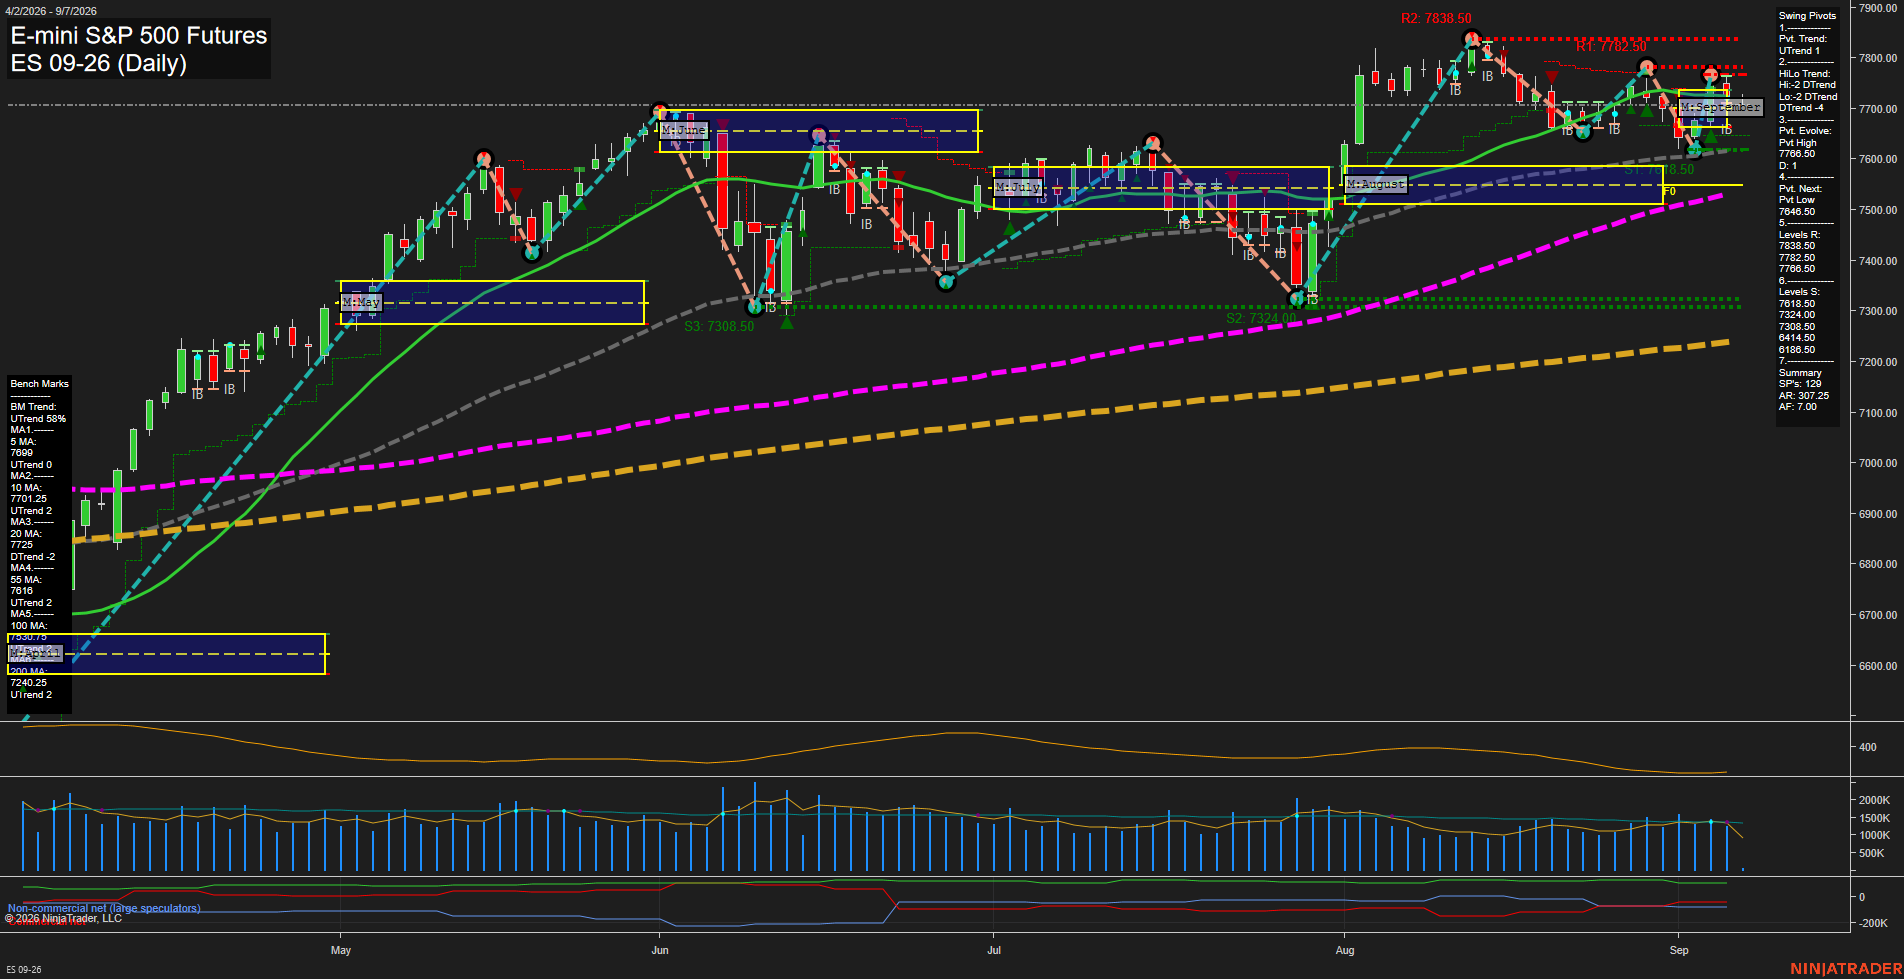
- ES YSFG/MSFG constructive, WSFG down, above rising 10-200 benchmarks; UTrend pivots, 7477 support, 7838.50 resistance.
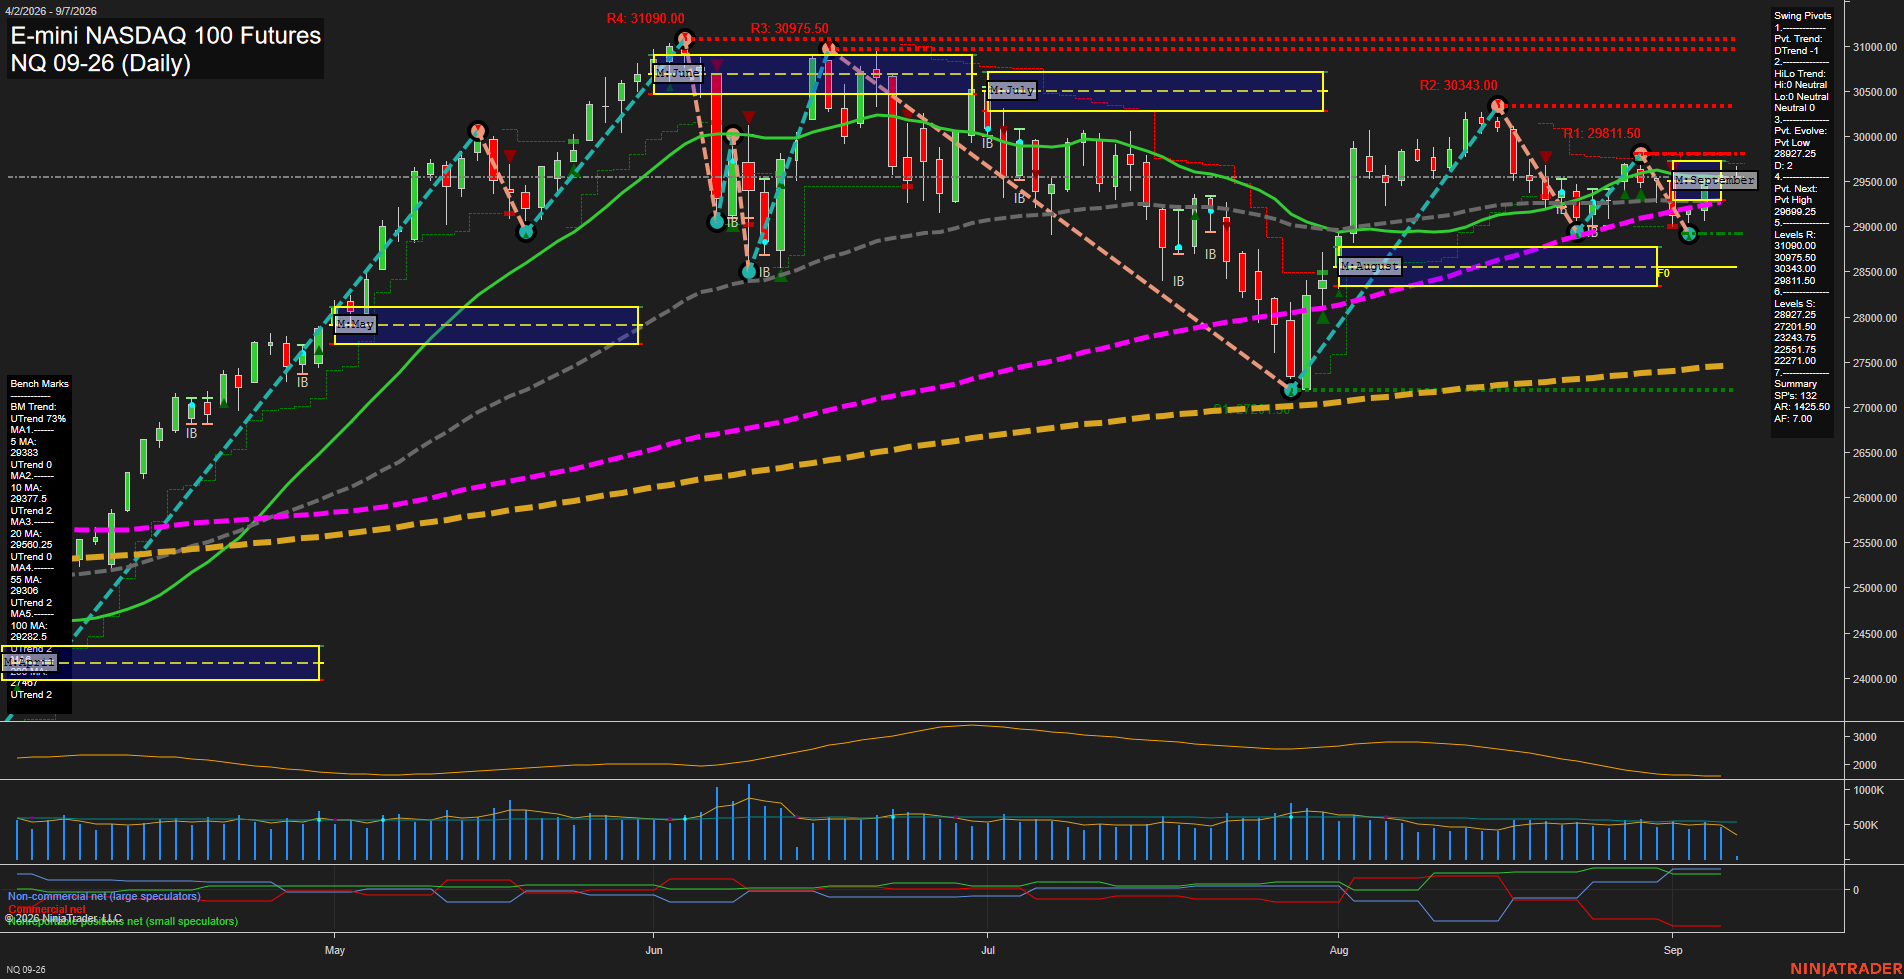
- NQ YSFG/MSFG/WSFG up, above rising benchmarks; UTrend recovery, 29347-29445.75 support, 30343-30390 and 31090 resistance.
- YM YSFG up, MSFG/WSFG down, above rising 20-200 benchmarks; pullback structure, 52548/52059 support, 54884 resistance.
- EMD YSFG/MSFG up, WSFG down, above rising 20-200 benchmarks; DTrend, 3713.8 support, 3916-3941.7 resistance.
- RTY YSFG/MSFG up, WSFG down, above rising 20-200 benchmarks; consolidation, 2904.9 support, 3079.9 resistance.
- FDAX YSFG up, MSFG/WSFG down, above rising long-term benchmarks; corrective DTrend, 25225-25336 support, 26665 resistance.
Overall State
- Short-Term: Neutral
- Intermediate-Term: Bullish
- Long-Term: Bullish
Conclusion
Higher-timeframe structure remains broadly bullish, led by NQ and supported by ES and RTY above rising benchmark averages and yearly/monthly grid centers. YM, EMD, and FDAX retain longer-term upward benchmark alignment while weekly and monthly grid weakness reflects active pullbacks. Key pivot resistance remains at ES 7838.50, NQ 30343-31090, YM 54884, EMD 3941.7, RTY 3079.9, and FDAX 26665.
Note: Intra-day counter-trend pullbacks or retracements may occur, HTF is context for informational usage and market structure. Glossary: Session Fib Grids periods of YSFG:’Yearly’, MSFG:’Monthly’, WSFG:’Weekly’
For full details visit: AlphaWebTrader Technicals
ES Daily View
View charts on: AlphaWebTrader HTF Charts
NQ Daily View
Overall Rating
- Short-Term: Bullish
- Intermediate-Term: Bullish
- Long-Term: Bullish.
Key Insights Summary
Price is consolidating above the rising 5, 10, 55, 100, and 200-day benchmarks, while holding marginally above the 20-day average and the September MSFG F0% area. The larger structure remains an advancing recovery from the August low, with higher support established at 28927.25; however, the active short-term pivot remains DTrend following rejection beneath the 29811.50 to 30343.00 resistance zone. Small daily bars and moderating momentum reflect a tight, rotational phase rather than an impulsive breakout. The bullish weekly, monthly, and yearly Fib-grid alignment maintains the broader upward trend theme, while 29809.25 is the pivot reversal level that would restore a short-term higher-high sequence.
View charts on: AlphaWebTrader HTF Charts
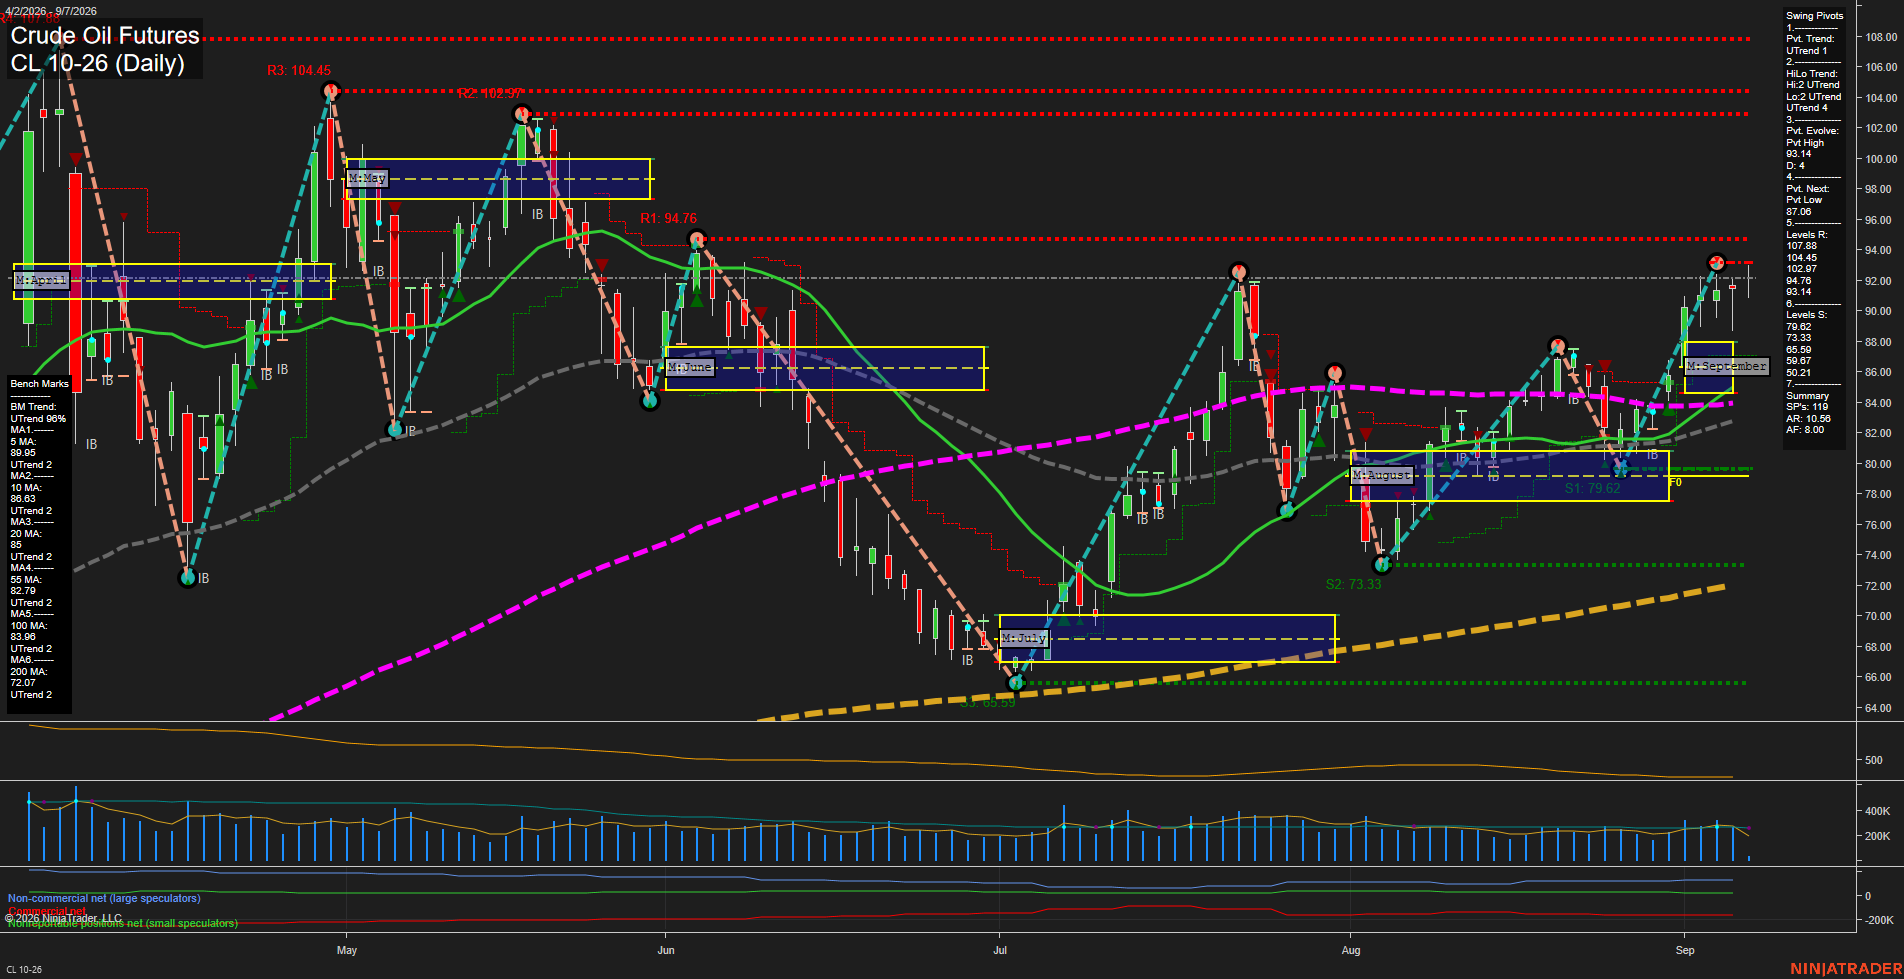
CL Daily View
Overall Rating
- Short-Term: Bullish
- Intermediate-Term: Bullish
- Long-Term: Bullish.
Key Insights Summary
Price has extended sharply from the August 73.33 swing low into a higher-high, higher-low advance and is holding above every benchmark moving average. The short-term pivot structure remains upward, although the 93.14 pivot high is the immediate overhead resistance and recent smaller bars indicate consolidation following the fast rally. The monthly and yearly Fib-grid themes remain positive, while the weekly grid is neutral. The 87.06 pivot-next level defines the nearest structural retracement reference, with 79.62 as the major lower swing support.
View charts on: AlphaWebTrader HTF Charts
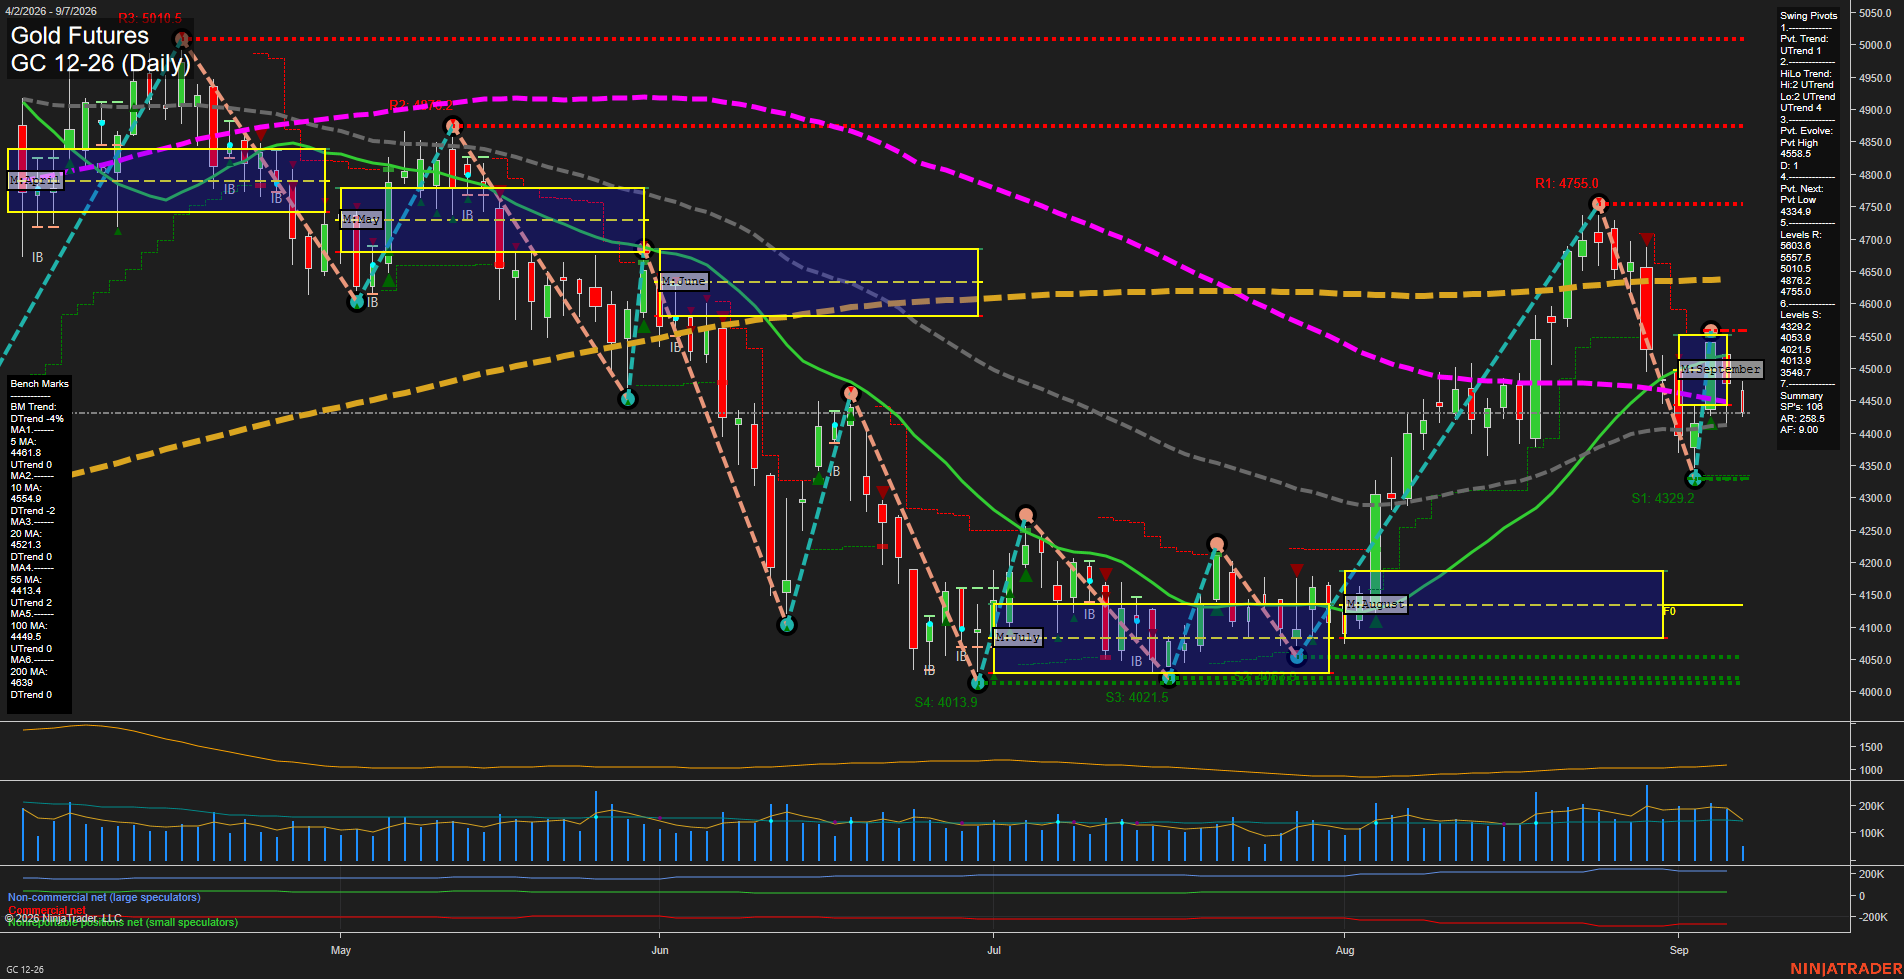
GC Daily View
Overall Rating
- Short-Term: Bearish
- Intermediate-Term: Neutral
- Long-Term: Bearish.
Key Insights Summary
GC is rebounding from the 4329.2 swing-low support after a sharp rejection from 4755.0, but price remains below the weekly and monthly F0% areas and below the declining 10-day and 20-day benchmarks. The short-term pivot structure remains in UTrend, yet the evolving pivot high at 4511.8 defines the immediate recovery ceiling, with the 4554.9 to 4755.0 region forming layered overhead resistance. Intermediate structure is mixed because the HiLo trend and 55-day average remain positive while the monthly grid remains down. The longer-term backdrop remains pressured by price below the yearly grid and declining 200-day benchmark, reflecting a broad corrective phase rather than a confirmed major-trend recovery.
View charts on: AlphaWebTrader HTF Charts